drag/weight reduction using split-tip winglet for tra2012a
TRANSCRIPT

Drag/Weight Reduction Using Split-Tip Winglet for TRA2012A Model*
Soichiro TABATA,1)† Wataru YAMAZAKI,1) and Tatsunori YUHARA2)
1)Department of Science of Technology Innovation, Nagaoka University of Technology, Nagaoka, Niigata 940–2188, Japan2)Japan Aerospace Exploration Agency (JAXA), Mitaka, Tokyo 181–0015, Japan
In this paper, we describe shape optimization of a split-tip winglet (STW) model for the TRA2012A commercial jetaircraft model. The STW configuration is expressed by attaching a small wing under the main winglet. The onboard fuelweight, main wing structure weight and the sum of these weights are objective functions, and are minimized respectivelyin a fixed aircraft operating range for the present optimization. The onboard fuel weight and main wing structure weight arerespectively estimated from the aerodynamic drag obtained using computational fluid dynamics simulations and from anestimation formula based on aerodynamic force acting on the main wing. A Kriging response surface model approach isused as the optimization method. Finally, non-dominated optimal designs obtained using this optimization method are in-vestigated in detail based on the variation in aerodynamic drag and the main wing structure weight. In the STW designhaving minimum total weight, a reduction in onboard fuel weight and increase in main wing structure weight are observed,and it is found that the reduction in onboard fuel weight per unit volume of STW is the largest.
Key Words: Split-Tip Winglet, Multi-Disciplinary Optimization, Computational Fluid Dynamics
1. Introduction
Aircraft are widespread in the world as means of transport-ing people and goods. Passenger demand growth is approx-imately 5% per year on average worldwide, and energy is-sues such as global warming and the depletion of fossilfuels are drawing worldwide attention. Accordingly, improv-ing the fuel efficiency of aircraft is required. In order to dothis, comprehensive improvements such as reducing theaerodynamic drag acting on the aircraft, reducing aircraftweight and improving engine efficiency are required. A dragreduction of 1% can lead to reducing a direct operational costof approximately 0.2% for a large-sized aircraft, which corre-sponds to 1.6 tons in terms of operating empty weight or 10passengers.1) Therefore, it is very important to reduce theaerodynamic drag of aircraft when considering aerodynamicdesign. The Japan Aerospace Exploration Agency (JAXA)has been performing R&D for an environment-consciousaircraft technology named “Eco-Wing” since 2013.2) Thesingle-aisle aircraft was defined by JAXA as a technologyreference aircraft, TRA2012A.3)
Aerodynamic drag can be physically decomposed intowave, profile and induced drag components. The induceddrag is a component due to wingtip vortices that cannot beavoided when the aircraft is generating lift force. Reducingthe induced drag is required because it accounts for about25% when cruising and about 60% during takeoff and climb4)
among the total aerodynamic drag of the aircraft. It is knownthat the induced drag is inversely proportional to the radius ofthe vortex core and the distance between the vortices. The ra-dius and distance can be increased by attaching wingtip de-
vices and then, the induced drag can be decreased.5) Wingletsare known as one of the methods to reduce the induced drag.Winglets are highly cost effective and widely used in com-mercial aircraft because the size is small and can generallyreduce aerodynamic drag approximately 4–5%. Varioustypes of winglets, such as blended-winglet,6) split-tip winglet(STW)7) and multi-winglet,8) have been developed so far.Examples of these winglets are shown in Fig. 1, in whichthe STW and multi-winglet have two or more small wingsaround the wingtip. Optimal designs of the STW and ofthe multi-winglet have achieved greater reductions in aero-dynamic drag than optimized blended-winglet configura-tions.8,9)
It is important to consider both the main wing aerodynam-ics and structure when designing aircraft. An elliptic loaddistribution minimizes the induced drag. On the other hand,it has been reported that a bell-shaped load distribution is bet-ter than the elliptic distributions when aerodynamics andstructural mechanics are considered simultaneously.10)
Although winglets reduce the induced drag, they also yieldan increase in the bending moment of the main wing, andthen the wing structure weight increases as a result of rein-forcing the main wing. Therefore, a multi-disciplinary ap-proach that considers not only aerodynamic drag, but alsothe weight penalty caused by increasing the wing structureweight is important for a realistic winglet design. Regardingblended-winglets, not only aerodynamic performance ob-
Fig. 1. Various winglets, blended winglet (left), STW (center) and multi-winglet (right).8)
© 2020 The Japan Society for Aeronautical and Space Sciences+Received 2 October 2018; final revision received 3 November 2019;accepted for publication 15 November 2019.†Corresponding author, [email protected]
Trans. Japan Soc. Aero. Space Sci.Vol. 63, No. 3, pp. 69–79, 2020DOI: 10.2322/tjsass.63.69
69

tained by computer fluid dynamics (CFD) simulations, butalso the wing structure weight calculated based on the infor-mation of force distributions on the main wing have beenevaluated and discussed.11,12) On the other hand, researchfocused only on aerodynamic performance have been con-ducted for the STW and multi-winglet,8,9) while the weightpenalties due to the winglets have not been discussed. Theflow field around the STW and force distribution on the mainwing are considered to be more complex than that ofblended-winglets. Therefore, it is important to obtain knowl-edge with respect to the complex flow field, force distribu-tions, and STW weight penalty for the practical applicationof advanced winglets, and this will be important for ad-vanced aircraft development.
In this paper, we focus on a STW, which is obtained byattaching a small wing under a conventional blended-winglet. The objective of this paper is to investigate optimalSTW designs for minimizing aircraft total weight, which isdefined by the sum of fuel weight and wing structure weight.The present optimization is achieved by attaching the STWon the tip of the main wing of the TRA2012A aircraft afterconsidering the penalty of wing structure weight. Then, themechanisms of aerodynamic drag reduction and weight pen-alty of the STW are investigated.
2. Technology Reference Aircraft TRA2012A
In this study, the TRA2012A model is used as the baselineaircraft, shown in Fig. 2. In order to evaluate the effective-ness of technologies for reducing fuel consumption, theTRA2012A was conceptually designed as a 120-passengerclass aircraft whose performance is equivalent to that ofstate-of-the-art aircraft. Its basic layout was designed refer-ring the Airbus A319 and A320 configurations. Its sectionairfoil shape was designed using a genetic algorithm (GA)to minimize the aerodynamic drag under design conditions(cruise altitude¼ 35,000 [ft], cruising Mach number¼ 0.78),keeping the same thickness ratio as that of the A320. Thetwist angle distribution of the main wing was also optimizedto achieve an elliptical load distribution. It has been reportedthat the elliptical load distribution was not the best for theTRA2012A when aerodynamics and structural mechanicswere considered simultaneously.3) Therefore, in the presentoptimization considering both aerodynamics and structureof the main wing, there is room for improvement by attach-ing STW on the TRA2012A model. In this study, it is esti-mated that the fuel weight consumed by the TRA2012Awhile cruising is 17,200 [kg], and this is used as the referenceweight.13) Each weight information of the TRA2012A issummarized in Table 1. In this research, nacelle, pylon andtail wings are eliminated to simplify the CFD model.
3. Computational Methodologies
3.1. CFD approachThree-dimensional transonic viscous flows are analyzed
using a CFD solver code of Tohoku University Aerodynamic
Simulation (TAS).14,15) The TAS code is an unstructuredmesh CFD solver based on a finite-volume cell-vertexscheme. Unstructured meshes are generated by Mixed-Element Grid Generator in 3 Dimensions (MEGG3D).16)
Governing equations are compressible Reynolds-averagedNavier-Stokes equations. The LU-SGS implicit method forunstructured meshes17) is used for time integration. The tur-bulence model utilized is the SA-noft2-R (Crot ¼ 1).18) Thevalidity of the SA-noft2-R (Crot ¼ 1) model for transonicconventional aircraft configurations has been demonstratedin Yamamoto et al.15) and Vassberg et al.19)
3.2. Estimation of fuel weightThe variation in onboard fuel weight �WF due to the
change in the aerodynamic drag is estimated using the fol-lowing simple formula,
�WF ¼ WF
CD base��CD ð1Þ
where, WF; CD base and �CD are respectively the referencefuel weight, aerodynamic drag coefficient of the TRA2012Awithout STW and the variation in aerodynamic drag coeffi-cient due to modifying the winglet shape.3.3. Estimation of wing structure weight
In this study, an analytical approach is used to estimate thewing structure weight from the distribution of fluid force onthe main wing.20) The wing structure weight is calculatedusing a design load set to 3.75 times the load when cruising(limit load 2.5� safety factor 1.5). The wing structure of theTRA2012A is shown in Fig. 3, where CSR ¼ 2:63 [m] is thechord length of the carry-through. bS ¼ 15:68 [m] is a wingstructural semi-span length, which is defined through thecenter of each wing box from the fuselage to the 95%semi-span section. The structural strength required for themain wing is estimated from shear force and bending mo-ment acting on the wing box structure and the carry-throughstructure, and from torque acting on the carry-through struc-ture. Then, the main wing structure weight can be estimatedanalytically. The bending moment, shear force and torque
Fig. 2. Three-directional view of the TRA2012A model.13)
Table 1. Weight of TRA2012A model.
Maximum takeoff weight 74,185 [kg]Fuel weight 21,600 [kg]Cruise fuel weight 17,200 [kg]Main wing weight 7,501 [kg]
Trans. Japan Soc. Aero. Space Sci., Vol. 63, No. 3, 2020
70©2020 JSASS

acting on the wing are given from the CFD results in thisstudy.
When the wing box is divided into N along the spanwisedirection, the bending moment weight per unit semi-spanlength W 0
BEND in each segment of the wing box structure iscalculated using the following formula,
W 0BEND ¼ "
M
ZSt2E
!e�ZSt ð2Þ
where, "; e; M; ZS; t; E and µ are respectively shell buck-ling efficiency, buckling index of wing, bending moment act-ing on this segment, wing box width, wing box height,Young’s modulus and structural material density. "; e; Eand � are constants determined from the outer wrapping ofthe main wing and the web structure as " ¼ 2:21 [—],e ¼ 0:556 [—], E ¼ 69:0 [GPa], and � ¼ 2:8� 103
[kg/m3]. The rotation center ofM is at the center of the wingbox in the x-axis direction. The shear force weight per unitsemi-span length W 0
SHEAR in each segment of the wing boxstructure is calculated using the following formula,
W 0SHEAR ¼ �FS
�Sð3Þ
where, FS and �S ¼ 33:1 [MPa] are respectively the shearforce and allowable shear stress. The shear force is definedas positive when it is in the þz-axis direction. E; � and �Sare defined as material properties of aluminum alloy 7075-T6/T651. The wing box structure weight WBox is calculatedusing the following formula.
WBox ¼ 2bS �XNi¼1
W 0BENDi
þW 0SHEARi
� �ð4Þ
In this study, N is set to 24 and the spanwise length of eachwing box is about 656 [mm] on average. The fluid force andbending moment acting on the region over the 95% semi-span and on STW are considered to affect the segment adja-cent to the 95% semi-span location. The bending momentweight of the carry-through structure WBENDc
is calculatedusing the following formula,
WBENDc¼ "
M0 cosð�SÞt02CSRE
!e�CSRt0bc ð5Þ
where, �S ¼ 24:3 [deg], bc ¼ 3:71 [m] and t0 ¼ 0:768 [m]are respectively the sweepback angle of the centerline ofthe wing box, the width of the carry-through structure in
the y-axis direction and the height of the carry-through struc-ture. The subscript 0 indicates values at y ¼ 0. The shearforce weight of the carry-through structureWSHEARc
is calcu-lated using the following formula.
WSHEARc¼ �FS0
�Sbc ð6Þ
Torque acting on the carry-through structure is calculated us-ing the following formula.
T ¼ M0 sinð�SÞ ð7ÞThe torsional weight of the carry-through structureWTORSIONc
is calculated using the following formula.
WTORSIONc¼ �T ðt0 þ CSRÞbc
t0CSR�Sð8Þ
Then, the total structural weight of the carry-through struc-ture, WC is calculated as
WC ¼ WBENDcþWSHEARc
þWTORSIONcð9Þ
Finally, the total wing structure weight WW is calculatedusing
WW ¼ KðWBox þWCÞ ð10Þwhere, K ¼ 2:0138 is an empirical coefficient that comple-ments the difference between the total wing structure weightcalculated using the estimation formulas and the actualweight of TRA2012A.3.4. Kriging response surface model approach
In this study, the variation in onboard fuel weight �WF ,total wing structure weight�WW and the sum of these values�WTO from the TRA2012A model without a STW are ob-jective functions. �WTO is adopted as the main objectivefunction. �WW and �WF are adopted secondarily becausewe want to obtain detailed design knowledge of the STWby investigating the shapes with minimal �WW and �WF .An optimization method applying the Kriging method,21,22)
which is one of the response surface methods, is used forthe present optimization. In this method, performance evalu-ations for initial designs generated using the Latin hypercubesampling method23) in the design variables space are per-formed first. Then, approximate models of the performancefunctions in the design variables space are constructed.Global optimal solutions are explored using a GA with thefunctional evaluations on the approximate models. This ex-ploration can be performed in detail because the evaluationcost of the approximate model is much smaller than theCFD evaluation. In this study, the approximate models forthree objective functions are constructed respectively. Per-formance evaluations using CFD are performed on three ap-proximate optimal designs where the expected improvement(EI)21) is maximal (for each objective function), and then theapproximate models are updated. These three approximateoptimal designs are expected to minimize �WF; �WW and�WTO, and are added iteratively. By iterating these processes,global optimal solutions can be explored with a small num-ber of performance evaluations using CFD.
Fig. 3. Plan view of wing structural geometry.
Trans. Japan Soc. Aero. Space Sci., Vol. 63, No. 3, 2020
71©2020 JSASS

4. Definition of Optimization Problem
4.1. Design conditionsThe main winglet is attached at the 95% semi-span section
of the main wing of the TRA2012A in this study. The STWis expressed by attaching a small wing under the main wing-let. The sectional shapes of the main winglet and the smallwing are fixed to the NACA0010. Due to the definitions ofthe design variables, local angles of attack of the sectionalairfoil of the main winglet/small wing can be positive andnegative values. It is difficult to determine whether we shouldadopt a positive or negative camber airfoil for the STW in ad-vance. Therefore, a symmetrical NACA0010 airfoil is usedfor this study. The main winglet has a trailing-edge thick-ness, while the small wing has no trailing-edge thickness.The TRA2012A with a STW is shown in Fig. 4. The STWconfiguration is shown in Fig. 5 and its configuration is de-fined using 13 design variables, as shown in Table 2. Thedistance in the Y-axis direction from the root of the mainwinglet to the main winglet tip is defined as the span lengthof the main winglet lw (�1 in the table/figure). The dihedralangle of the small wing at the root is set to be orthogonal tothe centerline of the main winglet. The attachment positionof the small wing is defined as the reference position. Then,the normal direction for the centerline of the main winglet atthe reference position is defined as Y 0-axis, and the axis per-pendicular to the Y 0-axis is defined asZ0-axis. In addition, thechord line of the attachment surface of the small wing is setparallel to the x-axis. The distance in the Y 0-axis directionfrom the reference position to the tip of the small wing is de-fined as the span length of the small wing ls (�7 ). The curvelines of the main winglet and small wing are expressed re-
spectively using third-order polynomials as follows (�2 , �3 ,�8 , �9 ),
Z ¼ AY
lw
!3þB
Y
lw
!2þY
lwtan ðcantÞ ð11Þ
Z0 ¼ A0 Y 0
ls
!3þB0 Y 0
ls
!2ð12Þ
where, cant is the attachment angle of the main winglet at theroot of the main winglet, and the cant is fixed to 3.85 [deg].The shape of the main winglet is shown in Fig. 6 when thecurve coefficient B is changed from its minimum to maxi-mum value while the curve coefficient A is fixed to 0. Thetwisting region of the main winglet is from the attachmentposition of the small wing to the tip of the main winglet.The design variables of �5 and �11 define the twist angles atthe tips of the main winglet and of the small wing. The cen-ters of twist are set at the 50% chordwise locations of themain winglet and of the small wing. The twist angle changeslinearly toward the tips of the main winglet and of the smallwing. The distance in the y-axis direction from the 95% semi-span position of the main wing to the root of the small wingis defined as the attachment position of the small wing (�13 ).To avoid complicated connection around the regions of theleading/trailing-edges of the main winglet, the chord lengthof the small wing at the root position is set to a moderatevalue (¼ 80%) with respect to the chord length of the mainwinglet at the attachment position. The taper ratios andsweepback angles of the main winglet and small wing (�4 ,
Fig. 4. TRA2012A wing-body model with STW.
Fig. 5. Geometric definition of STW.
Fig. 6. Deformation of main winglet by changing curve coefficient B fromminimum to maximum value (curve coefficient A is fixed to 0).
Table 2. Design variables definitions.
Details Range
�1 Span length of main winglet (¼ lw) 5–10% semi-span lengthof main wing
�2 Curve coefficient A ¹3.6E¹04–+4.4E¹04�3 Curve coefficient B ¹3.0E¹02–+2.4E¹02�4 Taper ratio of main winglet 0.3–1.0�5 Twist angle of main winglet ¹10–+10 [deg]�6 Sweepback angle of main winglet ¹60–+60 [deg]�7 Span length of small wing (¼ ls) 0.5–2.0 times of chord-length
of small wing�8 Curve coefficient A0 ¹2.4E¹05–+2.4E¹05�9 Curve coefficient B0 ¹3.3E¹03–+3.3E¹03�10 Taper ratio of small wing 0.3–1.0�11 Twist angle of small wing ¹10–+10 [deg]�12 Sweepback angle of small wing ¹60–+60 [deg]�13 Attachment position of small wing 25–50% of lw
Trans. Japan Soc. Aero. Space Sci., Vol. 63, No. 3, 2020
72©2020 JSASS

�6 ,�10 ,�12 ) are also defined as design variables. In the presentoptimization, a geometrical constraint is set for the most dis-tal position in the y-axis direction (ymax) of the STW, andymax has to be at the inward side of the 105% semi-span lo-cation of the original main wing: depending on the designvariable settings, the y-coordinate for the tip of the smallwing can exceed the 105% semi-span location.4.2. CFD conditions
In CFD computations, the freestream Mach number is setto 0.78 and Reynolds number is set to 2:3� 108 (representa-tive length¼ fuselage length). The target lift coefficient is setto 0.542, which corresponds to the cruise conditions of theTRA2012A at an angle of attack of 0.61 [deg]. The angleof attack of the TRA2012A with a STW is adjusted to matchthe target lift coefficient. The number of grid points is ap-proximately 6:4� 106 and the averaged value of yþ onthe model is approximately 0.64. We performed a mesh de-pendency study to determine the present grid resolution. Thenumber of final steps for CFD analysis is 5� 104, which en-abled convergence of the drag coefficient value within1� 10�5. In the present CFD computation, a local time step-ping strategy is used in which the maximum CFL number isabout 20.4.3. Summary of optimization problem
In the present optimization, 30 initial STW designs aregenerated, and then 84 additional designs are iteratively se-lected and evaluated. The number of design variables is 13,as shown in Table 2. Three promising designs with respectto minimizing �WF; �WW and �WTO are selected andevaluated in the optimization process. The geometrical con-straint is set for the most distal position in the y-axis direction(ymax) of STW and ymax has to be at the inward side of the105% semi-span location of the original main wing.
5. Results and Discussion
5.1. Outline of optimization resultsThe optimization results of STW are summarized in
Fig. 7. The vertical and horizontal axes respectively indicatethe differences of fuel weight and of wing structure weightfrom that of the TRA2012A model without STW. The105% span extension model is defined by smoothly extend-ing the main wing to the 105% span location.�WF decreasesas �WW increases, and we can observe the tradeoff relation-ship between�WF and�WW . The variation in fuel weight islarger than the variation in the wing structure weight. In thisproblem, it is therefore more effective to reduce total weightby reducing the fuel weight, which can be achieved by reduc-ing aerodynamic drag. Arrows in Fig. 7 indicate non-dominated optimal designs obtained in this study. Most ofthe non-dominated optimal designs consist of additionalsamples obtained in the optimization process. �WW -1–5and�WF -1–11, shown in Fig. 8, are non-dominated optimaldesigns that reduce wing structure and fuel weights, respec-tively. �WW -5, �WF -11 and �WF -8 are the designs forminimum wing structure weight, minimum fuel weight andminimum total weight, respectively. Each weight component
Fig. 7. Optimization results: Upper, overview; Lower, enlarged view.
Fig. 8. Non-dominated optimal designs.
Trans. Japan Soc. Aero. Space Sci., Vol. 63, No. 3, 2020
73©2020 JSASS

of the representative designs is summarized in Table 3.Compared to the 105% span extension model, winglet design�WF -8 reduces more fuel weight, and its penalty in terms ofwing structure weight is also lower, thereby resulting in alarger reduction in the total weight. Although the lift requiredfor cruise of each design is different, its variation can beignored in this study because the variation in total weight rel-ative to the maximum takeoff weight is less than 3%(¼ 1;855/74,185).
�WW -5 has a downward forward-swept main wingletwith a small wing bent in the main wing root direction.The shapes of �WW -2–4 are similar to the shape of �WW -5. �WF -8 and �WF -11 have upward sweptback main wing-lets. Most of the other non-dominated optimal designs thatreduce fuel weight have upward sweptback main winglets.5.2. Aerodynamic effects of STW
The aerodynamic performance of the representative de-signs is shown in Tables 4 and 5. �CD; �CDP; �CDF and�AoA are respectively the variations in total drag coeffi-cient, pressure drag coefficient, friction drag coefficient andangle of attack compared to that of the TRA2012A modelwithout STW. �CD ind; �CDwav and �CD pro are respec-tively the variation in induced, wave and profile drag compo-nents that are evaluated using a drag breakdown approach.14)
�CD pur corresponds to the sum of the variations in threephysical drag components (referred to as pure drag inYamazaki et al.14)). The drag coefficient of 0.0001 corre-sponds to 1.0 drag count (dct). In the designs of the 105%span extension model, �WF -8 and �WF -11, reductions in�AoA; �CD ind; �CDwav; �CD and �CDP are observed.On the other hand, an increase in these values is observedin winglet design�WW -5. The variation in each drag compo-nent of the non-dominated optimal designs is summarized inFig. 9. �CDP; �CD ind; �CDwav and �AoA decrease withthe reduction of �WF . It can be seen that winglet design�WF -8 reduces �CD ind and �CDP with a very small in-crease in�CDF and�CD pro as compared to the other optimaldesigns.
To clarify the mechanisms for reducing aerodynamic drag,the flow field around the representative designs is visualized.The vorticity and induced drag source on a near-wake sur-face of the winglet are visualized in Figs. 10 and 11, respec-tively. The induced drag source distribution can be obtainedusing the drag breakdown approach. In Fig. 12, the shockwave generation regions around the wingtips are visualizedbased on a shock wave function.24) In Fig. 10, the clockwisevortex (red-colored area) locates at the tip of the main wingfor the TRA2012A model and 105% span extension model.
In winglet design �WW -5, the clockwise vortex is locatedat a position further inside, near the fuselage, as comparedto the TRA2012A model. It is estimated that the largeforward-swept main winglet and small wing cannot suppressswirling flows from the lower side to the upper side of themain wing, and the clockwise vortex occurs around the rootof the main winglet. In winglet design �WW -5, the counter-clockwise vortex (blue-colored area) at the tip of the main
Fig. 9. Variation in drag components using the surface integral method(upper) and drag breakdown approach (lower) of non-dominated optimaldesigns.
Table 3. Weight components of representative designs.
�WF [kg] �WW [kg] �WTO [kg]
105% span extension model ¹440.53 229.17 ¹211.36�WW -5 2242.28 ¹387.22 1855.06�WF -8 ¹480.90 179.50 ¹301.40�WF -11 ¹607.09 317.60 ¹289.49�WF -8 w/o ¹441.27 158.07 ¹283.20
Table 5. Aerodynamic performance obtained using the drag breakdownapproach for representative designs.
�CD ind
[dct]�CDwav
[dct]�CD pro
[dct]�CD pur
[dct]
105% span extension model ¹6.14 ¹2.36 ¹0.71 ¹9.21�WW -5 14.41 7.33 14.35 36.09�WF -8 ¹11.03 ¹2.41 0.10 ¹13.54�WF -11 ¹13.75 ¹4.26 2.07 ¹15.94�WF -8 w/o ¹7.61 ¹1.90 ¹0.90 ¹10.41
Table 4. Aerodynamic performance obtained using the surface integralmethod and angle of attack of representative designs.
�CDP
[dct]�CDF
[dct]�CD
[dct]�AoA
[deg]
105% span extension model ¹8.82 1.46 ¹7.36 ¹0.09�WW -5 34.99 2.46 37.45 0.16�WF -8 ¹9.39 1.36 ¹8.03 ¹0.07�WF -11 ¹13.52 3.38 ¹10.14 ¹0.14�WF -8 w/o ¹7.94 0.36 ¹7.37 ¹0.06
Trans. Japan Soc. Aero. Space Sci., Vol. 63, No. 3, 2020
74©2020 JSASS

winglet is also observed. This is because the pressure on theupper surface of the tip of the main winglet is higher than thelower surface, and the airflow from the upper side to the low-er side occurs at the tip. On the other hand, in winglet designs�WF -8 and �WF -11, clockwise vorticity areas at the tips ofthe main winglet and small wing are observed, and the vor-tices are located at positions further away from the mainwing. It is estimated that the influence of the downwash in-duced by the vortices becomes weaker since the vorticesmove, thereby reducing the induced drag. In addition, it isobserved that the strong induced drag source areas are lo-cated at positions where vortices exist. The strong induceddrag source areas become smaller compared to theTRA2012A model, which results in reducing the induced
drag. In the results of shock visualization, shock waves aregenerated on the upper surface of the main wing. In wingletdesign �WF -11, shock waves on the upper surface of theroot of the main winglet can be observed, while �CDwav issmaller than that for the TRA2012A model. This is becausethe shock wave strength on the main wing and wave drag de-crease since AoA becomes smaller than that of TRA2012Amodel. The reduction of �CDwav; �CD ind and �AoA is ob-served in representative winglet designs �WF -1–11. It isconsidered that these winglet designs achieve a reductionin �WF by decreasing these drag components.5.3. Wing structure weight analysis
The variation in the wing structure weight components ofthe non-dominated optimal designs is shown in Fig. 13. Both�WC and�WBox decrease with the reduction in�WW . Mostof the weight variation of the carry-through is due to the tor-sion acting on the carry-through. With respect to the weightvariation of the wing box, the effects of shear force and bend-ing moment are almost the same degree. The load distribu-tions acting on the STW and main wing are compared inFig. 14. The shear force and bending moment on the wingboxes are shown in Fig. 15. The wing box centers closestand next closest to the wingtip are located at 95% and 90%semi-span locations, respectively. The aerodynamic loadsacting on STW are considered to be a concentrated load onthe wing box center at the 95% semi-span location. The shearforce and bending moment on a wing box, indicated inFig. 15, are calculated from aerodynamic loads acting on
Fig. 11. Induced drag source distributions of representative designs.
Fig. 12. Shock visualizations of representative designs.
Fig. 13. Weight components of non-dominated optimal designs.
Fig. 14. Load distributions of representative designs.
Fig. 10. Vorticity distributions of representative designs.
Trans. Japan Soc. Aero. Space Sci., Vol. 63, No. 3, 2020
75©2020 JSASS
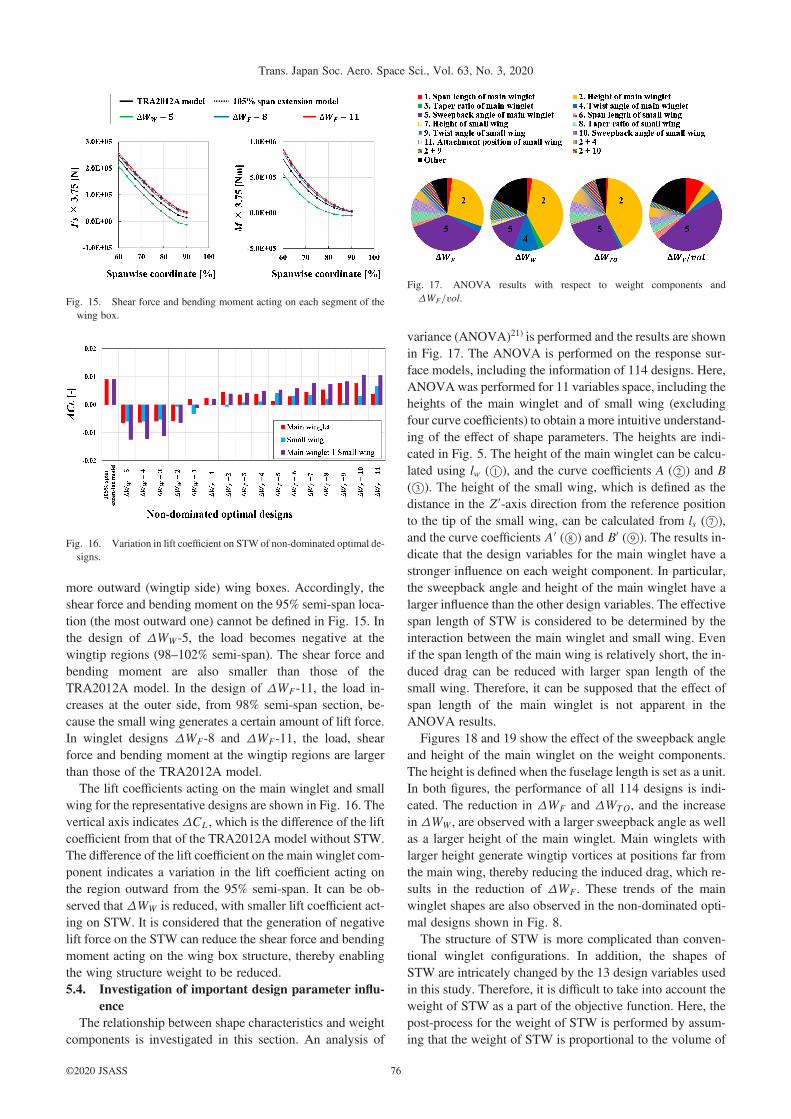
more outward (wingtip side) wing boxes. Accordingly, theshear force and bending moment on the 95% semi-span loca-tion (the most outward one) cannot be defined in Fig. 15. Inthe design of �WW -5, the load becomes negative at thewingtip regions (98–102% semi-span). The shear force andbending moment are also smaller than those of theTRA2012A model. In the design of �WF -11, the load in-creases at the outer side, from 98% semi-span section, be-cause the small wing generates a certain amount of lift force.In winglet designs �WF -8 and �WF -11, the load, shearforce and bending moment at the wingtip regions are largerthan those of the TRA2012A model.
The lift coefficients acting on the main winglet and smallwing for the representative designs are shown in Fig. 16. Thevertical axis indicates �CL, which is the difference of the liftcoefficient from that of the TRA2012A model without STW.The difference of the lift coefficient on the main winglet com-ponent indicates a variation in the lift coefficient acting onthe region outward from the 95% semi-span. It can be ob-served that �WW is reduced, with smaller lift coefficient act-ing on STW. It is considered that the generation of negativelift force on the STW can reduce the shear force and bendingmoment acting on the wing box structure, thereby enablingthe wing structure weight to be reduced.5.4. Investigation of important design parameter influ-
enceThe relationship between shape characteristics and weight
components is investigated in this section. An analysis of
variance (ANOVA)21) is performed and the results are shownin Fig. 17. The ANOVA is performed on the response sur-face models, including the information of 114 designs. Here,ANOVAwas performed for 11 variables space, including theheights of the main winglet and of small wing (excludingfour curve coefficients) to obtain a more intuitive understand-ing of the effect of shape parameters. The heights are indi-cated in Fig. 5. The height of the main winglet can be calcu-lated using lw (�1 ), and the curve coefficients A (�2 ) and B(�3 ). The height of the small wing, which is defined as thedistance in the Z0-axis direction from the reference positionto the tip of the small wing, can be calculated from ls (�7 ),and the curve coefficients A0 (�8 ) and B0 (�9 ). The results in-dicate that the design variables for the main winglet have astronger influence on each weight component. In particular,the sweepback angle and height of the main winglet have alarger influence than the other design variables. The effectivespan length of STW is considered to be determined by theinteraction between the main winglet and small wing. Evenif the span length of the main wing is relatively short, the in-duced drag can be reduced with larger span length of thesmall wing. Therefore, it can be supposed that the effect ofspan length of the main winglet is not apparent in theANOVA results.
Figures 18 and 19 show the effect of the sweepback angleand height of the main winglet on the weight components.The height is defined when the fuselage length is set as a unit.In both figures, the performance of all 114 designs is indi-cated. The reduction in �WF and �WTO, and the increasein�WW , are observed with a larger sweepback angle as wellas a larger height of the main winglet. Main winglets withlarger height generate wingtip vortices at positions far fromthe main wing, thereby reducing the induced drag, which re-sults in the reduction of �WF . These trends of the mainwinglet shapes are also observed in the non-dominated opti-mal designs shown in Fig. 8.
The structure of STW is more complicated than conven-tional winglet configurations. In addition, the shapes ofSTW are intricately changed by the 13 design variables usedin this study. Therefore, it is difficult to take into account theweight of STW as a part of the objective function. Here, thepost-process for the weight of STW is performed by assum-ing that the weight of STW is proportional to the volume of
Fig. 16. Variation in lift coefficient on STW of non-dominated optimal de-signs.
Fig. 17. ANOVA results with respect to weight components and�WF=vol.Fig. 15. Shear force and bending moment acting on each segment of the
wing box.
Trans. Japan Soc. Aero. Space Sci., Vol. 63, No. 3, 2020
76©2020 JSASS

STW (vol). (This assumption of the proportional relation isnot accurate, which should be noted as the limitation of thepresent post-process.) The volume of STW is calculatedwhen the fuselage length of the TRA2012A model is set to37.6 [m].13) The relationship between �WTO and �WF=vol
(¼ �WF per unit volume of STW) is shown in Fig. 20.�WF=vol decreases when �WTO is reduced. In winglet de-sign �WF -8, �WF=vol is minimized, which means thatwinglet design�WF -8 effectively reduces aerodynamic dragusing a small-sized STW. To discuss the reduction in�WF=vol, ANOVA is performed for �WF=vol and the re-sults are shown in Fig. 17. It is observed that the influenceof the sweepback angle of the main winglet is the greatest.The relationships between the height and sweepback angleof the main winglet and�WF=vol are also shown in Figs. 18and 19.�WF=vol decreases as the height and sweepback an-gle of the main winglet are increased. In addition, it is ob-served that there is an appropriate value for the height ofthe main winglet that minimizes �WF=vol.
In summary, the present STW shape optimization to min-imize the total weight of the aircraft without considering theweight of STW gave an optimal STW design (¼ �WF -8)with a minimum �WF=vol. Winglet design �WF -8 is notthe largest within the present design space. Therefore, evenin the case of the present STW optimization without consid-ering the weight of STW, it is possible to obtain the optimalSTW shape that is not simply the largest STW. This can beconsidered due to the effect of the wing structure weightwhich becomes heavier with larger STW shapes.
5.5. Effect of small wingTo investigate the effect of the small wing, winglet design
�WF -8 without the small wing (¼ �WF -8 w/o) is analyzed.The results of �WF -8 w/o are included in Tables 3–5 andFigs. 10–12. Compared to the winglet design �WF -8,�CD pro and �CDF are smaller, while �CD pur; �CD ind;
�CDwav; �CD and �CDP are larger in winglet design�WF -8 w/o. As a result, in winglet design �WF -8, �WF
and �WTO are smaller than in �WF -8 w/o. It is observedfrom the visualization results that strong vorticity areasaround the main winglet are divided into two areas at the tipsof the main winglet and of the small wing in winglet design�WF -8. In addition, the source of induced drag around thesmall wing is reduced by attaching the small wing. It is esti-mated that the vortices are diffused faster by dividing thewingtip vortices, which results in reducing induced drag.Similar discussions can be found in the previous studies.8,25)
In winglet design�WF -8, an increase of approximately 21[kg] in �WW is observed due to the effect of aerodynamicforce acting on the small wing, while more decrease in�WF
is observed by larger drag reduction. This result indicates theeffectiveness of the optimal STW design derived.
Among non-dominated optimal designs to reduce �WF ,there are peculiar designs such as winglet designs �WF -6and �WF -11. These have sweepback angles for the mainwinglet and sweepforward angles for the small wing, asshown in Fig. 8. The distance between the tips of the mainwinglet and of the small wing increases in these designs.Therefore, the relationship between the distance and �WF
is investigated and shown in Fig. 21. The distance is definedas the distance between 50% chord positions of the tips of themain winglet and of the small wing. Designs similar to wing-let designs �WW -1–5 are selected from the values of designvariables and defined as “exceptional designs” in Fig. 21.Winglet designs�WF -1 and�WW -1–5 belong to the excep-tional designs among the non-dominated optimal designs de-rived. As confirmed in Fig. 7, there is little or no reduction in�WTO for the designs �WF -1 and �WW -1–5, so these ex-ceptional designs are omitted from the following discussion.In Fig. 21, without the exceptional designs, it can be con-firmed that there is a trend of decreasing�WF as the distancebetween the wingtips increases. In winglet designs �WF -6
Fig. 20. Relationship between variations in total weight and onboard fuelweight per unit volume of STW.
Fig. 18. Effect of sweepback angle of main winglet on weight compo-nents.
Fig. 19. Effect of height of main winglet on weight components.
Trans. Japan Soc. Aero. Space Sci., Vol. 63, No. 3, 2020
77©2020 JSASS

and�WF -11, it is estimated that the wingtip vortices are fur-ther divided by taking larger distance and diffused faster,which results in reducing induced drag and �WF .
6. Conclusion
In this paper, a shape optimization of STW was performedfor the TRA2012A aircraft. The onboard fuel weight, mainwing structure weight and sum of these weights (¼ totalweight) were objective functions, and minimized respec-tively. The onboard fuel weight and main wing structureweight were respectively evaluated from aerodynamic dragbased on CFD analysis and from an estimation formula basedon aerodynamic force acting on the wing. As the optimiza-tion result, a tradeoff relationship between the onboard fuelweight and main wing structure weight was observed. Thetotal weight of the aircraft could be reduced by attaching op-timal STW designs. The variation in onboard fuel weight wasfound to be larger than that of the main wing structureweight. Increasing the sweepback angle and height of themain winglet was effective for reducing the onboard fuelweight and total weight. As for CFD results, physical dragcomponents were visualized in the flow field using the dragbreakdown approach, and the mechanisms of drag reductionwere investigated. In the winglet designs with smaller on-board fuel weights than the TRA2012Awithout STW, reduc-tions in strong vorticity areas and strong induced drag sourceareas around the main winglet and at the root of the smallwing were observed. The onboard fuel weight was decreasedby increasing the distance between the tips of the main wing-let and of the small wing. It was estimated that the wingtipvortices are divided and diffused faster by taking larger dis-tance, which results in reducing the induced drag. In addi-tion, the reduction of aerodynamic drag per unit volume ofSTW was the largest in the optimal design derived, whichmeans aerodynamic drag was effectively reduced using thesmall-sized STW.
These findings obtained here are effective only for thepresent design condition as well as for the TRA2012A modelat present. We will perform further investigations to deter-mine whether or not these findings are effective for differentconditions and different models. In addition, optimizationsconsidering the structural weight of STW will be performedto evaluate aircraft weight more realistically in our futureworks.
Acknowledgments
The authors are very grateful to the numerical simulation re-search group of JAXA with respect to the use of large-scale com-puter system JSS, as well as for their helpful advice. The authorsare also grateful to Dr. Yasushi Ito for his helpful advice to generateunstructured grids using the MEGG3D software.
References
1) Reneaux, J.: Overview on Drag Reduction Technologies for CivilTransport Aircraft, Proceedings of European Congress on Computa-tional Methods in Applied Sciences and Engineering, 2004.
2) Kwak, D., Nomura, T., Tokugawa, N., Kurita, M., and Murayama, M.:Introduction of Research Project for Environmental Conscious AircraftTechnology in JAXA, Greener Aviation 2016, Brussels, Belgium,2016.
3) Kwak, D., Tamayama, M., Nomura, T., and Arizono, H.: PreliminaryStudies on the Lift Distribution and Aspect Ratio of Subsonic AircraftWing for Fuel Consumption Reduction, JSASS-2015-5167, 2015.
4) Raymer, P.: Aircraft Design, 5th edition, AIAA, Washington, D.C.,ISBN 9781600869112, 2012.
5) McCormick, B. W.: Aerodynamics of V/STOL Flight, Academic Press,London, 1967.
6) Alford, L. D., Jr. and Clayman, G. J., Jr.: Blended Winglet, U.S Patent,No. 7,644,892, filed 2010.
7) Reddy, S. R., Neiss, A., and Powell, S.: Design, Analysis and Multi-Objective Constrained Optimization of Multi-winglets, B.Sc Thesis,Mechanical and Materials Engineering Dept., Florida InternationalUniv., Miami, Florida, USA, 2014.
8) Sohail, R., George, S., and Abas, A.: Multi-Winglets: Multi-ObjectiveOptimization of Aerodynamic Shapes, AIAA Paper 2015-1489, 2015.
9) Reddy, S. R., Sobieczky, H., Abdoli, A., and Dulikravich, G. S.:Winglets—Multiobjective Optimization of Aerodynamic Shapes,11th World Congress on Computational Mechanics, Barcelona, Spain,July 20–25, 2014.
10) Prandtl, L.: Uber Tragflugel kleinsten induzierten Widerstandes,Zeitschrift fur Flugtecknik und Motorluftschiffahrt, 24 (1933),pp. 305–306.
11) Nicolas, R. and Luis, G.: Aerodynamic Design of a Winglet for theDassault Falcon 10, AIAA Paper 2016-0776, 2016.
12) Takenaka, K., Hatanaka, K., Yamazaki, W., and Nakahashi, K.: Multi-disciplinary Design Exploration for a Winglet, J. Aircraft, 45, 5(2008), pp. 1601–1611.
13) Nomura, T.: Conceptual Design of Future Passenger Aircraft Aimed atReducing Fuel Consumption, JAXA Research and Development Re-port, ISSN 1349-1113, 2013.
14) Yamazaki, W., Matsushima, K., and Nakahashi, K.: Drag Prediction,Decomposition and Visualization in Unstructured Mesh CFD Solverof TAS-code, Int. J. Numer. Methods Fluids, 57, 4 (2008),pp. 417–436.
15) Yamamoto, K., Tanaka, K., and Maruyama, M.: Comparison Study ofDrag Prediction for the 4th CFD Drag Prediction Workshop usingStructured and Unstructured Mesh Methods, AIAA Paper 2010-4222, 2010.
16) Ito, Y., Shih, A. M., and Soni, B. K.: Three Dimensional AutomaticLocal Remeshing for Two or More Hybrid Meshes, Int. J. Numer.Methods Fluids, 66, 12 (2011), pp. 1495–1505.
Fig. 21. Effect of distance between tips of main winglet and of small wingon fuel weight.
Trans. Japan Soc. Aero. Space Sci., Vol. 63, No. 3, 2020
78©2020 JSASS

17) Sharov, D. and Nakahashi, K.: Hybrid Prismatic/Tetrahedral GridGeneration for Viscous Flow Applications, AIAA J., 36, 2 (1998),pp. 157–162.
18) Spalart, P. R. and Allmaras, S. R.: A One-Equation Turbulence Modelfor Aerodynamic Flows, AIAA Paper 92-0439, 1992.
19) Vassberg, J. C., Tinoco, E. N., Mani, M., and Rider, B.: Summary ofthe Fourth AIAA CFD Drag Prediction Workshop, AIAA Paper 2010-4547, 2010.
20) Ardema, M. D., Chambers, M. C., Patron, A. P., Hahn, A. S., Miura,H., and Moore, M. D.: Analytical Fuselage and Wing Weight Estima-tion of Transport Aircraft, AIAA Paper 96-5583, 1996.
21) Jones, D. R., Schonlau, M., and Welch, W. J.: Efficient Global Optimi-zation of Expensive Black-Box Functions, J. Global Optim., 13(1998), pp. 455–492.
22) Yamazaki, W. and Mavriplis, D. J.: Derivative-enhanced Variable
Fidelity Surrogate Modeling for Aerodynamic Functions, AIAA J.,51, 1 (2013), pp. 126–137.
23) Koehler, J. R. and Owen, A. B.: Computer Experiments, Handbook ofStatistics (Ghosh, S. and Rao, C. R., ed.), Elsevier, Amsterdam, 1996,pp. 261–308.
24) Lovely, D. and Haimes, R.: Shock Detection from ComputationalFluid Dynamics Results, AIAA Paper 99-3285, 1999.
25) Smith, M. J., Komerath, N., Ames, R., Wong, O., and Pearson, J.: Per-formance Analysis of a Wing with Multiple Winglets, AIAA Paper2001-2407, 2001.
Shinkyu JeongAssociate Editor
Trans. Japan Soc. Aero. Space Sci., Vol. 63, No. 3, 2020
79©2020 JSASS