draft report for discussion - slocat.net · tcc-gsr global status report on transport and climate...
TRANSCRIPT
DRAFT REPORT FOR DISCUSSION
1
2018 Voluntary National Reviews:
Showcasing the Critical Role of the Transport Sector to
Achieve the Sustainable Development Goals
PRELIMINAY RESULTS [DRAFT REPORT]
Version: 9 July 2018
DRAFT REPORT FOR DISCUSSION
2
Table of Contents
Executive Summary .................................................................................................................................. 4
I. Background and Objectives ............................................................................................................ 6
1. Transport and Sustainable Development Goals ......................................................................... 7
2. Assessment Objectives ............................................................................................................... 9
II. References to transport in VNRs ................................................................................................... 10
III. References to Sustainable Transport ............................................................................................ 15
1. References to transport and sustainability .............................................................................. 15
2. Data reported to show progress in the transport sector ......................................................... 19
3. Transport-related targets in VNRs ........................................................................................... 20
4. References to transport policy measures (Avoid-Shift-Improve) ............................................. 21
5. References to transport adaptation measures ........................................................................ 24
IV. Conclusions and Recommendations ............................................................................................. 25
Annex I: List of countries submitting VNRs to HLPF 2018 ...................................................................... 31
Annex II: List of transport typologies used in assessment ...................................................................... 32
Annex III: Countries reporting data on transport SDG indicators........................................................... 34
Annex IV: Countries reporting transport targets in 2018 VNRs ............................................................. 37
List of Figures
Figure 1. 17 Sustainable Development Goals of the 2030 Agenda .......................................................... 6
Figure 2. Direct and Indirect Transport SDG Targets ................................................................................ 8
Figure 3. Level of Information Relevant to Transport Sector in 2018 VNRs (Source: SLoCaT 2018) ...... 11
Figure 4. Share of VNRs with Transport References to SDGs (Source: SLoCaT 2018) ............................ 12
Figure 5.Share of VNRs with references by transport modes (Source: SLoCaT 2018) ............................ 13
Figure 6. Share of countries with references to transport sub-sectors (Source: SLoCaT 2018) ............. 14
Figure 7. Level of Information Relevant to Sustainable Transport in 2018 VNRs (Source: SLoCaT
2018) ....................................................................................................................................................... 16

DRAFT REPORT FOR DISCUSSION
3
Figure 8. Share of countries with references to transport development benefits (Source: SLoCaT
2018) ....................................................................................................................................................... 17
Figure 9. Share of countries with references to A-S-I transport measures (Source: SLoCaT 2018) ....... 22
List of Tables
Table 1. References to transport in the 2018 SDG Progress Report ...................................................... 28
List of Abbreviations
A-S-I Avoid-Shift-Improve
BRT Bus Rapid Transit
CO2 Carbon Dioxide
ECOSOC United Nations Economic and Social Council
GDP Gross Domestic Product
GHG Greenhouse Gas
GMR Global Mobility Report
HLPF High-Level Political Forum
ITDP Institute for Transportation and Development Policy
ITS Intelligent Transport Systems
Lao PDR Lao People’s Democratic Republic
MSGI Maritime Singapore Green Initiative
NAMA Nationally Appropriate Mitigation Action
NDCs Nationally Determined Contributions
SDGs Sustainable Development Goals
SLoCaT Partnership on Sustainable, Low Carbon Transport
SUMP Sustainable Urban Mobility Plan
TCC-GSR Transport and Climate Change Global Status Report
TCC-GSR Global Status Report on Transport and Climate Change
UAE United Arab Emirates
UNCTAD United Nations Conference on Trade and Development
VNR Voluntary National Review

DRAFT REPORT FOR DISCUSSION
4
Executive Summary
The High-level Political Forum (HLPF) on Sustainable Development is the United Nation
(UN)’s central platform for the follow-up and review of the 2030 Agenda and the 17
Sustainable Development Goals (SDGs). The HLPF in 2018, held from 9 to 18 July 2018,
focuses on the theme, “Transformation towards sustainable and resilient societies.” SDGs
under review at the HLPF 2018 include SDG 6 (Clean Water and Sanitation), SDG 7
(Affordable and Clean Energy), SDG 11 (Sustainable Cities and Communities), SDG 12
(Responsible Consumption and Production), SDG 15 (Life on Land) and SDG 17 (Partnership
for the Goals).
A key reporting mechanism within the HLPF is the Voluntary National Review (VNR) process
which aims to facilitate the sharing of experiences among countries, including successes,
challenges and lessons learned, with a view to accelerating the implementation of the 2030
Agenda.
Although sustainable transport is not represented by a standalone SDG in the 2030 Agenda,
it is mainstreamed in a direct or indirect manner into several SDGs, especially those related
to poverty alleviation; food security; access to health services, clean water, education, and
employment; gender equality; energy; infrastructure; cities and human settlements; energy
and food consumption, and climate change.
Since the first HLPF in 2016, the Partnership on Sustainable, Low Carbon Transport (SLoCaT)
has been conducting analyses on the VNRs submitted each year. SLoCaT continues to track
the references to transport in the 47 VNRs submitted to HLPF in 2018. As of July 9, 2018, 40
out of 47 VNRs have been submitted to HLPF 2018.1
Preliminary results of this analysis finds that despite a slight improvement from 2016 and
2017, gaps remain in reporting on transport and its contribution to sustainable
development in VNRs submitted in 2018. In 2018, references to the transport sector have
been included in 95% of the VNRs submitted so far (38 out of 40 VNRs). Nevertheless, there
remains a tendency in a number of VNRs to merely report on outputs (e.g. kilometers of
highways built or kilometers of rail constructed) without demonstrating linkages to broader
development goals. 80% of VNRs refer to the role of sustainable transport in achieving the
SDGs but only 12 out of 40 VNRs (30%) offer considerable information with specific cases
and policy examples on sustainable transport. The majority of VNRs fall short to offer any
1 See Annex I for the list of countries submitting VNRs to HLPF 2018. 40 VNRs have been submitted as of July 9, 2018 and 7 more VNRs are expected to be submitted.
DRAFT REPORT FOR DISCUSSION
5
concrete evidence and policy measures to demonstrate their commitment to achieve
sustainable transport.
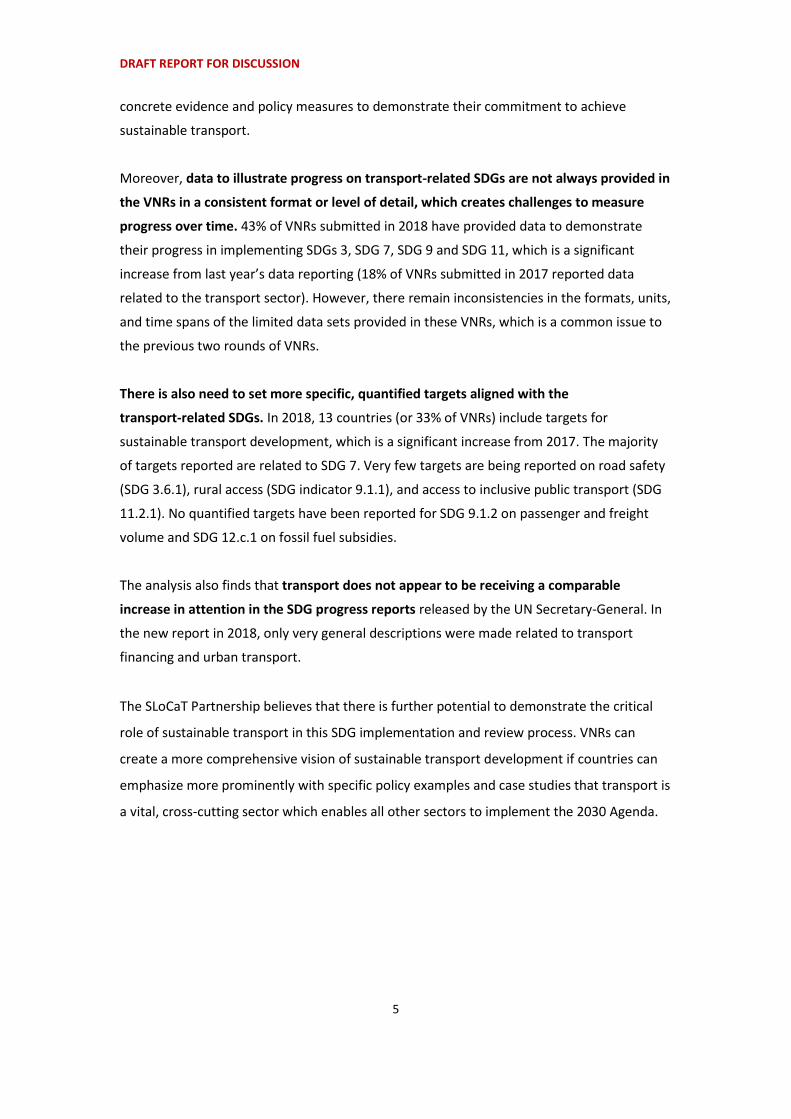
Moreover, data to illustrate progress on transport-related SDGs are not always provided in
the VNRs in a consistent format or level of detail, which creates challenges to measure
progress over time. 43% of VNRs submitted in 2018 have provided data to demonstrate
their progress in implementing SDGs 3, SDG 7, SDG 9 and SDG 11, which is a significant
increase from last year’s data reporting (18% of VNRs submitted in 2017 reported data
related to the transport sector). However, there remain inconsistencies in the formats, units,
and time spans of the limited data sets provided in these VNRs, which is a common issue to
the previous two rounds of VNRs.
There is also need to set more specific, quantified targets aligned with the
transport-related SDGs. In 2018, 13 countries (or 33% of VNRs) include targets for
sustainable transport development, which is a significant increase from 2017. The majority
of targets reported are related to SDG 7. Very few targets are being reported on road safety
(SDG 3.6.1), rural access (SDG indicator 9.1.1), and access to inclusive public transport (SDG
11.2.1). No quantified targets have been reported for SDG 9.1.2 on passenger and freight
volume and SDG 12.c.1 on fossil fuel subsidies.
The analysis also finds that transport does not appear to be receiving a comparable
increase in attention in the SDG progress reports released by the UN Secretary-General. In
the new report in 2018, only very general descriptions were made related to transport
financing and urban transport.
The SLoCaT Partnership believes that there is further potential to demonstrate the critical
role of sustainable transport in this SDG implementation and review process. VNRs can
create a more comprehensive vision of sustainable transport development if countries can
emphasize more prominently with specific policy examples and case studies that transport is
a vital, cross-cutting sector which enables all other sectors to implement the 2030 Agenda.

DRAFT REPORT FOR DISCUSSION
6
I. Background and Objectives
On 1 January 2016, the 2030 Agenda for Sustainable Development officially came into force.
The 2030 Agenda is a set of 17 Sustainable Development Goals (SDGs) adopted by world
leaders in September 2015 and aimed at stimulating actions to shift the world onto a
sustainable and resilient path (Figure 1). A complementary set of 169 targets has also been
adopted to track the progress made towards achieving the SDGs. As the most important
roadmap to guide policy actions for sustainable development in the next 15 years, the 2030
Agenda mobilizes efforts to end all forms of poverty, fight inequality and tackle climate
change, while ensuring that “no one is left behind.”2
FIGURE 1. 17 SUSTAINABLE DEVELOPMENT GOALS OF THE 2030 AGENDA
The High-level Political Forum (HLPF) on Sustainable Development is the United Nation
(UN)’s central platform for the follow-up and review of the 2030 Agenda. From its inception
in 2016, the HLPF provides an annual platform to provide policy guidance and
recommendations on the implementation of the 2030 Agenda and offers opportunities for
countries to share how implementation of various SDGs have been integrated in their
national policies, strategies, and development plans to date.
The HLPF in 2018, held from 9 to 18 July 2018, focuses on the theme, “Transformation
towards sustainable and resilient societies.” SDGs under review at the HLPF 2018 include
SDG 6 (Clean Water and Sanitation), SDG 7 (Affordable and Clean Energy), SDG 11
2 United Nations. 2015. Transforming our World: 2030 Agenda for Sustainable Development. http://bit.ly/1Epf648

DRAFT REPORT FOR DISCUSSION
7
(Sustainable Cities and Communities), SDG 12 (Responsible Consumption and Production),
SDG 15 (Life on Land) and SDG 17 (Partnership for the Goals). A key reporting mechanism
within the HLPF is the Voluntary National Review (VNR) process, as further described in Box
1:
Box 1: Voluntary National Reviews
As part of its follow-up and review mechanisms, the 2030 Agenda encourages member states to
"conduct regular and inclusive reviews of progress at the national and sub-national levels, which are
country-led and country-driven."3 This mechanism, known as the Voluntary National Review (VNR), is
expected to serve as a basis for the regular reviews by the HLPF, meeting under the auspices of the
United Nations Economic and Social Council. These regular reviews by the HLPF are to be voluntary,
state-led, undertaken by both developed and developing countries, and involve multiple
stakeholders.4
The VNRs aim to facilitate the sharing of experiences, including successes, challenges and lessons
learned, with a view to accelerating the implementation of the 2030 Agenda. The VNRs also seek to
strengthen policies and institutions of governments and to mobilize multi-stakeholder support and
partnerships for the implementation of the SDGs.
An online VNR platform has been set up at https://sustainabledevelopment.un.org/vnrs/.
1. Transport and Sustainable Development Goals
Although sustainable transport is not represented by a standalone SDG in the 2030 Agenda,
it is mainstreamed in a direct or indirect manner into several SDGs, especially those related
to poverty alleviation; food security; access to health services, clean water, education, and
employment; gender equality; energy; infrastructure; cities and human settlements; energy
and food consumption, and climate change. Transport services and infrastructure are
therefore essential to achieving most, if not all, SDGs (figure 2):
3 Paragraph 79, Transforming our World: 2030 Agenda for Sustainable Development. http://bit.ly/1Epf648 4 Paragraph 84, Transforming our World: 2030 Agenda for Sustainable Development. http://bit.ly/1Epf648

DRAFT REPORT FOR DISCUSSION
8
FIGURE 2. DIRECT AND INDIRECT TRANSPORT SDG TARGETS
Targets being reviewed in HLPF 2018 with relevance to transport include the following:
⚫ Indirect transport target 6.1 on universal and equitable access to drinking water
⚫ Indirect transport target 7.2 on increasing renewable energy share in total final energy
consumption
⚫ Direct transport target 7.3 on improvement in energy efficiency
⚫ Direct transport target 11.2 on access to public transport (with indicator 11.2.1 on
proportion of population that has convenient access to public transport, by sex, age
and persons with disabilities)
⚫ Indirect transport target 12.3 on food waste and loss reduction
⚫ Indirect transport target 12.c on fossil fuel subsidies removal

DRAFT REPORT FOR DISCUSSION
9
2. Assessment Objectives
The Partnership on Sustainable Low Carbon Transport (SLoCaT) represents over 90
international organizations that are actively working to promote sustainable transport in the
implementation of the 2030 Agenda for Sustainable Development. Advocacy to raise the
profile of sustainable transport in the 2030 Agenda and its subsequent SDG review process
at the HLPF is one of the key priorities of the mandate of SLoCaT.
Since the first HLPF in 2016, SLoCaT has been conducting analyses on the VNRs submitted
each year. While only 64% of the 22 VNRs submitted in 2016 contained references to
transport (with not all references sustainability-specific), 98% of the 43 submitted VNRs in
2017 had some degree of reference to the transport sector, with 35% of submissions in 2017
giving specific examples to link transport with sustainable development impacts.
SLoCaT continues to track the references to transport in the 47 VNRs submitted to HLPF in
2018. As of July 9, 2018, 40 VNRs have been submitted.5 This assessment analyzes the third
round of VNRs through the following questions:
1. Do countries refer in their VNRs to progress achieved in the transport sector?
2. Do countries link transport development with sustainable development impacts,
such as poverty alleviation, food security, social inclusion and equity, road safety,
and a cleaner environment?
3. With the review of SDG 11 in 2018, do countries report on any actions for public
transport development, improvement in access to urban transport, and enhance
the inclusiveness of transport services and infrastructure?
4. What good practices and policy measures for sustainable transport are identified
in the VNRs? Is there a pattern to which types of transport policy measures are
most commonly adopted by countries?
To answer the above questions, SLoCaT has developed a binary assessment6 on countries’
references to the SDGs, two transport modes, seven transport sub-sectors, and 20 transport
policy measures in the VNRs,7 based on the Avoid-Shift-Improve (A-S-I) framework.8 The
5 See Annex I for the list of countries submitting VNRs to HLPF 2018. 40 VNRs have been submitted as of July 9, 2018 and 7 more VNRs are expected to be submitted.
6 The analysis presented here is documented in a matrix which is available on the SLoCaT website at URL (to be
uploaded on Monday July 9, 2018) 7 Refer to Annex II for all the transport modes, sub-sectors, and policy measures reviewed in the assessment.
DRAFT REPORT FOR DISCUSSION
10
assessment also considers whether these transport references are made in relations to nine
different sustainability-related impacts, including poverty alleviation, food security, social
inclusion and equity, urban access, rural access, regional connectivity, road safety,
congestion reduction, and air pollution/ public health.
The SLoCaT Partnership believes that there is further potential to demonstrate the critical
role of sustainable transport in this SDG implementation and review process. VNRs can
create a more comprehensive vision of sustainable transport development if countries can
emphasize more prominently with specific policy examples and case studies that transport is
a vital, cross-cutting sector which enables all other sectors to implement the 2030 Agenda.
II. References to transport in VNRs
As of July 9, 2018, 40 out of the 47 countries have submitted their VNRs to the HLPF 2018. A
list of countries submitting their VNRs in 2018 is available in Annex I.
Transport has gained increased attention in the SDG review process over the years. In the
first round of VNR submission in 2016, only 64% of the 22 submitted VNRs contained
references to transport with not all references sustainability-specific. In 2017, 98% of the 43
submitted VNRs have some degree of reference to the transport sector, with 35% of
submission giving specific examples to link transport with sustainable development impacts.
In the third round of VNR submission in 2018, references to the transport sector have been
included in 95% of the submitted VNRs (38 out of 40 VNRs).
This analysis use a rating scale based on the number and degree of references to the
transport sector:
8 The A-S-I framework is an alternative approach to define sustainable mobility solutions in the context of GHG
emission reduction, reduced energy consumption, less congestion, and more livable cities: “Avoid” measures
seek to improve the efficiency of the transport system as a whole through integrated land-use planning and
transport-demand management to reduce the need to travel and length of trips; “Shift” measures seek to
improve trip efficiency by increasing modal shift from the most energy consuming transport modes (e.g. private
motorized vehicles) to more environmentally friendly modes (e.g. public transport and non-motorized transport);
“Improve” measures focus on vehicle and fuel efficiency as well as on the optimization of transport
infrastructure through related technology and alternative energy use. For more information, please see:
http://bit.ly/1ZAUq56
DRAFT REPORT FOR DISCUSSION
11
⚫ 5 = considerable information on the transport sector with more than five specific policy examples and cases;
⚫ 4 = some information on the transport sector with less than 3 specific policy examples;
⚫ 3 = Limited information on the transport sector with no specific policy examples. Transport is referenced in general terms;
⚫ 2 = Transport is mentioned briefly along with other sectors only; ⚫ 1 = No information on the transport sector.
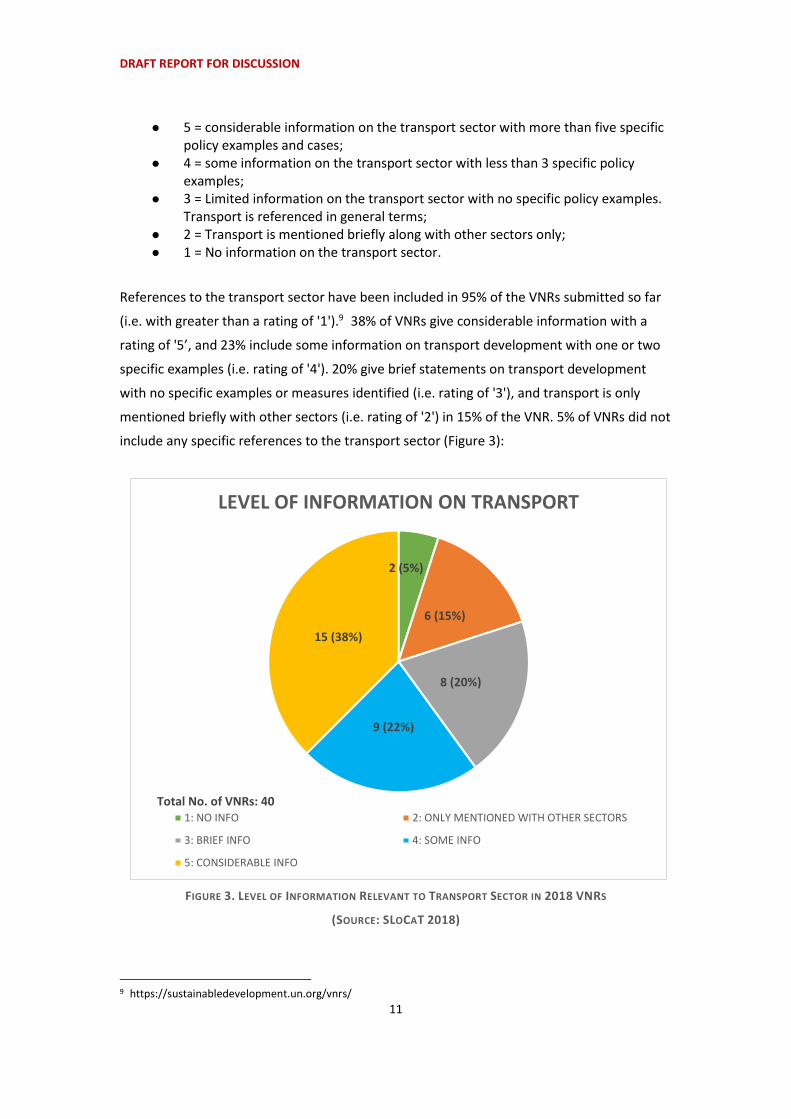
References to the transport sector have been included in 95% of the VNRs submitted so far
(i.e. with greater than a rating of '1').9 38% of VNRs give considerable information with a
rating of '5’, and 23% include some information on transport development with one or two
specific examples (i.e. rating of '4'). 20% give brief statements on transport development
with no specific examples or measures identified (i.e. rating of '3'), and transport is only
mentioned briefly with other sectors (i.e. rating of '2') in 15% of the VNR. 5% of VNRs did not
include any specific references to the transport sector (Figure 3):
FIGURE 3. LEVEL OF INFORMATION RELEVANT TO TRANSPORT SECTOR IN 2018 VNRS
(SOURCE: SLOCAT 2018)
9 https://sustainabledevelopment.un.org/vnrs/
2 (5%)
6 (15%)
8 (20%)
9 (22%)
15 (38%)
LEVEL OF INFORMATION ON TRANSPORT
1: NO INFO 2: ONLY MENTIONED WITH OTHER SECTORS
3: BRIEF INFO 4: SOME INFO
5: CONSIDERABLE INFO
Total No. of VNRs: 40
DRAFT REPORT FOR DISCUSSION
12
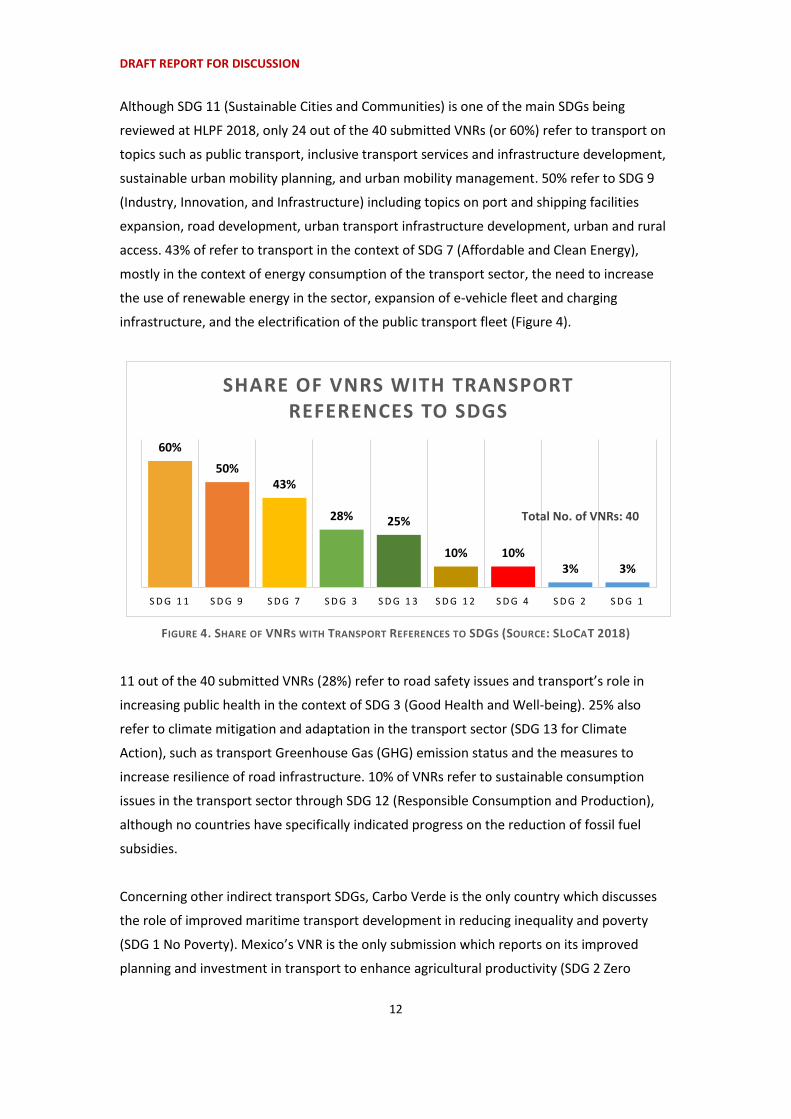
Although SDG 11 (Sustainable Cities and Communities) is one of the main SDGs being
reviewed at HLPF 2018, only 24 out of the 40 submitted VNRs (or 60%) refer to transport on
topics such as public transport, inclusive transport services and infrastructure development,
sustainable urban mobility planning, and urban mobility management. 50% refer to SDG 9
(Industry, Innovation, and Infrastructure) including topics on port and shipping facilities
expansion, road development, urban transport infrastructure development, urban and rural
access. 43% of refer to transport in the context of SDG 7 (Affordable and Clean Energy),
mostly in the context of energy consumption of the transport sector, the need to increase
the use of renewable energy in the sector, expansion of e-vehicle fleet and charging
infrastructure, and the electrification of the public transport fleet (Figure 4).
FIGURE 4. SHARE OF VNRS WITH TRANSPORT REFERENCES TO SDGS (SOURCE: SLOCAT 2018)
11 out of the 40 submitted VNRs (28%) refer to road safety issues and transport’s role in
increasing public health in the context of SDG 3 (Good Health and Well-being). 25% also
refer to climate mitigation and adaptation in the transport sector (SDG 13 for Climate
Action), such as transport Greenhouse Gas (GHG) emission status and the measures to
increase resilience of road infrastructure. 10% of VNRs refer to sustainable consumption
issues in the transport sector through SDG 12 (Responsible Consumption and Production),
although no countries have specifically indicated progress on the reduction of fossil fuel
subsidies.
Concerning other indirect transport SDGs, Carbo Verde is the only country which discusses
the role of improved maritime transport development in reducing inequality and poverty
(SDG 1 No Poverty). Mexico’s VNR is the only submission which reports on its improved
planning and investment in transport to enhance agricultural productivity (SDG 2 Zero
60%
50%43%
28% 25%
10% 10%3% 3%
S D G 1 1 S D G 9 S D G 7 S D G 3 S D G 1 3 S D G 1 2 S D G 4 S D G 2 S D G 1
SHARE OF VNRS WITH TRANSPORT REFERENCES TO SDGS
Total No. of VNRs: 40

DRAFT REPORT FOR DISCUSSION
13
Hunger). For SDG 4 on Quality Education, Kiribati, Slovakia and Sudan have referred to the
provision of transport subsidies to minorities and students to enhance access to education.
In terms of transport modes, 28 out of the 40 VNRs (70%) have referred to passenger
transport, such as public transport (bus-based and metro systems), cycling and bikesharing,
electric mobility and alternative fuels for vehicles. 50% of VNRs have referred to freight
transport, such as maritime transport (shipping and port facilities development), rail freight
and road infrastructure expansion (Figure 5):
FIGURE 5.SHARE OF VNRS WITH REFERENCES BY TRANSPORT MODES (SOURCE: SLOCAT 2018)
While SDG 11 is one of the SDGs in review at HLPF 2018, urban transport is only covered by
24 out of 40 VNRs (60%) covering a wide range of solutions including public transport (bus
and metro), walking and cycling, Sustainable Urban Mobility Plans (SUMPs), mobility and
traffic management, parking policies etc. It is followed by aviation (40%) and maritime
transport (35%). Rural transport is mentioned in 25% of submitted VNRs.
Major urban mobility options including heavy rail, walking and cycling are each mentioned in
23% of submitted VNRs. High speed rail is only mentioned by 3% of VNRs (Figure 6).
70%
50%
P A S S E N G E R T R A N S P O R T F R E I G H T T R A N S P O R T
SHARE OF VNRS WITH REFERENCES BY TRANSPORT MODES
Total No. of VNRs: 40

DRAFT REPORT FOR DISCUSSION
14
FIGURE 6. SHARE OF COUNTRIES WITH REFERENCES TO TRANSPORT SUB-SECTORS (SOURCE: SLOCAT 2018)
Out of the 40 submitted VNRs, 65% indicate the challenges faced in the transport sector. A
number of countries point out that the transport sector is a major or the largest energy
consuming sector. For example, transport accounts for about 40% of the total energy
consumption in Albania and 35% of total energy consumption in Ireland.
Other obstacles that hinder sustainable transport development include the lack of basic
transport infrastructure and network in good conditions (Andorra, Guinea, Kiribati, Latvia,
Lebanon, Malta, Slovakia, Sri Lanka, Vietnam), road and transport safety issues (Andorra,
Ecuador, Kiribati, Lao PDR, Mexico, Vietnam), rapid increase of transport demand due to
population and economic growth (Australia), geographic location (Armenia, Bhutan, Kiribati),
unfavorable political barriers (e.g. trade and transport blockade in landlocked Armenia;
remaining submunitions in Lao PDR, border closures in Lebanon, political volatility in the
State of Palestine), and lack of interest of citizens to shift to low carbon transport modes
(Mexico).
In terms of financing and investment for transport development, Australia is investing in key
rail infrastructure to reduce the burden on road traffic and to provide more reliable
transport networks through initiatives such as the Melbourne to Brisbane Inland Rail for
freight. Bhutan has developed a Nationally Appropriate Mitigation Action (NAMA) plan for
transport to seek for investment for green transport system development to compliment
Bhutan’s carbon neutral promise. Ireland is providing about €8.6 billion in capital funding for
public transport projects over the next decade. €2.7 billion for investment in public transport
has been provided for the remaining four years of the National Development Plan to 2021.
60%
40%35%
25% 23% 23%
3%
UR
BA
N
TR
AN
SP
OR
T
AV
IAT
ION
MA
RIT
IME
T
RA
NS
PO
RT
RU
RA
L
TR
AN
SP
OR
T
HE
AV
Y R
AIL
WA
LK
ING
/
CY
CL
ING
HIG
H S
PE
ED
R
AIL
SHARE OF VNRS WITH REFERENCES BY SUB-SECTORS
Total No. of VNRs: 40

DRAFT REPORT FOR DISCUSSION
15
For Lebanon, transport is a high priority for the government. It accounted for more than a
third of the funding requested at its International Conference in Support of Lebanon
Development and Reforms (CEDRE conference) with projects worth around USD5.6 billion.
In Saudi Arabia, over US$ 106 billion have been invested in transport infrastructure over the
last 10 years, resulting in the construction of a solid transport network covering all parts of
the country. The government is keen to develop infrastructure and transport by allocating
more than US$ 14.4 billion in its 2018 budget.
III. References to Sustainable Transport
Adequate, efficient, affordable, safe, low-carbon and climate resilient transport services and
infrastructures are important enabling conditions to address the key issues of sustainability,
including urban and rural access, regional connectivity, road safety, air pollution and public
health, and congestion. Transport also plays a critical role in achieving the overarching goals
of the 2030 Agenda to alleviate poverty, enhance food security, and ensure social inclusion
and equity. Thus, it is crucial that countries in their VNRs do not merely list actions taken to
grow the transport sector, but rather that countries link these transport measures with their
respective development benefits to amplify the impact of the transport sector in
implementing the SDGs.
1. References to transport and sustainability
Information on transport provided in the VNRs is not always synonymous with sustainable
transport. For example, a number of countries give ample information on transport in the
context of economic development (e.g. expansion of road infrastructure and port facilities)
but make little connection to how transport addresses sustainability issues (e.g. road safety,
poverty alleviation, green mobility).
Although 38 out of the 40 submitted VNRs have mentioned about the transport sector, only
80% of the total submission make reference to sustainable transport issues. In addition, only
12 out of 40 VNRs (30%) offer considerable information on transport in the context of
sustainable development benefits and impacts. 8% have made references on sustainable
transport development with one or two specific examples. 28% have highlighted that
sustainable transport is a priority area of their actions but no specific policy examples are
given in their VNRs. 15% have mentioned briefly about sustainable transport but gives no
further attention to the topic. 20% have given no information on actions taken in the
transport sector to address sustainability issues (Figure 7). The distribution shows that
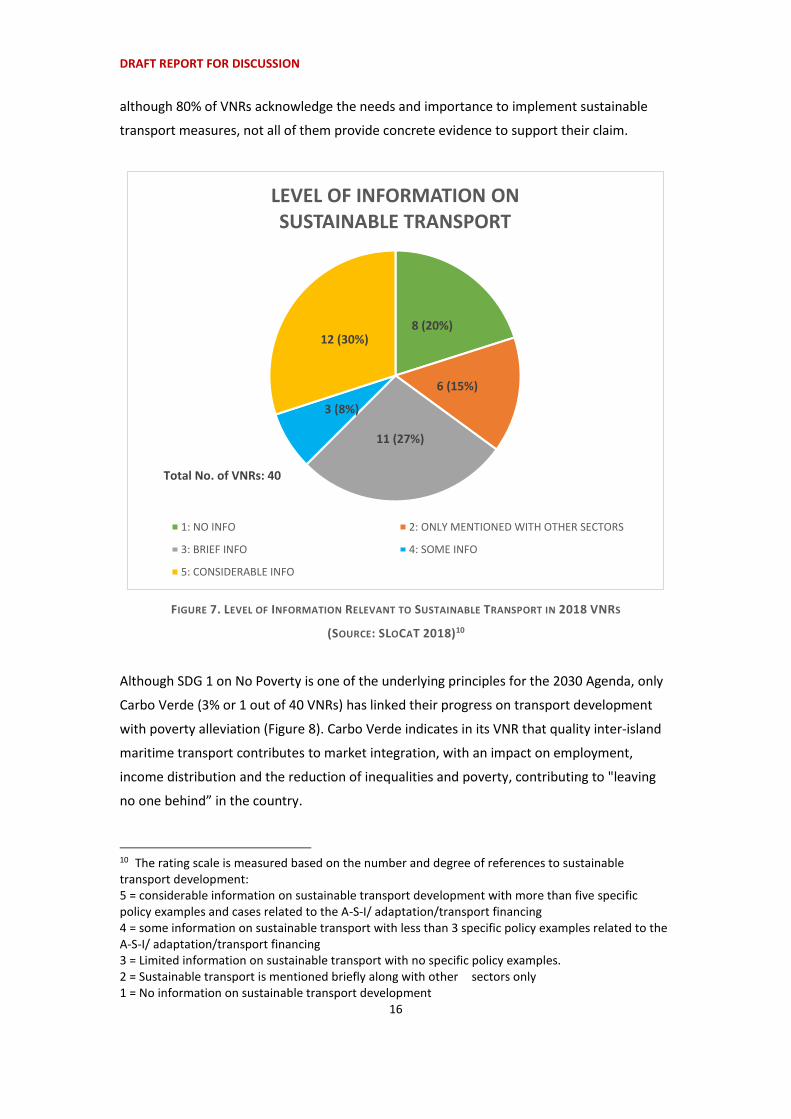
DRAFT REPORT FOR DISCUSSION
16
although 80% of VNRs acknowledge the needs and importance to implement sustainable
transport measures, not all of them provide concrete evidence to support their claim.
FIGURE 7. LEVEL OF INFORMATION RELEVANT TO SUSTAINABLE TRANSPORT IN 2018 VNRS
(SOURCE: SLOCAT 2018)10
Although SDG 1 on No Poverty is one of the underlying principles for the 2030 Agenda, only
Carbo Verde (3% or 1 out of 40 VNRs) has linked their progress on transport development
with poverty alleviation (Figure 8). Carbo Verde indicates in its VNR that quality inter-island
maritime transport contributes to market integration, with an impact on employment,
income distribution and the reduction of inequalities and poverty, contributing to "leaving
no one behind” in the country.
10 The rating scale is measured based on the number and degree of references to sustainable transport development: 5 = considerable information on sustainable transport development with more than five specific policy examples and cases related to the A-S-I/ adaptation/transport financing 4 = some information on sustainable transport with less than 3 specific policy examples related to the A-S-I/ adaptation/transport financing 3 = Limited information on sustainable transport with no specific policy examples. 2 = Sustainable transport is mentioned briefly along with other sectors only 1 = No information on sustainable transport development
8 (20%)
6 (15%)
11 (27%)
3 (8%)
12 (30%)
LEVEL OF INFORMATION ON SUSTAINABLE TRANSPORT
1: NO INFO 2: ONLY MENTIONED WITH OTHER SECTORS
3: BRIEF INFO 4: SOME INFO
5: CONSIDERABLE INFO
Total No. of VNRs: 40

DRAFT REPORT FOR DISCUSSION
17
FIGURE 8. SHARE OF COUNTRIES WITH REFERENCES TO TRANSPORT DEVELOPMENT BENEFITS
(SOURCE: SLOCAT 2018)11
While the provision of reliable and affordable transport infrastructure and services is key to
increasing agricultural production and food security (SDG 2), only Mexico and Niger have
made this linkage in their VNRs. Mexico indicates that improved planning and investment in
transport is important to enhance transport access and contribute to a sustainable
agricultural production model. Niger’s Development Strategy for Sustainable and Inclusive
Growth12 plans to reduce by approximately 50% the cost and travel time along major
corridors in order to increase national and international trade flows and facilitate access to
urban centers for agricultural products.
.
The contribution of transport to SDG target 3.6 on road safety has been highlighted by 12
out of 40 VNRs (30%). Greece has developed the Strategic Plan for the Improvement of Road
11 This figure is referring to transport-related development benefits. Reference to the SDGs are covered under figure 3. 12 Stratégie de Développement Durable et de Croissance Inclusive (Sddci) Niger 2035 https://www.nigerrenaissant.org/sites/default/files/pdf/synthse-sddci.pdf
3%5%
30%
10%13%
25% 25%
33%
13%
PO
VE
RT
Y A
LL
EV
IAT
ION
FO
OD
SE
CU
RIT
Y
RO
AD
SA
FE
TY
AIR
PO
LL
UT
ION
UR
BA
N A
CC
ES
S
RU
RA
L A
CC
ES
S
RE
GIO
NA
L C
ON
NE
CT
IVIT
Y
SO
CIA
L I
NC
LU
SIO
N/
EQ
UIT
Y
CO
NG
ES
TIO
N
SHARE OF VNRS WITH REFERENCES TO TRANSPORT DEVELOPMENT BENEFITS
SDG 11SDG 9SDG 3SDG 2SDG 1
Total No. of VNRs: 40
DRAFT REPORT FOR DISCUSSION
18
Safety in Greece (2011-2020) which gives particular emphasis on educating children and
youth. An e-learning platform called “E-Drive Academy” has been launched and a road safety
course is introduced in the primary school curricula. Malta has adopted the Road Safety
Strategy in 2014 which sets out a 10-year plan for safer land transport systems with the aim
of achieving 50% reduction in fatalities, 30% reduction in grievous injuries, and 20%
reduction in slight injuries by 2024. The United Arab Emirates (UAE) has conducted a project
with the aim to reduce road traffic deaths on five of the most dangerous roads in the UAE by
21%. In the first 100 days of implementation, a reduction of 63% was achieved. This solution
will now be rolled out across the other main roads country-wide. In terms of curbing air
pollution, Ireland has implemented train configuration changes and eco-driving initiatives in
the public transport sector.
The contribution of transport to enhancing urban access (SDG indicator 9.1.2) is only
addressed by 5 out of 40 VNRs (13%). Australia’s Plan Melbourne includes the creation of
“20-minute neighborhoods” that offer accessible, safe and attractive local areas where
people can meet most of their everyday needs within a 20-minute walk, cycle or local public
transport trip. Andorra promotes intermodality and mobility which favors people as well as
transportation collective vis-à-vis the individual. Contribution of transport to enhancing rural
access, which has a direct link to SDG indicator 9.1.1, is mentioned by 10 out of 44 VNRs
(25%). Lao PDR has reported that around 85% of its rural population now live in villages with
all-weather road access. Romania has adopted a budget allocation model proposed aiming
at increasing the share of funding for social objectives (i.e. schools, medical care facilities)
for equipping rural areas and at increasing the share of funding for county roads, essential
for the local road transport network as they connect all localities to functional urban areas.
Sri Lanka has also conducted the Gemi Sariya project, which aims to provide reliable and
economical passenger transport services to the public who lack access to transport facilities
in rural areas.
Regional connectivity, which has a heavy focus on trade and economic development, is also
addressed by 10 out of 40 VNRs (25%). Bhutan, Carbo Verde, Egypt, Greece, Lebanon and
Poland indicates how maritime transport and aviation development contribute to territorial
cohesion and increased economic opportunities. Kiribati indicates that transport and ICT
infrastructure is a key component for the country in bringing the nation together and
enabling access to international markets. Latvia uses the example of the Rail Baltica as a
project for the decarbonization of transport which provides passengers with sustainable
high-speed mobility and offer new rail freight and trade opportunities throughout the Baltic
region.

DRAFT REPORT FOR DISCUSSION
19
13 out of 40 VNRs (33%) have specifically identified transport measures for the purpose of
enhancing social inclusion and equity, including improving access to transport for women,
girls, elderly, people with disabilities, and other socially vulnerable groups. For example,
Egypt has passed legislation in 2018 which requires transport service providers to dedicate
space for disabled commuters. Latvia has provided free public transport for persons with
disabilities, orphans and other socially vulnerable groups and families with three and more
children are entitled to a 25% discount for public transport. Sri Lanka has started the Sisu
Sariya which provides reliable and concessionary bus service for school children. Singapore
has also upgraded its public transport facilities with barrier-free entrance to lifts, tactile
guidance system, and wheelchair-accessible toilets, and priority queue zones for passengers
in need. By 2020, all public buses will be wheelchair-accessible in Singapore.
Congestion reduction, which is another important impact related to sustainable transport
systems (SDG 11), is mentioned by 5 out of 40 VNRs (13%). Bahamas has received support
from the Inter-American Development Bank for its New Providence Transport Programme to
improve public road system and reduce congestion. Lebanon indicates that work is also
underway to ease traffic and congestion through a large public transport project in Beirut
and its suburbs. Malta also conduct projects with the aim of addressing traffic congestion by
addressing bottlenecks and using tidal traffic systems. Singapore is also developing a study
on the development of an underground goods mover system to reduce freight transport on
roads.
2. Data reported to show progress in the transport sector
Quantitative data to illustrate progress on the transport-related SDGs are provided in 17 out
of 40 VNRs (43%), with the majority of data reported related to SDG 9.13 Albania, Benin,
Guinea, Ireland, Lebanon, Senegal and Sri Lanka report on data related to SDG indicator
9.1.2 (passenger and freight volumes, by mode of transport (port, rail, and aviation)). Other
countries report data related, but not directly the same, with indicator 9.1.2. For example,
Ecuador reports on its Airport Infrastructure Quality Index, Lithuania reports on the volume
of freight transport relative to Gross Domestic Product (GDP) index, Vietnam reports on the
growth rate of total number of passengers transported by roads, railways, airports and
sea-river ports.
13 A list of countries and their respective data reported in the VNRs are listed under Annex III.
DRAFT REPORT FOR DISCUSSION
20
Guinea, Senegal and Sri Lanka report data related to SDG indicator 9.1.1 (proportion of the
rural population who live within 2 km of an all-season road). Other countries report on road
infrastructure expansion and maintenance, such as Ecuador and Mali reporting on the
expansion of state road networks (without particular indication for access to all-season
roads) and Latvia reporting on the share of roads with black surface among all local roads.
For SDG 11, a few countries report to data related to public transport, such as Ireland and
Lithuania (share of collective transport modes in total passenger land transport by
vehicle/train), Latvia (passenger turnover in public transport and the share of public
transport in total domestic passenger volume), Lebanon (use of public transport - buses,
service taxis, and private cars), and Sri Lanka (growth in number of passengers using public
transport). Ireland, Mali, Mexico, and Uruguay also report on data related to accessibility to
public transport. Poland reports on a more comprehensive context through the "Index of
multimodal accessibility of transport."14
Data reporting related to SDG 7 on energy efficiency in the transport sector comes in various
indicators and formats. Poland is the only country reporting on the share of renewable
energy in transport. It also report on the share of its urban bus fleet powered by alternative
fuels. Romania reports on its transport sector’s share of total final energy consumption. Sri
Lanka reports on demand for energy by major user categories, while Ireland reports data on
average new car efficiency and average Carbon Dioxide (CO2) emissions per km from new
passenger cars.
Malta and Sri Lanka are the only two countries reporting data on road safety under SDG
indicator 3.6.1 on death rate due to road traffic injuries.
While these countries set examples on providing data to demonstrate their progress in
implementing SDGs 3, SDG 7, SDG 9 and SDG 11, there remain inconsistencies in the formats,
units, and time spans of the limited data sets provided in these VNRs, which is a common
issue to the previous two rounds of VNRs.
3. Transport-related targets in VNRs
Setting specific, quantified targets is an important element in establishing a vision and
tracking progress toward sustainable transport development. In the previous two rounds of
VNRs in 2016 and 2017, quantified targets for the transport sector were not set by many
14 Tomasz, K, P. Rosik, M. Stepniak, and K. Kowalczyk. 2018. Evaluation and Monitoring of Accessibility Changes in Poland Using the MAI Indicator. https://bit.ly/2Kwi5ps

DRAFT REPORT FOR DISCUSSION
21
countries. In 2018, 13 out of 40 countries (or 33% of VNRs) include targets for sustainable
transport development, which is a significant increase from 2017 (only 8 out of 43 countries,
or 19% of total submissions in 2017 reported transport targets).15
10 countries have reported quantified targets related to SDG 7. Ireland, Latvia, Lithuania,
and Malta have set targets to increase the share of renewable energy in total final energy
consumption of the transport sector. Lebanon and Lithuania set targets related to the fuel
efficiency of vehicles. Singapore includes targets to increase uptake of shared electric vehicle
and charging infrastructure, while Uruguay sets targets to increase electric vehicles in its
public transport fleet. Five countries have set targets related to public transport, such as
Senegal’s target to increase the proportion of population with easy access to public
transport by 50% by 2030 and Singapore’s target that by 2020, all public buses will be
wheelchair-accessible.
Very few targets are related to the other SDGs with direct transport indicators. Senegal is
the only country setting a target on rural access, and Malta and Saudi Arabia are the only
countries reporting on specific targets for road safety (i.e. reduction in fatalities and injuries).
Saudi Arabia also reports quantified targets for improving international logistics
performance and congestion reduction and Niger is the only country reporting a target on
reducing the cost and travel time along major transport corridors.
4. References to transport policy measures (Avoid-Shift-Improve)
The A-S-I framework is an alternative approach to categorize sustainable mobility solutions
in the context of GHG emission reductions, reduced energy consumption, less congestion,
and more livable cities:16
⚫ “Avoid” measures seek to improve the efficiency of the transport system as a whole
through integrated land-use planning and transport-demand management to reduce
the need to travel and the length of transport trips.
⚫ “Shift” measures seek to improve trip efficiency by increasing modal shift from the
most energy consuming transport modes (e.g. private motorized vehicles) to more
environmentally friendly modes (e.g. public transport, cycling and walking).
15 A list of countries with specific, quantified transport targets reported in the VNRs can be found under Annex IV. 16 Deutsche Gesellschaft für Internationale Zusammenarbeit GmbH or GIZ. Sustainable Urban Transport: Avoid- Shift-Improve (A-S-I). http://bit.ly/1ZAUq56
DRAFT REPORT FOR DISCUSSION
22
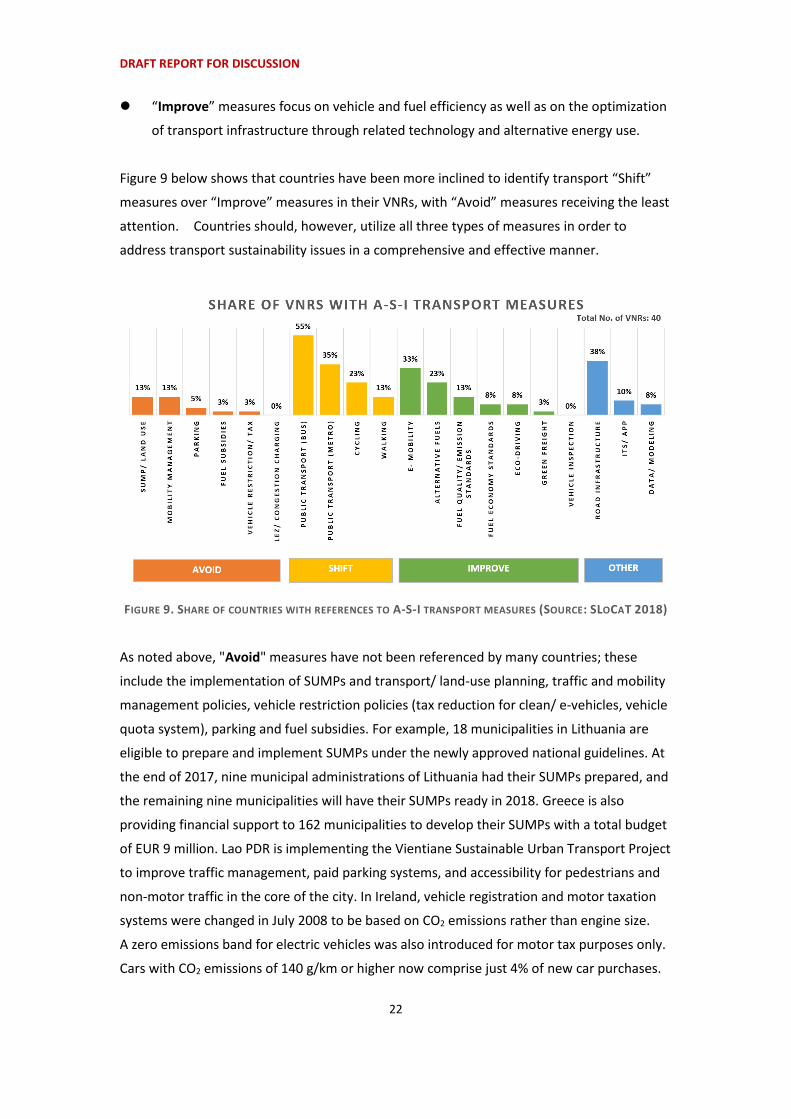
⚫ “Improve” measures focus on vehicle and fuel efficiency as well as on the optimization
of transport infrastructure through related technology and alternative energy use.
Figure 9 below shows that countries have been more inclined to identify transport “Shift”
measures over “Improve” measures in their VNRs, with “Avoid” measures receiving the least
attention. Countries should, however, utilize all three types of measures in order to
address transport sustainability issues in a comprehensive and effective manner.
FIGURE 9. SHARE OF COUNTRIES WITH REFERENCES TO A-S-I TRANSPORT MEASURES (SOURCE: SLOCAT 2018)
As noted above, "Avoid" measures have not been referenced by many countries; these
include the implementation of SUMPs and transport/ land-use planning, traffic and mobility
management policies, vehicle restriction policies (tax reduction for clean/ e-vehicles, vehicle
quota system), parking and fuel subsidies. For example, 18 municipalities in Lithuania are
eligible to prepare and implement SUMPs under the newly approved national guidelines. At
the end of 2017, nine municipal administrations of Lithuania had their SUMPs prepared, and
the remaining nine municipalities will have their SUMPs ready in 2018. Greece is also
providing financial support to 162 municipalities to develop their SUMPs with a total budget
of EUR 9 million. Lao PDR is implementing the Vientiane Sustainable Urban Transport Project
to improve traffic management, paid parking systems, and accessibility for pedestrians and
non-motor traffic in the core of the city. In Ireland, vehicle registration and motor taxation
systems were changed in July 2008 to be based on CO2 emissions rather than engine size.
A zero emissions band for electric vehicles was also introduced for motor tax purposes only.
Cars with CO2 emissions of 140 g/km or higher now comprise just 4% of new car purchases.

DRAFT REPORT FOR DISCUSSION
23
"Shift" measures are included in the greatest number of countries, as urban public transport
is part of SDG 11 which is being reviewed this year. These policy measures include bus-based
public transport development (e.g. public bus services, Bus Rapid Transit (BRT)), metro
systems, cycling and walking policies). For instance, A BRT project is being tested Lebanon
for feasibility and the design concept proposes a re-configuration of the Beirut ring road to
include BRT as part of the network. Poland is conducting a review of measures needed to
develop low-carbon public transport, including solutions for the transition to low-carbon
rolling stock in public transport and low-carbon vehicles. Singapore has introduced the
"Walk Cycle Ride SG” program to make walking, cycling, and riding public transport a way of
life for its people. A Walking and Cycling Plan was developed to encourage high pedestrian
and cyclist traffic. Developers are incentivized to provide bicycle lots and supporting facilities
through exemption of these spaces from the gross floor area calculation. More covered
walkways are being constructed so that people can walk to train stations, bus interchanges,
and neighborhood amenities comfortably regardless of the weather. To date, 120 kilometers
of sheltered walkways have been constructed, with 200 kilometers planned for completion
by end-2018.
"Improve" measures are covered in fewer VNRs than "Shift" measures but more than 1/3 of
countries refer to electric mobility measures. Shift also cover measures for introducing
alternative fuels and energy efficient vehicles, improving fuel quality and vehicle emission
standards, fuel economy standards, eco-driving and green freight programs. For example,
Andorra has provided direct aids and incentives to ensure that by 2050, half of the car fleet
of the country consists of electric vehicles. In Latvia, the government has approved the
Alternative Fuel Development Plan 2017-2020 to promote the use of compressed or
liquefied natural gas, hydrogen, biofuels, and electricity in transport. Malta has allocated a
total of €50,000 to a scheme in which vehicle owners are compensated when converting
their diesel/petrol vehicle to liquefied petroleum gas. In 2017, 220 vehicles benefited from
this scheme. Malta is also conducting feasibility studies on increasing the use of LNG in
maritime transport. Similarly, Singapore has established the Maritime Singapore Green
Initiative (MSGI) with pledged to invest up to S$100 million over a five-year period to the
Green Ship Programme, Green Port Programme and Green Technology Programme. MSGI
also supports local maritime technology companies in developing and deploying green
technologies through co-funding grants of up to 50% of the qualifying costs. Uruguay is
working to introduce electric taxis and buses in Montevideo, with plans to reach 300 e-taxis
and 100 e-buses in the next two years.
DRAFT REPORT FOR DISCUSSION
24
Other transport policy measures mentioned include road infrastructure expansion and
rehabilitation, application of Intelligent Transport Systems (ITS) and development of
transport phone applications, and improvement in data collection and modeling for the
transport sector. Road infrastructure is a primary example of transport sector expansion for
Bhutan, Ecuador, Guinea, Mali, and Malta; while other countries such as Carbo Verde,
Greece, and Romania consider road infrastructure expansion as a solution to improve poor
rural access, relieve urban congestion, and enhance employment and other socio-economic
opportunities. In Romania, the Oradea City App application helps to improve the
convenience to use public transport by allowing users to pay for public transport or parking.
Information is also provided on the routes of different bus or tram lines or public parking
system in the city. Australia is improving road safety and conditions through better data
collection and analysis. Industries including transport, agriculture, and aviation are adopting
technologies like Geoscience Australia’s National Positioning Infrastructure program,17 and
Foundation Spatial Data Framework18 to improve performance.
5. References to transport adaptation measures
Although the 2030 Agenda focuses on a broad set of sustainable development issues, its
linkages to climate change mitigation and adaptation are significant. In the context of
transport, SDG Target 9.1 calls for the development of low carbon and resilient transport
infrastructure, which is closely tied to achieving SDG Goal 13 on climate action. Climate
adaptation in the transport sector is necessary for both developed and developing countries,
as transport systems worldwide are vulnerable to the increasing impacts of extreme
weather, and rapid motorization increases the potential for catastrophic impacts. Crucially,
sustainable transport systems must adapt to climate change to maintain reliability to enable
transport’s role in economic and social development. Many sustainable transport solutions
can combine increased mitigation potential and resilience as mutual benefits (e.g. during the
Great East Japan Earthquake in 2011, high-speed rail proved to be more resilient than
conventional rail transport infrastructure). In short, adaptation in transport sector is a crucial
pre-condition to provide universal access, increase and maintain efficiency of transport
system, ensure safety of road users, and contribute to sustainable, resilient mobility for all.
In the submitted VNRs in 2018, ample examples have been made to transport policy
measures related to the Avoid-Shift-Improve framework, which has a strong orientation on
climate change mitigation and decarbonization in the transport sector. References to
transport adaptation are, however, very limited.
17 National Positioning Infrastructure. https://bit.ly/2gXQuh7 18 Foundation Spatial Data Framework. http://fsdf.org.au/
DRAFT REPORT FOR DISCUSSION
25
Only 5 out of 40 VNRs (13%) have included specific references related to transport
adaptation. In Bhutan, 94 village block (or “Gewog”) roads have been black-topped and 37
are underway as of 2016 in order to make the road infrastructure more resilient to impacts
of climate change. For Lao PDR, the new Road Sector II Project is part of the country’s
national program to build climate-resilient roads and infrastructure. Singapore ensures that
public transport networks are protected by raising the minimum crest levels for entrances to
underground facilities such as the metro stations. At Changi Airport, the future Terminal 5
will be built 5.5 meters above the mean sea level as a precaution, higher than the minimum
height of four meters.
IV. Conclusions and Recommendations
The analysis described in the previous sections makes it clear that there is considerable
scope for improvement in the treatment of sustainable transport in the VNR process.
1. Despite a slight improvement from 2016 and 2017, gaps remain in
reporting on transport and its contribution to sustainable
development in VNRs submitted in 2018
Transport has generally gained increased attention in the SDG review process over the years.
In the first round of VNR submission in 2016, only 64% of the 22 submitted VNRs contained
references to transport with not all references sustainability-specific. In 2017, 98% of the 43
submitted VNRs have some degree of reference to the transport sector, with 35% of
submission giving specific examples to link transport with sustainable development impacts.
In the third round of VNR submission in 2018, references to the transport sector have been
included in 95% of the VNRs submitted so far (38 out of 40 VNRs).
Nevertheless, there remains a tendency in a number of VNRs to merely report on outputs
(e.g. kilometers of highways built or kilometers of rail constructed) without demonstrating
linkages to broader development goals. 80% of VNRs refer to the role of sustainable
transport in achieving the SDGs but only 12 out of 40 VNRs (30%) offer considerable
information with specific cases and policy examples on sustainable transport. The majority
of VNRs fall short to offer any concrete evidence and policy measures to demonstrate their
commitment to achieve sustainable transport.

DRAFT REPORT FOR DISCUSSION
26
On the other hand, with SDG 11 in review, the issue on social equity and inclusive urban
transport has received increased attention. In addition, SDG 3 on Road Safety and SDG
indicator 9.1.1 on rural access have been mentioned in more than a quarter of the
submitted VNRs. Other key sustainability issues related to SDG 9 and SDG 11, including
urban access, congestion and air pollution, have only been mentioned by around 10% of
VNRs. Although SDG 1 on No Poverty is one of the underlying principles for the 2030 Agenda,
only one country has linked its progress on transport development with poverty alleviation
and no country has made any reference to transport in the context of food security (SDG 2)
or food loss and waste (SDG 12), though the latter is a specific focus of this year's VNRs.
At the same time, there is ample evidence of sustainable transport policies and measures in
the 2018 VNR countries, which could be reported in a more substantive manner. For
example, Mexico, has been a leading example for sustainable transport development and its
capital, Mexico City, has won the Sustainable Transport Award by the Institute for
Transportation and Development Policy (ITDP). A wide range of recent best practices, case
studies, and reports related to the implementation of sustainable, low carbon transport in
Mexico is available on various sources and database (e.g. ITDP’s Mexico Archive, Mexico’s
Transport NAMA, World Resources Institute Archive on Mexico), yet the country has only
reported very briefly on transport without citing any specific examples in its VNR.
The VNR process was set up to facilitate the sharing of experiences, including successes,
challenges and lessons learned, with a view to accelerating the implementation of the 2030
Agenda. The VNRs are also expected to support the strengthening of policies and institutions
and to mobilize multi-stakeholder support and partnerships for the implementation of the
SDGs. VNRs deal with this guidance mostly in a fairly general manner, and therefore sector
related information, including for the transport sector, is often present in a cursory and
qualitative manner. This limits the use of VNRs as a tool to inspire and guide other countries
in taking greater sector-based action in support of the targets set by the SDGs.
2. Data to illustrate progress on transport-related SDGs are not always
provided in the VNRs in a consistent format or level of detail, which
creates challenges to measure progress over time.
43% of VNRs submitted in 2018 have provided data to demonstrate their progress in
implementing SDGs 3, SDG 7, SDG 9 and SDG 11, which is a significant increase from last
year’s data reporting (18% of VNRs submitted in 2017 reported data related to the transport
sector). However, there remain inconsistencies in the formats, units, and time spans of the

DRAFT REPORT FOR DISCUSSION
27
limited data sets provided in these VNRs, which is a common issue to the previous two
rounds of VNRs.
The majority of data reported in the VNRs are related to SDG 9 on passenger and freight
volume by transport modes, while a few countries report data related to other transport
indicators such as road safety (3.6.1), energy efficiency and the share of renewable energy
use in transport (7.2.1), rural access (9.1.1), and access to public transport (11.2.1).
However, the data are not always reported according to the official SDG indicator
framework. For example, instead of reporting on the proportion of the rural population who
live within 2 km of an all-season road, some countries report on the expansion and
maintenance of road infrastructure; instead of reporting on the proportion of population
that has convenient access to public transport, some countries report on share of public
transport in passenger transport activities or the intermodality accessibility of transport.
3. There is need to set more specific, quantified targets aligned with the
transport-related SDGs
Setting specific, quantified targets is an important element in establishing a vision and
tracking progress toward sustainable transport development. In the previous two rounds of
VNRs in 2016 and 2017, quantified targets for the transport sector were not set by many
countries. In 2018, 13 countries (or 33% of VNRs) include targets for sustainable transport
development, which is a significant increase from 2017.
The majority of targets reported are related to SDG 7 on increasing the share of renewable
energy in the transport sector, fuel efficiency, and electric mobility development. Very few
targets are being reported on direct transport indicators such as road safety (SDG 3.6.1),
rural access (SDG indicator 9.1.1), and access to inclusive public transport (SDG 11.2.1). No
quantified targets have been reported for direct transport indicators for SDG 9.1.2 on
passenger and freight volume and SDG 12.c.1 on fossil fuel subsidies. This shows that
although it is positive that slightly more countries have reported on setting their quantified
targets for sustainable transport, more effort is still required for them to set goals which are
aligned with the SDG indicator framework.
It is recommended that countries consider setting specific, quantified targets aligned with
the following SDG targets:

DRAFT REPORT FOR DISCUSSION
28
• Increasing substantially the share of renewable energy in the transport sector
(Target 7.2)
• Doubling the rate of improvement in transport energy efficiency (Target 7.3)
• Increasing modal shift to public transport through expansion of metro, BRT and
bike-sharing systems, and increasing uptake of e-mobility in public transport fleets
(Target 11.2)
• Reducing food losses along production/supply chains through improved rural
transport access (Target 12.3)
• Phasing out inefficient fossil fuel subsidies that encourage wasteful consumption,
particularly in the transport sector (Target 12.c)
4. There is increased attention to transport in the VNRs but not in the
SDG Progress Reports
While transport has generally gained increased attention in VNRs since the first year of the
HLPF, transport does not appear to be receiving a comparable increase in attention in the
SDG progress reports released by the UN Secretary-General.
UN Secretary-General Antonio Guterres has issued the 2018 SDG progress report titled,
“Progress towards the Sustainable Development Goals.” The report provides the third
account of where the world stands at the implementation of the 2030 Agenda. It gives an
overview of all 17 SDGs using data currently available to highlight the most significant gaps
and challenges. The data presented are based on the global SDG indicator framework and
are produced by national statistical systems.
Table 1 presents all the transport-related references of the 3rd SDG Progress Report 2018:
TABLE 1. REFERENCES TO TRANSPORT IN THE 2018 SDG PROGRESS REPORT
SDG Reference (Excerpt)
SDG 3 (Good Health and
Well-being)
Road traffic crashes killed 1.25 million people worldwide in 2013 and
injured up to 50 million more.
SDG 9 (Industry,
Innovation, and
Infrastructure)
Total official flows for economic infrastructure in developing
countries reached $56 billion in 2016, a slight decrease from 2015 but
an increase of 27 per cent in real terms since 2010. The main
recipient sectors continue to be transport and energy.
SDG 11 (Sustainable Cities Globally, as cities are absorbing more inhabitants, they are also

DRAFT REPORT FOR DISCUSSION
29
SDG Reference (Excerpt)
and Communities) becoming less dense. The average rate of physical expansion of cities
is about one and a half times that of population growth. The regions
that are experiencing the most rapid urban expansion—Eastern and
Southeastern Asia, sub-Saharan Africa and Central and Southern
Asia—are also recording the highest ratios. Some of the forces driving
this urban expansion include rising per capita incomes, cheaper
agricultural lands on the outskirts of cities, more efficient transport
and the proliferation of informal settlements.
The attention given to the transport sector has decreased compared to last year’s progress
report. In last year, the SDG Progress Report built linkages between transport and several
SDG targets, such as SDG 3.6 (road safety), SDG 3.9 (public health), SDG 7.3 (sustainable
energy consumption), and SDG 9.1 (economic development). In the new report in 2018, only
very general descriptions were made related to transport financing and urban transport.
The SDG progress reports have demonstrated effort from the sustainable development
process to capture the progress made towards achieving the SDGs. However, it is clear that
these reports have yet to measure progress in a structured and coherent manner,
particularly in the transport sector.
The process for development of the annual SDG progress report is not clear and it is
apparent that better linkages with organizations and groups (e.g. UN agencies, development
organizations, academe) collecting relevant data on transport and SDGs could have
improved the coverage of transport in the progress report19. For now, it appears that the
VNRs and SDG progress reports are two separate processes. This is in part caused by the
timing of the VNRs. The SDG progress report is prepared before the VNRs have been
submitted.
5. There is an opportunity to draw upon other reporting frameworks for
sustainable transport in formulating VNRs
It is clear that substantial progress in sustainable transport development is being made in
many of the countries in the world; yet, the VNRs and SDG progress report lacks the
19 Examples include the Global Status Report on Road Safety by the World Health Organization, the Logistics Performance Index developed by the World Bank, and the UNCTAD stat database on Maritime Transport, developed by the United Nations Conference and Trade and Development.

DRAFT REPORT FOR DISCUSSION
30
necessary structure and framework to report such progress. This gap underscores the need
for actors in the transport sector to develop complementary status reports.
The SLoCaT Partnership is leading the development of a Transport and Climate Change
Global Status Report (TCC-GSR),20 which aims to provide a resource for national and
sub-national policy-makers to measure progress on transport mitigation and adaptation and
increase transport ambition in their country reporting to global processes, especially the
Nationally Determined Contributions (NDCs) and long-term plans. The report will provide a
central data repository for monitoring transport and climate-relevant indices in global
agreements (e.g. Paris Agreement, SDGs, the New Urban Agenda, and related processes).
Another framework to measure progress in sustainable transport is the Global Mobility
Report (GMR) developed under the Sustainable Mobility for All initiative. The GMR is built
around three components: a vision for sustainable mobility articulated around four global
objectives (Universal Access, Efficiency, Safety, and Green Mobility); global targets drawn
from international agreements; and transport-relevant indicators supported by country data
and agreed methodologies.
The development of these various tracking frameworks can help to create a more
comprehensive picture of the status of sustainable transport on global, regional, and local
levels; however, these individual reporting initiatives are currently independent from the
HLPF process and current VNR reporting structure. It is thus important that the HLPF draws
from relevant transport reporting mechanisms and that these mechanism be integrated
more fully into policy discussions around the formulation of VNRs in 2019 and in future
years.
20 The TCC-GSR is scheduled to be released in December 2018. For more information, please contact Alice Yiu at [email protected].
DRAFT REPORT FOR DISCUSSION
31
Annex I: List of countries submitting VNRs to HLPF 2018
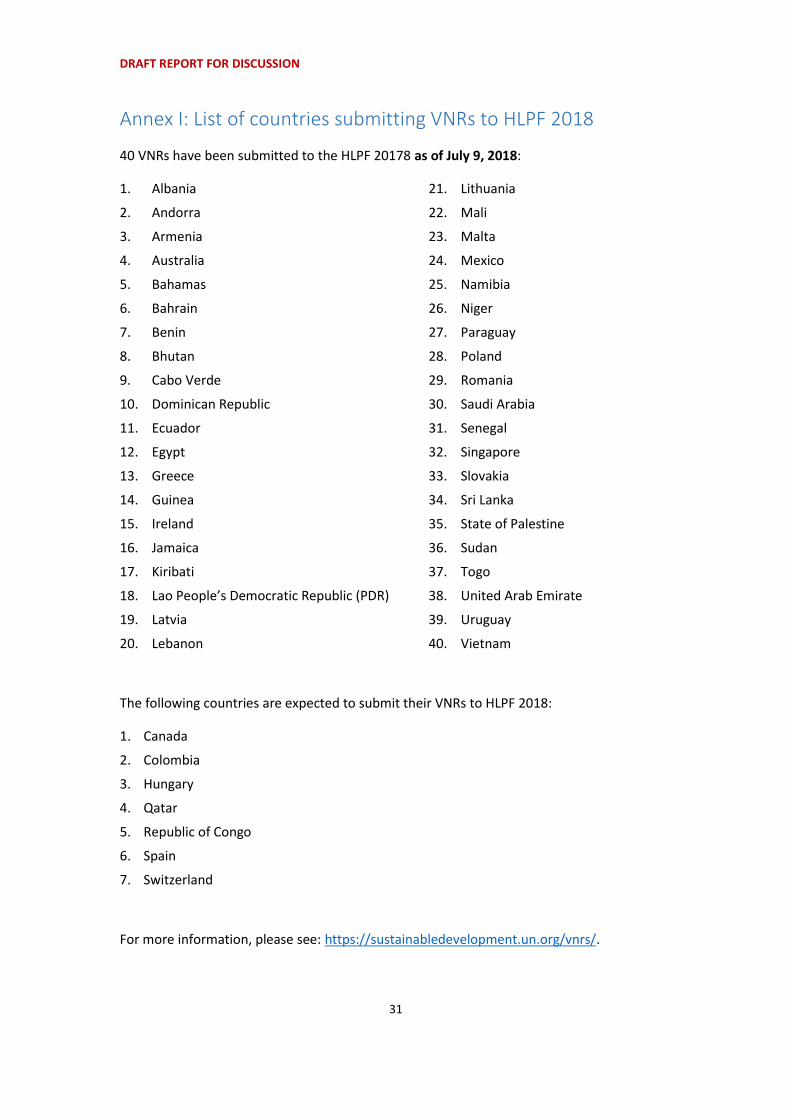
40 VNRs have been submitted to the HLPF 20178 as of July 9, 2018:
1. Albania
2. Andorra
3. Armenia
4. Australia
5. Bahamas
6. Bahrain
7. Benin
8. Bhutan
9. Cabo Verde
10. Dominican Republic
11. Ecuador
12. Egypt
13. Greece
14. Guinea
15. Ireland
16. Jamaica
17. Kiribati
18. Lao People’s Democratic Republic (PDR)
19. Latvia
20. Lebanon
21. Lithuania
22. Mali
23. Malta
24. Mexico
25. Namibia
26. Niger
27. Paraguay
28. Poland
29. Romania
30. Saudi Arabia
31. Senegal
32. Singapore
33. Slovakia
34. Sri Lanka
35. State of Palestine
36. Sudan
37. Togo
38. United Arab Emirate
39. Uruguay
40. Vietnam
The following countries are expected to submit their VNRs to HLPF 2018:
1. Canada
2. Colombia
3. Hungary
4. Qatar
5. Republic of Congo
6. Spain
7. Switzerland
For more information, please see: https://sustainabledevelopment.un.org/vnrs/.

DRAFT REPORT FOR DISCUSSION
32
Annex II: List of transport typologies used in assessment
The list of transport modes, sub-sectors, policy measures (Avoid-Shift-Improve), and other
typologies are being used to assess the treatment of transport in the submitted VNRs in
2018.
Category Typologies
Overview
Reference on transport as challenges
Reference on transport as solutions
Info on transport (1=No info; 5 = Considerable info)
Specific reference to sustainability of transport (1=No info; 5 =
Considerable info)
Linkages to SDGs
SDG 11
SDG 9
SDG 7
SDG 3
SDG 13
SDG 12
SDG 4
SDG 2
SDG 1
Transport Modes Passenger Transport
Freight Transport
Transport
Sub-sectors
Urban Transport
Aviation
Maritime Transport
Rural Transport
Heavy Rail
Walking/ Cycling
High Speed Rail
Transport
AVOID Measures
Sustainable Urban Mobility Plan / Land use
Mobility Management
Parking
Fuel Subsidies

DRAFT REPORT FOR DISCUSSION
33
Category Typologies
Vehicle Restriction/ Taxation
Low Emission Zone/ Congestion Charging
Transport SHIFT
Measures
Public Transport (Bus)
Public Transport (Metro)
Cycling
Walking
Transport IMPROVE
Measures
Electric mobility
Alternative Fuels
Fuel Quality/ Emission Standards
Fuel Economy Standards
Eco-driving
Green Freight
Vehicle Inspection
OTHER Transport Measures
Road Infrastructure
Intelligent Transport System / Mobility Phone Application
Data collection / Modeling
Transport
Development Benefits
Poverty Alleviation
Food Security
Road Safety
Air Pollution
Urban Access
Rural Access
Regional Connectivity
Social Inclusion/ Equity
Congestion
Transport Data
SDG 3
SDG 7
SDG 9
SDG 11
SDG 13
Others
Transport Adaptation
Transport Targets
Investment in transport development
DRAFT REPORT FOR DISCUSSION
34
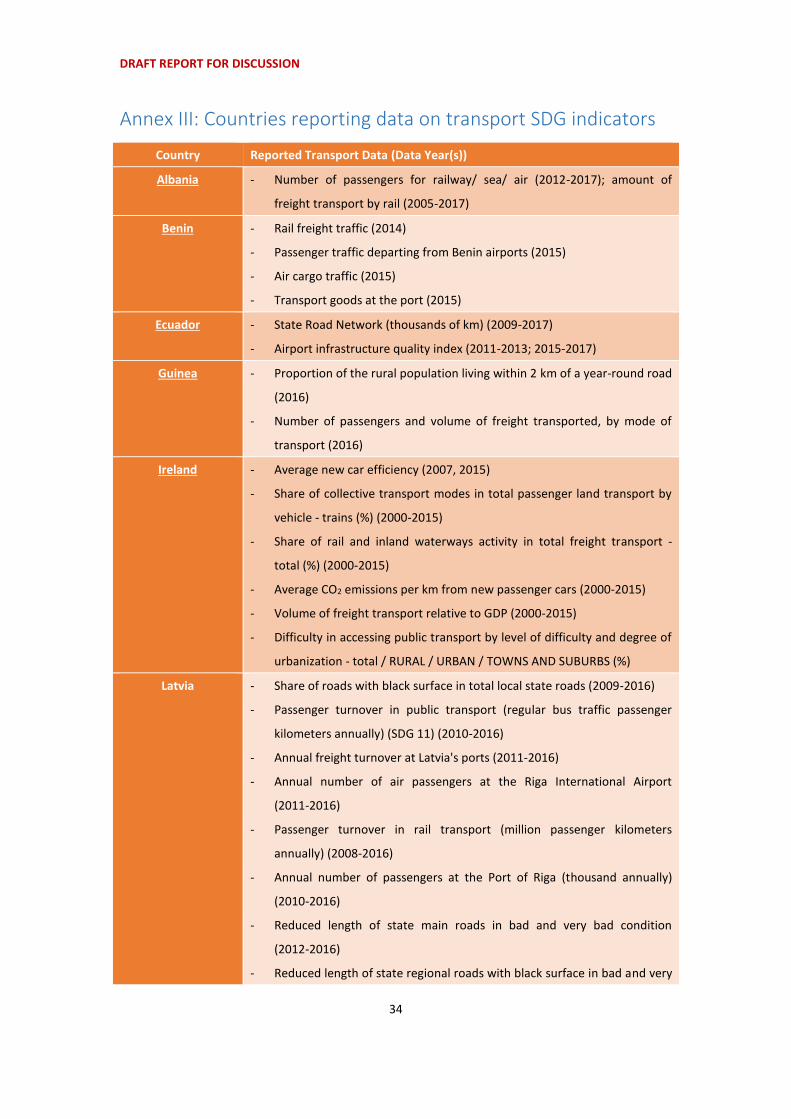
Annex III: Countries reporting data on transport SDG indicators
Country Reported Transport Data (Data Year(s))
Albania - Number of passengers for railway/ sea/ air (2012-2017); amount of
freight transport by rail (2005-2017)
Benin - Rail freight traffic (2014)
- Passenger traffic departing from Benin airports (2015)
- Air cargo traffic (2015)
- Transport goods at the port (2015)
Ecuador - State Road Network (thousands of km) (2009-2017)
- Airport infrastructure quality index (2011-2013; 2015-2017)
Guinea - Proportion of the rural population living within 2 km of a year-round road
(2016)
- Number of passengers and volume of freight transported, by mode of
transport (2016)
Ireland - Average new car efficiency (2007, 2015)
- Share of collective transport modes in total passenger land transport by
vehicle - trains (%) (2000-2015)
- Share of rail and inland waterways activity in total freight transport -
total (%) (2000-2015)
- Average CO2 emissions per km from new passenger cars (2000-2015)
- Volume of freight transport relative to GDP (2000-2015)
- Difficulty in accessing public transport by level of difficulty and degree of
urbanization - total / RURAL / URBAN / TOWNS AND SUBURBS (%)
Latvia - Share of roads with black surface in total local state roads (2009-2016)
- Passenger turnover in public transport (regular bus traffic passenger
kilometers annually) (SDG 11) (2010-2016)
- Annual freight turnover at Latvia's ports (2011-2016)
- Annual number of air passengers at the Riga International Airport
(2011-2016)
- Passenger turnover in rail transport (million passenger kilometers
annually) (2008-2016)
- Annual number of passengers at the Port of Riga (thousand annually)
(2010-2016)
- Reduced length of state main roads in bad and very bad condition
(2012-2016)
- Reduced length of state regional roads with black surface in bad and very
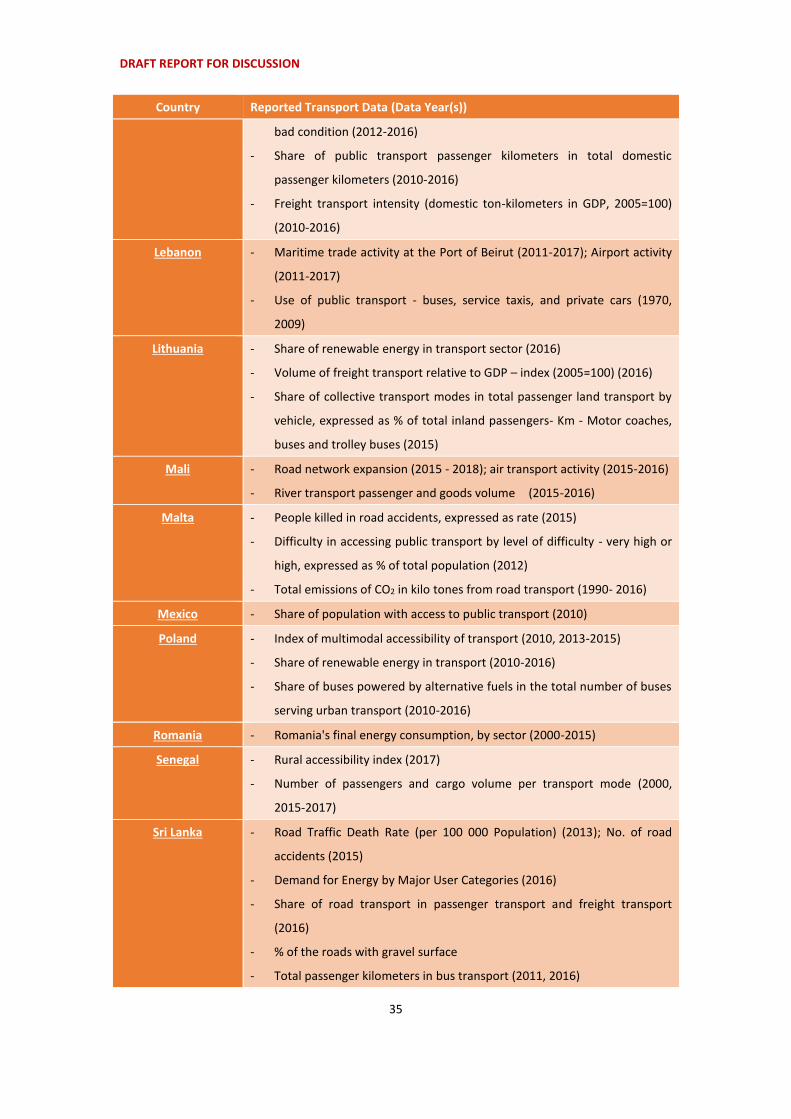
DRAFT REPORT FOR DISCUSSION
35
Country Reported Transport Data (Data Year(s))
bad condition (2012-2016)
- Share of public transport passenger kilometers in total domestic
passenger kilometers (2010-2016)
- Freight transport intensity (domestic ton-kilometers in GDP, 2005=100)
(2010-2016)
Lebanon - Maritime trade activity at the Port of Beirut (2011-2017); Airport activity
(2011-2017)
- Use of public transport - buses, service taxis, and private cars (1970,
2009)
Lithuania - Share of renewable energy in transport sector (2016)
- Volume of freight transport relative to GDP – index (2005=100) (2016)
- Share of collective transport modes in total passenger land transport by
vehicle, expressed as % of total inland passengers- Km - Motor coaches,
buses and trolley buses (2015)
Mali - Road network expansion (2015 - 2018); air transport activity (2015-2016)
- River transport passenger and goods volume (2015-2016)
Malta - People killed in road accidents, expressed as rate (2015)
- Difficulty in accessing public transport by level of difficulty - very high or
high, expressed as % of total population (2012)
- Total emissions of CO2 in kilo tones from road transport (1990- 2016)
Mexico - Share of population with access to public transport (2010)
Poland - Index of multimodal accessibility of transport (2010, 2013-2015)
- Share of renewable energy in transport (2010-2016)
- Share of buses powered by alternative fuels in the total number of buses
serving urban transport (2010-2016)
Romania - Romania's final energy consumption, by sector (2000-2015)
Senegal - Rural accessibility index (2017)
- Number of passengers and cargo volume per transport mode (2000,
2015-2017)
Sri Lanka - Road Traffic Death Rate (per 100 000 Population) (2013); No. of road
accidents (2015)
- Demand for Energy by Major User Categories (2016)
- Share of road transport in passenger transport and freight transport
(2016)
- % of the roads with gravel surface
- Total passenger kilometers in bus transport (2011, 2016)
DRAFT REPORT FOR DISCUSSION
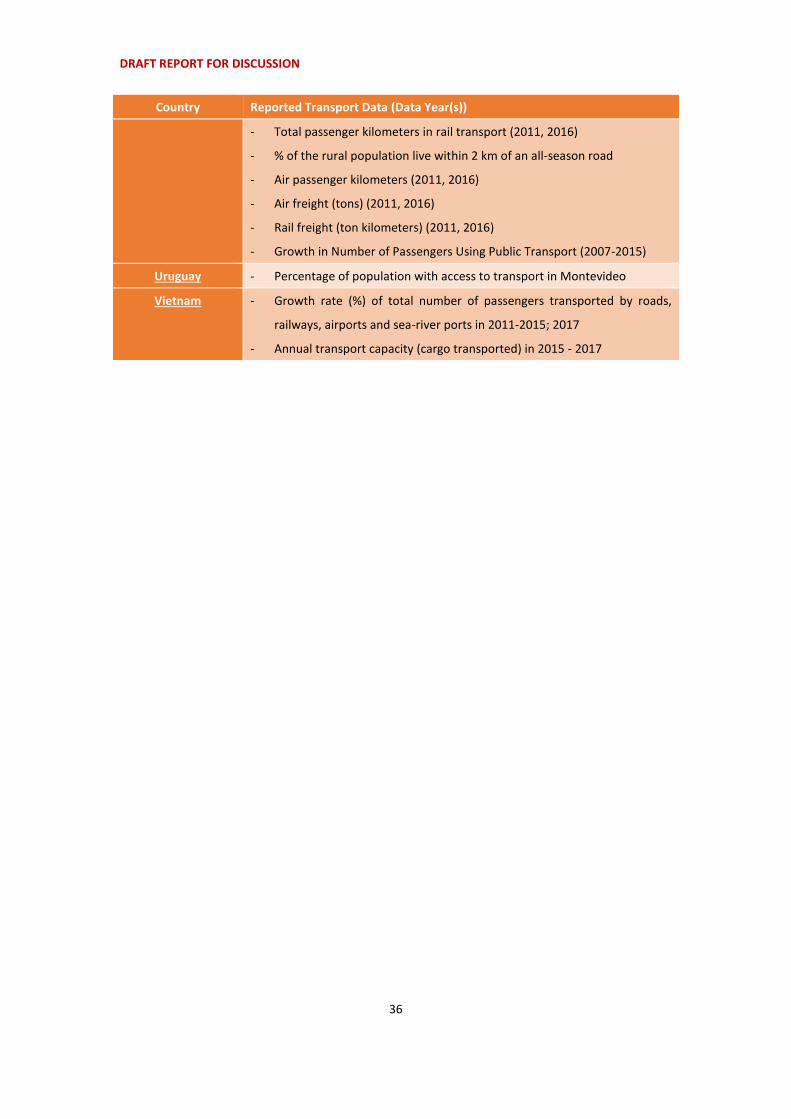
36
Country Reported Transport Data (Data Year(s))
- Total passenger kilometers in rail transport (2011, 2016)
- % of the rural population live within 2 km of an all-season road
- Air passenger kilometers (2011, 2016)
- Air freight (tons) (2011, 2016)
- Rail freight (ton kilometers) (2011, 2016)
- Growth in Number of Passengers Using Public Transport (2007-2015)
Uruguay - Percentage of population with access to transport in Montevideo
Vietnam - Growth rate (%) of total number of passengers transported by roads,
railways, airports and sea-river ports in 2011-2015; 2017
- Annual transport capacity (cargo transported) in 2015 - 2017

DRAFT REPORT FOR DISCUSSION
37
Annex IV: Countries reporting transport targets in 2018 VNRs
Country Transport Targets
Greece - SDG 13 CO2 Emission Reduction (non-ETS sectors including transport): Reduce
CO2 emissions by 16% by 2030, whereas for the LULUCF sectors Greece has to
maintain a neutral balance by 2030.
Guinea - SDG 9 Road Infrastructure: By 2020, the linear of paved roads would represent
42% of national roads.
Ireland - SDG 7 Renewable Energy: Increase the share of final energy consumption made
up of renewable energy sources 10% in the transport sector by 2020
- SDG 7 Electric Mobility and SDG 11 Public Transport: Transitioning to low
emission, including electric, buses for the urban bus fleet, and targeting just
under half of vehicle fleet to be fully electric by 2030.
Latvia - SDG 7 Renewable Energy: Achieve a 10% threshold of renewable energy
(biofuels and electricity) in the transport sector by 2020. The electricity and
transport sectors, however, are not on target.
Lebanon - SDG 7 Fuel Efficiency and SDG 11 Public Transport: Set targets for public
transport mode at 36% (unconditional) and 48% (conditional), and 20%
(conditional) for fuel-efficient vehicles by 2030.
Lithuania - SDG 7 Renewable Energy: Renewable energy accounts for 15% of energy in the
transport sector by 2030
- SDG 7 Fuel Efficiency: Reduce the use of vehicles running on conventional fuels
(petrol and diesel) in cities by 50% by 2030
- SDG 7 Renewable Energy: Renewable energy in the transport sector amount to
50% and reduce the use of vehicles running on fossil fuels in cities by 100% by
2050.
Malta - SDG 3 Road Safety: Achieve 50% reduction in fatalities, 30% reduction in
grievous injuries, and 20% reduction in slight injuries by 2024.
- SDG 7 Renewable Energy: At least 10% renewable energy share in the final
consumption of energy in transport in 2020.
Niger - SDG 9 Transport Infrastructure: Reduce by approximately 50% the cost and
travel time along major corridors
Saudi Arabia - SDG 3 Road Safety: Reduce no. of deaths / injuries per 100,000 inhabitants
(from 26 in 2018 to 20 in 2020 and 8 in 2030)
- SDG 7 Energy Consumption: Reducing energy consumption in the transport
sector: per capita tone oil equivalent Per capita (from 1.42 in 2018 to 1.32 in
2020 and 1.02 in 2030)

DRAFT REPORT FOR DISCUSSION
38
Country Transport Targets
- SDG 9 Logistics: Transform Saudi Arabia to become a logistics center -
International Logistics Performance Index score from 3.16 in (YEAR) to 3.38 in
2020 and 3.7 in 2030.
- SDG 11 Congestion: Reduce the congestion of cities (peak hours in congestion
during the year in five major cities (from 235 peak hours in 2018 to 15 peak
hours in 2020 and 10 peak hours in 2030)
Senegal - SDG 9 Rural Access: Between 2016 and 2030, guarantee access to all to a
practicable road all year round within 2 km in the rural area
- SDG 11 Public Transport: (by age group, sex and type of disability) - 50% by 2030
Singapore - SDG 7 E-mobility: Provide 1,000 shared electric vehicles and 2,000 charging
points island-wide by 2020.
- SDG 11 Modal Shift to Public Transport: 75% of morning and evening peak
journeys by 2030, and 85% by 2050, to be on public transport, up from 67% in
2017.
- SDG 11 Inclusive Public Transport: By 2020, all public buses will be
wheelchair-accessible.
Uruguay - SDG 7 E-mobility/ SDG 11 Public Transport: Introduction of electric vehicles in
public transport: 15 Bus and 150 taxis 110 buses and 550 taxis for 2025