draft: not for citation or
TRANSCRIPT

Research & Occasional Paper Series: CSHE.17.06
UNIVERSITY OF CALIFORNIA, BERKELEY http://cshe.berkeley.edu/
CAN PUBLIC RESEARCH UNIVERSITIES COMPETE?*
November 2006
Steven Brint Department of Sociology
University of California, Riverside
Copyright 2006 Steven Brint, all rights reserved.
ABSTRACT Many leaders of public research universities worry about falling behind private research universities at a time when private university finances have improved dramatically and state support for higher education has declined. In this paper, I provide grounds for a more optimistic view of the competitive position of public research universities. I develop two ”business models” for higher education: the public research university model is based on high volume of enrollments and low cost per student, while the private university model is based on low volume and high cost. I show that the private model, at its best, generates a high proportion of future leaders, stronger educational reputations, and leads to the accumulation of more institutional wealth. However, the public model remains viable and successful, principally because it typically generates larger faculties. The total societal contribution of public research universities, as measured by human capital development and research publication, is greater than that of private universities. A generation ago, the prospect of the domination of higher education by independent, non-profit (or private) research universities would have seemed hardly worth discussing. Perhaps 20 private universities were truly outstanding, and these were matched by a very nearly equal number of outstanding public universities. Clark Kerr had presided over the increase in UC Berkeley’s stature, culminating in its ranking in 1964 as the country’s “best balanced distinguished university.” (Kerr, 2001: 56). The great public research universities—Berkeley, Madison, Ann Arbor, UCLA, Chapel Hill—held their own with the privates in the years after World War II, at least until the mid-1970s when an era of inconsistent and declining state appropriations for public higher education began. Today, however, the question on the minds of many public research university presidents is: “How do we compete?” It is a worry that circulates from the bottom right to the top of the * A version of this paper will be published in Carol L. Colbeck, Roger L. Geiger, Christian K. Anderson, and Roger L. Williams (eds.). The Future of American Public Research Universities. Rotterdam: Sense Publishers.

Brint, CAN PUBLIC RESEARCH UNIVERSITIES COMPETE? 2
CSHE Research & Occasional Paper Series
public sector. Not long ago, a former chancellor of UC Berkeley told me: “Without doubt, it is a real and troubling problem. We are losing some of our best people to private universities... Stanford can offer more than we can. We can’t compete on salaries or administrative support.” Salary data suggests that the chancellor is no alarmist. The last AAUP salary study that looked into differences at the institutional level between the private and public universities found large gaps in the salaries of full professors. At the top 10 institutions in both sectors, these differences averaged $15-$20,000 per year for men and nearly that much for women. Today, the differences in pay of full professors at public and private universities have grown to nearly $25,000 annually (Chronicle of Higher Education, 2005). Table 1. Institutions Ranked by Average Salary for Full Professors, Women and Men, 2000-01 Rank Based on Female Professor Salary Institution
Female Professor Salary
Rank Based on Male Professor Salary
Male Professor Salary
Private Institutions 1 Rockefeller University $141,000 1 $137,800 2 Harvard University $125,400 2 $137,400 3 Stanford University $122,200 3 $127,400 4 Princeton University $121,500 5 $126,300 5 Yale University $115,000 6 $126,000 6 University of Chicago $114,200 4 $126,700 7 University of Pennsylvania $113,500 11 $121,600 8 Babson College $113,200 14 $117,000 9 Columbia University $111,600 10 $122,000 10 New York University $110,400 7 $123,900 Public Institutions 1 Rutgers U., Newark $104,100 3 $112,400 2 UC Berkeley $103,600 1 $115,600 3 UCLA $102,800 2 $115,100 4 College of Wm. and Mary $ 99,700 20 $ 98,100 5 University of Michigan $ 99,000 5 $106,500 6 University of Virginia $ 98,400 4 $107,200 7 Georgia Tech $ 98,000 10 $104,500 8 Georgia State University $ 96,800 14 $102,600 9 Rutgers U., New
Brunswick $ 96,300 12 $103,800
10 U. of North Carolina $ 95,300 15 $102,600 Source: Bell (2001): 33.
Brint, CAN PUBLIC RESEARCH UNIVERSITIES COMPETE? 3
CSHE Research & Occasional Paper Series
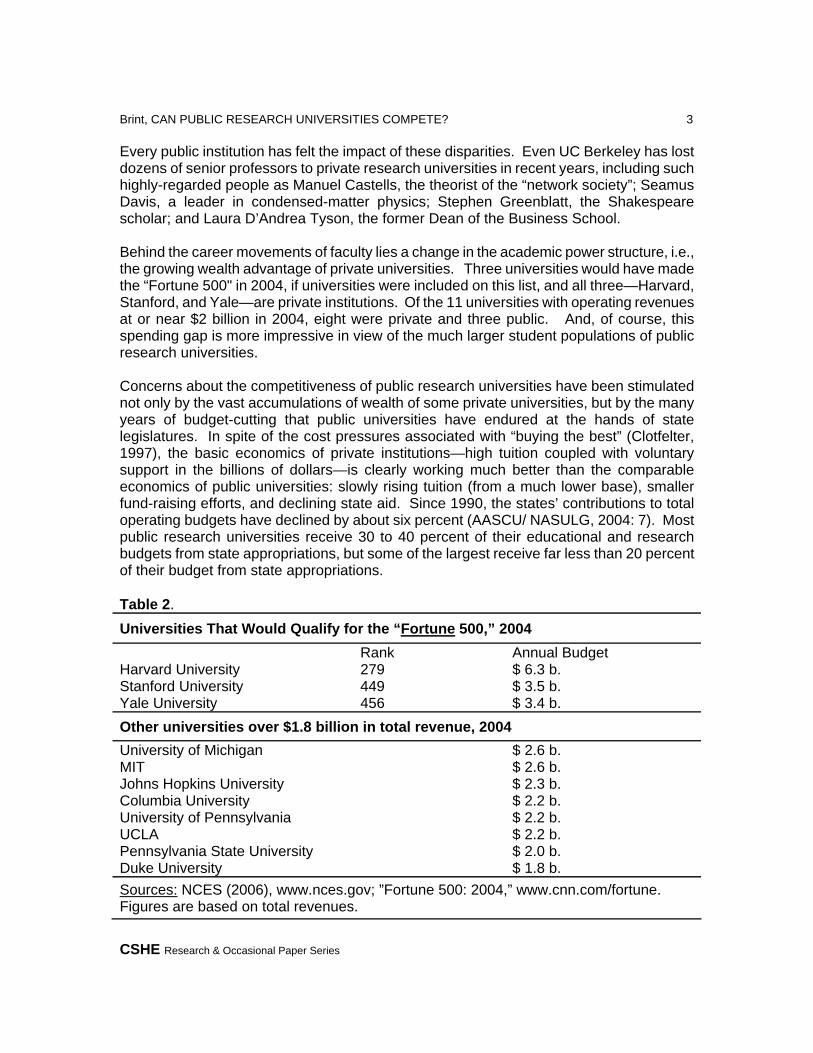
Every public institution has felt the impact of these disparities. Even UC Berkeley has lost dozens of senior professors to private research universities in recent years, including such highly-regarded people as Manuel Castells, the theorist of the “network society”; Seamus Davis, a leader in condensed-matter physics; Stephen Greenblatt, the Shakespeare scholar; and Laura D’Andrea Tyson, the former Dean of the Business School. Behind the career movements of faculty lies a change in the academic power structure, i.e., the growing wealth advantage of private universities. Three universities would have made the “Fortune 500" in 2004, if universities were included on this list, and all three—Harvard, Stanford, and Yale—are private institutions. Of the 11 universities with operating revenues at or near $2 billion in 2004, eight were private and three public. And, of course, this spending gap is more impressive in view of the much larger student populations of public research universities. Concerns about the competitiveness of public research universities have been stimulated not only by the vast accumulations of wealth of some private universities, but by the many years of budget-cutting that public universities have endured at the hands of state legislatures. In spite of the cost pressures associated with “buying the best” (Clotfelter, 1997), the basic economics of private institutions—high tuition coupled with voluntary support in the billions of dollars—is clearly working much better than the comparable economics of public universities: slowly rising tuition (from a much lower base), smaller fund-raising efforts, and declining state aid. Since 1990, the states’ contributions to total operating budgets have declined by about six percent (AASCU/ NASULG, 2004: 7). Most public research universities receive 30 to 40 percent of their educational and research budgets from state appropriations, but some of the largest receive far less than 20 percent of their budget from state appropriations. Table 2.
Universities That Would Qualify for the “Fortune 500,” 2004 Rank Annual Budget Harvard University 279 $ 6.3 b. Stanford University 449 $ 3.5 b. Yale University 456 $ 3.4 b. Other universities over $1.8 billion in total revenue, 2004 University of Michigan $ 2.6 b. MIT $ 2.6 b. Johns Hopkins University $ 2.3 b. Columbia University $ 2.2 b. University of Pennsylvania $ 2.2 b. UCLA $ 2.2 b. Pennsylvania State University $ 2.0 b. Duke University $ 1.8 b. Sources: NCES (2006), www.nces.gov; ”Fortune 500: 2004,” www.cnn.com/fortune. Figures are based on total revenues.

Brint, CAN PUBLIC RESEARCH UNIVERSITIES COMPETE? 4
CSHE Research & Occasional Paper Series
The example of the University of Colorado, Boulder is instructive. Currently, only seven percent of the total University of Colorado budget comes from the state, but the university must negotiate with four parties—the legislature, the joint budget committee of the legislature, the Governor, and the Colorado Commission on Higher Education—to change its fee structure. Each one is jealous of prerogatives and fully ready to block the wishes of the others. An administrator at Boulder described a ravaged system: large state budget cuts for many years running, elimination and downsizing of academic programs, small or no raises for faculty and staff, decimation of student services, and no autonomy for the university to set tuition. According to this administrator, “the ratio of government control to government resources is the most onerous in the country” (personal communication). She would have an argument, however, from university administrators in New Hampshire, Oregon, and Wisconsin, among others, about whether Colorado truly holds this dubious distinction.1
Why should we worry about these gaps between private and public universities? The most important reasons have to do with balance and competition. One of the strengths of the American system of research universities has been the relatively balanced competition between private and public institutions. Balance has kept the ideal of equality of opportunity alive for students, broadened the competition for eminence (and therefore the total productivity of the system), and prevented leaders in the private universities from becoming too hide-bound or self-satisfied. In this paper, I will offer a different perspective on the condition of public research universities, arguing that the situation is not as dire as the statistics on faculty salaries and state support might suggest. The concerns of the UC Berkeley and University of Colorado administrations are not baseless, of course, but they focus too much on the career paths of a handful of eminent professors and the disappointing recent history of state appropriations. They miss the continuing comparative strengths of public research universities. Specifically, I will argue that public and private research universities can be examined in relation to two quite different “business models”—one based on high volume and low cost (the public model), the other based on low volume and high cost (the private model). Each of these models provides a viable path for universities. However, high volume—in other words, higher enrollment—provides a number of advantages for public research universities. It allows them to operate more programs, field larger faculties, and generally win more research funds as well. It is true that most public universities really cannot compete with the leading private institutions as per capita producers of national leaders and endowment wealth. But as total human capital and research producers, they not only compete, they substantially outshine their competition in the private sector. I will begin by defining the two “business models.” I will then show how faculty size can be predicted from a small number of variables associated more often with the public university model. I will then discuss the important advantages of the private model in the production of national leaders, the maintenance of strong educational reputations, and the accumulation of institutional wealth. Turning to the advantages of public universities, I will show that

Brint, CAN PUBLIC RESEARCH UNIVERSITIES COMPETE? 5
CSHE Research & Occasional Paper Series
faculty size is the determining factor in degree production and that it is also strongly associated with success in the grants economy and productivity as measured by the quantity of peer-reviewed journal articles published. I will discuss the advantages size provides in the seeding of new research initiatives, and why it is entirely compatible with attracting large numbers of outstanding undergraduate students, many of whom go on to careers of high achievement. Leaders from the two sectors have certainly seen the weaknesses of their own sector’s “business model.” This has led to efforts by private university presidents to create ”critical mass” in key areas of research funding and to efforts by public university presidents to expand fund-raising capacity well beyond anything considered feasible in past generations. However, I will show that differences in the strengths of the two sectors remain significant, and, if judged from a broad societal perspective, weigh very much in favor of the public institutions.
Two Business Models The first “business model” for research universities is low volume/high cost, and its goal at the undergraduate level is to maximize the educational experience for a highly selected student body of achievers and potential leaders. Let us assume a high net tuition of $25,000, a relatively small undergraduate population of 6,000, and a relatively low faculty to student ratio of 1:18. If we do the math, we obtain a total faculty of 333 (dividing 6000 by 18) and total net tuition of $150 million (multiplying $25,000 by 6000). The other business model is high volume/low cost, and its goal is to maximize contribution to the state through human capital development, research, and service. Here let us assume a low net tuition of $5000 and a large undergraduate student body of 20,000. Let us further assume a somewhat higher faculty to student ratio of 1:25. When we do the math in this case, we obtain a much larger faculty of 800, but a net tuition base of only $100 million. Perhaps surprisingly, this hypothetical high volume/low cost model yields less tuition revenue but a faculty that is more than twice the size of the high volume/low cost model. The two business models are very similar to what we find in many consumer industries: a high end for luxury goods (for example, custom-made gowns from well-known fashion designers) and an upper-middle range for high quality mass-produced goods (for example, “famous label” dresses from the more up-scale department stores). Because knowledge is a public good, universities generally eschew comparisons with for-profit businesses, but the dynamics of market segmentation are not very different in this not-for-profit “industry.” Indeed, the low end of the market (very low cost and very high volume) also exists in the higher education “industry,” i.e., in the community college sector. Faculty size lies behind most of the advantages of public research universities, and it derives quite directly from the high volume/low cost model that I have identified with public institutions. A small faculty can be very distinguished, and it can train a highly selective student body to achieve great things, but a larger faculty trains more students and, all else equal, it also produces more research. However, the advantages that size brings would not

Brint, CAN PUBLIC RESEARCH UNIVERSITIES COMPETE? 6
CSHE Research & Occasional Paper Series
exist without high quality faculty. Therefore, the supply of high quality faculty, trained in rigorous doctoral programs, must be considered a critical assumption underpinning the success of the public university “business model.” Table 3 provides statistical evidence, consistent with the first step in the argument, showing that public institutions greatly outnumber private institutions among the largest research universities. The table shows the total enrollment of the 40 largest and 40 smallest research universities. Only three of the 40 largest are private. More than ten times as many students attend the public universities on this list than attend the private universities. By contrast, 30 of the 40 smallest universities are private, including all but one of the 17 that enroll fewer than 10,000 students. Overall, public research universities outnumber private research universities by about two to one, and they enroll more than three times as many undergraduate students (NCES, 2005: Table 214). Table 3. 40 Largest and Smallest Research Universities, 2004, by Control
40 Largest Research Universities 40 Smallest Research Universities 1) Ohio State University 50,995 1) Claremont Graduate
Univ. 1,641
2) University of Minnesota 50,954 2) California Institute of Technology
2,171
3) University of Texas-Austin 50,337 3) CUNY Graduate Center 4,234 4) Arizona State University 49,171 4) Rice University 4,835 5) University of Florida 47,993 5) Teachers College
(Columbia) 5,036
6) Michigan State University 44,836 6) Brandeis University 5,072 7) Texas A&M University 44,435 7) Catholic University 5,987 8) Pennsylvania State University
41,289 8) Yeshiva University 6,129
9) University of Illinois 40,687 9) Lehigh University 6,641 10) University of Wisconsin 40,455 10) Renssalaier Polytechnic
Inst. 6,696
11) Purdue University 40,108 11) Princeton University 6,708 12) University of Michigan 39,533 12) Brown University 8,004 13) New York University 39,408 13) University of Rochester 8,329 14) University of Washington 39,199 14) Case-Western Reserve
Univ. 9,095
15) Florida State University 38,431 15) Tufts University 9,690 16) Indiana University 37,821 16) Carnegie-Mellon
University 9,803
17) University of Arizona 36,932 17) University of Denver 9,808 18) UCLA 35,966 18) MIT 10,320 19) University of Maryland 34,933 19) Howard University 10,623

Brint, CAN PUBLIC RESEARCH UNIVERSITIES COMPETE? 7
CSHE Research & Occasional Paper Series
20) Rutgers University 34,696 20) Southern Methodist University
10,901
21) Temple University 33,551 21) University of Vermont 10,940 22) University of Georgia 33,405 22) American University 11,192 23) Univ. of California, Berkeley
32,803 23) Vanderbilt University 11,294
24) University of Colorado 32,362 24) University of Maine 11,358 25) Louisiana State University 32,241 25) Yale University 11,441 26) Univ. of Southern California
32,160 26) Notre Dame University 11,479
27) North Carolina State Univ. 29,957 27) Marquette University 11,510 28) Boston University 29,596 28) Emory University 11,781 29) Univ. of California, Davis 29,210 29) University of Maryland-
Baltimore 11,852
30) University of Utah 28,933 30) Tulane University 12,667 31) University of Iowa 28,442 31) Duke University 12,770 32) Texas Tech University 28,325 32) University of Idaho 12,824 33) University of Tennessee 27,792 33) University of Wyoming 13,207 34) Virginia Tech University 27,619 34) Washington Univ. (St.
Louis) 13,210
35) University of Oklahoma 27,483 35) Georgetown University 13,233 36) SUNY-Buffalo 27,276 36) Binghamton University
(SUNY) 13,860
37) University of Cincinnati 27,178 37) University of Chicago 13,870 38) University of Missouri 27,003 38) Loyola University-
Chicago 13,909
39) University of Kansas 26,980 39) University of New Hampshire
14,370
40) Univ. of North Carolina 26,878 40) University of Mississippi 14,497 Note: Boldface = independent, non-profit Source: NCES, 2005: Table 215; IPEDS 2005 database. It is clear that undergraduate enrollments are one cause of larger faculties. The more students enrolled, the more professors necessary to teach them. Professional students can be considered in approximately the same light as undergraduate students. In most professional schools, their support does not depend directly on the grants economy. Doctoral education certainly introduces complications, but not as many as might be imagined. Much doctoral education is subsidized by undergraduate tuition in the form of teaching fellowships. Thus, the numbers of graduate students are at least partly dependent on the undergraduate student base. Because graduate students also finance their work by serving as research assistants, their numbers should be co-determined by the size of the research effort at universities (Gumport, 1993). The grants economy is rather unstable as compared to undergraduate teaching. Most universities can depend on new crops of freshmen every year, much more than they can depend on constant levels of research funding. Planning for permanent faculty positions should be connected to these risk factors.

Brint, CAN PUBLIC RESEARCH UNIVERSITIES COMPETE? 8
CSHE Research & Occasional Paper Series
Thus, we might expect faculty lines to be strongly associated with enrollments, but less strongly associated with research expenditures. We might expect further that graduate student numbers are explained, in a somewhat more balanced way, by enrollments and research expenditures. Predictions of faculty size based on the size of student bodies must be adjusted for one important difference between public and private universities. Private universities have lower student-faculty ratios than public universities. I will use the averages for my sample to make this necessary adjustment: 18:1 for private universities and 25:1 for public universities. In this analysis, I use data for the 81 research universities included in the Institutional Data Archive (IDA) on American Higher Education for AY 2000-01, the most recent year for which complete data are available. I first divided enrollments by the constant term for student-faculty ratios. I used independent variables that lagged four years behind the dependent variable on the theory that planners extrapolate from recent trends to determine current staffing levels. I then ran regressions of this enrollment variable on faculty size. To these regressions, I added variables measuring research expenditures, endowment income, and operating budget. Because grants expenditures and total operating budget are highly correlated and therefore introduce problems of multicollinearity, I did not use these variables in the same regressions. Table 4. Predictions of Faculty and Graduate Student Size in American Research Universities, 1999-2000 A. Tenure and Tenure-Track Faculty, 1999 Model 1 Model 2 Model 3 B (St.Error) B (St. Error) B (St. Error)Constant 135.6** (47.6) 65.6 (48.8) 103.6* (48.7) Enrollment Ratios 19951
.779*** (.045) .726*** (.047) .728*** (.050)
Endowment Value 1995 (in $10 millions)
----- 1.55 (25.4) 5.27 (28.8)
Total Grants/ Contracts 1995 (in $10 millions)2
----- 71.9*** (19.9) -----
Current Funds Revenue 1995 (in $100 millions)
----- ----- 107.4* (51.5)
R2/Adjusted R2 (S.E.E.)
.792/.789
(185.2) .823/.815
(166.4) .807/.800
(180.6)
B. Total Faculty (including non-tenure track) 1999 Model 1 Model 2 Model 3 B (St.Error) B (St.Error) B (St.Error)

Brint, CAN PUBLIC RESEARCH UNIVERSITIES COMPETE? 9
CSHE Research & Occasional Paper Series
Constant 123.0 (62.9) 19.3 (67.0) 74.9 (64.0) Enrollment Ratios 1995
.942*** (.059) .919*** (.064) .869*** (.065)
Endowment Market Value 1995 (in $ 10 millions)
----- 4.56 (34.8) 6.27 (37.9)
Total Grants/ Contracts 1995 (in $10 millions)
----- 77.4** (27.3) -----
Current Funds Revenue 1995 (in $100 millions)
----- ----- 153.9** (67.7)
R2/Adjusted R2 (S.E.E.)
.761/.758
(244.8) .793/.784
(228.3) .781/.773
(237.3)
C. Graduate Student Population 2000
Model 1 Model 2 Model 3 B (St.Error) B (St.Error) B (St.Error)Constant 814.4 (507.4) -332.7 (503.4) 33.4 (451.6) Enrollment Ratios 1995
5.11*** (.479) 4.61*** (.482) 4.18*** (.462)
Endowment Market Value 1995 (in $ 10 millions)
----- 593.5* (261.6) 471.2* (267.2)
Total Grants/ Contracts 1995 (in $10 millions)
----- 819.7*** (205.3) -----
Current Funds Revenue 1995 (in $100 millions)
----- ----- 1916.4*** (477.8)
R2/Adjusted R2 (S.E.E.)
590/.584 (1974.5) .700/.687
(1715.0) .713/.702 (1674.2)
N=81 * = p < .05; ** = p < .01; *** = p < .001 Sources: NCES (2002); Brint, Levy, Riddle, and Turk-Bicakci (2003). Notes: 1. Private university enrollments divided by 18; public university enrollments divided by 25 to reflect average student-faculty ratio in the two sectors. 2. Total Grants includes federal, state, local, corporate, and foundation grants and contracts. As Table 4 shows, a very good model of research faculty size, explaining nearly 80 percent of the variance, can be developed using just two terms: one for average faculty-to-student ratio in the public and private sectors, and one for the number of students in the institution. The addition of research expenditures improves the prediction a little (but in the prediction of

Brint, CAN PUBLIC RESEARCH UNIVERSITIES COMPETE? 10
CSHE Research & Occasional Paper Series
faculty size they are only about one-quarter as important as enrollments). The same basic model also applies to predictions of total faculty size and graduate student size, but here research expenditures are somewhat more important. The best predictions explain about two-thirds of the variance, and grants are a little more important in predicting graduate student size than they are in predicting research faculty size. Even so, they are only about one-third as important as enrollments in the prediction. When substituted in the equations for grants, operating budgets do not lead to better predictions.2
Endowment funds are generally earmarked for capital improvements on campus, or student financial aid. They can also be used to augment faculty salaries and graduate student stipends, but the analysis in Table 4 suggests that neither endowment nor endowment income have a significant impact on the size of faculties, controlling for undergraduate student body and research expenditures. Other plausible predictors are equally irrelevant to the explanation of faculty size. The many “non-traditional” revenue streams cultivated by universities through intercollegiate athletics, health care services, and technology transfer contribute little to the prediction of faculty or graduate student size. The great majority of funds from these streams are simply reinvested in the activities that generate the revenues. Thus, revenues from inter-collegiate athletics are re-invested in athletic scholarships, coaching salaries, and stadium operations. Revenues from health care services are re-invested in the medical center, and income from technology licensing goes to pay the salary of the Office of Technology Transfer staff and the technology transfer research enterprise. Bookstores and other auxiliary enterprises are intended to be “break-even” operations, and rarely contribute to general funds. A few universities do rely on continuing education to help finance the core educational operation, but any diverted funds are a small proportion of operating budgets compared to undergraduate tuition and fees. Advantages of the Private Research University Model This evidence on the relationship of enrollments to faculty and graduate student size will underlie my discussion of the advantages of public research universities. However, I will first discuss the advantages of the private university business model. Although these advantages are not as comprehensive or as overwhelming as many believe, they are nevertheless sizeable in some important domains. In particular, the private university business model yields a number of advantages related to selectivity and wealth. It produces more national leaders, larger donations, larger endowments, and (mainly as a consequence of these inputs) a better reputation for educational quality among potential undergraduates and their parents. Production of Leaders In case any doubts exist about the private universities’ role in the production of future leaders, consider the following: Since World War II, about one-third of all Rhodes Scholars have been produced by just three institutions: Harvard, Yale, and Princeton (Youn, Arnold, and Salkever, 1998). The private liberal arts colleges and military academies have produced another third of Rhodes Scholars, and private research universities other than

Brint, CAN PUBLIC RESEARCH UNIVERSITIES COMPETE? 11
CSHE Research & Occasional Paper Series
Harvard, Yale, and Princeton another 12 percent. Only one-fifth of Rhodes Scholars have taken their baccalaureates from public universities other than military academies (calculated from Youn, Arnold, and Salkever, 1998). Studies of elites show high concentrations of people trained in selective private colleges and universities in such sectors as finance, corporate law, high-ranking government officialdom, and the publishing industry (Zweigenhaft and Domhoff, 2006). Table 5. College and University Representation1 among Biographies in Who’s Who2 by Institutional Type and Control, 2000 Baccalaureates Awarded in U.S. Estimated
Who’s Who Type of Institution 1940-
1980 (est.)
Proportion3
(N) Smoothed Ratio
Private Research Universities 10% 26% (2311) 2.5:1 Public Research Universities 30% 30% (2676) 1:1 “Other” Private College and Universities
30% 28% (2465) 1:1
“Other” Public Universities 30% 16% (1372) .5:1 Sources: Marquis Who’s Who (1999): 182-615; NCES (2002): 12, 254. Notes:
1. Data include only biographies of persons who have attested U.S.-based baccalaureate institutions. Some 13 percent of the sample had no attested baccalaureate institutions, and another six percent graduated from foreign institutions.
2. The estimate for the distribution of baccalaureates during the period of the study is based on estimates related to changes over time in the private-public ratio and in the distribution of students between institutional types. These estimates were derived from NCES data. See footnote 7. 3. The Who’s Who proportion is based on a 10 percent sample from the 54th (2000) edition—all entries starting with the letter “B”. Studies of a broader stratum of high-achieving people also show a disproportionate share graduating from private colleges and universities, although public institutions do not fare badly in absolute numbers. Study of a 10 percent sample of people listed in the 54th (2000) edition of Who’s Who3 shows that public research universities, in fact, may contribute a slightly higher absolute number of leaders than either private research universities or private liberal arts colleges.4 They produce high achievers at a good rate, and have a much larger pool of students from which to produce future leaders. Because public regional universities do not contribute at a high rate to the production of national leaders, however, the overall balance of biographies in the study favors private institutions. In this sample, some 55 percent of Who’s Who graduates of American colleges or universities took their bachelor’s degrees from a private institution, while 45 percent graduated from a public institution.5

Brint, CAN PUBLIC RESEARCH UNIVERSITIES COMPETE? 12
CSHE Research & Occasional Paper Series
Controlling for the size of the two sectors during the period, the relative difference in the production of leaders is impressive.6 Private research universities were over-represented as contributors to biographies in Who’s Who by a rate of more than 2.5:1, and the level of over-representation could be as high as 3:1 or more.7 Other private colleges and universities (including liberal arts colleges and master’s granting private universities) contributed at approximately the rate that would be expected on the basis of their enrollments during the period, as did public research universities. Regional public institutions, by contrast, contributed at a rate half of what would be expected based on their estimated share of undergraduate enrollment during the period.8
Donations and Wealth Some public institutions have been rewarded with large gifts from entrepreneurs like Sam Walton ($300 million to the University of Arkansas in 2002) and David Geffen ($200 million to the UCLA School of Medicine in 2002), but the majority of large gifts go to private research universities. More successful alumni translate into larger donations and larger endowments. The domination of the private research universities rises with the size of gifts. Of large gifts ($50 million or more) to colleges and universities since 1967, 60 percent went to private colleges and universities. But more than two-thirds of the 56 gifts to colleges and universities over $100 million went to private colleges and universities, and nearly all of these to private research universities. This includes nine of the 13 very largest gifts—gifts of $200 million or more (calculated from Chronicle of Higher Education, 2006).9 In alumni giving, no public research university can begin to match the record of Cornell University, where annual gifts totaled almost $190 million in 2003-04 (Kaplan, 2005), including gifts from nearly three in five alums. The University of Texas is the public university champion in the area of alumni giving, but its alumni giving total is just 60 percent that of Cornell’s. Of the top 20 institutions for alumni support in 2004, 13 were private and 7 public universities. Eight of the top 10 were private, including every one of the top five (Kaplan, 2005). Total voluntary support includes support through alumni giving, donations from non-alumni, and donations from corporations. In 2003-04, among the top 20 fundraisers—those with over $195 million in total support—11 were private research universities, including nine of the top ten (ibid.). Looking across the spectrum of research universities, voluntary support of private research universities is nearly double that of public research universities—averaging over $96.7 million in 2003-04, compared to $55.6 million for public research universities (ibid.). The same pattern holds, but in a more exaggerated way, for endowments. This reflects both the long head start of the privates in building endowments and the greater commitment and capacity of private university alumni to make donations. Highly organized fund raising campaigns were still a novelty in the public sector as late as the 1960s (Young, 1997), but had been a part of the fabric of college life among private colleges and universities at least since the early 20th century (see, e.g., Horowitz, 1994). Of the 25 university endowments valued over $2 billion in 2005, 19 (76 percent) belonged to private institutions (NACUBO,

Brint, CAN PUBLIC RESEARCH UNIVERSITIES COMPETE? 13
CSHE Research & Occasional Paper Series
2005). Among public universities, only the University of Texas system, the University of California system, the Texas A&M system, the University of Michigan, and the University of Virginia placed in the top 20 endowments in 2005 (ibid.). Endowment per student is a widely accepted measure of financial capacity. Even drawing on the riches of oil land and hundreds of thousands of alumni in prosperous states, not a single public university can claim to make the top 50 in endowment per student. Here the leader is tiny Rockefeller University, with an endowment of more than $7 million per student. Three other private research universities—Harvard, Yale, and Princeton—have accumulated endowments above $1 million per student. With one exception (the quasi-private University of Virginia), even the wealthiest public research universities fall below $100,000 per student (ibid).10
Reputation for Educational Quality
Wealth is closely related to selectivity in admissions, which, in turn, is closely related to educational reputation. The accumulation of wealth by private institutions encourages a self-perpetuating cycle of distinction. The U.S. News and World Report (USN) ranking of “America’s best” colleges and universities is an influential, if widely criticized, measure of educational reputation.11 The USN rankings for universities are based on seven indices, six of which are closely related to selectivity and/or wealth.12 Not surprisingly, 19 of the 20 top ranked “national universities” in recent years have been highly selective private institutions (U.S. News and World Report, 2006, 2002). Other commercial college raters, such as the Princeton Review, also overwhelmingly choose private colleges and universities as “the best.”13 Analysis of the 2002 USN rankings of “national universities” suggests that as much as 70 percent of the variance in rank may be explained by just one independent variable: the average SAT/ACT scores of the freshman class.14 Because wealth is highly correlated with selectivity (r=.71 in my sample), wealth can be considered a strong indirect influence on USN rank.15 Characteristics that are important to the public research university “business model” —undergraduate student size, graduate student size, faculty size, and percentage of total federal research conducted—do not improve the prediction of USN rank.16 Scholars and journalists alike have criticized the USN rankings as a specious measure of educational quality, but these persuasive critiques of USN methodology should not obscure our understanding of the real capacity of private universities to provide high quality educational experiences for undergraduates. The undergraduate experience at these institutions is substantially enriched, in the first place, because many other high-achieving students are in residence (Geiger, 2002; Pascarella and Terenzini, 2005: 187-9). The institutions can also offer smaller classes and more research opportunities, staff larger and higher quality student services offices, sponsor internship and study abroad programs, pay for undergraduates to attend professional conferences, and invite famous alumni and friends of the university to discuss their work and spend time with students.

Brint, CAN PUBLIC RESEARCH UNIVERSITIES COMPETE? 14
CSHE Research & Occasional Paper Series
Private Advantages
In sum, the advantages of the private research university business model are impressive: Private research universities enroll a more selective undergraduate population. This fact alone is strongly associated with the reputation of the institutions for higher educational quality. These select students go on more often to achieve eminent careers than undergraduates at public research universities. Partly in gratitude for the outstanding education they have received, private university students contribute to their alma mater at a rate far in excess of the contribution of public university graduates. These gifts contribute to the long-standing wealth advantage of private institutions. This wealth advantage, in turn, allows private institutions to recruit many of the best students from the succeeding generation and thereby to gain still more wealth. It also allows them to pay promising young professors and eminent senior professors high salaries, and therefore to win the majority of faculty recruitment battles. The advantages of the leading private universities have depressed morale among some administrators of public research universities, but the competition for a handful of eminent professors is marginal to the total societal contribution of public universities, which consists, much more importantly, of human capital development (including opportunities for less advantaged students) and research productivity. Clotfelter (1997) observed that highly-selective private universities can “buy the best.” I will add a corollary to Clotfelter’s theorem: private universities cannot usually also “produce the most.” Advantages of the Public Research University Model As this corollary suggests, public research universities have different, but no less important, advantages, particularly if we look at the issue from a societal perspective. Educators are inclined to view size as a liability, because it leads to large classes and less personal attention for students. But size is a critical advantage when it comes to overall productivity. Public research universities produce a large proportion of college-educated people, including a large proportion of those with important types of human capital: bachelors’- and masters’-level scientists and engineers, and Ph.D.s. They also produce more total research than private universities. Each of these contributions is related to size, the key advantage of the public university business model. Status also plays a role: private universities are less attuned to the sciences and engineering than to traditionally high status professional fields, such as medicine, law, finance, and the arts. In so far as research productivity is connected to reputation, public universities could theoretically also enjoy an advantage in the area of research reputation. However, private research universities obviously have the capacity to compete effectively in this arena by hiring scholars and scientists who are highly productive and at the forefront of important developments in their fields. Human Capital Development
The productivity advantages of public research universities are greatest in bachelors’ and masters’ degree production. Nationally, about two-thirds of undergraduates complete

Brint, CAN PUBLIC RESEARCH UNIVERSITIES COMPETE? 15
CSHE Research & Occasional Paper Series
degrees in public institutions (NCES, 2005: Table 253). The public universities, with their land grant roots, award an even higher proportion of bachelor’s degrees in science and engineering. Strikingly, among graduates of research institutions, nearly 80 percent of students who complete bachelors’ degrees in natural sciences or engineering come from public institutions (NSF, 2006). The public sector advantage is equally notable in the area of doctoral production. Sixty institutions produce more than half of all doctorate degrees (NCES, 2005: Table 305). Of these top 60 doctorate producers, three-quarters (45) are public, including the top eight institutions. (Another top doctoral-producing university, Cornell University, is largely private, but partly public.) Among the top 60 doctorate producers, public universities award about three times as many Ph.D.s every year as private universities—nearly 18,500 of the 24,600 awarded in 2004 (ibid.). Overall, public institutions produce more than three-fifths of all doctorates (ibid.: Table 254). By any measure, as contributors to the production of scientific and scholarly manpower, public universities are the workhorses of the American university system.17
The leading public research universities are also successful in advancing their undergraduate students into graduate and professional schools. College and Beyond data for the graduating class of 1989 show that one-third of students from selective public research universities in the College and Beyond sample enrolled in graduate or professional programs within the first few years of their college graduation.18 By contrast, slightly fewer than half of students from selective private colleges and universities enrolled in graduate or professional schools within the first few years of graduation.19 In so far as we can extrapolate these figures to all research universities, we would expect the numbers of public university graduates to be 1.5 times that of private university graduates in entering classes of graduate and professional schools. Moreover, according to the College and Beyond data, public university graduates finish post-graduate programs at essentially the same rate as their private university counterparts. Educational Opportunities
Although they are far from reflecting the socio-economic composition of American society, students at public universities are more representative of American society than students at private universities. Public universities can, therefore, be counted as one of the important continuing centers of opportunity in American society. In fall 2005, nearly 40 percent of freshmen entering the most selective private universities estimated their family’s annual income at $150,000 or more, as did more than one-third of all private university students (Higher Education Research Institute, 2005). By contrast, fewer than 20 percent of freshmen at all public universities (including just 16 percent of freshmen at selective public universities) came from such affluent families (ibid.).20 To put these numbers in perspective, only seven percent of all American families reported annual incomes at this level (U.S. Census Bureau, 2005). Freshmen from lower and lower-middle income families (annual family incomes below $60,000) made up less than one-quarter of private university student bodies in fall 2005, but one-third of public university student bodies (HERI, 2005).

Brint, CAN PUBLIC RESEARCH UNIVERSITIES COMPETE? 16
CSHE Research & Occasional Paper Series
Because private universities have made a strong effort to improve minority recruitment and retention, the public university contribution to opportunity is not as large in the area of race and ethnicity as it is in family income. In recent years, students from minority groups have comprised slightly more than one-quarter of all four-year college students, and just under one-quarter of graduates (NCES, 2005: Table 206). Proportionally, public research universities have not been more likely to enroll minority students than their counterparts among private institutions. However, differences in absolute numbers are large: public universities enroll and graduate about three times as many minority students than private universities, simply because their undergraduate student bodies are more than three times as large. Research Productivity
The public research university business model also pays off in research productivity, as measured by the quantity of peer-reviewed publications. We must keep in mind the limitations of this measure. Purely quantitative studies of research tell little about the quality of published work. Professors in some small, high-quality programs may produce fewer books and articles overall, but those produced may be highly influential. By contrast, professors in less well-regarded programs may produce mountains of research, but much of it run-of-the-mill. Moreover, studies of research productivity are limited in other ways by the conventions used to count publications, notably by an emphasis on articles as opposed to books. My focus will be on an admittedly blunt measure of productivity—publication counts—and the discussion should therefore be treated with allowance for limitations of the available data.21 Table 6. Institutional Predictors of Total Publication Counts, 1995-2005 Variables Logged Publication Counts B (St. Error) Constant 8.57 (.161) Research Faculty 2000 .001*** (.000) Grants Expenditures 2000 (in $10 millions)
.027*** (.005)
Endowment Market Value 2000 (in $10 millions)
.001* (.000)
Private Institution .026 (.141) Medical Center .185 (.133) R2/Adjusted R2 (S.E.E.) .696/.676 (.489) N=79 * = p>.05; ** = p<.01; *** = p<.001 (one-tailed) Sources: Brint, Levy, Riddle, and Turk-Bicakci (2003); ISI (2005). Publication counts, contained in the Institute for Scientific Information’s (ISI) “Web of Science,” provide a quantitative measure of productivity. These counts include all articles published in the tens of thousands of scientific and scholarly journals monitored by ISI. A

Brint, CAN PUBLIC RESEARCH UNIVERSITIES COMPETE? 17
CSHE Research & Occasional Paper Series
count of publications over the most recent 10-year period (1995-2005) shows that faculty size is strongly related to publication count. Of the 20 most prolific research faculties during this period, two-thirds (13) were located at public institutions. Because publication counts are skewed toward the lower end of the distribution, for purposes of multivariate analysis I logged publication approximating normality. The analysis shows that research faculty size, the key advantage of public universities, is strongly associated with higher levels of publication. Other factors associated with higher levels of publication are total grants support and the market value of endowment. The standardized coefficients for faculty size and grants income are approximately equal, and both are twice as large as the standardized coefficient for endowment. Once these three variables are controlled, public sector is insignificant, and so, somewhat surprisingly, is having a medical school. Table 7. Predictions of NRC Rankings on Three Dimensions Dependent Variables OLS Regression Tobit Regressions
Number of Programs Ranked
Number of Programs in Top Quartile: Faculty Quality
Number of Programs in Top Quartile: Program Effectiveness
Independent Variables
B (St. Error)
Parameter Est.
(St. Error)
Parameter Est.
(St. Error)
Constant -18.5* (7.3) -73.6*** (14.2) -58.9*** (10.6) Total Faculty 1990 .007*** (.002) .0017 (.002) .0015 (.002) Average SAT Score .03*** (.008) .060*** (.012) .049*** (.009) Endowment Market Value 1990 (in $10 millions)
-.019 (.019) .019 (.023) .017 (.019)
Total R&D 1990 (in $10 millions)
.401*** (.107) .780*** (.132) .753*** (.108)
Control (Public=0) -3.15 (2.3) 5.92* (2.87) 5.84* (2.34) R2/Adjusted R2 (S.E.E.)
.662/.636 (5.53)
Log-Likelihood -174.0 -187.4 N=71 * = p<.05; ** = p < .01; *** = p < .001 (one-tailed) Source: Brint, Levy, Riddle, and Turk-Bicakci (2003). Faculty size is also connected to at least one measure of research reputation, the total number of programs ranked by the National Research Council (NRC) in its last study of graduate program quality and effectiveness in 1993. Twenty-one of the 32 universities with 30 or more programs ranked by NRC were public universities. As Table 7 indicates, I was

Brint, CAN PUBLIC RESEARCH UNIVERSITIES COMPETE? 18
CSHE Research & Occasional Paper Series
able to explain about two-thirds of the variance in number of programs rated. The findings indicate that faculty size in 1990 is strongly associated with the number of programs rated by the NRC, and that its contribution is about the same as total research and development expenditures in 1990. It is not quite as important in this explanation as the average SAT/ACT scores of student bodies. Thus, size allows universities to compete for recognition in a broad array of fields, but so does the related variable, R&D capacity, and so, too, does a variable connected to educational quality: selectivity of the student body, as measured by freshmen SAT/ACT scores.22 While size helps to explain breadth of academic field coverage, it is not a statistically significant predictor of outstanding program quality, as measured by number of programs in the top quartile of NRC ratings for faculty quality and program effectiveness. Because the data in this analysis are left-censored (i.e., include a number of zero scores), I used Tobit regression to provide more reliable parameter estimates (Tobin, 1958). In this analysis, faculty size was statistically insignificant in predictions of the number of programs rated in the top quartile of either faculty quality or program effectiveness. Thus, the public sector edge in quantity of production has not carried over into scholarly perceptions about quality of production. Instead, R&D expenditures and selectivity were the more important determinants of the NRC faculty quality and program effectiveness ratings. With other variables in the model controlled, the private sector also showed as a significant, but relatively weak, predictor of program ratings in the top quartile. Critical Mass
Because of their size, public research universities can put together teams in important new areas of research without expending scarce capital to build new programs more or less from scratch. They have more in-built flexibility in this regard than private universities can often afford. A top research administrator made this point in a compelling way when discussing the organization of new interdisciplinary initiatives: “We are large. Size is helpful, because we have people working in many different areas. We don’t have to move about when the environment changes. We have 120 Ph.D. graduate programs. We have new ones cycling in and others cycling out. We have little red tape for creating new centers, and nine out of ten of these are interdisciplinary” (personal communication). Smaller institutions cannot compete simply by allowing existing research workers to rearrange themselves as the environment changes. Public universities can also maintain a critical mass of outstanding undergraduate students. Geiger (2002) studied “super students” at American colleges and universities, those who had achieved at least one 700 plus score on the SAT. While elite private institutions enrolled higher proportions of these “super students,” Geiger found that public research universities rivaled the privates in the absolute number of “super students” enrolled. In fact, four public universities (the University of California-Berkeley, the University of Illinois-Champaign-Urbana, the University of Michigan-Ann Arbor, and the University of Wisconsin-Madison) enrolled a higher number of “super students” than the highest-ranking private university, Harvard. Geiger argued that low cost is an important attraction, but reputation in research may be even more important. He observed, “Public universities have much to

Brint, CAN PUBLIC RESEARCH UNIVERSITIES COMPETE? 19
CSHE Research & Occasional Paper Series
offer superior undergraduates in peer (challenges) and subsidization, but their stature in research is perhaps their chief competitive advantage” (Geiger, 2002: 102).23 Even National Merit Scholars, the top one percent of tested high school seniors, are distributed relatively evenly between the two sectors. In 2004, a relatively down year for public institutions, 20 of the top 50 destinations were public research universities, led by the University of Florida in second place with 259 freshman scholars and the University of Texas, Austin in third place with 242. Throughout the last decade, between 20 and 25 of the 50 most popular destinations for National Merit Scholars have been public institutions (Chronicle of Higher Education, 1995; National Merit Scholarship Corporation, 2005). Public Research University Advantages
In sum, the combination of high quality, low cost, and large size found in public research universities leads to important societal outcomes: more total human capital development than would be possible in a system dominated by private universities, particularly in the strategically important fields of science and engineering; greater opportunities for students from lower-income and minority backgrounds; a higher absolute amount of research publications; and greater breadth of academic field coverage. Public universities can also create critical mass in new research areas more easily than private universities, and they are attractive, because of their low cost and good research reputations, to many highly able students. Anomalies
In this paper, I have contrasted two business models: one based on high cost/low volume and the other on low cost/high volume. This contrast is clearly over-simplified. Some public research universities, even though relatively inexpensive, are not large; and some private research universities, even though costly and highly selective in admissions, are not small. These deviant cases require at least a brief discussion. Small Public Universities
The circumstances of small public research institutions can be understood as a straightforward function of low population and low levels of industrialization. In every case, these institutions would be inclined to follow the low cost/high volume model, but they lack one or more of the conditions that allow the model to be fully realized: either they are located in states with small populations and little tradition of higher education, or they have failed to receive enough state subsidy to keep tuition low, or both. Thus, the state universities of Idaho, Maine, Mississippi, Vermont, and Wyoming are large enough to qualify for the “Carnegie doctoral-extensive” category, but they are not large enough to mount broad-based research enterprises. The economies of these states have been strongly connected to farming, ranching, or mining activities—and are not as diversified as the economies of some otherwise similar states.24

Brint, CAN PUBLIC RESEARCH UNIVERSITIES COMPETE? 20
CSHE Research & Occasional Paper Series
Large Private Universities
Anomalous cases in the private sector are a bit more complex. They come in two types: first, private metropolitan institutions that rival the largest public institutions in the size of their undergraduate enrollments; and, second, small, highly selective undergraduate institutions that have nevertheless been able to mount large graduate programs. Only three private research universities truly resemble the largest public universities in the size of their undergraduate student bodies: Boston University, New York University, and the University of Southern California. Each is located in a large, culturally vibrant city. Historically, these three institutions charged somewhat lower tuition, and they maintained somewhat lower standards of selectivity than the most prestigious private universities. Together with their attractive locations, this allowed them to draw from a larger pool of potential students. In recent years, they have been able to increase both selectivity and tuition charges. A fourth private institution, George Washington University, has an undergraduate student body nearly as large as these three, and it has also succeeded in making the transition to a full-scale research university. It too is located in a big city. The other anomaly is the “top-heavy” private university. A few private universities have been able to build large graduate divisions, even on the unpromising foundation of small, selective undergraduate student bodies. A full-time graduate-level student body of more than 4000 appears to be near the minimum necessary to compete broadly for research eminence. More than 50 public research universities have graduate and professional student populations of this size. By contrast, only 16 private research universities have been able to mount graduate programs that exceed the 4000-student level (NCES, 2005: Table 214).25
These 16 include the four large undergraduate institutions discussed above: Boston University, George Washington University, New York University, and the University of Southern California. Seven others—the University of Chicago, Columbia University, Harvard University, Johns Hopkins University, MIT, Stanford University, and Yale University—operate graduate programs that are larger than their undergraduate programs. Chicago and Hopkins began as graduate-oriented universities. For the others, graduate programs on this scale have required conscious administrative decisions, the hiring of a research faculty capable of obtaining high levels of external support, and generous donations in aid of graduate education from alumni and others. The niche in which these decisions and capacities converge is evidently small. Many eminent private institutions, including Brown University, the California Institute of Technology, Carnegie-Mellon University, Dartmouth University, Georgetown University, and Princeton University, have made conscious choices to compete in a more limited way as research institutions. Presumably this is due to the expense of fielding a large, broadly competitive research faculty on the foundation of a small, selective undergraduate student body.

Brint, CAN PUBLIC RESEARCH UNIVERSITIES COMPETE? 21
CSHE Research & Occasional Paper Series
The Convergence of Business Models Recent scholarship has rightly emphasized the “privatization” of public research universities (see, e.g., Geiger, 2004; Kirp, 2003; and Slaughter and Leslie, 1997). Yet private research universities have started to realize the problems in their business model as well, and some of the most successful are now beginning to resemble public research universities, at least more than they have in the past. On both sides, these changes reflect efforts to correct for weaknesses characteristic of their respective business models. The weakness of the public research university model is clear; it is state-dependent to an unhealthy degree at a time when legislators and citizens no longer have the will to subsidize public higher education at historic levels (Breneman and Finney, 1997; Geiger, 2004: chap. 2). Those able to adapt have begun to do so in two ways. One is through the launching of fund-raising campaigns that rival or even surpass those found in the private sector. The most recent University of Michigan campaign was for $2.5 billion, roughly the level of the largest private university campaigns. The other is through annual increases in tuition and fees that are larger, proportionately, than those found in the private sector. So far, these increases have applied with greatest force to out-of-state students. Out-of-state students attending the University of Michigan, the University of Virginia, and Pennsylvania State University now pay tuition nearly as high as they would pay at a moderately selective private liberal arts college or university (Geiger, 2004: 48). In-state students have seen their educational costs increase much faster than the rate of inflation over the last 25 years, with no signs of slowing ahead. As Geiger (2004: 42-50) shows, state tuition ranges widely depending on state traditions and policies. In 2001-02, in-state tuition ranged from $2,500 in Arizona, Florida, and Utah to $7,500 in Pennsylvania. In 1980, the range was $500 to $1500. Many states have greatly augmented their student financial aid programs, but not enough to limit the trend in the composition of student bodies—and especially among those who graduate—toward the upper end of the income distribution (Fitzgerald and Delaney, 2002; Mortenson, 2004). What, then, of the “public” side of private institutions? One way to look at the public dependence of private institutions is to focus on revenue streams. Private research universities have been highly dependent on state funding since the beginning of what Clark Kerr (1962) called “the federal grant university” during World War II. Indeed, of the 20 recipients of federal research and development grants totaling over $300 million in FY 2003, 11 were private institutions (Chronicle of Higher Education, 2005). Federal student loan and opportunity grant programs apply as much to students attending private institutions as to those attending public institutions. Truly, we have had hybrid institutions for more than 60 years, in which the public universities depend on private funds for tuition revenues and donations, and private universities depend on public monies to support their research and student financial aid expenditures. Moreover, private universities have been leaders in one of the controversial outcomes of escalating competition for federal funds: the hiring of lobbyists to influence the earmarking of federal research funds.26
Recent changes in research policy have enhanced private university engagement with public sources of funds. The most important of these is the trend toward joint state-

Brint, CAN PUBLIC RESEARCH UNIVERSITIES COMPETE? 22
CSHE Research & Occasional Paper Series
corporate-university projects for new technology development. Cornell University and the University of Rochester are, for example, major recipients of New York Star funds, along with some campuses of the State University of New York system. Similarly, Emory University has been one of the chief recipients of funds connected with the Georgia Research Alliance (GRA) and the technology development activities that have spun off from GRA (Brint, 2005a; Geiger and Sa, 2005). The ‘invisible colleges” of scientific researchers know no institutional boundaries along public and private lines, and these informal networks of collaborating scholars and scientists are becoming more numerous and more formalized in our age of jointly-funded, multi-site projects. If revenue streams are converging, so too are the size dimensions of the organizations. This is an equally important, but often neglected, impact of the success of the public university business model. Size, the principal advantage of the public university model, is becoming a more important factor for private universities that want to compete in the research arena. Two of the more dynamic private universities of the last decades are also two of the largest, New York University and the University of Southern California. Some other leading private universities also have undergraduate student populations numbering more than 7,000, including Columbia University, Cornell University, Harvard University, Stanford University, and the University of Pennsylvania, among others. The days of the highly exclusive 5,000-person undergraduate student body would appear to be ending. The growth is slow, however, because one of the chief attractions of elite education is precisely its intimacy and exclusivity. Nevertheless, enrollment trends suggest movement toward a convergence of a common human resources model for competitive research universities. The human resources model will be based on undergraduate student bodies of at least 6,000 (and many more than that in the public sector), graduate student bodies of at least 4,000 (and many more than that at the most broadly competitive research institutions), and research faculties of 800 to 1000 at a minimum. These enrollment and staffing levels provide the manpower (or, in the case of undergraduate enrollments, the rationale for manpower) necessary to field research operations in a sufficiently broad array of specialized areas for institutions seeking to compete at the highest level. Some continuing differences will, of course, remain in the sources and distribution of revenues. For the typical large public research university, tuition and state appropriations together will cover more than half of educational and research expenditures (with a continued slow shift toward higher tuition), grants and contracts about 30 percent; and gifts, endowment earnings, and investments the remaining 15 percent. By contrast, for the typical private research university, net tuition alone will cover approximately 40 percent of educational and research expenditures; grants, and contracts another 30 percent; and gifts, endowment earnings, and investments the remaining 30 percent. Institutions in both sectors will try to take the pressure off tuition by increasing their revenues from donations and earnings on investments. Because gifts and earnings from investments cannot rise fast enough to cover costs, however, pressures to raise tuition will remain strong in both sectors. Although some limit
Brint, CAN PUBLIC RESEARCH UNIVERSITIES COMPETE? 23
CSHE Research & Occasional Paper Series
on tuition must exist, universities have apparently not yet reached this limit. Tuition hikes are particularly problematic in the state-aided sector, however, given the expectation that public institutions will serve society at large, rather than the higher-income strata exclusively. Consequently, important debates about the state’s role in higher education lie ahead, assuming that tuitions continue to climb and the proportion of low-income students admitted continues to drop. Will new social compacts be reached to protect educational opportunities for students from low-income backgrounds, or will these students be priced out of the market? At some public institutions, students from the bottom half of family income already represent fewer than ten percent of the total student body. Unless a new social compact is reached, differences between public and private research universities may disappear at some distant point on the horizon. We are not yet close to this vanishing point; most public universities still receive a substantial proportion of their annual educational and research budgets from state appropriations. But we are witnessing glimpses of the future in the recent efforts of the Dean of the Boalt Hall School of Law at Berkeley to increase independence from the state (Mangan, 2005), and the independence of the business and law schools of the University of Virginia (Kirp, 2003: chap. 7).
Conclusion Some leaders of public research universities are pessimistic about the future of their institutions. They feel that they are failing to persuade the public of their institutions’ value, failing to hold on to top faculty, trying to educate too many students, juggling too many activities, and perpetuating organizations that are unmanageable to boot. A more balanced view suggests that public research universities are based on a high volume/low cost business model that remains viable and successful. Population advantages—student body size and its covariate, faculty size—are the main factors contributing to the viability and success of this model. Public research universities educate the great majority of students, including most students in the key areas of science and engineering. They produce many of the people who go on to run businesses, non-profit organizations, and government agencies in their states, and they publish the majority of new research. They do all this while at the same time providing substantially more opportunities for students from less privileged backgrounds. A somewhat more sanguine view of the competitive situation of public research universities is therefore warranted. These universities cannot gain prestige as easily as their wealthier and more selective counterparts among private institutions. They will not prepare as many national leaders per capita. They certainly will not win every faculty recruitment battle. But their total societal contribution, measured as human capital and research produced, is much greater. When public research university leaders feel envious of their colleagues in the wealthier private institutions, they might therefore benefit from recalling the words of the historian Allan Nevins. In 1962, Nevins authored a history of the land grant institutions to commemorate the centennial of the first Morrill Act. Justin Morrill’s legislation was remarkable, Nevins wrote, “as a profession of faith in the future in the midst of civil war.” But it was “still more memorable” for its “vision of the families of bright children, springing up

Brint, CAN PUBLIC RESEARCH UNIVERSITIES COMPETE? 24
CSHE Research & Occasional Paper Series
by the million over prairie, plain, and foothill ... with (an) appetite for knowledge, wisdom, and inspiration. (These children) could no longer be properly served by the small endowed colleges ... They needed a new education for a new society, lustier, more practical, more energetic, than any ... that had previously appeared on earth” (Nevins, 1962: 22). More than 40 years later, as we approach the sesquicentennial of the Morrill Act, those who work in public research universities can take heart in the continuing ability of their institutions to respond to the aspirations of millions, while enlisting those aspirations to the service of two great causes: the dissemination and further development of science and culture. At the same time, it is clear that the public research universities must work to renew their social compacts with the states to keep their institutions competitive in quality and societal contribution.
Acknowledgements
I would like to thank Mark Riddle and Lori Turk-Bicakci for research assistance. I would also like to thank G. William Domhoff, Mark Glander, Martin Kurzweil, Charles S. Levy, Suzanne Pichler, Ralph E. Pyle, Ted I.K. Youn, and Richard Zweigenhaft for providing data and resources that contributed to the quality of this paper. The National Science Foundation (NSF-SES-0086423-002) provided funds for the creation of one of the databases used in this paper. References American Association of State Colleges and Universities (AASCU) and National Association
of State University and Land-Grant Colleges (NASULG). 2004. Student Charges and Financial Aid 2003-2004. Washington, DC: AASCU and NASULGC.
Baltzell, E. Digby. 1953. “’Who’s Who in America’ and ‘The Social Register’: Elite and Upper
Class Indexes in Metropolitan America.” In Reinhard Bendix and Seymour Martin Lipset (Eds.). Class, Status and Power: A Reader in Social Stratification. Glencoe, IL: The Free Press. 172-84.
Bell, Linda A. 2001. “Uncertain Times: The Annual Report on the Economic Status of the
Profession, 2000-2001.” Academe (April-May): 26-35. Bowen, William G., and Derek Bok. 1998. The Shape of the River: Long-Term
Consequences of Considering Race in College and University Admissions. Princeton, NJ: Princeton University Press.
Breneman, David W., and Joni E. Finney. 1997. “The Changing Landscape: Higher
Education Finance in the 1990s.” In Patrick Callan and Joni E. Finney (Eds.). Public and Private Financing of Higher Education. Washington, DC: Oryx Press and American Council on Education. 30-59.
Brint, CAN PUBLIC RESEARCH UNIVERSITIES COMPETE? 25
CSHE Research & Occasional Paper Series
Brint, Steven. 2005. “Creating the Future: ‘New Directions’ in American Research
Universities.” Minerva 42 (1): 23-50. Brint, Steven, Charles S. Levy, Mark Riddle, and Lori Turk-Bicakci. 2003. Institutional Data
Archive on American Higher Education (IDA), 1970-2000. Riverside, CA: University of California, Riverside. Electronic database.
Burris, Val. 2004. “The Academic Caste System: Prestige Hierarchies in Ph.D. Exchange
Networks.” American Sociological Review 69: 239-64. Chronicle of Higher Education. 1995. Almanac 1995-96. Washington, DC: Chronicle of
Higher Education. ---. 2005. Almanac 2005-06. <www.chronicle.com/almanac/2005>. Retrieved June 2006. Clotfelter, Charles T. 1997. Buying the Best: Cost Escalation in Elite Higher Education.
Princeton, NJ: Princeton University Press. Ehrenberg, Ronald G. 2002. “Reaching for the Brass Ring: The U.S. News and World
Report Rankings and Competition.” Review of Higher Education 26: 145-62. Fitzgerald, Brian K., and Jennifer A. Delaney. 2002. “Educational Opportunity in America.”
In Donald E. Heller (Ed.). The Condition of Access: Higher Education for Lower Income Students. Washington, DC: American Council on Education and Praeger Publishers. 3-24.
“Fortune 500.” <www.cnn.com/fortune>. Retrieved June 2006. Geiger, Roger L. 2002. “The Competition for High-Ability Students: Universities in a Key
Marketplace.” In Steven Brint (Ed.). The Future of the City of Intellect: The Changing American University. Stanford, CA: Stanford University Press. 82-107.
---. 2004. Knowledge and Money: Research Universities and the Paradox of the
Marketplace. Stanford, CA: Stanford University Press. Geiger, Roger L., and Creso Sa. 2005. “Beyond Technology Transfer: New State Policies
for Economic Development for U.S. Universities.” Minerva 42 (1): 1-26. Gumport, Patricia J. 1993. “Graduate Education and Research Imperatives: Views from
American Campuses.” In Burton R. Clark (Ed.). The Research Foundations of Graduate Education: Germany, Britain, France, United States, Japan. Berkeley and Los Angeles: University of California Press. 261-93.
Han, Shin-Kap. 2003. “Tribal Regimes in Academia: A Comparative Analysis of Market
Structure Across Disciplines.” Social Networks 25: 251-80.
Brint, CAN PUBLIC RESEARCH UNIVERSITIES COMPETE? 26
CSHE Research & Occasional Paper Series
Higher Education Research Institute (HERI). 2003. National Norms for Freshmen, 2003.
Los Angeles: Higher Education Research Institute. Horowitz, Helen Lefkowitz. 1994. The Power and the Passion of M. Carey Thomas. New
York: Alfred A. Knopf. Institute for Scientific Information (ISI). 2005. Web of Science, 1975-2005. Washington,
DC: ISI. Electronic database. Kaplan, Ann E. 2005. Voluntary Support of Education, 2004. New York: Council for Aid to
Education. Kerr, Clark. 1962. The Uses of the University. Cambridge, MA: Harvard University Press. ---. 2001. The Blue and the Gold: A Personal Memoir of the University of California, 1947-
69. Berkeley: University of California Press. Kirp, David L. 2003. Shakespeare, Einstein, and the Bottom Line: The Marketing of Higher
Education. Cambridge, MA: Harvard University Press. Ladd, Everett Carll, Jr., and Seymour Martin Lipset. 1975. The Divided Academy:
Professors and Politics. New York: W.W. Norton. Mangan, Katherine S. 2005. “Dean of UC Berkeley’s Law School Calls for Partial
Privatization as Answer to Budget Woes.” Chronicle of Higher Education (Jan. 4): A21. Marquis Who’s Who. 1999. Who’s Who in America 2000. New Providence, NJ: Marquis
Publishing. McPherson, Michael S. 2000. The Enduring Folly of the College Rankings Game.
Washington, DC: National Association of Independent Schools. Monks, James, and Ronald G. Ehrenberg. 1999. “The Impact of U.S. News and World
Report College Rankings on Admissions Outcomes and Pricing Policies at Selective Private Institutions.” Cambridge, MA: National Bureau of Economic Research. Working Paper 7227.
Mortenson, Thomas G. 2004. “Family Income and Higher Education Opportunity, 1970 to
2002.” Postsecondary Education Opportunity 143. The Mortenson Seminar on Public Policy in Higher Education). Oscaloosa, IA: Post-Secondary Education Opportunity. (
National Association of College and University Business Officers (NACUBO). 2005. 2005
NACUBO Endowment Study. Washington, DC: NACUBO.

Brint, CAN PUBLIC RESEARCH UNIVERSITIES COMPETE? 27
CSHE Research & Occasional Paper Series
National Center for Education Statistics (NCES). 2002. Digest of Education Statistics 2002. Washington, DC: NCES.
---. 2005. Digest of Education Statistics 2005. <www.nces.ed.gov/digest>. Retrieved June
2006. ---. 2006. Integrated Postsecondary Education Statistics, 2005. <www.nces.ed.gov/ipeds>.
Electronic database. Retrieved June 2006. National Merit Scholarship Corporation. 2005. National Merit Scholarship Program: 50
Years. Evanston, IL: National Merit Scholarship Corporation. National Science Foundation. 2005. Webcaspar (Science and Engineering Statistics).
<www.webcaspar.nsf.gov>. Electronic database. Retrieved June 2006. Nevins, Allan. 1962. The State Universities and Democracy. Champaign-Urbana, IL:
University of Illinois Press. Palmer, James C., and Sandra L. Gillilan. 2004. State Higher Education Tax Appropriations
for Fiscal Years 2002 and 2003. Normal, IL: Illinois State University, Center for the Study of Education Policy.
Pascarella, Ernest T., and Patrick T. Terenzini. 2005. How College Affects Students: A
Third Decade of Research. San Francisco: Jossey-Bass. Princeton Review. 2004. Best 357 Colleges 2005. New York: Princeton Review. Pyle, Ralph E. 1996. Persistence and Change in the Protestant Establishment. New York:
Praeger. Rosenzweig, Robert M. 2001. The Political University: Policy, Politics, and Presidential
Leadership in the American Research University. Baltimore: Johns Hopkins University Press.
Slaughter, Sheila, and Larry L. Leslie. 1997. Academic Capitalism: Politics, Policies and the
Entrepreneurial University. Baltimore: Johns Hopkins University Press. Thompson, Nicholas. 2000. “Playing with Numbers: How U.S. News Mismeasures Higher
Education and What We Can Do About It.” Washington Monthly 32 (September): 16-23. Tobin, James. 1958. “Estimations of Relationships for Limited Dependent Variables.”
Econometrica 46: 24-36. U.S. Census Bureau. 2004. American Community Survey 2004: Data Profile.
<www.census.gov/acs>. Retrieved May 2005.

Brint, CAN PUBLIC RESEARCH UNIVERSITIES COMPETE? 28
CSHE Research & Occasional Paper Series
---. 2005. American Community Survey 2005: Data Profile. <www.census.gov/acs>. Retrieved June 2006.
U.S. News and World Report. 2002. America’s Best Colleges 2002. Washington, DC: U.S.
News and World Report. ---. 2006. America’s Best Colleges 2005. <www.usnews.com>. Retrieved June 2006. Youn, Ted I.K., Karen D. Arnold, and Katya Salkever. 1998. “Baccalaureate Origins and
Career Attainments of American Rhodes Scholars.” Paper presented at the Association for the Study of Higher Education, November.
Young, Charles E. 1997. “Successful Fund Raising at a Large Public Research University
with a Foundation: the University of California, Los Angeles.” In Frank H.T. Rhodes (Ed.). Successful Fund Raising in Higher Education: The Advancement of Learning. Phoenix: The American Council on Education and Oryx Press. 36-47.
Zweigenhaft, Richard L., and G. William Domhoff. 2006. Diversity in the Power Elite: How It
Happened, Why It Matters. Lanham, MD: Rowman and Littlefield. Notes
1. Over a ten-year period, among states with relatively large populations, few private colleges or universities, and significant population growth, the following states ranked below Colorado in the percentage change of appropriations for higher education: Alabama, Arizona, Missouri, New Jersey, Ohio, Oregon, Pennsylvania, South Carolina, Washington, and Wisconsin. In FY 2003, the bottom ten states in per capita spending on higher education were (in order): New Hampshire, Vermont, Missouri, Rhode Island, Montana, Pennsylvania, Arizona, Nevada, Oregon, and Florida. Colorado was 39th (Palmer and Gillilan, 2004: 17).
2. Operating budgets provide a marginal improvement over grants in the prediction of graduate student enrollments. Perhaps this is because larger campuses have more administrative jobs that graduate students can occupy and are also set in larger urban complexes, where graduate students can find employment. However, the differences in adjusted R-square between the two equations are negligible.
3. The 10 percent sample was drawn by counting every person whose last name began with “B.” I used the letter “B” not only because it yielded the desired sample size, but also because it is not manifestly influenced by a particular ethnic distribution of names, as might, for example, be the case with such letters as “D” (disproportionately Italian and French), “M” (disproportionately Scottish and Irish), or “O” (disproportionately Irish).
4. Studies using Who’s Who for purposes of identifying a national elite are complicated by limitations of the data: Many accomplished people do not choose to have their biographies

Brint, CAN PUBLIC RESEARCH UNIVERSITIES COMPETE? 29
CSHE Research & Occasional Paper Series
included in Who’s Who. Some of those included in Who’s Who may not in fact represent the highest levels of achievement in their fields. Early studies suggested that business leaders are under-represented, while educators are over-represented (Baltzell, 1953; see also Pyle, 1996). Other occupations, such as nursing, may also be over-represented. Studies attempting to identify the baccalaureate origins of national leaders included in Who’s Who face additional limitations. Some of those who failed to list a baccalaureate institution did graduate from college. Thus, many doctors, lawyers, and judges list only their first professional degree institution. Perhaps half of those listed with no baccalaureate college attained a first professional degree. I took a conservative approach to these cases and coded them as “no college listed.”
5. I counted all current “Carnegie doctoral-extensive” research universities as “research universities.” I counted all other institutions either as “other private” or “other public” institutions, depending on control. Some current private research universities, such as the University of Miami and Lehigh University, were not research universities at the time that people listed in Who’s Who attended. Similarly, some current public research universities, such as the University of South Florida and the University of California-Santa Cruz, have been identified as research universities only recently. This introduces a certain amount of error into the estimates, but the amount of error is not great because the new research universities tend to account for a relatively small number of people in the sample. In addition, it is worth noting that “other public” institutions include the national military institutes (U.S. Army Academy, U.S. Naval Academy, and U.S. Air Force Academy) that are not supported by any of the 50 states, but rather by the federal government.
6. These estimates are based on NCES data for the distribution of students in public and private degree-granting institutions. These estimates show that the distribution between the two sectors were approximately even in the 1940s and 1950s, shifted to a 60-40 public-private split by 1960, shifted again to a 75-25 public-private split by 1970, and to an 80-20 public-private split by 1980, before moving back in the direction of a 75-25 public-private split in the 1990s. The group represented in the Who’s Who sample attended college between approximately 1940 and approximately 1980, with the majority attending in the 1960s and 1970s. Community colleges did not become a large part of the post-secondary education system until the end of the 1960s. Most of the shifting balance toward the public sector from that point on can be attributed to the growth of community colleges. Thus, it is reasonable to argue that, for most of the period, the public-private four-year split would have been approximately 60 percent public and 40 percent private. Another approach to estimation is based on projecting backwards from current data. According to NCES, among four-year college and university students, seven percent of students are enrolled in private research universities, 27 percent are enrolled in public research universities, 28 percent are enrolled in “other private” institutions, and 38 percent are enrolled in “other public” institutions (NCES, 2002: Table 214). I estimate that all of the growth over time has been captured by the “other public” category, with each of the three other categories of institutions losing approximately equal shares to the “other public” institutions. A smoothed distribution, therefore, yields the 10-30-30-30 split used in Table 5.

Brint, CAN PUBLIC RESEARCH UNIVERSITIES COMPETE? 30
CSHE Research & Occasional Paper Series
7. The accuracy of the estimate is particularly important for the smallest category, private research universities. Even a one percent change in the proportion of private research university graduates (from 10 to nine percent) would mean that the over-representation of these institutions among Who’s Who biographical listings would be closer to 3:1 than to 2.5:1. 8. Selectivity level is undoubtedly a larger influence on career recognition as measured by Who’s Who than the type and control of the college or university attended. According to one recent study, between 15 and 20 percent of American college graduates listed in Who’s Who for the years 1950, 1970, and 1992 graduated from just 12 selective private colleges and universities (Pyle, 1996: 79). Thus, highly selective private liberal arts colleges, such as Amherst, Dartmouth, and Williams, contributed many graduates to Who’s Who in my study, as did selective public colleges and universities, such as the U.S. Naval Academy, Miami University of Ohio, and the College of William and Mary. Less selective private colleges—including, for example, bible colleges and seminaries—and less selective public universities—such as teacher’s colleges and regional master’s granting institutions—contributed many fewer graduates to Who’s Who. City University of New York is a notable exception in the public sector.
9. This calculation does not include gifts for the purposes of establishing a new institution. One of the largest recent gifts, by the Olin Foundation, was for the establishment of the new Olin College of Engineering. Nor does the calculation include scholarship gifts to be distributed over a wide range of institutions (such as the “Gates Millennium Scholars” program or the Annenberg gift to the United Negro College Fund).
10. As one moves from the top to the bottom ranks of the two sectors, private endowment per student consistently exceeds public endowment per student by between 15 and 10 to 1. Thus, to choose one example for illustration, Washington University of St. Louis, 26th on the private list, had an endowment per student of over of over $330,000 in 2002, while the University of Minnesota, 26th on the public list, had an endowment per student of under $26,000 (NACUBO, 2005). 11. For discussions of the many flaws in the U.S. News and World Report methodology, see Ehrenberg (2002), McPherson (2000), and Thompson (2000). For a discussion of the influence of the ratings, see Monks and Ehrenberg (1999).
12. In recent editions, the USN rankings have been based on seven factors: academic reputation, student retention, faculty resources, student selectivity, financial resources, graduation rate performance, and alumni giving. At least six of the seven—graduation rate performance is questionable—are either based directly on selectivity and wealth, or are highly correlated with selectivity and wealth.
13. In its top 20 lists, the Princeton Review (2004) cites 19 private colleges and universities and one service academy as providing the “best overall academic experience.” It cites 18 private colleges and universities and two public universities as “toughest to get into.” It cites

Brint, CAN PUBLIC RESEARCH UNIVERSITIES COMPETE? 31
CSHE Research & Occasional Paper Series
18 private colleges and universities and two service academies as places where students “study hard.” It cites 20 private liberal arts colleges as places where professors “bring the material to life,” and 18 private liberal arts colleges and two service academies as places where professors “are accessible.”
14. One reason why USN may refuse to report all of the data necessary to reproduce their rankings is that they would rather researchers and administrators not discover that their elaborate formula, based on more than a dozen measures, could be replaced, without too much loss of precision, by a single input variable: average SAT/ACT scores for incoming freshmen. 15. In my sample of research universities, the correlation between selectivity (as measured by average SAT scores of incoming freshmen) and wealth (as measured by market value of endowment assets per student) is .71. Because of this high correlation, introduction of a wealth measure into regressions on USN rank leads to potential problems of multicollinearity. With this proviso in mind, it is nevertheless notable that, once selectivity is controlled, the wealth measure is significantly and negatively related to USN rank. Thus, it would appear that institutions that do not convert wealth into high levels of selectivity are penalized in rank, while the majority of wealthy institutions are rewarded, because they succeed in making the conversion of wealth to high selectivity.
16. USN would not release ranks of universities below the “top 50” for reasons of confidentiality. I therefore estimated the rank for the institutions in my sample below the “top 50.” I was able to obtain measures of all but one used by USN in computing their rankings. Where I could not find a value for a particular variable, I assigned the midpoint. I used a procedure of weighting by rank on each variable. I grouped institutions with similar scores on the 13 variables I analyzed. These groupings no doubt fail to replicate exactly those used by USN. In addition, my formula for computing scores may have differed in other minor respects from the formula used by USN. For these reasons, my rankings for second through fourth-tier institutions do not exactly replicate the USN (2002) rankings. I checked these estimation procedures by attempting to replicate the rank ordering of institutions in my sample that also appeared in the USN sample of “top 50 public national universities – doctoral.” With a handful of exceptions (notably, the University of Minnesota, the University of Arizona, and the University of Kansas), my rank order of “top 50 public national universities” was very close to the rank order reported by USN. This success increased my confidence in the accuracy of my estimated ranks for institutions below the top 50. For the very few institutions in my sample ranked by USN as third and fourth tier national universities, I assigned the institutions to the midpoints of their USN quartiles (ibid.: 75-77). My estimate of the variance explained by average SAT score could therefore be slightly inflated.
17. The advantage shifts to the private institutions in relation to production of doctors, lawyers, and ministers (first professional degrees). Private institutions produce nearly three out of five of these first professional degrees (NCES, 2005: 315).

Brint, CAN PUBLIC RESEARCH UNIVERSITIES COMPETE? 32
CSHE Research & Occasional Paper Series
18. The 1989 College and Beyond cohort from selectivity level 3 (average SATs of below 1150) included University of Miami (Ohio), University of Michigan, Ann Arbor, University of North Carolina, Chapel Hill; and Pennsylvania State University (Bowen and Bok, 1998: 339).
19. The 1989 College and Beyond cohort from selectivity level 1 (average SATs over 1300) includes students from Bryn Mawr College, Duke University, Princeton University, Stanford University, Williams College, and Yale University. The 1989 cohort from selectivity level 2 (average SATs between 1300 and 1150) included Kenyon College, Oberlin College, University of Pennsylvania, Vanderbilt University, Washington University, Wellesley University, and Wesleyan University (Bowen and Bok, 1998: 339).
20. In 2003, the median family income in the United States was approximately $43,500 (U.S. Census Bureau 2004: Table 3). In Fall 2003, only about 11 percent of students from the most selective private universities reported family incomes of $40,000 or less. In the most selective public universities, 17 percent reported family incomes at this level (HERI, 2003: 78). These figures are for purposes of illustration only. The national median includes many people on fixed incomes who are well beyond the age at which most families send children to college.
21. It is conventional (and undoubtedly correct) to assume that a higher quantity of work does not necessarily translate into higher quality work. At the same time, no warrant exists for making the opposite assumption: that low levels of quantitative output reflect high quality, or more stringent standards. Early studies of academic publishing showed that quantity and quality were not inversely related; the top publishers in a field were also generally influential leaders in the field (Ladd and Lipset, 1975: 142-6). In recent years, studies of the relationship of productivity to prestige have shifted to the departmental level. Scholars find that productivity can be a less important influence on prestige than factors such as size and centrality in Ph.D. exchange networks (Burris, 2004; Han, 2003).
22. The Institutional Data Archive contains financial data at five-year intervals. I therefore used 1990 data in the analysis of the 1993 NRC program evaluations. Unfortunately, average SAT data is available for 1982 and 1999 only. However, this is not quite as severe a problem as might be imagined, since the correlation between average SATs in 1982 and 1999 are very high (.92).
23. Honors colleges may be one additional attraction for “super students” enrolled in public universities. As Geiger (2002) observes, honors colleges allow for the reproduction of learning environments similar to those found at selective private institutions. In this way, public institutions can reproduce the “peer effects” of private institutions.
24. The state universities in a few other low population agricultural and mining states—such as Alaska, Montana, North Dakota, and South Dakota—do not grant enough doctoral degrees to place them in the “Carnegie doctoral-extensive” ranks.

Brint, CAN PUBLIC RESEARCH UNIVERSITIES COMPETE? 33
CSHE Research & Occasional Paper Series
25. NCES figures were supplemented by enrollment data from the websites of selected private institutions enrolling fewer than 15,000 students. 26. Rosenzweig (2001) provides a history of developments during his tenure as director of the Association of American Universities. He dates the modern era of lobbying for earmarked appropriations to 1983, when Catholic University and Columbia University both appeared in an energy department appropriation for building funds. He holds Columbia accountable for the most serious breach, both because of its high prestige and because it retained a lobbying firm to help in its efforts: “Had only Catholic been involved, the appropriation would no doubt have been deplored but then dismissed as another favor to the Speaker (Tip O’Neill, who was known to have a special fondness for Catholic universities). Columbia, however, was different. Here was an Ivy League university, with great prestige and a distinguished faculty, that had judged this an acceptable way to obtain federal funds. Suddenly, the color of legitimacy had been given to what had previously been a marginal, slightly disreputable practice” (Rosenzweig, 2001: 38-9).