dr. ranu rani sethi senior scientist directorate of water management (icar) bhubaneswar, odisha
TRANSCRIPT

Geospatial Techniques for Identifying the Paddy Cultivated
areas in Agro Climatic Region (ACR)-VI
Dr. Ranu Rani SethiSenior Scientist
Directorate of Water Management (ICAR) Bhubaneswar, ODISHAD
irect
ora
te o
f W
ate
r M
anagem
ent
Bhubanesw
ar,
O
dis
ha
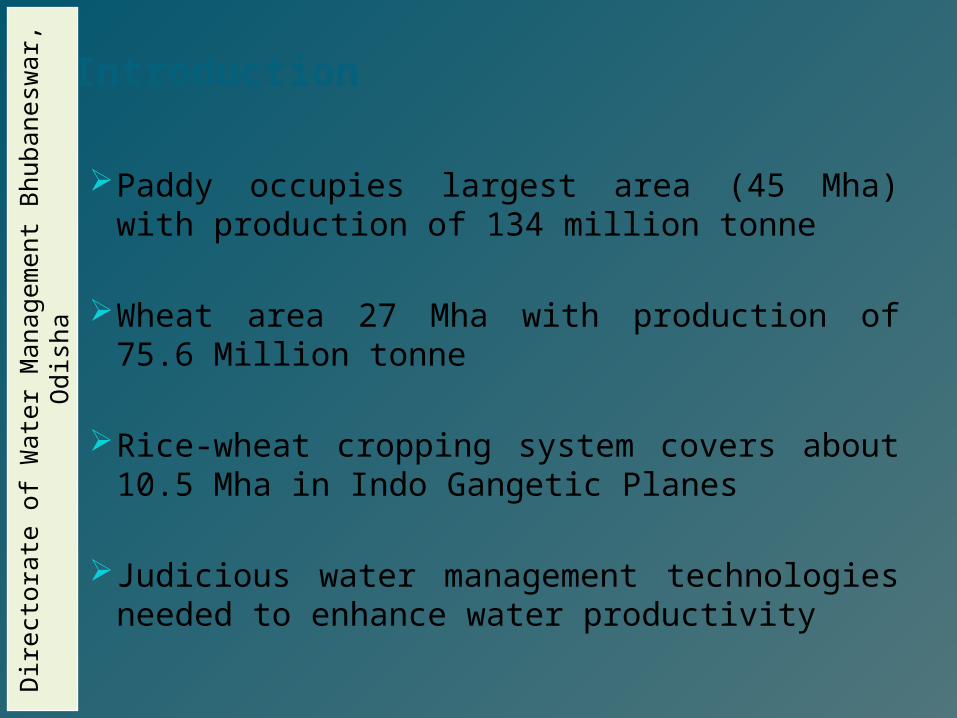
Introduction
Paddy occupies largest area (45 Mha) with production of 134 million tonne
Wheat area 27 Mha with production of 75.6 Million tonne
Rice-wheat cropping system covers about 10.5 Mha in Indo Gangetic Planes
Judicious water management technologies needed to enhance water productivity
Dir
ect
ora
te o
f W
ate
r M
anagem
ent
Bhubanesw
ar,
O
dis
ha

Dir
ect
ora
te o
f W
ate
r M
anagem
ent
Bhubanesw
ar,
O
dis
ha

Agro Climatic Region-VI
Dir
ect
ora
te o
f W
ate
r M
anagem
ent
Bhubanesw
ar,
O
dis
ha
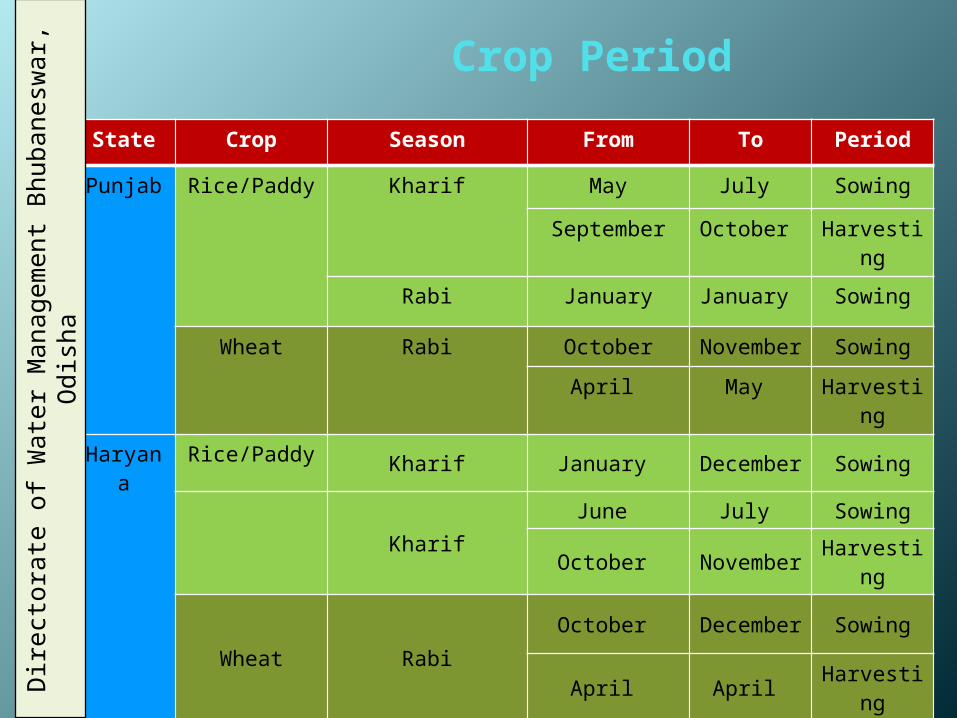
Crop Period
State Crop Season From To Period
Punjab Rice/Paddy Kharif May July Sowing
September October Harvesting
Rabi January January Sowing
Wheat Rabi October November Sowing
April May Harvesting
Haryana Rice/PaddyKharif January December Sowing
KharifJune July Sowing
October November Harvesting
Wheat RabiOctober December Sowing
April April Harvesting
Dir
ect
ora
te o
f W
ate
r M
anagem
ent
Bhubanesw
ar,
O
dis
ha

StrengthRainfall varies from 190 mm to 1,150 mm
Important sources for irrigation: Beas, Ravi, Sutlej, Yamuna and Ghaggar rivers
Phenomenal increase in agricultural productivity
referred as Green Revolution
Dir
ect
ora
te o
f W
ate
r M
anagem
ent
Bhubanesw
ar,
O
dis
ha
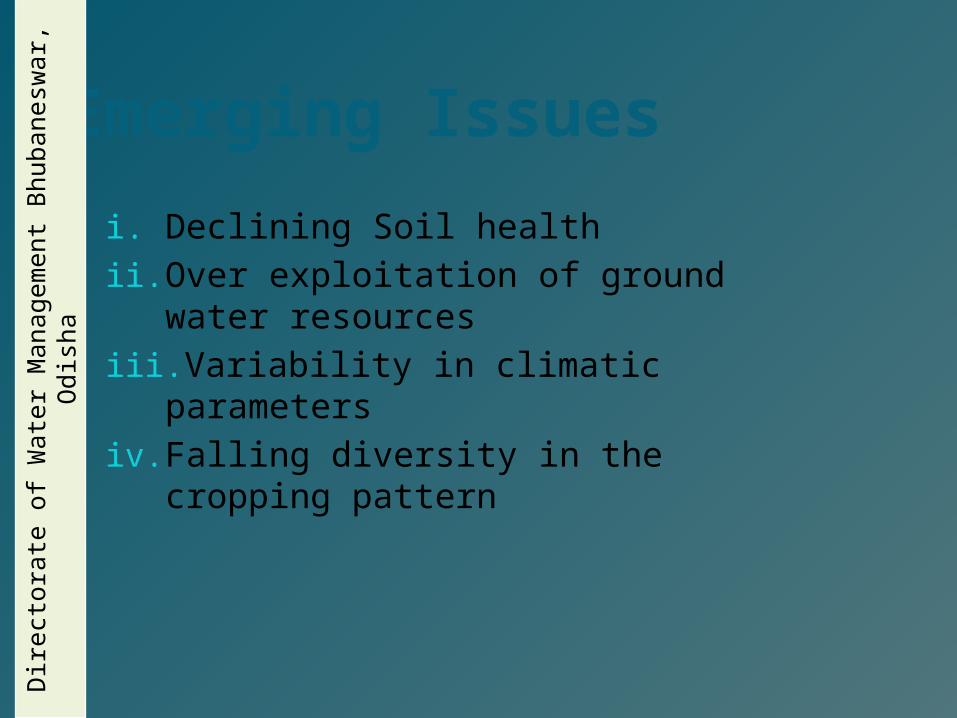
Emerging Issues
i. Declining Soil healthii. Over exploitation of ground water
resourcesiii. Variability in climatic parametersiv. Falling diversity in the cropping
pattern
Dir
ect
ora
te o
f W
ate
r M
anagem
ent
Bhubanesw
ar,
O
dis
ha
Objectives
To find out uniformity of information related to crop coverage.
To provide support to the field research and to assist in the decision making process
Dir
ect
ora
te o
f W
ate
r M
anagem
ent
Bhubanesw
ar,
O
dis
ha

Geospatial Analysis
“A powerful set of tools for storing, retrieving, transforming and displaying spatial data from the real world for a particular set of purposes”
Dir
ect
ora
te o
f W
ate
r M
anagem
ent
Bhubanesw
ar,
O
dis
ha

Methodology
Software Raster Analysis Vector Analysis
Arc GIS 10.0
MosaicComposing bands Supervised Classification
Data used: Landsat ETM+ images
DigitizationOverlay ClippingKrigging,Thematic mapping
Data used : Analog Maps, Numerical values in Excel Sheet
Dir
ect
ora
te o
f W
ate
r M
anagem
ent
Bhubanesw
ar,
O
dis
ha
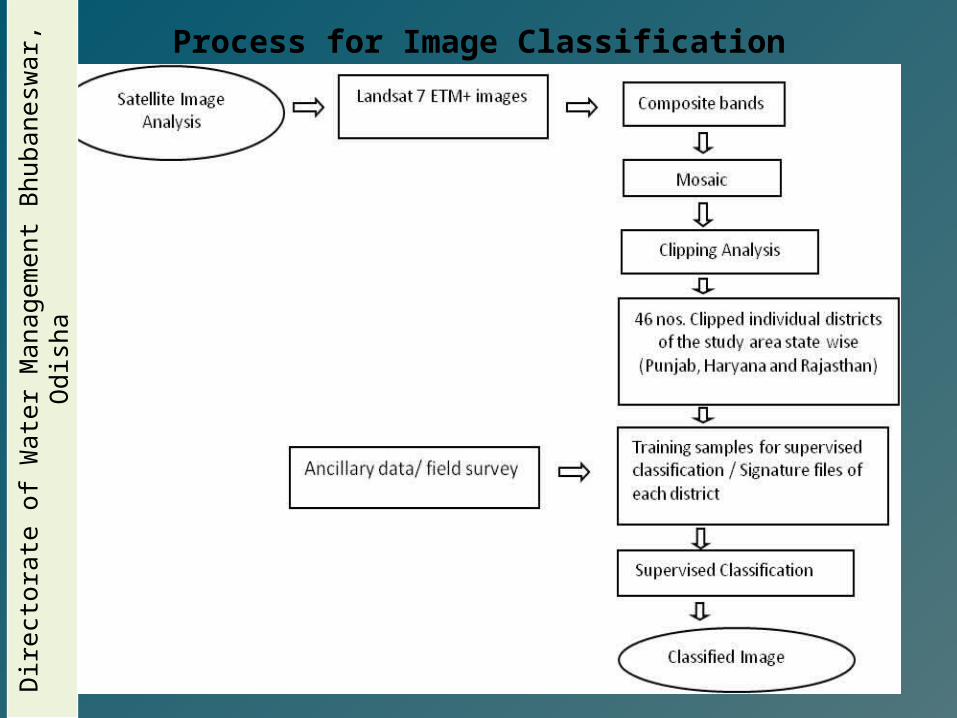
Process for Image ClassificationD
irect
ora
te o
f W
ate
r M
anagem
ent
Bhubanesw
ar,
O
dis
ha

Sl. No. Path-Row Month, Year Sensor No. of Bands Spatial Resolution /
Pixel Dimension (m2)
Total no. of images
1 146-40 October,2000 ETM+ 8 60×60
12
2 146-41 October,2000 ETM+ 8 60×60
3 147-38 October,2000 ETM+ 8 60×60
4 147-39 September,2000 ETM+ 8 60×60
5 147-40 September,2000 ETM+ 8 60×60
6 147-41 September,2000 ETM+ 8 60×60
7 148-38 October,2000 ETM+ 8 60×60
8 148-39 October,2000 ETM+ 8 60×60
9 148-40 October,2000 ETM+ 8 60×60
10 149-38 October,2000 ETM+ 8 60×60
11 149-39 October,2000 ETM+ 8 60×60
12 149-40 October,2000 ETM+ 8 60×60
Source Site: http://glcf.umd.edu
Details of Landsat dataD
irect
ora
te o
f W
ate
r M
anagem
ent
Bhubanesw
ar,
O
dis
ha
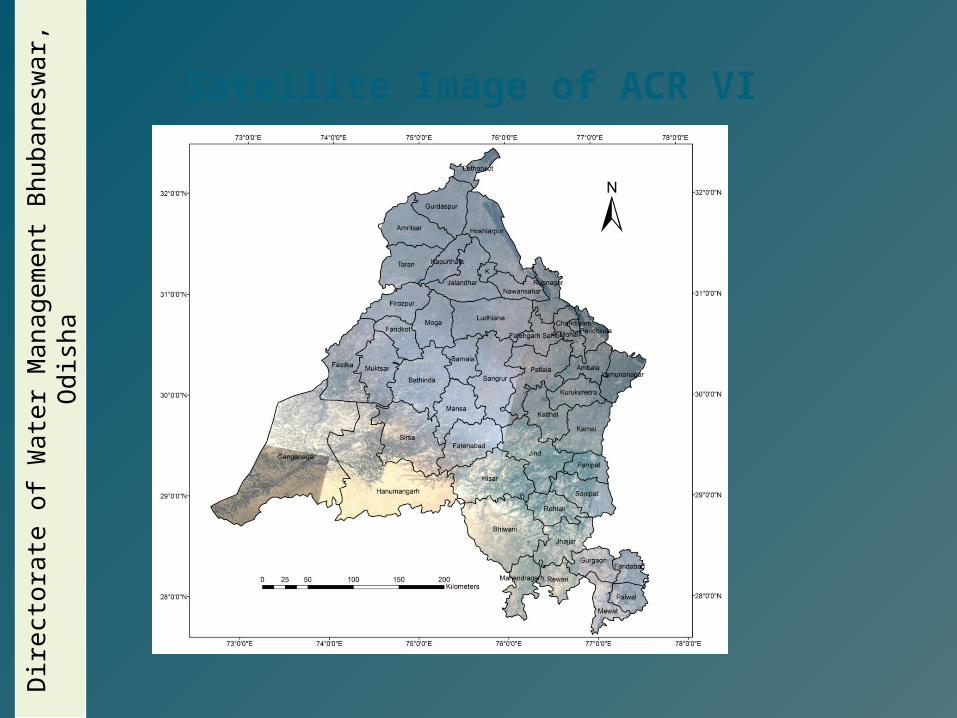
Satellite Image of ACR VID
irect
ora
te o
f W
ate
r M
anagem
ent
Bhubanesw
ar,
O
dis
ha
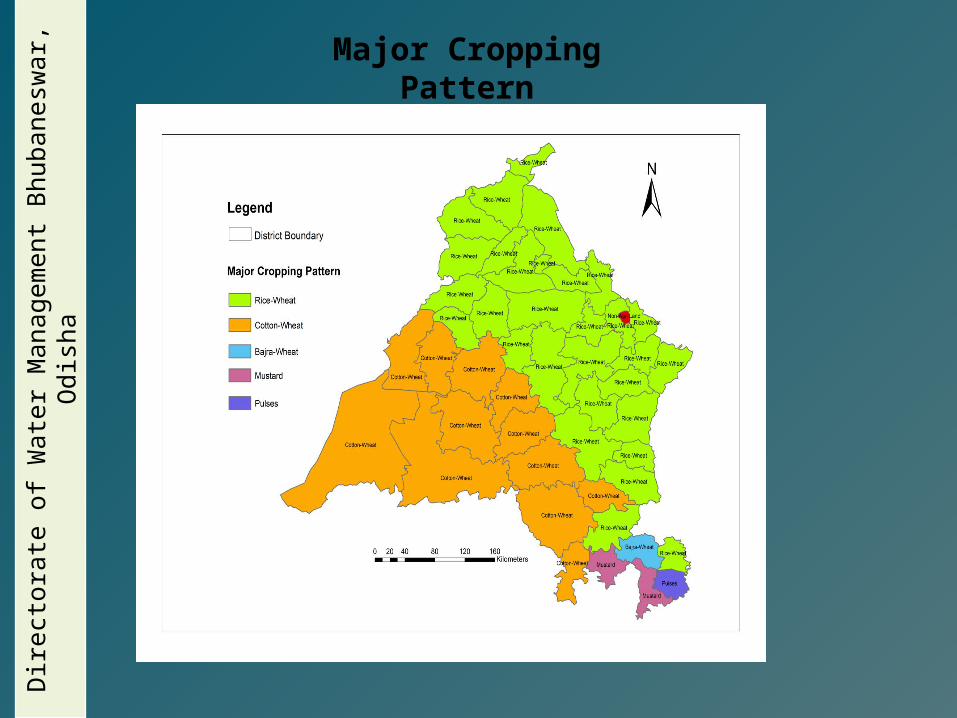
Major Cropping Pattern
Dir
ect
ora
te o
f W
ate
r M
anagem
ent
Bhubanesw
ar,
O
dis
ha

Paddy Cultivated Area (Geo spatial analysis)
Geographical Area (‘000 ha)
ACR VI 11410.3
Punjab 4969.3
Haryana 4380.8
Rajasthan
2060.2
Paddy Area Remote Sensing analysis (‘000 ha)
Punjab 2626
Haryana 1051Dir
ect
ora
te o
f W
ate
r M
anagem
ent
Bhubanesw
ar,
O
dis
ha

Comparison of cropped area
State No. of Districts in ACR VI
Area under Rice (Published reports) '000 ha
Area under Rice (Image Classification Analysis) '000 ha
Punjab 23 2611 2626
Haryana 21 1049 1051
Rajasthan 2 Nil Nil
Dir
ect
ora
te o
f W
ate
r M
anagem
ent
Bhubanesw
ar,
O
dis
ha

Acknowledgements
National Fund for Basic, Strategic and Frontier Application Research in Agriculture (NFBSFARA), ICAR, New Delhi
Dr A.Sarangi, P.I. of DSSEWP project, WTC, New Delhi
DSS Project associates: Dr M.J.Kaledhonkar, Dr. K.G. Mandal, Dr. Bandopadhyay, Mr Amiya Sagar Sahu
Dr Ashwani Kumar, Director, DWM
Dir
ect
ora
te o
f W
ate
r M
anagem
ent
Bhubanesw
ar,
O
dis
ha

THANK YOU