dr. mario mazzocchiresearch methods & data analysis1 fundamentals of sampling method week 4...
Post on 21-Dec-2015
214 views
TRANSCRIPT

Dr. Mario Mazzocchi Research Methods & Data Analysis
1
Fundamentals of Fundamentals of Sampling MethodSampling Method
Week 4Research Methods & Data
Analysis

Dr. Mario Mazzocchi Research Methods & Data Analysis
2
TutorialsTutorials
• Thursday 30th October 9-11 AG GL 20 (M. Mazzocchi)
• Tuesday 4th November11-1pm (H.Neeliah)
• You may attend:– One (the most convenient for you)– Both (it may be very useful)– None (not really advised…)

Dr. Mario Mazzocchi Research Methods & Data Analysis
3
Lecture outlineLecture outline
• Key notions of statistics• Simple random sampling• Sampling error• Sampling size• Other sampling methods

Dr. Mario Mazzocchi Research Methods & Data Analysis
4
DistributionsDistributions• A set of values of a
set of data together with their– Absolute
frequencies– Relative
frequencies (probabilities)
200.00 300.00 400.00 500.00 600.00 700.00
Amount spent
0
20
40
60

Dr. Mario Mazzocchi Research Methods & Data Analysis
5
Relative and cumulate Relative and cumulate frequenciesfrequencies
fi=ni/N 1 21
i
i i hh
F f f f f
200.00 300.00 400.00 500.00 600.00 700.00
Amount spent
2%
4%
6%
8%
Per
cen
t
200.00 300.00 400.00 500.00 600.00 700.00
Amount spent
0%
25%
50%
75%
100%
Per
cen
t
Dr. Mario Mazzocchi Research Methods & Data Analysis
6
Distributions of random Distributions of random variablesvariables
• The distribution of possible values together with their probabilities (probability density function, p.d.f.)

Dr. Mario Mazzocchi Research Methods & Data Analysis
7
The normal (Gaussian) The normal (Gaussian) distributiondistribution
• …is the distribution representing perfect randomness around a mean value
• In statistics, the normal distribution play a key role in the theory of errors
• The central limit theorem implies that “averaging” almost always give origin to a normal distribution (error on the average is random), provided that the number of observation is large (>40)

Dr. Mario Mazzocchi Research Methods & Data Analysis
8
The normal distributionThe normal distribution
p
-1.96 +1.96
0,025 0,025
95% of values

Dr. Mario Mazzocchi Research Methods & Data Analysis
9
The student-t The student-t distributiondistribution
• When the parameter in the population has a normal distribution (with unknown variance), within the sample the parameter assumes a t distribution
• The t-distribution is similar to the normal distribution, apart from having higher tail-probabilities
• The bigger is the sample, the more similar the t-distribution is to the normal distribution
• For samples with more than 30-40 units, the difference between the two distributions is negligible

Dr. Mario Mazzocchi Research Methods & Data Analysis
10
The t-distributionThe t-distribution
xx-tsx x+tsx
Dr. Mario Mazzocchi Research Methods & Data Analysis
11
tt/2/2 and z and z/2 /2 – tabled – tabled valuesvalues
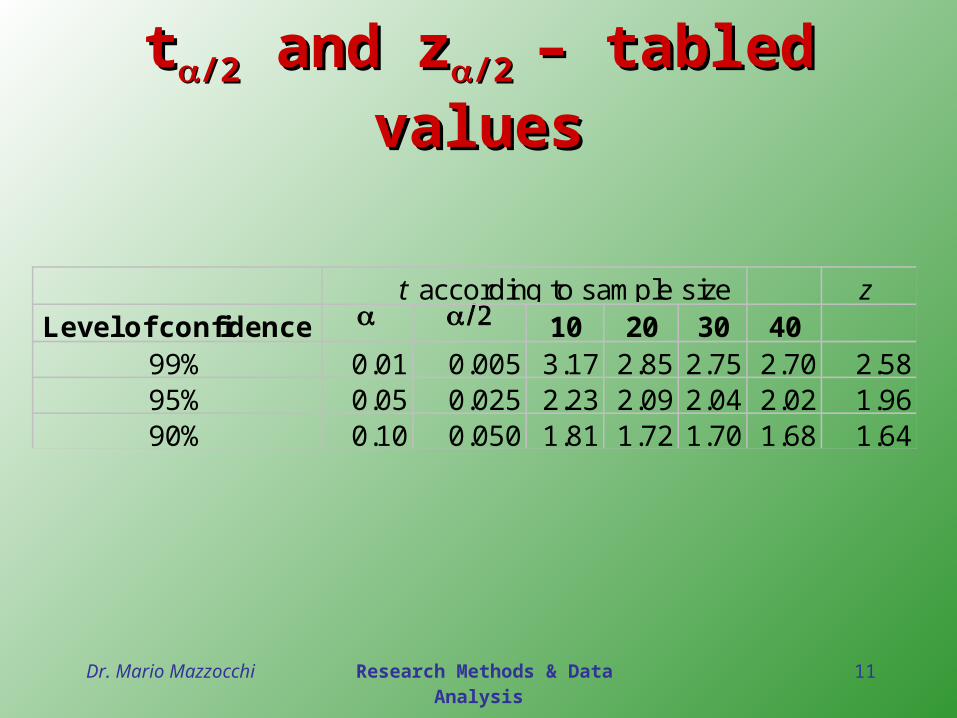
t according to sample size zLevel of confidence 10 20 30 40
99% 0.01 0.005 3.17 2.85 2.75 2.70 2.5895% 0.05 0.025 2.23 2.09 2.04 2.02 1.9690% 0.10 0.050 1.81 1.72 1.70 1.68 1.64

Dr. Mario Mazzocchi Research Methods & Data Analysis
12
Population parametersPopulation parameters(in a population of N elements)(in a population of N elements)
• Mean
• Variance
• Standard deviation
1
1 N
ii
xN
2 2
1
1( )
N
ii
xN
2 2
1
1( )
N
ii
xN

Dr. Mario Mazzocchi Research Methods & Data Analysis
13
SamplingSampling
• A sample is a subgroup of the population selected for the study
• Sample statistics allow to make inference about the population parameters, through estimation and hypothesis testing
• The sample space is a complete set of all possible results of the sampling procedure

Dr. Mario Mazzocchi Research Methods & Data Analysis
14
Simple random Simple random samplingsampling
• Each element of the population has a known and equal probability of selection
• Every element is selected independently from other elements
• The probability of selecting a given sample of n elements is computable (known)
• The Central Limit Theorem guarantees that for simple random samples with sample size (n) sufficiently large (>40), the sample mean in a S.R.S. follows the normal distribution

Dr. Mario Mazzocchi Research Methods & Data Analysis
15
Sample Sample statisticsstatistics
• Sample mean
• Sample variance
• Sample standard deviation
1
1 n
ii
x xn
2 2
1
1( )
1
n
ii
s x xn
2 2
1
1( )
1
n
ii
s s x xn
unbiasedness

Dr. Mario Mazzocchi Research Methods & Data Analysis
16
Standard deviation and Standard deviation and standard errorstandard error
• The standard deviation measures the variability of a given variable (e.g. X) within the population or sample
• The standard error refers to the accuracy (variability) of the sample statistics (e.g. mean), i.e. the error due to the fact that the statistic is computed on a sample rather than on the population (sampling error)

Dr. Mario Mazzocchi Research Methods & Data Analysis
17
Basic SRS sample statistics Basic SRS sample statistics (unknown pop. variance)(unknown pop. variance)
Mean case Proportion case (p)
n
xx
n
ii
1
2
x
ss
n
(1 )1
ns p p
n
Sample standard
deviation of X
2
1
( )
1
n
ii
x xs
n
Standard error of the mean/proportion
(1 )
1p
p ps
n
ACCURACY of sample estimates

Dr. Mario Mazzocchi Research Methods & Data Analysis
18
Finite population Finite population correction factorcorrection factor
• For finite population (…i.e. all in social research), large samples (more than 10% of N) tend to overestimate the standard error of the sample mean (proportion)
• In order to account for that, the following correction is necessary
2
x
ss
n
(1 )
1p
p ps
n
1
n
N 1
n
N

Dr. Mario Mazzocchi Research Methods & Data Analysis
19
Level of confidence Level of confidence and and zz parameter parameter
x/ 2 xx z s / 2 xx z s
The level of confidence refers to the probability that the true population mean falls in the identified confidence interval
Confidence interval for x at a level of confidence
For the normal distribution, given a
value of , the corresponding z values is tabulated
=0.05
z =1.96
Dr. Mario Mazzocchi Research Methods & Data Analysis
20
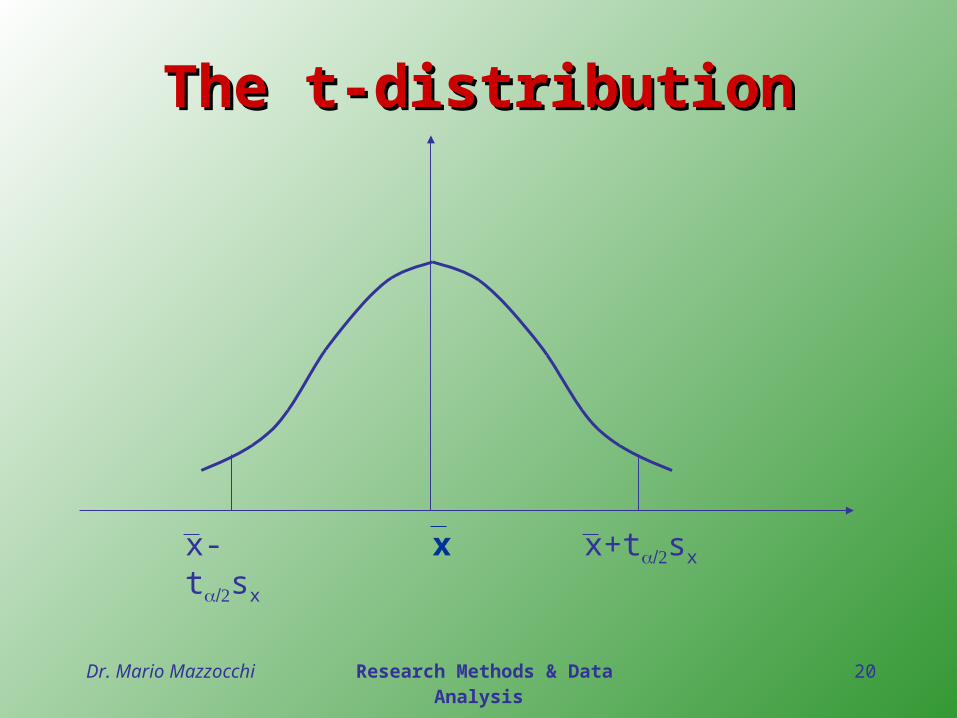
The t-distributionThe t-distribution
xx-tsx x+tsx

Dr. Mario Mazzocchi Research Methods & Data Analysis
21
Confidence intervalsConfidence intervals
• Calculate the sample mean• Decide a level of confidence (usually
95% or 99%)• Choose whether using the Student-t
distribution or the Normal distribution
• Compute the sample standard error• Define the lower and upper bound of
the confidence interval

Dr. Mario Mazzocchi Research Methods & Data Analysis
22
ExerciseExercise
• Suppose that you have interviewed 20 students out of 200 in the agricultural building, asking them how much they paid for lunch yesterday
• You get an average of £ 3.67• The standard deviation is 1.25• Compute the 95% confidence interval• Compute the 99% confidence interval

Dr. Mario Mazzocchi Research Methods & Data Analysis
23
Determining sample Determining sample sizesize
Factors influencing sample size (n):• Size of the population (N) • Variability of the population ()• Desired level of accuracy (• Level of confidence (• Budget constraint

Dr. Mario Mazzocchi Research Methods & Data Analysis
24
Simple random Simple random sampling: determining sampling: determining
sample sizesample size• Relative sampling error (r.s.e)
• Determining sampling size for a given r.s.e. (approximate formula)
/ 2 1xt s nr
NnX
2
/ 20
xt sn
rX

Dr. Mario Mazzocchi Research Methods & Data Analysis
25
The sampling design The sampling design processprocess
1.Define the target population, its elements and the sampling units
2.Determine the sampling frame (list)3.Select a sampling technique
• Sampling with/without replacement• Probability/Nonprobability sampling
4.Determine the sample size• Precision versus costs• The marginal value in terms of precision of
additional sampling units is decreasing5.Execute the sampling process

Dr. Mario Mazzocchi Research Methods & Data Analysis
26
The sampling The sampling techniquestechniques
• Probabilistic samples– Simple random sampling– Systematic sampling– Stratified sampling– Cluster sampling– Other sampling techniques
• Nonprobabilistic samples– Convenience sampling– Judgmental sampling– Quota sampling– Snowball sampling

Dr. Mario Mazzocchi Research Methods & Data Analysis
27
RepresentativenessRepresentativeness
• A sample can be considered as “representative” when it is expected to exhibit the average properties of the population

Dr. Mario Mazzocchi Research Methods & Data Analysis
28
Selection biasSelection bias
• Improper selection of sample units (ignoring a relevant “control variable” that generate bias), so that the values observed in the sample are biased and the sample is not representative.
Example:A survey is conducted for measuring goat
milk consumption, but the interviewers just select people in urban areas, that on average drink less goat milk.

Dr. Mario Mazzocchi Research Methods & Data Analysis
29
Simple random Simple random samplingsampling
• Each element of the population has a known and equal probability of selection
• Every element is selected independently from other elements
• The probability of selecting a given sample of n elements is computable (known)
–Statistical inference is possible–It is easily understood
–Representative samples are large and expensive–Standard errors are larger than in other probabilistic sampling techniques–Sometimes it is difficult to execute a really random sampling

Dr. Mario Mazzocchi Research Methods & Data Analysis
30
Systematic samplingSystematic sampling• A list of N elements in the population is compiled,
ordered according to a specified variable– Unrelated to the target variable (similar to SRS)– Related to the target variable (increased
representativeness)
• A sampling size n is chosen• A systematic step of k=N/n is set• A random number s between 1 and N is extracted
and represents the first element to be included• Then the other elements selected are s+k, s+2k,
s+3k…–Cheaper and easier than SRS–More representative if order is related to the interest variable (monotone)–Sampling frame not always necessary
–Less representative (biased) if the order is cyclical
Dr. Mario Mazzocchi Research Methods & Data Analysis
31
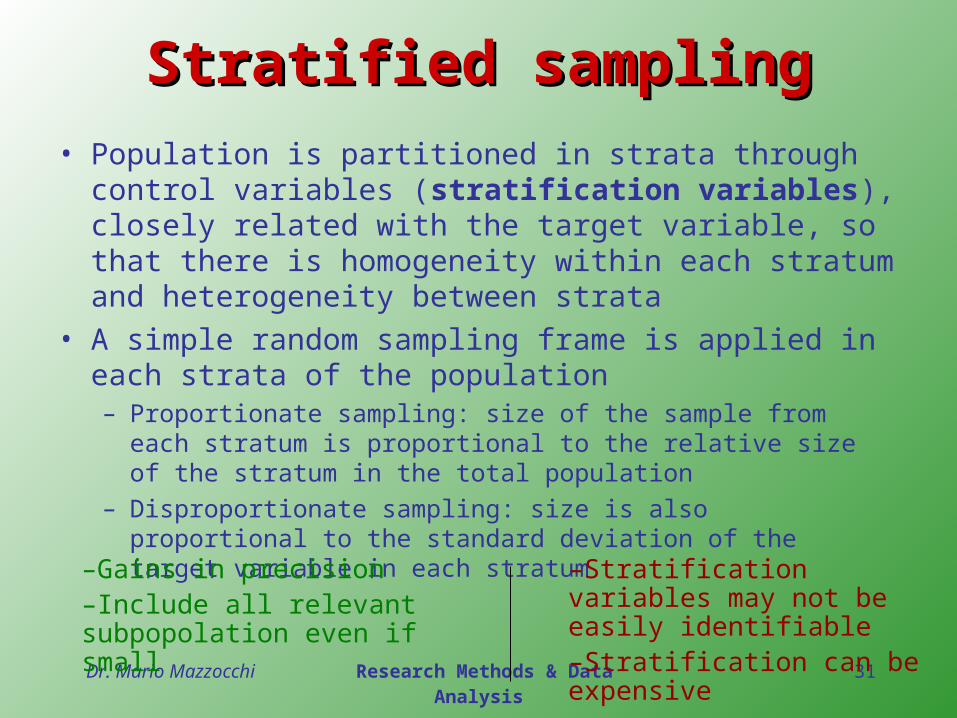
Stratified samplingStratified sampling• Population is partitioned in strata through
control variables (stratification variables), closely related with the target variable, so that there is homogeneity within each stratum and heterogeneity between strata
• A simple random sampling frame is applied in each strata of the population– Proportionate sampling: size of the sample from each
stratum is proportional to the relative size of the stratum in the total population
– Disproportionate sampling: size is also proportional to the standard deviation of the target variable in each stratum
–Gains in precision–Include all relevant subpopolation even if small
–Stratification variables may not be easily identifiable–Stratification can be expensive

Dr. Mario Mazzocchi Research Methods & Data Analysis
32
Cluster samplingCluster sampling• The population is partitioned into clusters• Elements within the cluster should be as
heterogeneous as possible with respect to the variable of interests (e.g. area sampling)
1. A random sample of clusters is extracted through SRS (with probability proportional to the cluster size)
– 2a. All the elements of the cluster are selected (one-stage)
– 2b. A probabilistic sample is extracted from the cluster (two-stage cluster sampling)–Reduced costs
–Higher feasibility–Less precision–Inference can be difficult
Dr. Mario Mazzocchi Research Methods & Data Analysis
33
Non probabilistic Non probabilistic samplessamples

Dr. Mario Mazzocchi Research Methods & Data Analysis
34
Convenience samplingConvenience sampling
• Only “convenient” elements enter the sample
–Cheapest method–Quickest method
–Selection bias–Non representativeness–Inference is not possible

Dr. Mario Mazzocchi Research Methods & Data Analysis
35
Judgmental samplingJudgmental sampling
• Selection based on the judgment of the researcher
–Low cost–Quick
–Non representativeness–Inference is not possible–Subjective

Dr. Mario Mazzocchi Research Methods & Data Analysis
36
Quota samplingQuota sampling
1. Define control categories (quotas) for the population elements, such as sex, age…
2. Apply a “restricted judgmental sampling”, so that quotas in the sample are the same of those in the population–Cheapest method
–Quickest method–There is no guarantee that the sample is representative (relevance of control characteristic chosen)–Many sources of selection bias–No assessment of sampling error

Dr. Mario Mazzocchi Research Methods & Data Analysis
37
Snowball samplingSnowball sampling
• A first small sample is selected randomly
• Respondents are asked to identify others who belong to the population of interests
• The referrals will have demographic and psychographic characteristics similar to the referrers
–Lower costs–Low variability–Useful for “rare” populations
–Inference is not possible