dr. lori austin
TRANSCRIPT

PROPRIETARY © 2017
Dr. Lori AustinAssistant Professor
of Mathematics
Dr. William Austin PresidentWhy Remedial Reforms & Pathways
May Not Be the Promised Graduation
Rate Elixirs

PROPRIETARY © 2017
The Impact of Elementary Algebra:Does it really help our non-STEM students succeed in college math?

3
DEFINING ALGEBRA
Algebra is a way of thinking and a set of concepts and skills that enable students to generalize, model, and analyze mathematical situations. Algebra provides a systemic way to investigate relationships, helping to describe, organize, and understand the world. …Knowing algebra opens doors and expands opportunities, instilling a broad range of mathematical ideas that are useful in many professions and careers. All students should have access to algebra and support for learning it.
NCTM, 2008
4
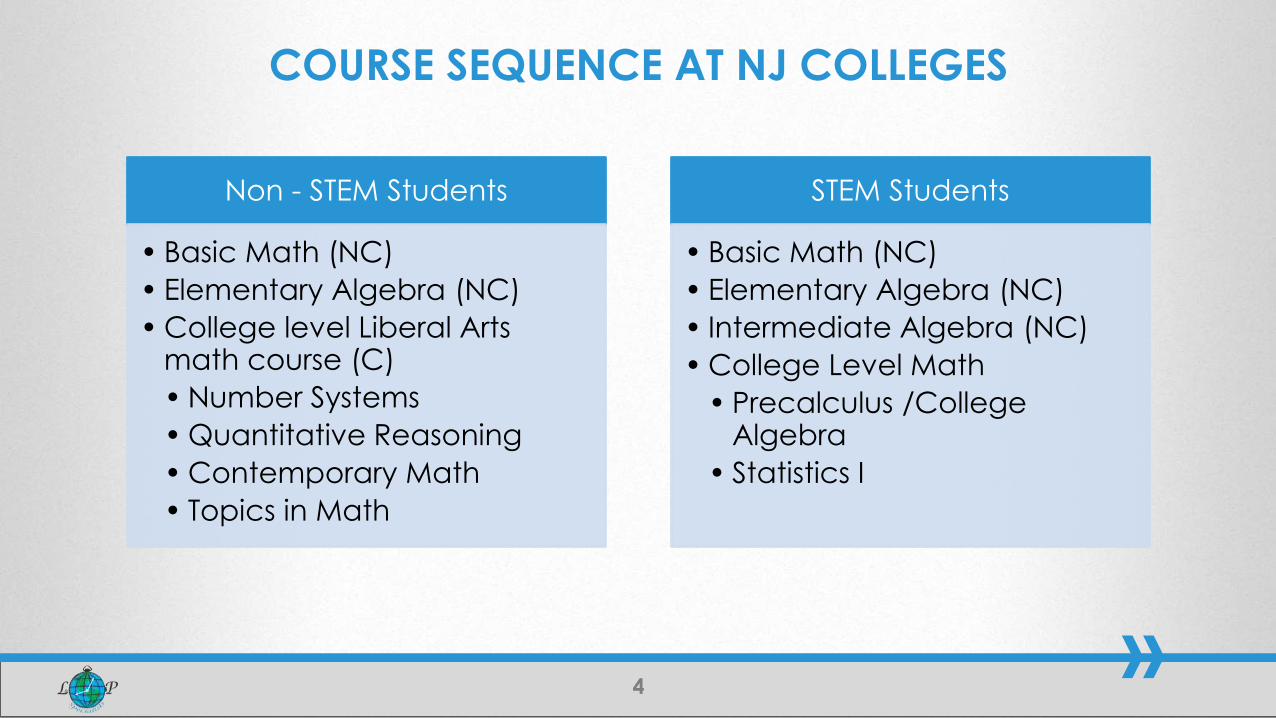
Non - STEM Students
• Basic Math (NC)
• Elementary Algebra (NC)
• College level Liberal Arts math course (C)
• Number Systems
• Quantitative Reasoning
• Contemporary Math
• Topics in Math
STEM Students
• Basic Math (NC)
• Elementary Algebra (NC)
• Intermediate Algebra (NC)
• College Level Math
• Precalculus /College Algebra
• Statistics I
COURSE SEQUENCE AT NJ COLLEGES

5
Elementary Algebra
•Expressions
•Equations
•Graphing
•Systems of Equations
•Polynomials
•Factoring
•Rational Expressions and Equations
•Operations on Radicals
•Quadratic Equations
Liberal Arts Math Course
•Mathematical Logic
•Basic Set Theory
•Number Systems (Ancient, Bases other than 10)
•Geometry
•Probability
•Statistics
•Modular Arithmetic
•Rational Numbers
CONTENT OF COURSES

6
How best could I assess the
impact of Elementary Algebra?

7
Full–Time First–Time students needing only a Liberal Arts
Math Course (non-STEM)
2012 Cohort over three years
4 NJ Community Colleges
STUDY INFORMATION: STUDENT POPULATION

8
Group 1Had to take Elementary Algebra
before College Level math
• 1st Semester Math Success Rate – 28.7% (in a Elementary Algebra class)
• 3 Year Success Rate in College Level Math – 40%
• Total College Credits Earned in 3 Years – 33.22 credits
Group 2Took no Elementary Algebra before
College Level Math
• 1st Semester Math Success Rate – 69.6% (in a Liberal Arts Math Class)
• 3 Year Success Rate in College Level Math – 77%
• Total College Credits Earned in 3 Years – 49.68 credits
RESULTS OF ALL NON-STEM STUDENTS

9
Takes advantage of the assumption that
student placement scores directly above and
directly below a predetermined cutoff on a
standardized placement test are essentially
random within a certain window.
REGRESSION DISCONTINUITY DESIGN

10
EXAMPLE OF RD DESIGN
11
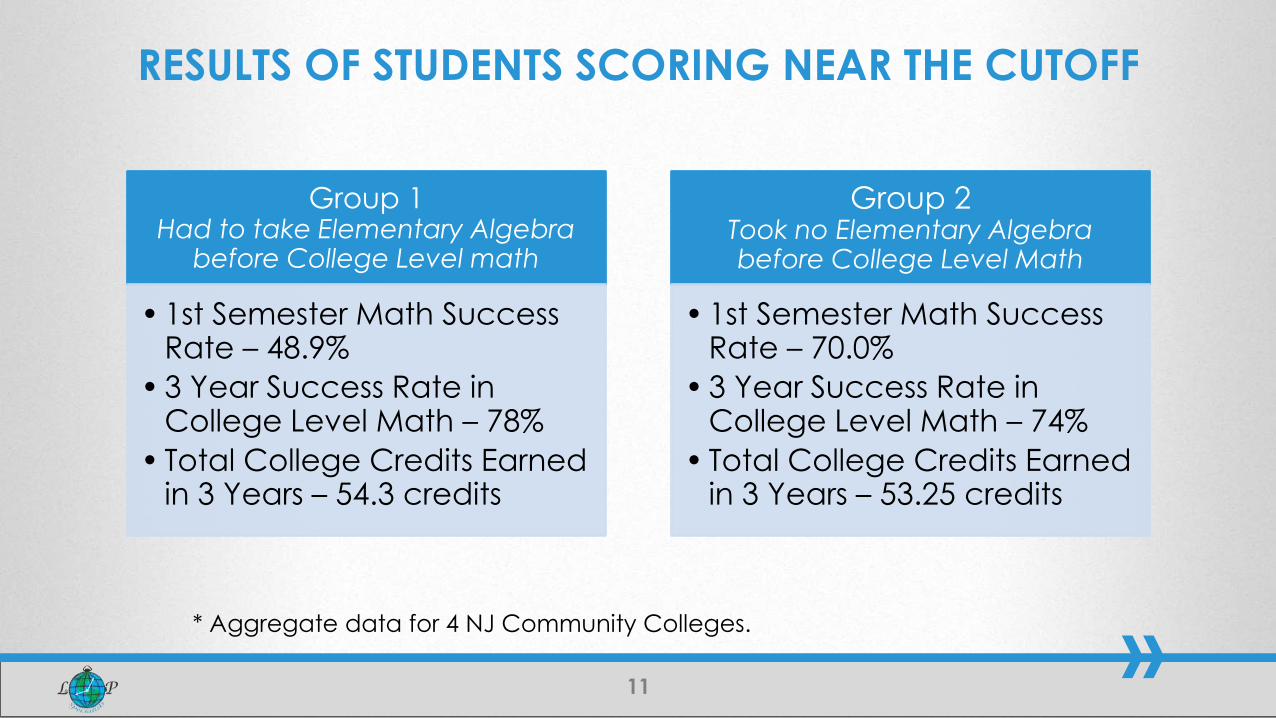
Group 1Had to take Elementary Algebra
before College Level math
• 1st Semester Math Success Rate – 48.9%
• 3 Year Success Rate in College Level Math – 78%
• Total College Credits Earned in 3 Years – 54.3 credits
Group 2 Took no Elementary Algebra before College Level Math
• 1st Semester Math Success Rate – 70.0%
• 3 Year Success Rate in College Level Math – 74%
• Total College Credits Earned in 3 Years – 53.25 credits
RESULTS OF STUDENTS SCORING NEAR THE CUTOFF
* Aggregate data for 4 NJ Community Colleges.

12
What does this mean?

13
020
40
60
80
TC
E
20 40 60 80 100 120SAS
SCATTER PLOT OF TOTAL CREDITS EARNED IN
THREE YEARS BASED ON PLACEMENT SCORE

IMAGINE YOUR DATA HERE

15
A student has a better chance of passing a general liberal arts math class than they do a developmental elementary algebra course.
The placement in elementary algebra alone is NOT a barrier to student long term success in college.
We need to determine the “other” factors that are making students place low and fail to progress.
CONCLUSIONS

16
“Do just once what others
say you can't do, and you
will never pay attention to
their limitations again.”James Cook

YOUR REMEDIAL SEQUENCE &
OUTCOMES

IF YOU ENROLL IN READING, WRITING &
MATH, WILL EVER GRADUATE?

19
EMPOWERING COMMUNITY COLLEGES TO BUILD THE NATION’S
FUTURE: AN IMPLEMENTATION GUIDE

20
It will take radical action, not talk
Public Commitment to Goals
Creation of Pathways
Expand Prior Learning Assessments
Devise Completion Strategies
AACC IMPLEMENTATION GUIDE:
RECOMMENDATION #1:
INCREASE COMPLETION RATES 50% BY 2020

21
It will take radical action,
not talkAlthough the RD Design is not a full representation of all community colleges; it does represent Warren.

22
“Almost always the people who achieve these fundamental inventions of a new paradigm have been either very young or very new to the field whose paradigm they change.
And perhaps that point need not have been made explicit, for obviously these are the ones who, being little committed by prior practice to the traditional rules of normal science, are particularly likely to see that those rules no longer define a playable game and to conceive another set that can replace them.”
― Thomas S. Kuhn, The Structure of Scientific Revolutions
PHYSICIST THOMAS KUHN

23
Paradigm
Shift
Normal
Practice
Outcome
Drifts
Institutional
Crisis
Idea
Revolution
IDEA REVOLUTIONS

24
https://www.youtube.com/watch?v=3cp6pEzx3uw

25

26
• Have the data, have done the math
• Have the “Common Sense” outcomes
• Have made the national and state level
conference presentations.
LET’S DO RADICAL NOT TALK ABOUT IT.

27
• No more committees
• Use Board Policy
• No more required remediation, buyers choice.
• Three Tracks (STEM, Non-Stem, Technical) – Faculty
have Summer to do this or Board will do it for them.
• Have the science, math & research anyway.
LET’S DO RADICAL NOT TALK ABOUT IT.

28
• Change the Accuplacer cut scores
• Change the sequence
• Create Aspirational Curriculum Based Tracks
• Create STEM Boot Camps
• Give consumer the choice (after you share the previous success rates)
• And just for fun – apply the math findings to English too.
FOR MATH

SEE EXAMPLES THAT FOLLOW

30
2014 MATH SEQUENCE
MAT 050Basic Math
MAT 051Introductory
Algebra
MAT 052Intermediate
Algebra
MAT 131MAT 110MAT 111MAT 151
Remedial College
31
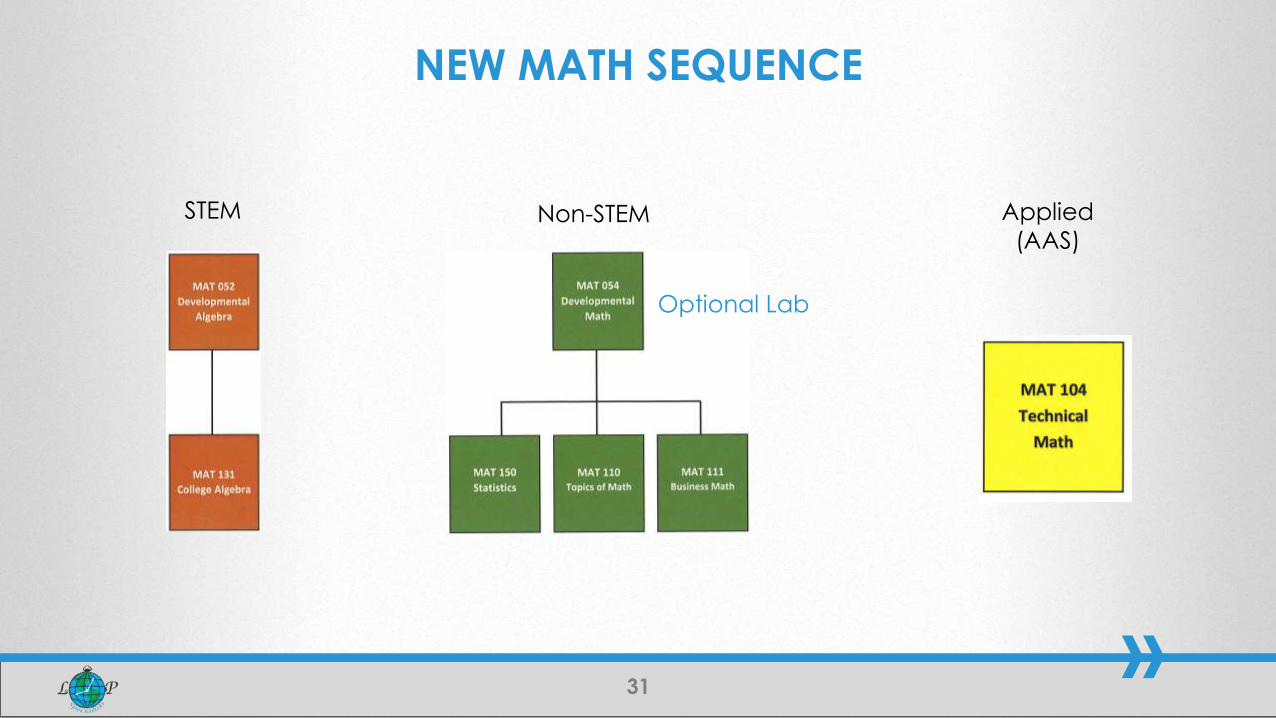
NEW MATH SEQUENCE
STEM Non-STEM Applied
(AAS)
Optional Lab
32
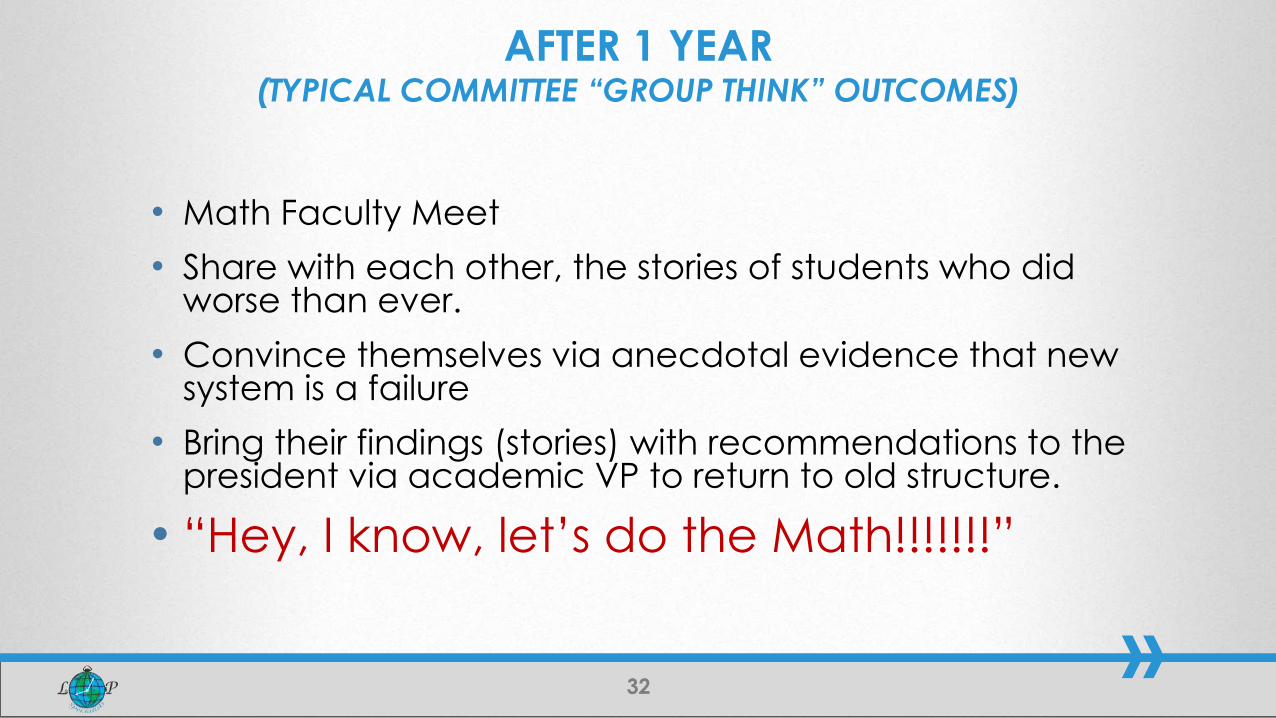
• Math Faculty Meet
• Share with each other, the stories of students who did worse than ever.
• Convince themselves via anecdotal evidence that new system is a failure
• Bring their findings (stories) with recommendations to the president via academic VP to return to old structure.
• “Hey, I know, let’s do the Math!!!!!!!”
AFTER 1 YEAR (TYPICAL COMMITTEE “GROUP THINK” OUTCOMES)

33
RESULTS – REMEDIAL ENROLLMENTS

34
Fall 2015
• MAT 110 Topics of Math (Non-STEM) = 74%
• MAT 111 Math for Bus (Non-STEM) = 84%
• MAT 131 College Algebra (STEM) = 70%• MAT 131 Pass Rate of
Anecdotal Expert: 50%
Fall 2016
• MAT 110 Topics of Math (Non-STEM) = 83%
• MAT 111 Math for Bus (Non-STEM) = 82%
• MAT 131 College Algebra (STEM) = 82%
• MAT 150 (New) Elements of Statistics (Non-STEM) = 88%
FALL 2015 (OLD SEQUENCE) & FALL 2016
(MAINSTREAM SEQUENCE)

35
WHY?
• Personal Economic Interests
• Campus Politics
• Power of Denial

36
25%28%
39%
2014 (2010 Cohort) 2015 (2011 Cohort) 2016 (2012 Cohort)
½ IMPLEMENTATION COMPLETION OUTCOMES (IPEDS)
Measured Actual Graduation Rates

37
Read Books About Grit
Talk About Grit Share ExamplesHelp Students
Develop a Growth Mindset
Reframe Problems
Find a Framework
Live Grittily
Foster Safe Circumstances That Encourage
Grit
Help Students Develop
Intentional Habits
Acknowledge the Sacrifice Grit
Requires
Discuss When You Need Grit and When You Need to Quit
LIVE GRIT, LEARN GRIT, TEACH GRIT
Vicki Davis -- https://www.edutopia.org/blog/true-grit-measure-teach-success-vicki-davis
38
• “Read the chapter” (they don’t read)
• Now spoon feed the chapter
• CHANGE: Teach Grit (1st 2 weeks)
• What happened?
PHI 101 – NOW I AM GOING TO BREAK THE RESEARCH RULES

39
OTHER RADICAL ACTIONSBoard Policy
(60 Credit Degrees)
Teaching Administrators More Intrusive
Advising
Pathways Project
Professional Development

40
How to for RD Design
• Jacob, R., Zhu, P., Somers, M. & Bloom. (2012). A practical guide to regression discontinuity. MDRC. http://www.mdrc.org/publication/practical-guide-regression-discontinuity
• Lee, H. & Lemieux, T. (2010). Regression discontinuity designs in economics. Journal of Economic Literature 48(June 2010), 281- 355.
Examples of RD Design
• Bettinger, E. & Long, B. T. (2005). Remediation at the community college: Student participation and outcomes. In Responding to the Challenges of Developmental Education. New Directions in Community Colleges, no. 129. San Francisco, CA: Jossey-Bass.
• Calcagno, J. C. & Long, B. T. (2008). The impact of postsecondary remediation using a regression discontinuity approach: Addressing endogenous sorting and noncompliance. An NCPR Working Paper.
RD REFERENCES

41
Examples, Cont.
• Lesik, S. A. (2006). Applying the regression-discontinuity design to infer causality with non-random assignment. The Review of Higher Education 30(1), 1-19.
• Melguizo T., Bos, J., Ngo, F, Mills, N & Prather, G. (2016). Using a regression discontinuity design to estimate the impact of placement decisions in developmental math. Journal of Research in Higher Education 57, 123-1511.
Software and Technical Information
• Journal Articles and Modules for STATA and R: https://sites.google.com/site/rdpackage
REFERENCES CONT.