dr. cristina ana stoian resident journal club june 14, 2012
TRANSCRIPT

Dr. Cristina Ana Stoian
Resident Journal ClubJune 14, 2012
Objectives
Recognize strengths and limitations of various study designs
Calculate study parameters Sensitivity, specificity, PPV, NPV RR, ARR, RRR, NNT
Define some basic terms P-value, type I error, type II error
Discuss general approach to critical appraisal

Study Designs
Design ‘Starting point’
What is assessed
Strength Limitations
RCT Exposure status
Outcome Controls bias
Feasibility
Cohort Exposure status
Outcome Ability to determine incidence; temporality
Time and cost; rare outcome
Case control
Outcome Exposure status
Less time and cost
Bias (++)

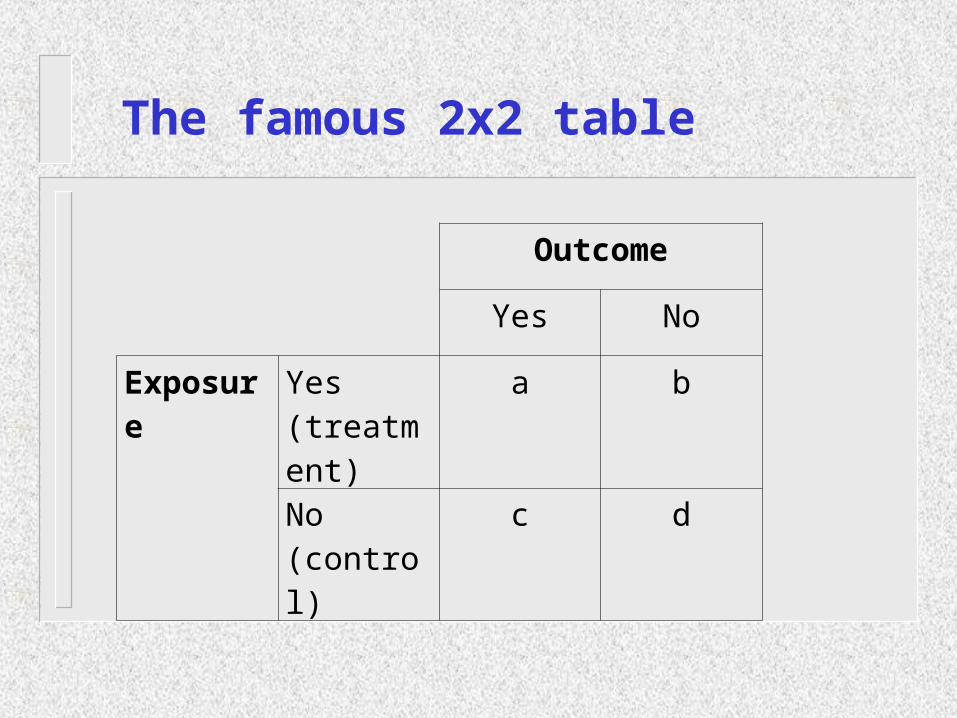
The famous 2x2 table
Outcome
Yes No
Exposure Yes (treatment)
a b
No(control)
c d

Calculations
Control event rate (CER) = c/c+d Experimental event rate (EER) = a/a+b Relative Risk (RR) = EER/CER=(a/a+b)/(c/c+d) Relative Risk Reduction (RRR) = CER-EER/CER
(commonest reported measure of dichotomous treatment effect)
Absolute Risk Reduction (ARR) = CER-EER Number Needed to Treat (NNT) = 1/ARR

The famous 2x2 table
Outcome
Yes No
Exposure Treatment 15 85
Control 20 80
Assume a study which recruited 200 patients and randomized 100 patients in each of treatment and control groups. There were 15 deaths in the treatment group and 20 deaths in the control group

Calculations
Assume a study which recruited 200 patients and randomized 100 patients in each of treatment and control groups.
There were 15 deaths in the treatment group and 20 deaths in the control group
EER: 15/100 (0.15 or 15%) CER: 20/100 (0.20 or 20%) RR: 0.15/0.20 = 0.75 ARR: 0.20 – 0.15 = 0.05 RRR: (0.20-0.15)/0.20 = 0.25 (25%) NNT: 1/0.05 = 20

The famous 2x2 table

Sensitivity
Proportion of persons with condition who test positive
Sensitivity = true positive test result/ all patients with disease
Sensitivity = a/a + c (TP/TP+FP) SnNOut = a highly sensitive test that gives a negative
result rules out the Dx Desired for screening tests POWER = sensitivity = 1 – beta error

Specificity
Proportion of persons without condition who test negative
Specificity =true negative test results/all pts without disease
Specificity = d/ d + b (TN/TN+FN) SpPIn = if using a highly specific test, a positive test result
rules in the Dx

Example Some researchers have conducted a QI project to assess the
diagnostic accuracy of the urine dipstick leukocyte esterase test to predict a bacterial UTI. As part of their study, they assessed 100 patient urine samples which underwent both a dipstick and a urine culture. A dipstick was defined as positive if it showed ‘trace’ leukocytes or greater. A urine culture was defined as positive if it grew a single organism at > 1 x 10⁷
75 patients had positive urine cultures. Of these, 60 had a positive dipstick. Of the 25 patients with negative cultures, 5 had a positive dipstick
Please calculate the Sn, Sp, PPV and NPV of the dipstick test

The famous 2x2 table

Another example
Test for strep throat. You test 100 swabs from patients complaining of sore throat. Test was positive 40 times and in 20 cases the culture came back positive for strep. Test was negative 60 times and only in 5 of these cases the cultures were positive.
Which of the following is true about the new test?
A. Positive predictive value = 50%
B. Sensitivity = 80%
C. Negative predictive value >90%
D. All of the above

The famous 2x2 table

Effectiveness vs Efficacy
• Effectiveness = ability of an intervention to achieve the desired results under USUAL conditions, ie day-to-day use. Effectiveness describes how well drug works, its side effects and ease of use
• Efficacy = ability of an intervention to achieve the desired results under IDEAL conditions, eg clinical trial. Does not describe how well tolerated/ease of use, only how well it gives the desired result.

Definitions Null hypothesis – there is no difference between the groups
being compared P-value – the probability that the difference observed in the
study is simply due to chance (also referred as type I error) Type II error – based on the estimate of the ‘true difference’
between groups, what is the chance that the difference in the study sample will not be statistically significant (incorrectly accepting the null hypothesis when there is a real effect)
Power = 1 – type II error

Measuring Outcomes
You can use the 2 x 2 table to look at error
Null Null HypothesisHypothesis
OutcomeOutcome
ChanceChance Real effectReal effect
AcceptAccept CorrectCorrectIncorrect Incorrect
Type II errorType II error
RejectRejectIncorrectIncorrect
Type I errorType I errorCorrectCorrect

General approach to critical appraisal
What is the primary research question? Methods
– Study design– Sample, exposure, outcome– Measurement– Analysis
Results Limitations Conclusions
Key points in critical appraisal
Internal validity– The degree to which the study truly answers the
question it poses
External validity – Can the study results be generalized to other
populations?– (can the results help me in caring for my patients)

Internal Validity
Were study participants randomized? Were all participants who entered the study
properly accounted for (follow-up)? Was the study ‘blinded’? Were the groups similar at the start of the trial? Aside from study intervention, were the groups
treated equally?

External Validity
Can the results be applied to my patient care?– Consider inclusion/exclusion criteria– Study population
Were all clinically important outcomes considered?
Are the likely treatment benefits worth the potential harm and costs?