downloaded on 2017-02-12t14:45:44z - core.ac.uk · pdf filetitle dynamic effects of anchor...
TRANSCRIPT

Title Dynamic effects of anchor positional tolerance on tension mooredfloating wind turbine
Author(s) Wright, Christopher; Pakrashi, Vikram; Murphy, Jimmy
Publication date 2016
Original citation Wright, C., Pakrashi, V. and Murphy, J. (2016) 'Dynamic effects ofanchor positional tolerance on tension moored floating wind turbine',Journal of Physics: Conference Series 753(9), 092019 (9pp).doi:10.1088/1742-6596/753/9/092019
Type of publication Article (peer-reviewed)
Link to publisher'sversion
http://dx.doi.org/10.1088/1742-6596/753/9/092019Access to the full text of the published version may require asubscription.
Rights © 2016, the Authors. Content from this work may be used under theterms of the Creative Commons Attribution 3.0 licence. Any furtherdistribution of this work must maintain attribution to the author(s)and the title of the work, journal citation and DOI. Published underlicence by IOP Publishing Ltd.https://creativecommons.org/licenses/by/3.0/
Item downloadedfrom
http://hdl.handle.net/10468/3197
Downloaded on 2017-02-12T14:45:44Z

This content has been downloaded from IOPscience. Please scroll down to see the full text.
Download details:
IP Address: 143.239.102.76
This content was downloaded on 07/10/2016 at 12:30
Please note that terms and conditions apply.
You may also be interested in:
Dynamic Effects in Electron Scattering in the 3d-Subshell of Lanthanum
K Nuroh
Studies on a dynamic adiabatic calorimeter. I. Heat leakage at high temperatures
K Naito, N Kamegashira, N Yamada et al.
Elastic scattering of electrons from atomic helium in the second-order eikonal approximation
A C Roy and N C Sil
Mediterranean climate future: an insightful look into the Basin’s precipitation response to
greenhouse gas forcing
Y Kushnir
Plasma line broadening of the Lyman- transition including ion dynamics
R W Lee
3D integration of refractive microoptical components by deep proton irradiation
S Kufner, M Kufner, M Frank et al.
Isotope effects in crystal-field parameters
J A D Matthew
Dynamic Effects of Anchor Positional Tolerance on Tension Moored Floating Wind Turbine
View the table of contents for this issue, or go to the journal homepage for more
2016 J. Phys.: Conf. Ser. 753 092019
(http://iopscience.iop.org/1742-6596/753/9/092019)
Home Search Collections Journals About Contact us My IOPscience

Dynamic Effects of Anchor Positional Tolerance on
Tension Moored Floating Wind Turbine
Christopher Wright 1 Vikram Pakrashi1,2 and Jimmy Murphy1
1Marine and Renewable Energy Ireland (MaREI), Beaufort Building, Environmental ResearchInstitute, University College Cork, Ringaskiddy, Co. Cork, Ireland2Dynamical Systems and Risk Laboratory, School of Mechanical and Materials Engineering,University College Dublin, Dublin, Ireland
E-mail: [email protected]
Abstract.For water depths greater than 60m floating wind turbines will become the most economical
option for generating offshore wind energy. Tension mooring stabilised units are one typeof platform being considered by the offshore wind energy industry. The complex mooringarrangement used by this type of platform means that the dynamics are greatly effected byoffsets in the positioning of the anchors.
This paper examines the issue of tendon anchor position tolerances. The dynamic effects ofthree positional tolerances are analysed in survival state using the time domain FASTLink.
The severe impact of worst case anchor positional offsets on platform and turbinesurvivability is shown. The worst anchor misposition combinations are highlighted and shouldbe strongly avoided. Novel methods to mitigate this issue are presented.
1. IntroductionFor water depths greater than 60m floating wind turbine (FWT) will become the economicaloption for generating offshore wind energy. Tension mooring stabilised FWT are one typeof platform under investigation by industry and academia [1–4]. Tension mooring stabilisedplatforms are restrained in heave, pitch and roll and compliant in surge, sway and yaw. Excessbuoyancy provides the restraint through tendon pretension. For tension moored FWT, tendonsare generally designed to be vertical. The “as installed” position of the anchors however may notbe in exactly the same position as was designed. It is hypothesised that this anchor mispositionleads to a change in platform motions and loads. This paper investigates the sensitivity of atension moored FWT to anchor positional tolerances.
For proposed Atlantic sites, the availability of enough weather windows to carry outinstallation, operations and maintenance on marine energy devices has been predicted [5].For the complex anchor tendon system type discussed in this paper this is obviously of greatconcern. Thus any method to decrease the temporal or sea state conditions required is vital fordeployments in these harsher environments.
1.1. Anchor TypeA number of different types of anchor systems have been proposed for tension moored floatingwind turbines, these include; pile, gravity, suction, drag and grouted rock anchors. High vertical
The Science of Making Torque from Wind (TORQUE 2016) IOP PublishingJournal of Physics: Conference Series 753 (2016) 092019 doi:10.1088/1742-6596/753/9/092019
Content from this work may be used under the terms of the Creative Commons Attribution 3.0 licence. Any further distributionof this work must maintain attribution to the author(s) and the title of the work, journal citation and DOI.
Published under licence by IOP Publishing Ltd 1
load drag embedment plates have also been proposed by Glosten Associates for the PelaStardevice, but due to the operational loading limit of 45◦ to the horizontal, are not compatible withthe vertical moorings used in this paper. Positional tolerances for drag embedment anchors willalso be much greater than for the previously mentioned anchor types. Monolithic gravity basedanchors will not suffer from the inter anchor misalignment discussed in this paper. The anchorchoice will depend on seabed characteristics, which may not be uniform across a proposed windfarm. To give a scale of the challenge facing the offshore floating wind industry, as of 2002 only≈ 500 suction piles had been installed worldwide [6], a similar number which would be requiredfor a single wind farm with number of turbines ≈ 125.
1.2. Anchor Positional ToleranceThe DNV codes [7] state that the permissible installation tolerances shall be determined takinginto account the increased difficulty in accurate seabed positioning caused by large water depthand environmental conditions. Position tolerances can be an absolute, for example 1m, or depthdependant, for example 1% of water depth.
Installation of anchors requires special anchor handling vessels with dynamic positioning(DP) systems. DP systems can keep a vessel “on location” by applying an active thrust, thusmaking it easier to achieve the required positional accuracy. In order to apply the appropriatereactive thrust, DP systems measure wind speed but calculate wave and drift loads and thus thepositional control systems used integrate a feedback feature and require some time to becomepositionally stable.
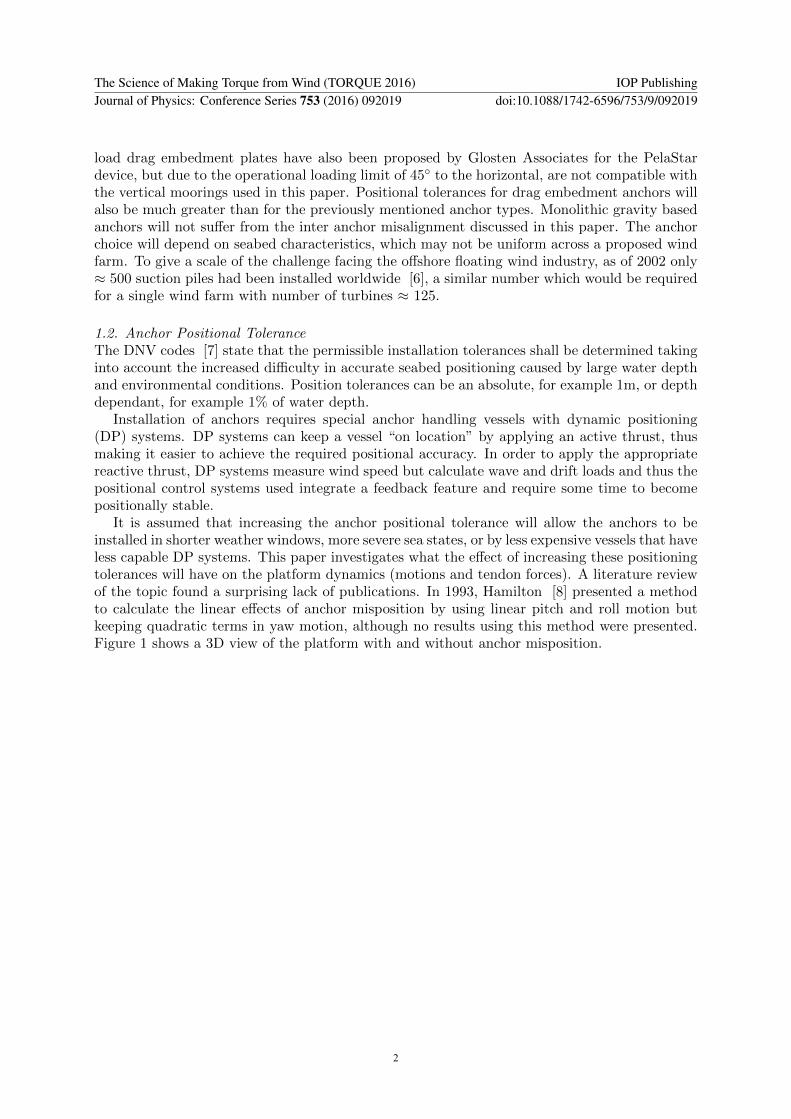
It is assumed that increasing the anchor positional tolerance will allow the anchors to beinstalled in shorter weather windows, more severe sea states, or by less expensive vessels that haveless capable DP systems. This paper investigates what the effect of increasing these positioningtolerances will have on the platform dynamics (motions and tendon forces). A literature reviewof the topic found a surprising lack of publications. In 1993, Hamilton [8] presented a methodto calculate the linear effects of anchor misposition by using linear pitch and roll motion butkeeping quadratic terms in yaw motion, although no results using this method were presented.Figure 1 shows a 3D view of the platform with and without anchor misposition.
The Science of Making Torque from Wind (TORQUE 2016) IOP PublishingJournal of Physics: Conference Series 753 (2016) 092019 doi:10.1088/1742-6596/753/9/092019
2
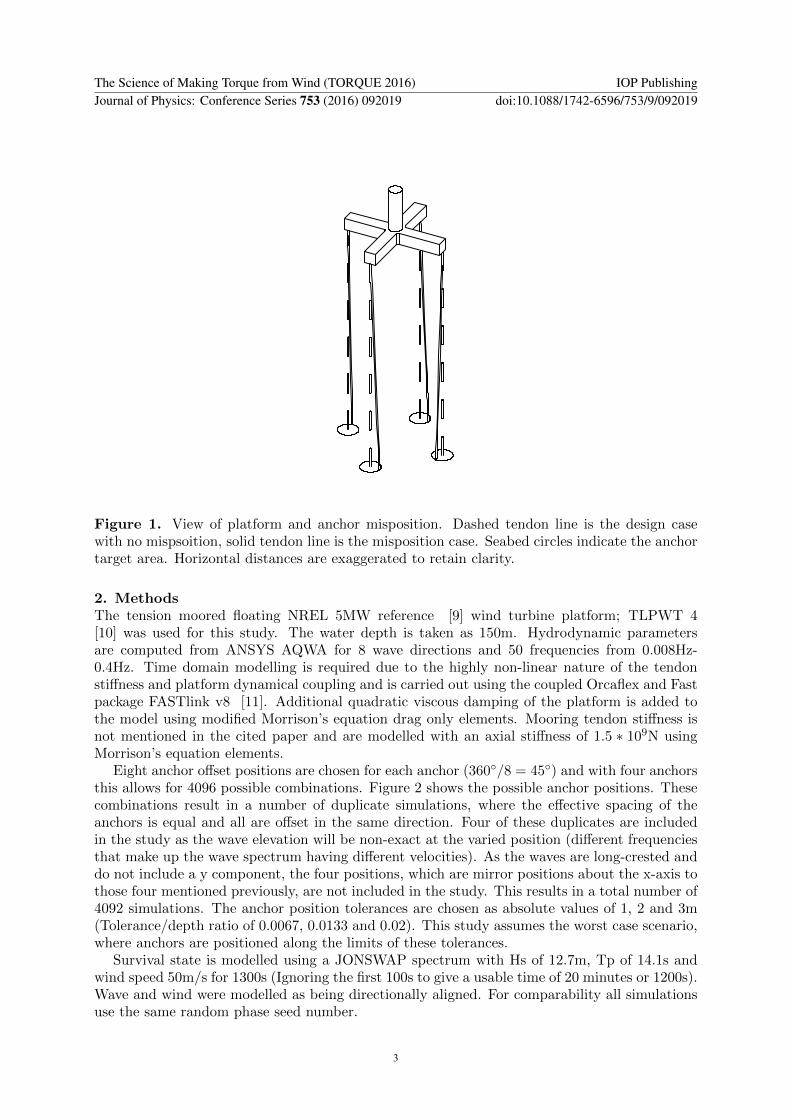
Figure 1. View of platform and anchor misposition. Dashed tendon line is the design casewith no mispsoition, solid tendon line is the misposition case. Seabed circles indicate the anchortarget area. Horizontal distances are exaggerated to retain clarity.
2. MethodsThe tension moored floating NREL 5MW reference [9] wind turbine platform; TLPWT 4[10] was used for this study. The water depth is taken as 150m. Hydrodynamic parametersare computed from ANSYS AQWA for 8 wave directions and 50 frequencies from 0.008Hz-0.4Hz. Time domain modelling is required due to the highly non-linear nature of the tendonstiffness and platform dynamical coupling and is carried out using the coupled Orcaflex and Fastpackage FASTlink v8 [11]. Additional quadratic viscous damping of the platform is added tothe model using modified Morrison’s equation drag only elements. Mooring tendon stiffness isnot mentioned in the cited paper and are modelled with an axial stiffness of 1.5 ∗ 109N usingMorrison’s equation elements.
Eight anchor offset positions are chosen for each anchor (360◦/8 = 45◦) and with four anchorsthis allows for 4096 possible combinations. Figure 2 shows the possible anchor positions. Thesecombinations result in a number of duplicate simulations, where the effective spacing of theanchors is equal and all are offset in the same direction. Four of these duplicates are includedin the study as the wave elevation will be non-exact at the varied position (different frequenciesthat make up the wave spectrum having different velocities). As the waves are long-crested anddo not include a y component, the four positions, which are mirror positions about the x-axis tothose four mentioned previously, are not included in the study. This results in a total number of4092 simulations. The anchor position tolerances are chosen as absolute values of 1, 2 and 3m(Tolerance/depth ratio of 0.0067, 0.0133 and 0.02). This study assumes the worst case scenario,where anchors are positioned along the limits of these tolerances.
Survival state is modelled using a JONSWAP spectrum with Hs of 12.7m, Tp of 14.1s andwind speed 50m/s for 1300s (Ignoring the first 100s to give a usable time of 20 minutes or 1200s).Wave and wind were modelled as being directionally aligned. For comparability all simulationsuse the same random phase seed number.
The Science of Making Torque from Wind (TORQUE 2016) IOP PublishingJournal of Physics: Conference Series 753 (2016) 092019 doi:10.1088/1742-6596/753/9/092019
3

1m
2m
3m
30°
210°
60°
240°
90°
270°
120°
300°
150°
330°
180° 0°
Anchor Locations
Horizontal Offset [m]
0m1m2m3m
Tolerance
Figure 2. Possible Anchor Positional Locations
3. Misposition ResultsDisplacements and rotations are calculated at the platform’s centre of gravity, accelerationsare measured at the centre of the nacelle. Anchor misposition is weighted by the perimeterdistance added to the square of the in wave positions and then normalised by the base case of0m misposition. The perimeter distance is calculated as the path length around the as installedposition of all anchors. The in wave position is calculated as the anchor position parallel to thewave direction. In this case the wave direction has no y component and thus this value purelyrelates to the anchors x position. It should be noted that this normalisation process does notrepresent any physical quantity and is solely used in order to visually represent the results inFigure 4. Equation 1 shows the normalisation function, where P̄ is the normalised position, pis the perimeter length, i is the anchor number, n is the number of anchors, xw is the in waveposition, j is the misposition number and 0 is the zero misposition baseline case. The results ofthe normalisation process are values between 0.69 and 1.41.
P̄j =pj +
∑ni=1 xw
2i
p0 +∑n
i=1 xw20
(1)
Figure 3 shows the mooring misalignment which results in the most severe accelerations fromthe simulation study, where the anchors parallel (Tendons 1 & 3) and the anchors perpendicular(Tendons 2 & 4) to the wave direction are shifted to the maximum relative distances. Figure 3ashows this relative anchor position, the reader should note that the X and Y axis dimensions aredistorted for the inter anchor cases to retain clarity. Figure 3b shows the surge displacement,Figure 3c the nacelle acceleration and Figure 3d the tension in Tendon 1. A segment of thesimulation time series (from 168s - 182s) which shows the largest deviation between the 0m and3m case across all the dynamics is shown to retain reader clarity. The most significant resultis a 53% increase in maximum nacelle acceleration. Figure 4 shows all the cases. Figure 4a-dshows the maximum surge, heave and pitch displacement and maximum nacelle acceleration,Figure 4e-h shows the maximum tendon forces. Of particular note are the large motions and
The Science of Making Torque from Wind (TORQUE 2016) IOP PublishingJournal of Physics: Conference Series 753 (2016) 092019 doi:10.1088/1742-6596/753/9/092019
4
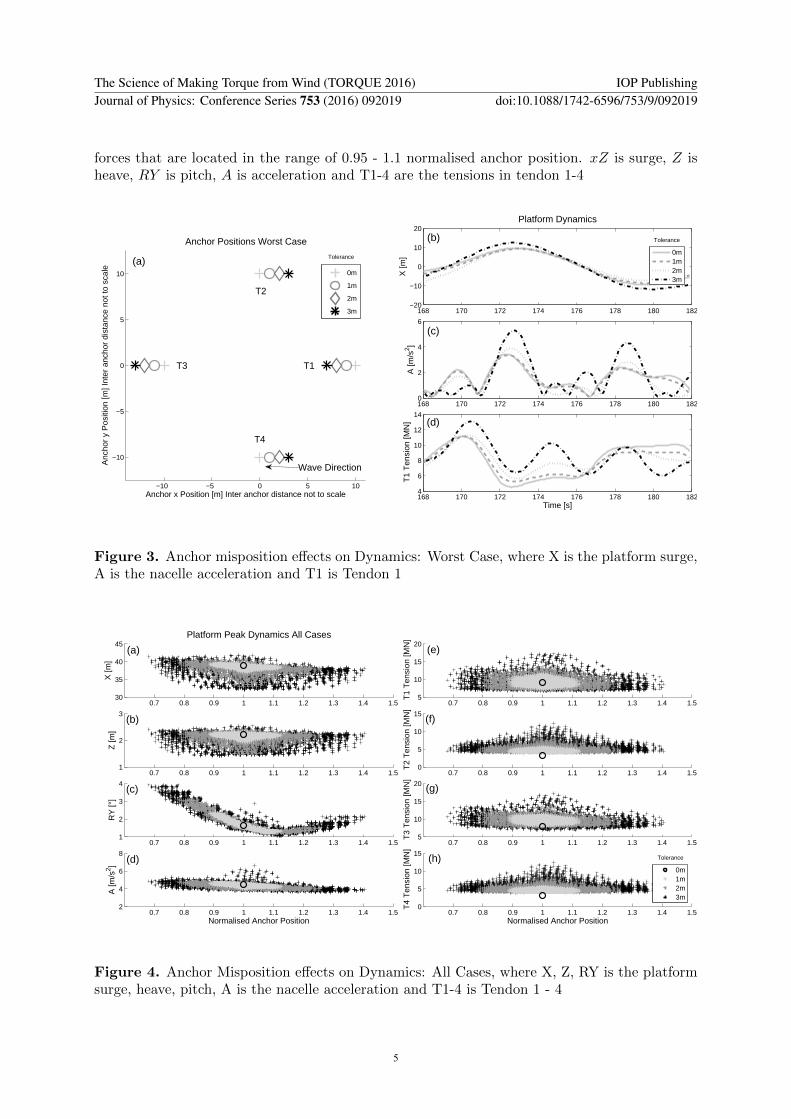
forces that are located in the range of 0.95 - 1.1 normalised anchor position. xZ is surge, Z isheave, RY is pitch, A is acceleration and T1-4 are the tensions in tendon 1-4
−10 −5 0 5 10
−10
−5
0
5
10
Anchor x Position [m] Inter anchor distance not to scale
Anc
hor
y P
ositi
on [m
] Int
er a
ncho
r di
stan
ce n
ot to
sca
le
Anchor Positions Worst Case
Tolerance
0m
1m
2m
3m 168 170 172 174 176 178 180 182−20
−10
0
10
20
X [m
]
Platform Dynamics
168 170 172 174 176 178 180 1820
2
4
6
A [m
/s2 ]
168 170 172 174 176 178 180 1824
6
8
10
12
14
Time [s]
T1
Ten
sion
[MN
]
Tolerance
0m1m2m3m
(b)
(d)
T1
T2
Wave Direction
T4
T3
(a)
(c)
Figure 3. Anchor misposition effects on Dynamics: Worst Case, where X is the platform surge,A is the nacelle acceleration and T1 is Tendon 1
0.7 0.8 0.9 1 1.1 1.2 1.3 1.4 1.530
35
40
45
X [m
]
Platform Peak Dynamics All Cases
0.7 0.8 0.9 1 1.1 1.2 1.3 1.4 1.55
10
15
20
T1
Ten
sion
[MN
]
0.7 0.8 0.9 1 1.1 1.2 1.3 1.4 1.51
2
3
Z [m
]
0.7 0.8 0.9 1 1.1 1.2 1.3 1.4 1.50
5
10
15
T2
Ten
sion
[MN
]
0.7 0.8 0.9 1 1.1 1.2 1.3 1.4 1.51
2
3
4
RY
[°]
0.7 0.8 0.9 1 1.1 1.2 1.3 1.4 1.55
10
15
20
T3
Ten
sion
[MN
]
0.7 0.8 0.9 1 1.1 1.2 1.3 1.4 1.52
4
6
8
A [m
/s2 ]
Normalised Anchor Position0.7 0.8 0.9 1 1.1 1.2 1.3 1.4 1.5
0
5
10
15
T4
Ten
sion
[MN
]
Normalised Anchor Position
Tolerance
0m1m2m3m
(c)
(d)
(b)
(a) (e)
(f)
(g)
(h)
Figure 4. Anchor Misposition effects on Dynamics: All Cases, where X, Z, RY is the platformsurge, heave, pitch, A is the nacelle acceleration and T1-4 is Tendon 1 - 4
The Science of Making Torque from Wind (TORQUE 2016) IOP PublishingJournal of Physics: Conference Series 753 (2016) 092019 doi:10.1088/1742-6596/753/9/092019
5

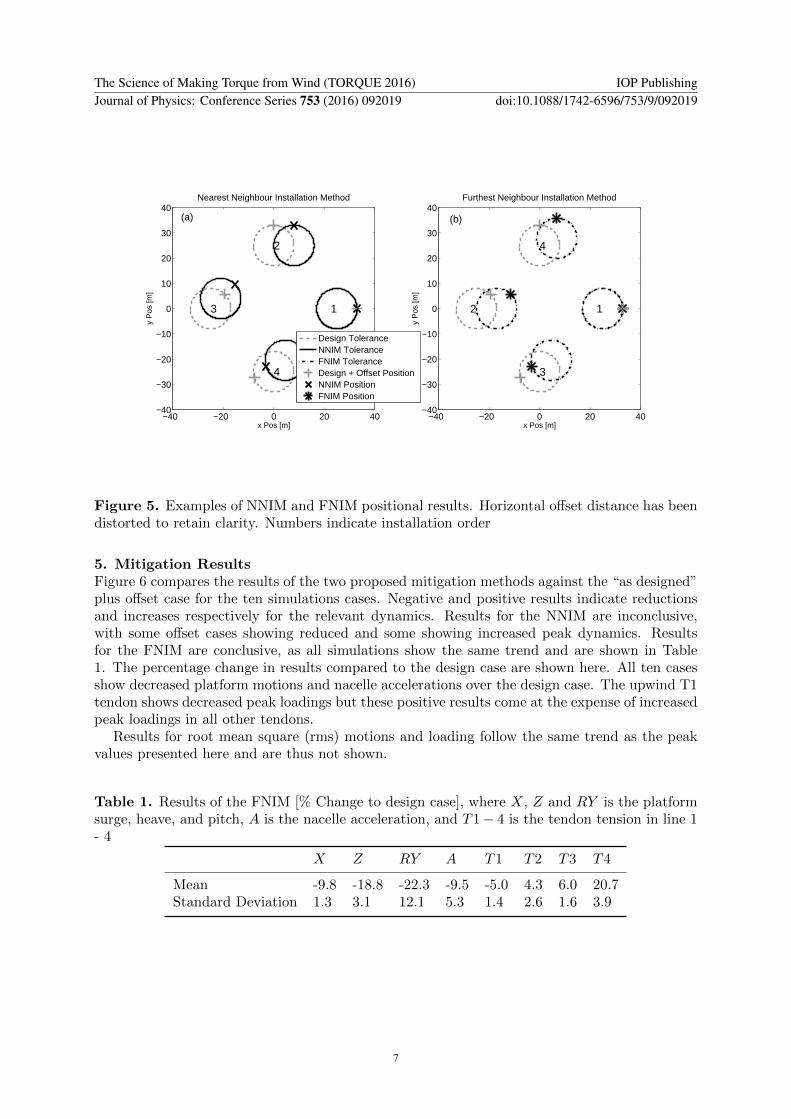
4. Mitigation MethodsThis paper proposes two novel mitigation methods for the issues addressed here. Both methodsinvolve changing the target anchor position based on the position of previously installed anchors.This is in contrast to a traditional method, where anchor targets are identified before installationand are rigid as they do not evolve as anchors are installed. First a nearest neighbour installationmethod is proposed, followed by a furthest neighbour installation method. If the distancesbetween the anchors are equal, the first one anticlockwise of those already installed is chosen. Theten anchor offsets, at 3m tolerance, that show the most severe results are used as test comparisoncases to compare each method. An example for the same offset positions of both of these methodsis shown in Figure 5, where x and y are the two horizontal positional coordinates, a) shows thenearest neighbour installation method and b) shows the furthest neighbour installation method.Anchor names are the same as Figure 3a
4.1. Nearest Neighbour Installation MethodThe nearest neighbour installation method (NNIM) installs the anchors in order of which isclosest to those already installed. The offset of each previous anchor is used to determine thelocation of subsequent anchors. The first anchor is installed in the original target area. The asinstalled position of the anchor is recorded. The order of subsequent anchors are chosen basedon which minimises the distance to the already installed anchor(s). If the distance betweentwo possible anchors are equal, the one in an anticlockwise to those already installed is chosen.A new target area for this next anchor is identified based on position of previous anchor(s).This procedure is continued for each subsequent anchor using the average offset of the previousanchors. The methodology is described for the four anchor case in Equations 2 to 5 with thegoverning formula in Equation 6. Here the x and y positions are a subset of P (P = [x,y]) PI ,PD and ∆PO denotes the installed, design and offset positions respectively. The possible valuesfor ∆PO are shown in Figure 2.
PI,1 = PD,1 + ∆PO,1 (2)
PI,2 = PD,2 + ∆PO,2 + ∆PO,1 (3)
PI,3 = PD,3 + ∆PO,3 + (∆PO,2 + ∆PO,1)/2 (4)
PI,4 = PD,4 + ∆PO,4 + (∆PO,3 + ∆PO,2 + ∆PO,1)/3 (5)
PI,i = PD,i + ∆PO,i +
∑i−1n=1 ∆PO,n
(i− 1)(6)
4.2. Furthest Neighbour Installation MethodThe furthest neighbour installation method (FNIM) follows the NNIM, except in the order ofanchor installation. In this method the order of subsequent anchors are chosen based on whichare furthest apart from those already installed. The first anchor is installed in the original targetarea. The anchor that is furthest from this first anchor is then installed using the first anchorsoffset position. Subsequent anchors are installed in order of which are furthest from their nearestneighbour first. The results presented here weight all previous installations equally, that is theaverage of all previous offsets are used to determine the new anchor positions. Equations 2 to 6also describe this method, although the anchor order will be different.
The Science of Making Torque from Wind (TORQUE 2016) IOP PublishingJournal of Physics: Conference Series 753 (2016) 092019 doi:10.1088/1742-6596/753/9/092019
6
−40 −20 0 20 40−40
−30
−20
−10
0
10
20
30
40
1
2
3
4
x Pos [m]
y P
os [m
]
Nearest Neighbour Installation Method
−40 −20 0 20 40−40
−30
−20
−10
0
10
20
30
40
12
4
3
x Pos [m]
y P
os [m
]
Furthest Neighbour Installation Method
Design ToleranceNNIM ToleranceFNIM ToleranceDesign + Offset PositionNNIM PositionFNIM Position
(a) (b)
Figure 5. Examples of NNIM and FNIM positional results. Horizontal offset distance has beendistorted to retain clarity. Numbers indicate installation order
5. Mitigation ResultsFigure 6 compares the results of the two proposed mitigation methods against the “as designed”plus offset case for the ten simulations cases. Negative and positive results indicate reductionsand increases respectively for the relevant dynamics. Results for the NNIM are inconclusive,with some offset cases showing reduced and some showing increased peak dynamics. Resultsfor the FNIM are conclusive, as all simulations show the same trend and are shown in Table1. The percentage change in results compared to the design case are shown here. All ten casesshow decreased platform motions and nacelle accelerations over the design case. The upwind T1tendon shows decreased peak loadings but these positive results come at the expense of increasedpeak loadings in all other tendons.
Results for root mean square (rms) motions and loading follow the same trend as the peakvalues presented here and are thus not shown.
Table 1. Results of the FNIM [% Change to design case], where X, Z and RY is the platformsurge, heave, and pitch, A is the nacelle acceleration, and T1 − 4 is the tendon tension in line 1- 4
X Z RY A T1 T2 T3 T4
Mean -9.8 -18.8 -22.3 -9.5 -5.0 4.3 6.0 20.7Standard Deviation 1.3 3.1 12.1 5.3 1.4 2.6 1.6 3.9
The Science of Making Torque from Wind (TORQUE 2016) IOP PublishingJournal of Physics: Conference Series 753 (2016) 092019 doi:10.1088/1742-6596/753/9/092019
7

0 2 4 6 8 101.2
1.3
1.4x 10
4
T1
Ten
sion
[N] T1
0 2 4 6 8 101
1.1
1.2
1.3x 10
4
T2
Ten
sion
[N] T2
0 2 4 6 8 101.2
1.3
1.4
1.5x 10
4
T3
Ten
sion
[N] T3
0 2 4 6 8 104000
5000
6000
7000
Simulation Number
T4
Ten
sion
[N]
T4
0 2 4 6 8 1030
35
40
45Peak Surge
X [m
]
0 2 4 6 8 101.5
2
2.5Peak Heave
Z [m
]
0 2 4 6 8 102
3
4Peak Pitch
RY
[°]
0 2 4 6 8 104
4.5
5
Simulation Number
Peak Acceleration
A [m
/s2 ]
DesignNNIMFNIM
DesignNNIMFNIM
(a)
(b)
(c)
(d)
(e)
(f)
(g)
(h)
Figure 6. Results of NNIM and FNIM compared to the design offset for ten worst casesimulations, where X, Z, RY is the platform surge, heave, pitch, A is the nacelle accelerationand T1-4 is Tendon 1 - 4
6. ConclusionsThis paper identifies anchor misposition as a major design concern for the deployment of tensionmoored floating wind turbine platforms. The results from this paper rule out the possibility ofusing vertical (90◦) loaded drag embedment anchors because the current positional accuracytechnology for this anchor type is much greater than those tolerances used in this study. Thiswould lead to a further increase in dynamics and would require a larger platform design inorder to accommodate this increase. The current aim of FWT platform design is opposing this,decrease size in order to increase economic competitivity.
The severe negative dynamic effects of anchor misposition are shown, especially whichpositional combinations should be strictly avoided. The worst case misposition locations ata 3m tolerance increase nacelle acceleration by 53%. Two mitigation methods are proposed andtested in order to reduce the need for positional accuracy. The NNIM is deemed as unsuitablefor this purpose. The FNIM shows great promise for reducing platform dynamics, although atthe expense of increased downwind tendon forces. Future work will involve refining this methodto take this into account, testing for wind and wave misalignment, and a statistical study onthe probability of these mispositions. The effect of changing the number of tendons on themisposition results will also be analysed.
AcknowledgmentsThis research was funded by Science Foundation Ireland (SFI) Centre MaREI - Centre for Marineand Renewable Energy (12/RC/2302).
References[1] Pakrashi V, O’Shea R, Jaksic V and Murphy J 2015 Journal of Physics: Conference Series
628 012057
The Science of Making Torque from Wind (TORQUE 2016) IOP PublishingJournal of Physics: Conference Series 753 (2016) 092019 doi:10.1088/1742-6596/753/9/092019
8

[2] Wright C, O’Sullivan K, Murphy J and Pakrashi V 2015 Journal of Physics: ConferenceSeries 628 012056
[3] Jaksic V, Wright C S, Murphy J, Afeef C, Ali S F, Mandic D P and Pakrashi V 2015Philosophical Transactions of the Royal Society A: Mathematical, Physical and EngineeringSciences 373 20140079:1–20140079:9
[4] Jaksic V, R R O, Cahill P, Murphy J, Mandic D P and Pakrashi V 2015 PhilosophicalTransactions of the Royal Society A: Mathematical, Physical and Engineering Sciences 37320140078:1–20140078:18
[5] O’Connor M, Lewis T and Dalton G 2013 Renewable Energy 1 52 57
[6] Andersen K H, Murff J D, Randolph M F, Clukey E C, Erbrich C T, Jostad H P, Hansen B,Aubeny C, Sharma P and Supachawarote C 2005 Suction anchors for deepwater applications1st ed (Proceedings of ISFOG: Frontiers in Offshore Geotechnics no 1) (Perth, Australia:CRC Press)
[7] DNV OFFSHORE STANDARD DNV-OS-H206 Loadout, transport and installation ofsubsea objects
[8] Hamilton J 1993 Platform & Tether Structural Dynamics 1st ed (Proceedings of the Seminaron Tensioned Buoyant Platforms Analysis Design and Field Experience no 1) (London:Bentham Press)
[9] Jonkman J, Butterfield S, Musial W and Scott G 2009 Technical Report NREL (1 vol 1)ed NREL (www.nrel.gov: NREL)
[10] Bachynski E E and Moan T 2012 Marine Structures 1 29 89
[11] Masciola M, Robertson A, Jonkman J and Driscoll F 2011 International Conference onOffshore Wind Energy and Ocean Energy vol 1 (Beijing, China: NREL)
The Science of Making Torque from Wind (TORQUE 2016) IOP PublishingJournal of Physics: Conference Series 753 (2016) 092019 doi:10.1088/1742-6596/753/9/092019
9