
How to identify, Implement, and Sustain Energy Savings through Projects,
Commissioning and Incentivized Behavior
Michael Cook, Ph.D., CFM, MCR, BEP
Director of Regional Building Operations and Property ManagementKaiser Permanente – Southern California
MANAGING CEUs AND CFM® MAINTENANCE POINTS
You are eligible to receive Continuing Education Units and Certified Facility Manager®
maintenance points for attending sessions at IFMA's World Workplace.
To receive 20 CFM maintenance points:Record your attendance on your CFM Recertification Worksheet.At recertification time, submit your completed CFM Recertification Worksheet.
To receive CEUs:Pay the US$15 processing fee via registration Log into the Attendee Service Center http://tinyurl.com/mwo9zxjYour log in information was sent to you when you registered for the conference.Complete the session evaluation then take the five question CEU assessment. After passing the assessment, you will receive your certificate of completion. CEUs can only be earned upon successful completion of the assessment.
Individuals seeking CEUs or LUs from other organizations must contact those organizations for instructions on self-reporting credit hours.

Meet Our Presenter:Michael Cook, Ph.D, CFM, MCR, BEP
Director of Regional Building Operations and Property Management
Kaiser Permanente, Southern California
Michael is currently responsible for a 15M SF portfolio of leased and owned properties consisting of medical office buildings, administrative buildings, pharmacies, labs and warehouses. He has more than 18 years of experience in facilities management in various industries, including healthcare, hospitality and fitness and entertainment. Michael holds a Doctorate in Public Administration and an MBA. He has achieved the Certified Facility Manager, Master of Corporate Real Estate, and Business Energy Professional certifications, and is a Certified Six Sigma Black Belt. In addition to his work in facilities management, Michael also serves as an adjunct professor teaching Operations Management, and Quantitative Methods at the MBA level. He has been an active member in IFMA for more than 12 years and has given presentations on operations management and quality assessment.

Kaiser Permanente is an Integrated Health System
Kaiser Foundation Health Plan
Permanente Medical Groups
Kaiser Foundation Hospitals

Kaiser Permanente’s Reach
Recognized as one of America’s leading health care providers and not-for-profit health plans
8.9M members
37 hospitals611 medicaloffices
9 states and the District of Columbia
15,853 physicians167,178 employees
$47.9B operating revenue

Review Session Learning Objectives
Analyze Data from Utility
Use Excel Tools to Chart and Interpret Results
Present Results to Drive Changes in Behavior
Partner with Industry Professionals for Larger Portfolios

Why Energy Conservation at Kaiser
Permanente?
Global Initiatives
U.S. and State Policies
Kaiser Permanente Senior Leadership


14| © Kaiser Permanente 2010-2011. All
Rights Reserved.
Se
pte
mb
er
15,
20
14
— Bernard J. Tyson, Chairman & CEO
“Kaiser Permanente is committed to creating
healthy communities, and it’s critical we work to reduce the impact of our operations on the environment. We all take pride in our focus on prevention at Kaiser Permanente, and that includes taking a stand to reduce greenhouse gas emissions.”

GHG Reduction Goals

Energy Use Intensity


What keeps me up at night?


Start with Examining the Utility Bills
Review Monthly and Annual Usage
Review Monthly and Annual Cost
Calculate Your Energy Use Intensity
NEVER Promise Savings Based on Billing Use or Cost Data!

Utility Bills

Los Angeles Deptof Water and Power Bill

Energy Use Intensity
• Calculate Energy Use Intensity by converting electricity and gas into btu, then compare to bldg sf.


Why Use EUI?• National Benchmark
• Track Energy Use
• Track Progress toward Energy Reduction

Absolute GHG Reduction Goals (2008 baseline)
Square Feet-adjusted Energy Intensity Goals (2010 baseline)
Region
2020 Reduction
Target (% mTC02e)
2014 Reduction Target (% mT C02e)
Progress to GHG Goals as of the end of
2013 (updated annually)
2020 Reduction Target (%
kBTU)
2014 Reduction Target (%
kBTU)
Progress to Energy Intensity Goals (updated monthly using rolling 12 mo.
averages)
Baseline Annual Site
Energy Intensity
(kBTU/RSF)
Rolling 12 Mo. Annual
Site Energy
Intensity (kBTU/RSF)
Colorado -16% -1.6% -5.4% -2.5% -1.0% -0.2% 116.4 116.2
Georgia -30% -6.6% 9.5% -9.0% -3.6% -1.4% 122.3 120.6
Hawaii -30% -11.8% -6.1% -15.0% -6.0% 9.2% 144.1 157.4
Mid Atlantic -19% -4.0% -98.5% -5.0% -2.0% 10.6% 150.8 166.8
NoCal -30% -5.9% 4.1% -11.0% -4.4% -2.7% 171.1 166.5
Northwest -30% -7.0% -0.3% -15.0% -6.0% 1.6% 166.2 168.9
SoCal -30% -4.8% -1.1% -10.0% -4.0% -1.2% 180.8 178.6
Total Excluding KPIT Data Centers* -10.7% -4.3% -1.1% 170.1 168.3
Total Including KPIT Data Centers -30.0% -5.5% -6.0%

Access Meter Data from Utility
Contact your Acct Rep and ask for 15 minute or 1 hour interval data for past 3 years (min).
It should include at minimum KWH and KW.
Ask for excel or CSV format

Utility Interval Data – Pasadena
Date & time DATE TIME KWH KW Temp
1/3/2011 3:15 1/3/2011 3:15 45 179 46.675
1/3/2011 3:30 1/3/2011 3:30 47 188 46.45
1/3/2011 3:45 1/3/2011 3:45 46 183 46.225
1/3/2011 4:00 1/3/2011 4:00 47 187 46
1/3/2011 4:15 1/3/2011 4:15 45 180 45.525
1/3/2011 4:30 1/3/2011 4:30 46 184 45.05
1/3/2011 4:45 1/3/2011 4:45 47 186 44.575
1/3/2011 5:00 1/3/2011 5:00 47 190 44.1
1/3/2011 5:15 1/3/2011 5:15 48 193 44.325
1/3/2011 5:30 1/3/2011 5:30 48 193 44.55

Utility Data – San DiegoNote: KWH not Listed, Date Format
RECORDER ID DATE HOUR IN UN KW KVAR
2605396 10111 100 60 KW 189 25
2605396 10111 200 60 KW 189 24
2605396 10111 300 60 KW 190 27
2605396 10111 400 60 KW 192 28
2605396 10111 500 60 KW 193 30
2605396 10111 600 60 KW 234 54
2605396 10111 700 60 KW 233 53
2605396 10111 800 60 KW 227 50
2605396 10111 900 60 KW 212 39
2605396 10111 1000 60 KW 209 35
2605396 10111 1100 60 KW 208 36

Data from Weather Station -Pasadena
beginTime endTime beginUTC endUTC temp prcp prcpFla wetBulb
1/1/2011 0:00 1/1/2011 1:00 1/1/2011 8:00 1/1/2011 9:00 42.1 0 35.4
1/1/2011 1:00 1/1/2011 2:00 1/1/2011 9:00 1/1/2011 10:00 39.9 0 34.1
1/1/2011 2:00 1/1/2011 3:00 1/1/2011 10:00 1/1/2011 11:00 41 0 35.1
1/1/2011 3:00 1/1/2011 4:00 1/1/2011 11:00 1/1/2011 12:00 39.9 0 35.1
1/1/2011 4:00 1/1/2011 5:00 1/1/2011 12:00 1/1/2011 13:00 39 0 34.6
1/1/2011 5:00 1/1/2011 6:00 1/1/2011 13:00 1/1/2011 14:00 37 0 32.8
1/1/2011 6:00 1/1/2011 7:00 1/1/2011 14:00 1/1/2011 15:00 36 0 32.2

Beginning to connect the dots

Chart and Interpret Results - Excel
Use Excel Tools to Chart and Interpret Results
http://buildingretuning.pnnl.gov/ecam.stm
http://www.youtube.com/watch?v=Qq3tY_MHkGE
It helps if the tool is International Performance Measurement and Verification Protocol (IPMVP) compliant


http://buildingretuning.pnnl.gov/documents/pnnl_20495.pdf

100 South Los Robles

http://buildingretuning.pnnl.gov/documents/pnnl_20495.pdf
San Diego Call Center

http://buildingretuning.pnnl.gov/documents/pnnl_20495.pdf
24/7 Production Facility

http://buildingretuning.pnnl.gov/documents/pnnl_20495.pdf
If this is a picture of a Well controlled building…

0.00
50.00
100.00
150.00
200.00
250.00
300.00
350.00
400.00
450.00
Independence Park(Administration)
Weekday
Saturday
Sunday
Holiday


Verification of July 4th Holiday Adjustment 4
0.00
50.00
100.00
150.00
200.00
250.00
300.00
350.00Th
u, 7
/3/1
4 1
2:0
0 A
M
Thu
, 7/3
/14
12
:00
PM
Fri,
7/4
/14
12
:00
AM
Fri,
7/4
/14
12
:00
PM
Sat,
7/5
/14
12
:00
AM
Sat,
7/5
/14
12
:00
PM
Ener
gy (
KW
h)


Drive Behavioral Change and Acceptance
Use the results of the analysis and target key execs to champion the change
Whenever possible, imbed the change through technology
Publish the results!

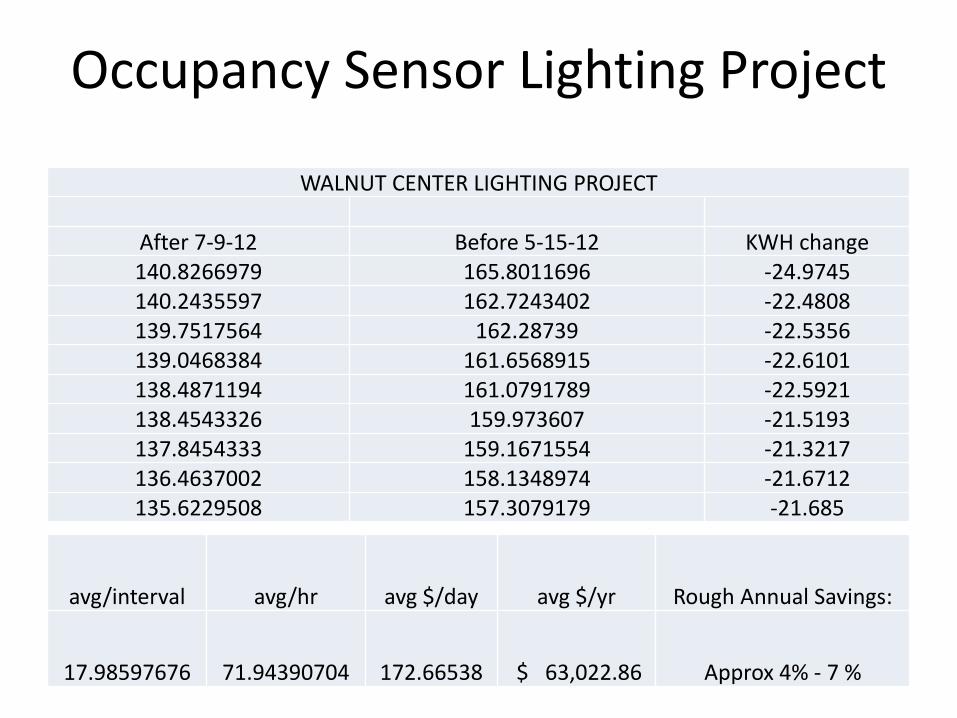
Occupancy Sensor Lighting Project
WALNUT CENTER LIGHTING PROJECT
After 7-9-12 Before 5-15-12 KWH change140.8266979 165.8011696 -24.9745140.2435597 162.7243402 -22.4808139.7517564 162.28739 -22.5356139.0468384 161.6568915 -22.6101138.4871194 161.0791789 -22.5921138.4543326 159.973607 -21.5193137.8454333 159.1671554 -21.3217136.4637002 158.1348974 -21.6712135.6229508 157.3079179 -21.685
avg/interval avg/hr avg $/day avg $/yr Rough Annual Savings:
17.98597676 71.94390704 172.66538 $ 63,022.86 Approx 4% - 7 %

Partner with Industry Professionals for Larger Portfolios
Identify when it’s best to use Industry Partners – large or complex portfolio
Check with your utility service provider to see if they have a preferred engineering firm
The expertise it critical


Use key reference pointsTo anchor your vision.

A common vision helps everyoneclearly see the goal and direction


The Challenge for You
Review your bills
Get your interval data
Chart your facilities
Share the results

Questions

Your Feedback is Valued!
Please take the time to Evaluate Sessions
Log into the Attendee Service Center
http://tinyurl.com/mwo9zxj

Be sure to evaluate the session online at the Attendee Service Center http://tinyurl.com/mwo9zxj
Thank You!


