Measuring Success with Bundles:
Winning Strategies in Analytics
The National Bundled Payment Summit
Washington, DC
June 16-18, 2014
Karim A. Habibi, FHFMA, MPH, MS
Senior Vice President and Chief of Managed
Care and Healthcare Reform

•Academic medical center comprised of
four hospitals
•1,069 licensed beds
•39,000 patient admissions
•670,000 outpatient visits
•Medicare beneficiaries represent 27% of
NYULMC volume and 18% of revenue
•Established NYUPN, a Clinically-
Integrated Network, in 2010
•761 voluntary physicians (38%)
•1262 Faculty Group Practice (FGP)
physicians (62%)
•>1M FGP physician visits
2
NYU Langone Medical Center

Using Analytics to Empower Clinicians
3
To be successful in BPCI, NYULMC needed to place focused
information in the hands of clinicians on a timely basis in order to
facilitate care redesign.
Since DRG coding occurs post-discharge, NYULMC had to find a way to
predict BPCI patients at both the pre-admission phase after scheduling
of surgery and during the inpatient stay. NYULMC leveraged Epic to
identify this population of interest.
NYULMC also built tools in Epic so that Clinical Care Coordinators
(CCCs) could document care coordination activities, including
readmissions to facilities outside of NYULMC. CCCs have been able to
capture the majority (>85%) of readmissions that occur at outside our
hospitals.
Using EMR data, a weekly dashboard was developed to regularly inform
leadership and clinicians on BPCI performance, at both the condition
and physician levels.

4
BPCI Episode Technical Workflow

5
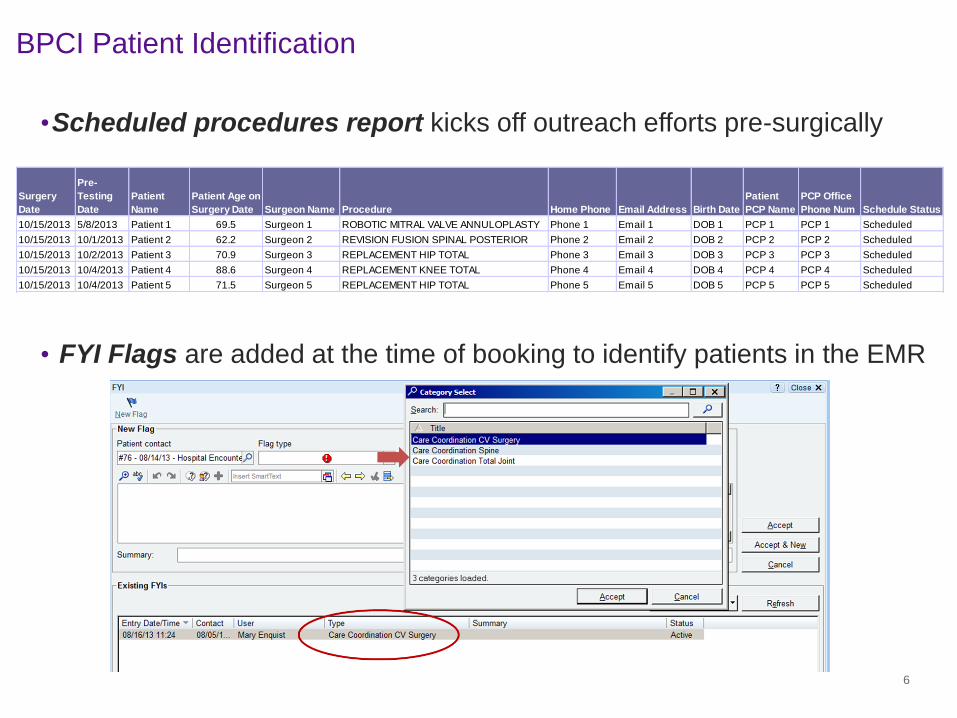
•Scheduled procedures report kicks off outreach efforts pre-surgically
• FYI Flags are added at the time of booking to identify patients in the EMR
BPCI Patient Identification
6
Surgery
Date
Pre-
Testing
Date
Patient
Name
Patient Age on
Surgery Date Surgeon Name Procedure Home Phone Email Address Birth Date
Patient
PCP Name
PCP Office
Phone Num Schedule Status
10/15/2013 5/8/2013 Patient 1 69.5 Surgeon 1 ROBOTIC MITRAL VALVE ANNULOPLASTY Phone 1 Email 1 DOB 1 PCP 1 PCP 1 Scheduled
10/15/2013 10/1/2013 Patient 2 62.2 Surgeon 2 REVISION FUSION SPINAL POSTERIOR Phone 2 Email 2 DOB 2 PCP 2 PCP 2 Scheduled
10/15/2013 10/2/2013 Patient 3 70.9 Surgeon 3 REPLACEMENT HIP TOTAL Phone 3 Email 3 DOB 3 PCP 3 PCP 3 Scheduled
10/15/2013 10/4/2013 Patient 4 88.6 Surgeon 4 REPLACEMENT KNEE TOTAL Phone 4 Email 4 DOB 4 PCP 4 PCP 4 Scheduled
10/15/2013 10/4/2013 Patient 5 71.5 Surgeon 5 REPLACEMENT HIP TOTAL Phone 5 Email 5 DOB 5 PCP 5 PCP 5 Scheduled

BPCI Patient Identification (con’t)
• Inpatient census report is available to the care team daily
•Readmission and ED/Urgent Care Visit Report alerts staff in real time
7

• Epic Pathway Report monitors a patient’s progress on the pathway
8
Inpatient Care Pathway

9
EMR Care Coordination Tools and Patient Registries • Care coordination tools were built into the EMR so that Clinical Care Coordinators could
see their daily patient lists, view the 90-day longitudinal plan of care as well as document
all notes, including information from patients, post-acute providers, and readmissions back
to NYULMC and to other hospitals

10
Communication With Patients – NYULMC MyChart
• NYULMC MyChart is an online patient portal that allows patients to access
educational videos, test results, appointment calendars, and messages from
clinicians and Clinical Care Coordinators
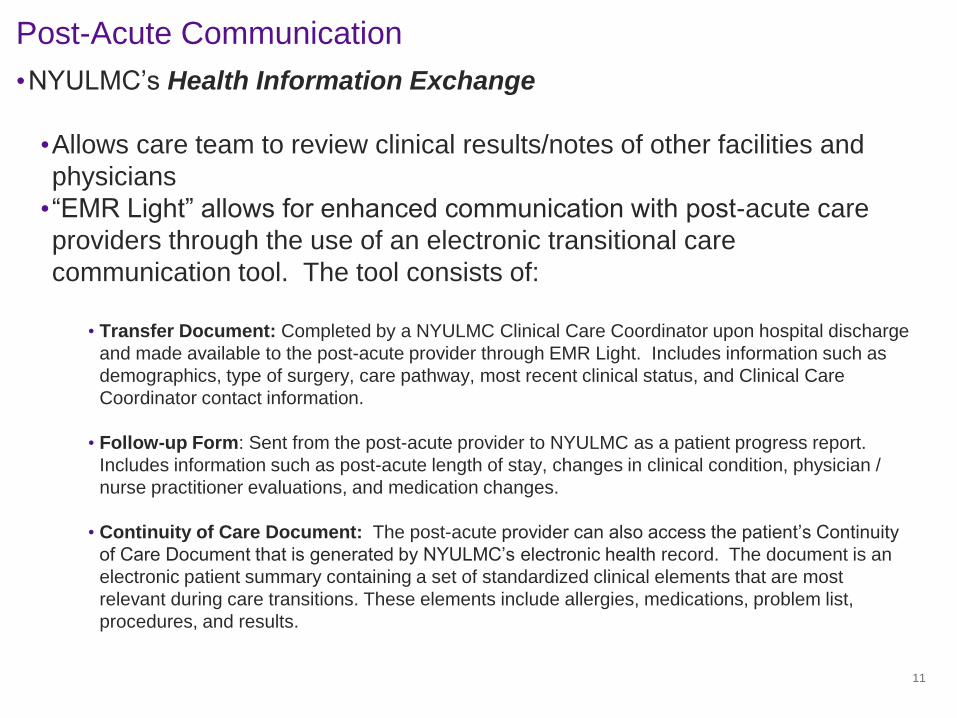
Post-Acute Communication
•NYULMC’s Health Information Exchange
•Allows care team to review clinical results/notes of other facilities and
physicians
•“EMR Light” allows for enhanced communication with post-acute care
providers through the use of an electronic transitional care
communication tool. The tool consists of:
• Transfer Document: Completed by a NYULMC Clinical Care Coordinator upon hospital discharge
and made available to the post-acute provider through EMR Light. Includes information such as
demographics, type of surgery, care pathway, most recent clinical status, and Clinical Care
Coordinator contact information.
• Follow-up Form: Sent from the post-acute provider to NYULMC as a patient progress report.
Includes information such as post-acute length of stay, changes in clinical condition, physician /
nurse practitioner evaluations, and medication changes.
• Continuity of Care Document: The post-acute provider can also access the patient’s Continuity
of Care Document that is generated by NYULMC’s electronic health record. The document is an
electronic patient summary containing a set of standardized clinical elements that are most
relevant during care transitions. These elements include allergies, medications, problem list,
procedures, and results.
11

12
Reporting and Monitoring

13
Reporting and Monitoring
Cost Drivers
Revenue Reductions (Cost to Medicare)
• Reduce readmissions
• Alter discharge patterns
• Decrease utilization (e.g., consults, ancillary tests)
• Reduce SNF LOS (paid on per diem)
Cost Reductions (Cost to Providers)
• Reduce LOS or # of visits
• Reduce implant, supply, or drug costs
• Reduce OR time
NYULMC studied the levers of cost and quality in a bundle when creating a care
redesign structure. BPCI reporting and analytics tracks performance on these levers.
Confidential. Do not Distribute.
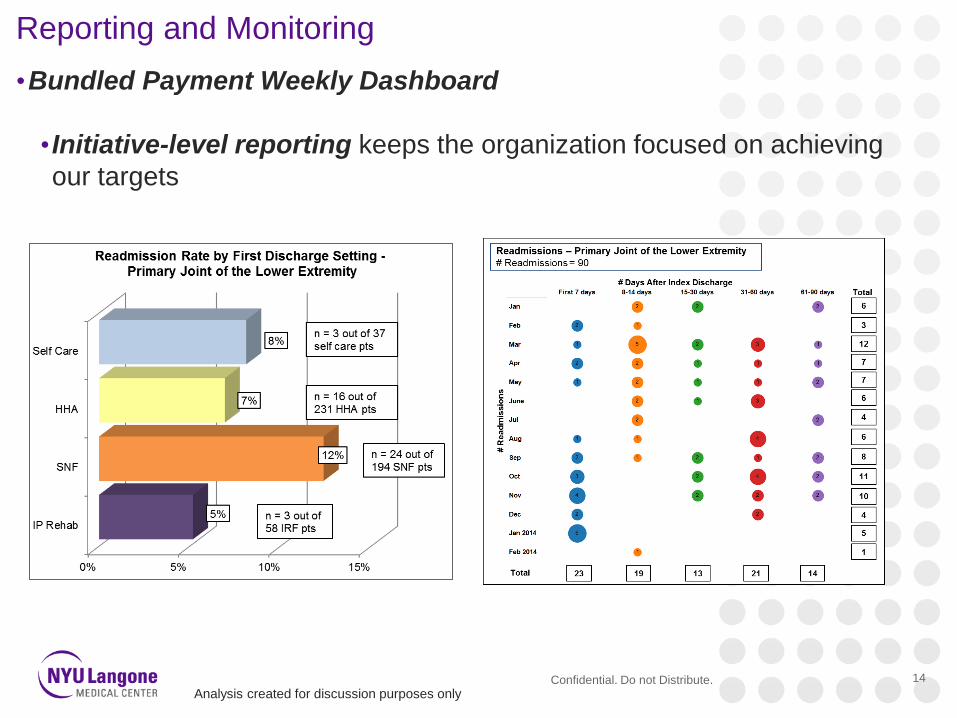
Reporting and Monitoring
•Bundled Payment Weekly Dashboard
• Initiative-level reporting keeps the organization focused on achieving
our targets
Confidential. Do not Distribute. 14
Analysis created for discussion purposes only

Reporting and Monitoring
•Bundled Payment Weekly Dashboard (continued)
•Physician-level reporting allows Chairs and Chiefs to monitor their
departments’ performance
•Promotes a continuous drive for improvement and results
Confidential. Do not Distribute. 15 Analysis created for discussion purposes only
# Patients
Discharged
ALOS Rehab
Facility
Skilled
Nursing
Facility
Total
Facility-
Based
Care
Home
Health
Care Svc
Home/
Self Care
Total
Home-
Based
Care
# Readmissions
(Closed Episodes
Only)
# Patients
(Closed
Episodes Only)
90-Day
Readmission
Rate (Closed
Episodes Only)
Primary Joint of the Lower Extremity 779 3.52 7% 37% 44% 53% 3% 56% 42 338 12%
HJD 733 3.41 6% 35% 41% 56% 3% 59% 35 317 11%
DRG 469 - Primary Joint w MCC 17 6.76 18% 35% 53% 47% 0% 47% 1 2 50%
Physician 1 4 6.00 25% 50% 75% 25% 0% 25% 0 0 0%
Physician 2 4 8.75 25% 25% 50% 50% 0% 50% 0 0 0%
Physician 3 2 4.50 0% 50% 50% 50% 0% 50% 0 0 0%
Physician 4 2 9.00 0% 50% 50% 50% 0% 50% 0 1 0%
Physician 5 1 7.00 0% 100% 100% 0% 0% 0% 0 0 0%
Physician 6 1 3.00 0% 0% 0% 100% 0% 100% 0 0 0%
Physician 7 1 13.00 0% 0% 0% 100% 0% 100% 0 0 0%
Physician 8 1 3.00 100% 0% 100% 0% 0% 0% 0 0 0%
Physician 9 1 3.00 0% 0% 0% 100% 0% 100% 1 1 100%
90-Day Readmission Rate - Closed Episodes Only 1Discharge Disposition
NYULMC Physician Dashboard

Q1 n= Q1 2013 Total
Episode
Medicare Pmt
Q1 2013 Avg
Medicare
Pmt
Difference btw Target
Price and Q1 2013
Avg. Pmt / Case*
Total Difference btw
Target Price and Q1
2013 Avg. Pmt
Notes
DRG 470 - w/o MCC 145 $4,502,110 $31,049 $4,516 $654,856
Physician 1 17 $555,114 $32,654 $2,911 $49,495
Physician 2 17 $488,987 $28,764 $6,801 $115,623
Physician 3 13 $348,167 $26,782 $8,783 $114,182
Physician 4 12 $329,093 $27,424 $8,141 $97,690
Physician 5 11 $300,686 $27,335 $8,230 $90,532
Physician 6 11 $240,935 $21,903 $13,662 $150,283
Physician 7 8 $353,004 $44,125 ($8,560) ($68,482) 74% of patients to facility-based post-acute care; 5
readmissions
Physician 8 5 $185,561 $37,112 ($1,547) ($7,735) 72% of patients to facility-based post-acute care
Physician 9 5 $127,504 $25,501 $10,064 $50,322
Physician 10 4 $224,483 $56,121 ($20,555) ($82,222) 79% of patients to facility-based post-acute care. One outlier
patient had a $108,000 readmission. The patient had a
comborbidity of CHF and was readmitted for pulmonary
embolism and pneumonia. The patient expired during the
readmission.
Physician 11 2 $159,205 $79,602 ($44,037) ($88,074) All fracture patients
Physician 12 2 $95,341 $47,671 ($12,105) ($24,211) All patients in Q1 were discharged to SNF
Reporting and Monitoring
•Quarterly Reporting
•Physician-level financial performance:
Confidential. Do not Distribute. 16
DRG 470 $35,565
DRG 469 $54,233
2013 Predicted
Target Prices
Q1 2013 physician comparison - Episode cost
Analysis created for discussion purposes only
• Future dashboard:
• Real-time pricing of the bundle using both current data and historical
averages

Future of Bundled Payment
Successes:
• The demonstration project has created dynamic and influential changes in the
delivery of care
•The hospital, physicians, and post-acute partners are better coordinating care
transitions and are communicating important clinical information about shared
patients
•Our patients are experiencing improved care through enhanced coordination and
communications between providers
17

Future of Bundled Payment
Challenges:
• Based on the 2013 CMS targets, the demonstration project is having a negative
financial impact on NYULMC when you account to the cost incurred and the
revenue lost due to care redesign.
•$3 Mil in staffing cost to get ready and $1.5 Mil/year going forward
•Loss of acute rehab revenue, $15,000 per case, 370-400 cases in 2013
•Loss of IME, DME, DSH add-ons revenue associated with the acute rehab
inpatient cases
•Reduction in readmissions, estimated at 24 cases in 2013 at $12,500 per case
plus $7,500 per case for IME, DME and DSH add-ons per case
•Recent data fluctuations are barriers to success. Baseline target prices and
volumes keep changing, resulting in the inability to accurately predict financial
performance and resulting in mixed messages to the physicians
•Without predictability of financial performance at both the initiative and physician-
levels, it is difficult to maintain clinician engagement in existing bundles and will
definitely hinder expansion to additional bundles
18


