
Vale’s performance in 1Q17
www.vale.com
App Vale Investors & Media
iOS: https://itunes.apple.com/us/app/vale-investor-media-portugues/id1087134066?ls=1&mt=8
Android: https://play.google.com/store/apps/details?id=com.theirapp.valeport
Tel.: (55 21) 3485-3900
Investor Relations Department
André Figueiredo
Carla Albano Miller
Fernando Mascarenhas
Andrea Gutman
Bruno Siqueira
Claudia Rodrigues
Denise Caruncho
Mariano Szachtman
Renata Capanema
BM&F BOVESPA: VALE3, VALE5
NYSE: VALE, VALE.P
EURONEXT PARIS: VALE3, VALE5
LATIBEX: XVALO, XVALP
Except where otherwise indicated the operational and financial information in this release is based on the consolidated figures
in accordance with IFRS and, with the exception of information on investments and behavior of markets, quarterly financial
statements are reviewed by the company’s independent auditors. The main subsidiaries that are conso l idated are the following:
Mineração Corumbaense Reunida S.A., PT Vale Indonesia Tbk (formerly International Nickel Indonesia Tbk), Salobo Metais
S.A, Vale Australia Pty Ltd., Vale International Holdings GMBH, Vale Canada Limited (formely Vale Inco Limited ), Vale
International S.A., Vale Manganês S.A., Vale Moçambique S.A., Vale Nouvelle -Calédonie SAS, Vale Oman Pelletizing Company
LLC and Vale Shipping Holding PTE Ltd.

3
Vale’s performance in 1Q17
Rio de Janeiro, April 27th, 2017 – Vale S.A. (Vale) delivered production records for a first quarter
in iron ore1 at 86.2 Mt, with the production record of 36.0 Mt for the Northern System, and in
Mozambique with the quarterly coal production record of 2.4 Mt.
Net revenues totaled US$ 8.515 billion in 1Q17, 8.1% lower than in 4Q16, negatively impacted
by seasonally lower sales volumes for Ferrous Minerals (US$ 1.271 billion) and planned
maintenance shutdowns and operational disruptions in Base Metals (US$ 203 million).
Costs and expenses, net of depreciation charges, totaled US$ 4.207 billion in 1Q17 vs. US$
4.621 billion in 4Q16. Costs, ex-depreciation, decreased by US$ 263 million in 1Q17 vs. 4Q16
driven by lower sales volumes (US$ 594 million), partially offset by lower dilution of fixed costs
on seasonally lower production volumes, unfavorable impact of exchange rate variations,
higher price-related cost factors such as the leasing of pellet plants, royalties, feed purchased
from third-parties and higher bunker oil prices. Operational issues at Thompson had a one-off
negative impact of US$ 32 million, including deleterious elements in the smelter feed and a hot
metal leak in the smelter. Expenses, ex-depreciation, decreased by US$ 151 million in 1Q17
vs. 4Q16 with reductions in SG&A, R&D, pre-operating expenses and others.
Adjusted EBITDA was US$ 4.308 billion in 1Q17, 8.8% lower than in 4Q16, mainly because of
seasonally lower sales volumes (US$ 828 million), out of which US$ 774 million from Ferrous
Minerals. Iron ore sales volumes were planned to take into account the build-up of inventory
due to the enhanced blending activities. Higher prices contributed positively with US$ 672
million. EBITDA margins at 50.6% in 1Q17 were in line with margins in 4Q16.
Capital expenditures totaled US$ 1.113 billion in 1Q17. Investments in project execution totaled
US$ 587 million and sustaining capex totaled US$ 526 million. The S11D project continued its
successful ramp-up, advancing according to plan. Physical progress on the duplication of the
railway reached 66% with 367 km completed up to March 2017. Physical progress on the
onshore expansion reached 89%.
Net income totaled US$ 2.490 billion and free cash flow US$ 2.424 billion in 1Q17. Cash
generated from operations totaled US$ 4.056 billion despite the increase in iron ore inventories
along the supply chain to support the enhanced blending activities and the payment of variable
compensation in 1Q17. Cash proceeds from net disposal/acquisition of asset and investments
totaled US$ 770 million, mainly as a result of the conclusion of the divestment of part of our
interest in the Moatize coal mine and the Nacala Logistics Corridor to Mitsui & Co, Ltd (Mitsui).
1 Including third party purchases.

4
Net debt totaled US$ 22.777 billion, decreasing substantially by US$ 2.265 billion vs. the US$
25.042 billion as of December 31st, 2016, with a cash balance of US$ 6.793 billion as of March
31st, 2017.
EBITDA from the Ferrous Minerals business segment in 1Q17 remained practically in
line with 4Q16, despite the seasonally lower sales volumes
Adjusted EBITDA for Ferrous Minerals was US$ 3.967 billion in 1Q17, US$ 142 million
lower than the US$ 4.109 billion achieved in 4Q16, mainly as a result of seasonally
lower sales volumes (US$ 774 million), exchange rate variations (US$ 84 million) and
higher bunker oil prices (US$ 51 million), which were partially offset by higher realized
prices (US$ 721 million).
Adjusted EBITDA per ton for Ferrous Minerals excluding Manganese was US$ 50.4/t
in 1Q17, 19% higher than the US$ 42.2/t recorded in 4Q16, mainly as a result of higher
CFR/FOB wmt prices and higher pellet premiums.
Iron ore fines and pellets EBITDA break-even remained in line vs. 4Q16 totaling US$
30.5/dmt in 1Q17.
Pellet CFR/FOB prices increased by US$ 23.7/t to US$ 116.0/t in 1Q17, whereas the
Platt’s IODEX iron ore reference price (CFR China) increased by US$ 14.9/t in the
quarter, mainly as a result of the renewal of sales contracts with a higher pellet
premium.
EBITDA from the Base Metals business segment decreased with seasonally lower
volumes and the one-off cost normalization in Thompson
Adjusted EBITDA for Base Metals was US$ 410 million in 1Q17, decreasing US$ 133
million vs. 4Q16, negatively impacted by lower volumes (US$ 82 million), a one-off cost
normalization in Thompson after the aforementioned operational issues (US$ 32
million) and unfavourable exchange rate variations (US$ 19 million).
In 2Q17, nickel and copper production will be impacted by the transition to a single
furnace operation at Sudbury and the three-week long surface plant wide schedule
maintenance shutdown, which occurs every 18 months. We took one of the furnaces
off-line in mid-March and we are rebuilding and expanding the furnace. The rebuilt
furnace will remain in operation post the transition to one furnace in the second half of
the year.
5
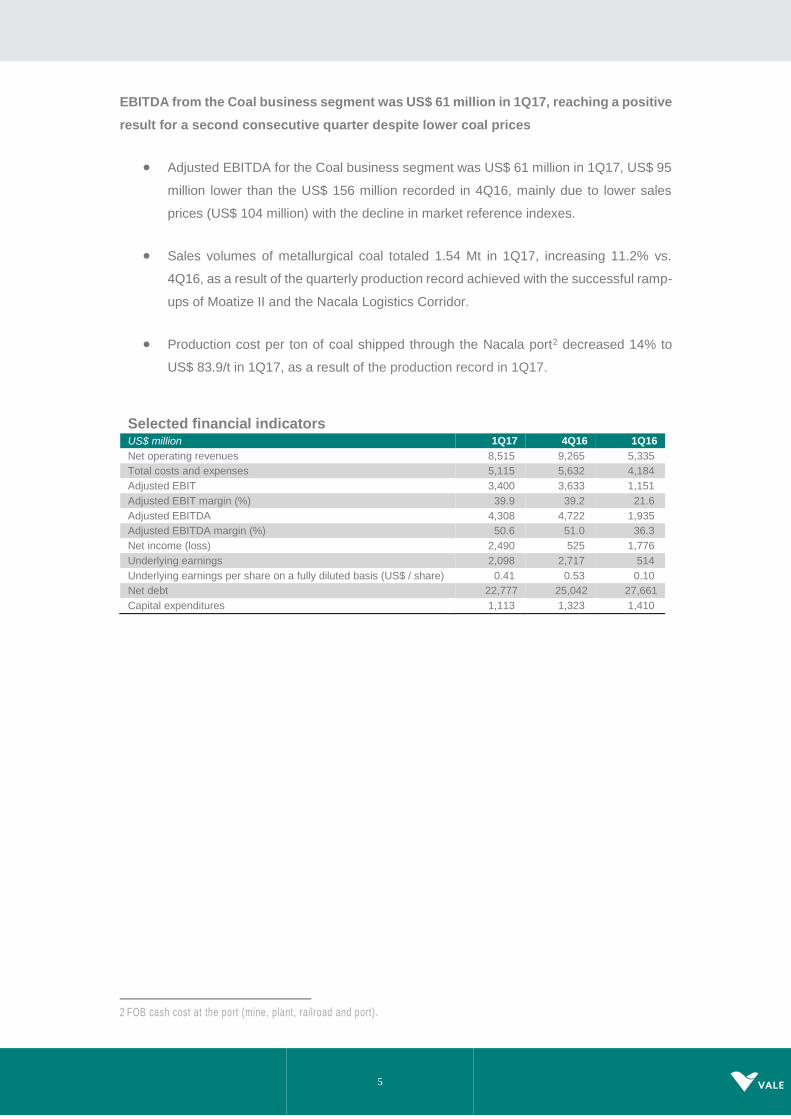
EBITDA from the Coal business segment was US$ 61 million in 1Q17, reaching a positive
result for a second consecutive quarter despite lower coal prices
Adjusted EBITDA for the Coal business segment was US$ 61 million in 1Q17, US$ 95
million lower than the US$ 156 million recorded in 4Q16, mainly due to lower sales
prices (US$ 104 million) with the decline in market reference indexes.
Sales volumes of metallurgical coal totaled 1.54 Mt in 1Q17, increasing 11.2% vs.
4Q16, as a result of the quarterly production record achieved with the successful ramp-
ups of Moatize II and the Nacala Logistics Corridor.
Production cost per ton of coal shipped through the Nacala port2 decreased 14% to
US$ 83.9/t in 1Q17, as a result of the production record in 1Q17.
Selected financial indicators
US$ million 1Q17 4Q16 1Q16
Net operating revenues 8,515 9,265 5,335
Total costs and expenses 5,115 5,632 4,184
Adjusted EBIT 3,400 3,633 1,151
Adjusted EBIT margin (%) 39.9 39.2 21.6
Adjusted EBITDA 4,308 4,722 1,935
Adjusted EBITDA margin (%) 50.6 51.0 36.3
Net income (loss) 2,490 525 1,776
Underlying earnings 2,098 2,717 514
Underlying earnings per share on a fully diluted basis (US$ / share) 0.41 0.53 0.10
Net debt 22,777 25,042 27,661
Capital expenditures 1,113 1,323 1,410
2 FOB cash cost at the port (mine, plant, railroad and port).
6
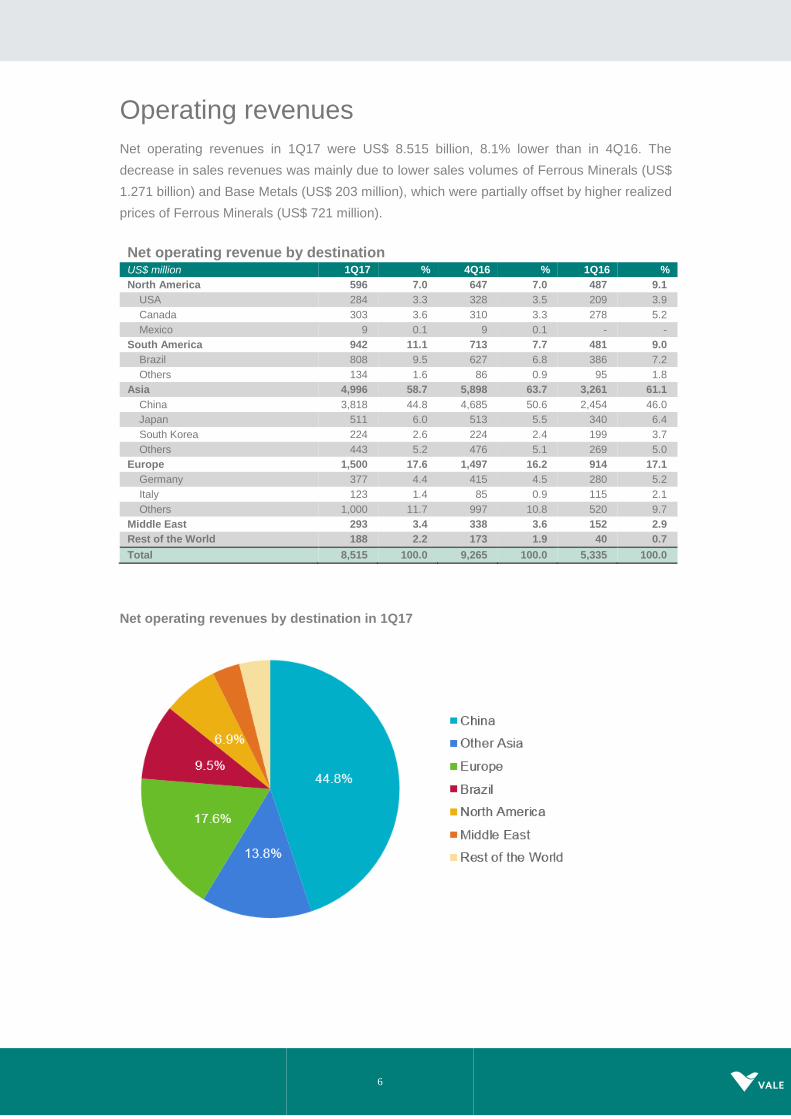
Operating revenues
Net operating revenues in 1Q17 were US$ 8.515 billion, 8.1% lower than in 4Q16. The
decrease in sales revenues was mainly due to lower sales volumes of Ferrous Minerals (US$
1.271 billion) and Base Metals (US$ 203 million), which were partially offset by higher realized
prices of Ferrous Minerals (US$ 721 million).
Net operating revenue by destination
US$ million 1Q17 % 4Q16 % 1Q16 %
North America 596 7.0 647 7.0 487 9.1
USA 284 3.3 328 3.5 209 3.9
Canada 303 3.6 310 3.3 278 5.2
Mexico 9 0.1 9 0.1 - -
South America 942 11.1 713 7.7 481 9.0
Brazil 808 9.5 627 6.8 386 7.2
Others 134 1.6 86 0.9 95 1.8
Asia 4,996 58.7 5,898 63.7 3,261 61.1
China 3,818 44.8 4,685 50.6 2,454 46.0
Japan 511 6.0 513 5.5 340 6.4
South Korea 224 2.6 224 2.4 199 3.7
Others 443 5.2 476 5.1 269 5.0
Europe 1,500 17.6 1,497 16.2 914 17.1
Germany 377 4.4 415 4.5 280 5.2
Italy 123 1.4 85 0.9 115 2.1
Others 1,000 11.7 997 10.8 520 9.7
Middle East 293 3.4 338 3.6 152 2.9
Rest of the World 188 2.2 173 1.9 40 0.7
Total 8,515 100.0 9,265 100.0 5,335 100.0
Net operating revenues by destination in 1Q17

7
Net operating revenue by business area
US$ million 1Q17 % 4Q16 % 1Q16 %
Ferrous minerals 6,497 76.3 7,047 76.1 3,804 71.3
Iron ore fines 4,826 56.7 5,576 60.2 2,917 54.7
ROM 15 0.2 28 0.3 4 0.1
Pellets 1,459 17.1 1,217 13.1 753 14.1
Manganese ore 43 0.5 87 0.9 31 0.6
Ferroalloys 43 0.5 30 0.3 16 0.3
Others 111 1.3 109 1.2 83 1.6
Coal 324 3.8 376 4.1 154 2.9
Metallurgical coal 254 3.0 300 3.2 104 1.9
Thermal coal 70 0.8 76 0.8 50 0.9
Base metals 1,597 18.8 1,760 19.0 1,353 25.4
Nickel 760 8.9 894 9.6 650 12.2
Copper 568 6.7 585 6.3 435 8.2
PGMs 85 1.0 52 0.6 96 1.8
Gold as by-product 130 1.5 164 1.8 130 2.4
Silver as by-product 7 0.1 13 0.1 9 0.2
Others 47 0.6 52 0.6 33 0.6
Others 97 1.1 82 0.9 24 0.4
Total 8,515 100.0 9,265 100.0 5,335 100.0
8
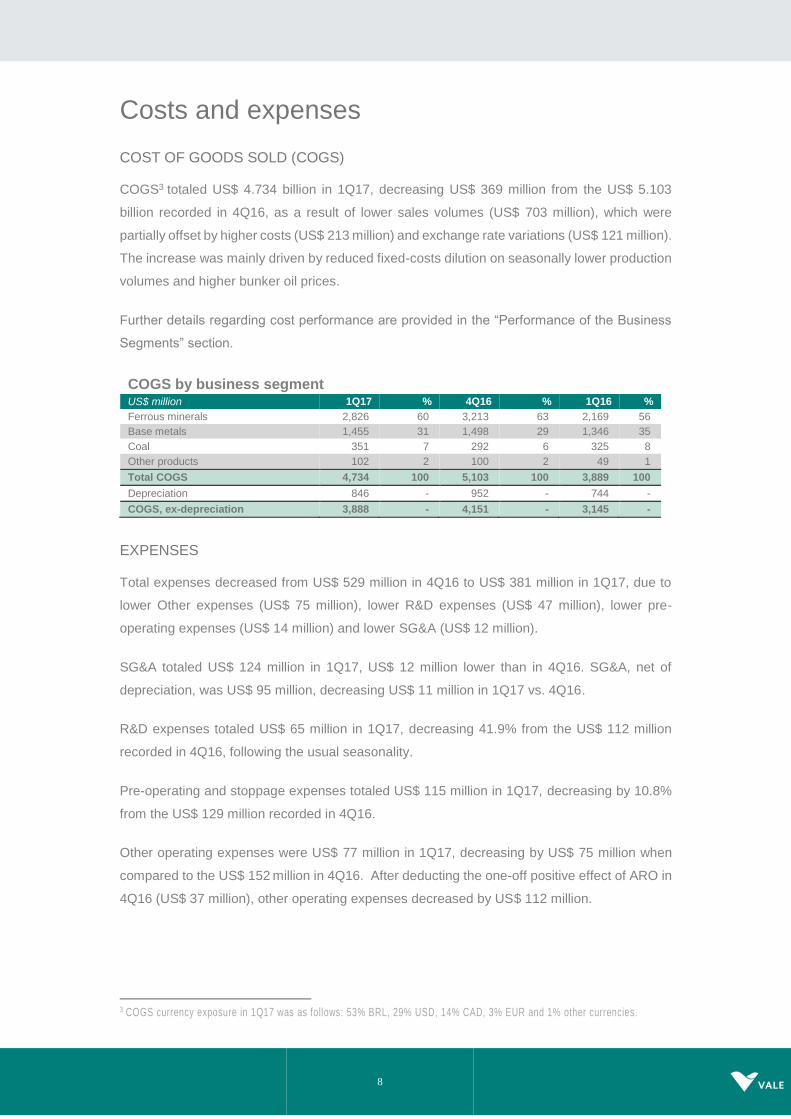
Costs and expenses
COST OF GOODS SOLD (COGS)
COGS3 totaled US$ 4.734 billion in 1Q17, decreasing US$ 369 million from the US$ 5.103
billion recorded in 4Q16, as a result of lower sales volumes (US$ 703 million), which were
partially offset by higher costs (US$ 213 million) and exchange rate variations (US$ 121 million).
The increase was mainly driven by reduced fixed-costs dilution on seasonally lower production
volumes and higher bunker oil prices.
Further details regarding cost performance are provided in the “Performance of the Business
Segments” section.
COGS by business segment US$ million 1Q17 % 4Q16 % 1Q16 %
Ferrous minerals 2,826 60 3,213 63 2,169 56
Base metals 1,455 31 1,498 29 1,346 35
Coal 351 7 292 6 325 8
Other products 102 2 100 2 49 1
Total COGS 4,734 100 5,103 100 3,889 100
Depreciation 846 - 952 - 744 -
COGS, ex-depreciation 3,888 - 4,151 - 3,145 -
EXPENSES
Total expenses decreased from US$ 529 million in 4Q16 to US$ 381 million in 1Q17, due to
lower Other expenses (US$ 75 million), lower R&D expenses (US$ 47 million), lower pre-
operating expenses (US$ 14 million) and lower SG&A (US$ 12 million).
SG&A totaled US$ 124 million in 1Q17, US$ 12 million lower than in 4Q16. SG&A, net of
depreciation, was US$ 95 million, decreasing US$ 11 million in 1Q17 vs. 4Q16.
R&D expenses totaled US$ 65 million in 1Q17, decreasing 41.9% from the US$ 112 million
recorded in 4Q16, following the usual seasonality.
Pre-operating and stoppage expenses totaled US$ 115 million in 1Q17, decreasing by 10.8%
from the US$ 129 million recorded in 4Q16.
Other operating expenses were US$ 77 million in 1Q17, decreasing by US$ 75 million when
compared to the US$ 152 million in 4Q16. After deducting the one-off positive effect of ARO in
4Q16 (US$ 37 million), other operating expenses decreased by US$ 112 million.
3 COGS currency exposure in 1Q17 was as follows: 53% BRL, 29% USD, 14% CAD, 3% EUR and 1% other currencies.

9
Expenses
US$ million 1Q17 % 4Q16 % 1Q16 %
SG&A ex-depreciation 95 - 106 - 85 -
SG&A 124 33 136 26 107 36
Administrative 111 29 128 24 101 34
Personnel 54 14 52 10 47 16
Services 14 4 25 5 14 5
Depreciation 29 8 30 6 22 7
Others 14 4 21 4 18 6
Selling 13 3 8 2 6 2
R&D 65 17 112 21 55 19
Pre-operating and stoppage expenses¹
115 30 129 24 97 33
Long Harbour 48 13 47 9 49 17
S11D 50 13 34 6 15 5
Moatize - - - - 1 -
Others 17 4 48 9 32 11
Other operating expenses 77 20 152 29 36 12
Total Expenses 381 100 529 100 295 100
Depreciation 62 - 59 - 39 -
Expenses ex-depreciation 319 - 470 - 256 -
¹ Includes US$ 31 million of depreciation charges in 1Q17, US$ 30 million in 4Q16, and US$ 25 million in 1Q16
Costs and expenses US$ million 1Q17 4Q16 1Q16
Costs 4,734 5,103 3,889
Expenses 381 529 295
Total costs and expenses 5,115 5,632 4,184
Depreciation 908 1,011 783
Costs and expenses ex-depreciation 4,207 4,621 3,401
10
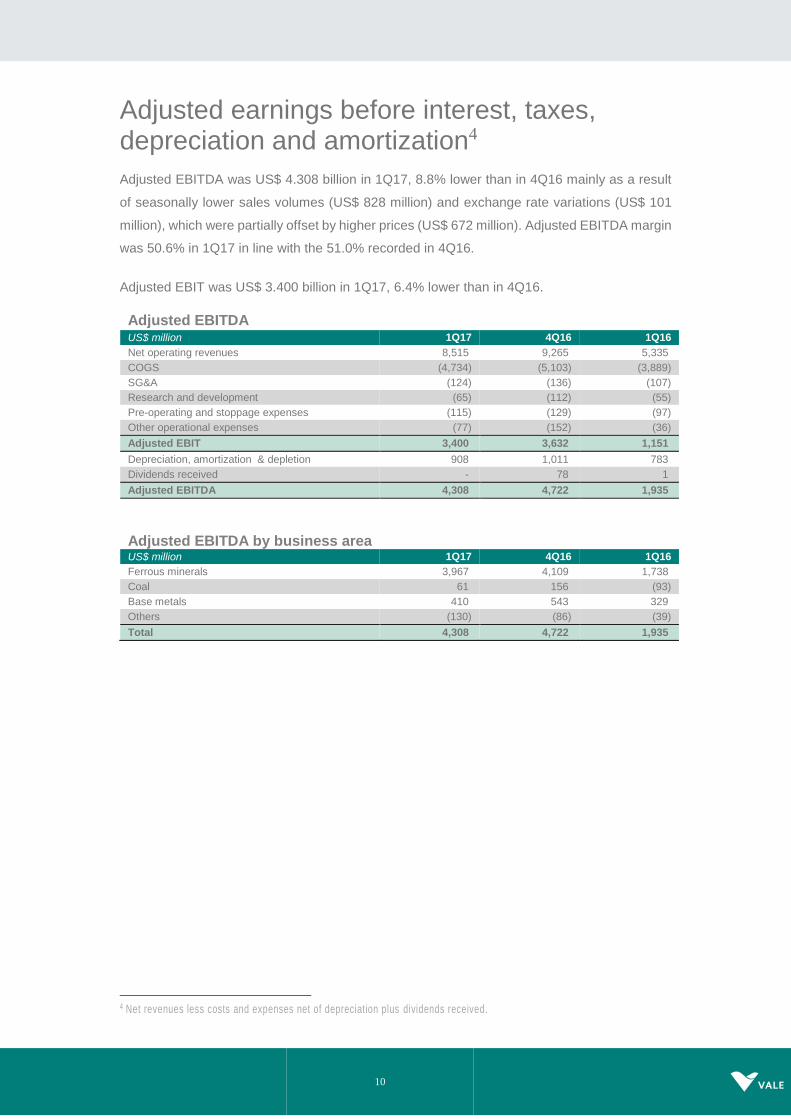
Adjusted earnings before interest, taxes, depreciation and amortization4
Adjusted EBITDA was US$ 4.308 billion in 1Q17, 8.8% lower than in 4Q16 mainly as a result
of seasonally lower sales volumes (US$ 828 million) and exchange rate variations (US$ 101
million), which were partially offset by higher prices (US$ 672 million). Adjusted EBITDA margin
was 50.6% in 1Q17 in line with the 51.0% recorded in 4Q16.
Adjusted EBIT was US$ 3.400 billion in 1Q17, 6.4% lower than in 4Q16.
Adjusted EBITDA
US$ million 1Q17 4Q16 1Q16
Net operating revenues 8,515 9,265 5,335
COGS (4,734) (5,103) (3,889)
SG&A (124) (136) (107)
Research and development (65) (112) (55)
Pre-operating and stoppage expenses (115) (129) (97)
Other operational expenses (77) (152) (36)
Adjusted EBIT 3,400 3,632 1,151
Depreciation, amortization & depletion 908 1,011 783
Dividends received - 78 1
Adjusted EBITDA 4,308 4,722 1,935
Adjusted EBITDA by business area US$ million 1Q17 4Q16 1Q16
Ferrous minerals 3,967 4,109 1,738
Coal 61 156 (93)
Base metals 410 543 329
Others (130) (86) (39)
Total 4,308 4,722 1,935
4 Net revenues less costs and expenses net of depreciation plus dividends received.
11
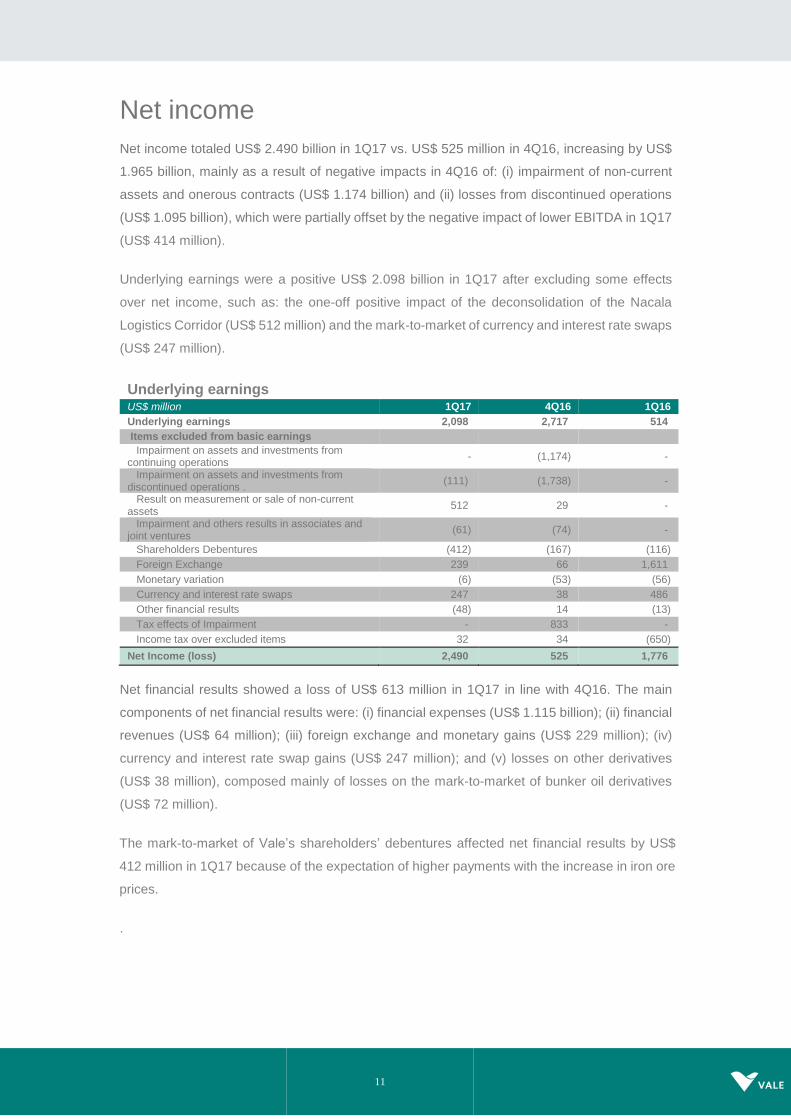
Net income
Net income totaled US$ 2.490 billion in 1Q17 vs. US$ 525 million in 4Q16, increasing by US$
1.965 billion, mainly as a result of negative impacts in 4Q16 of: (i) impairment of non-current
assets and onerous contracts (US$ 1.174 billion) and (ii) losses from discontinued operations
(US$ 1.095 billion), which were partially offset by the negative impact of lower EBITDA in 1Q17
(US$ 414 million).
Underlying earnings were a positive US$ 2.098 billion in 1Q17 after excluding some effects
over net income, such as: the one-off positive impact of the deconsolidation of the Nacala
Logistics Corridor (US$ 512 million) and the mark-to-market of currency and interest rate swaps
(US$ 247 million).
Underlying earnings
US$ million 1Q17 4Q16 1Q16
Underlying earnings 2,098 2,717 514
Items excluded from basic earnings
Impairment on assets and investments from continuing operations
- (1,174) -
Impairment on assets and investments from discontinued operations .
(111) (1,738) -
Result on measurement or sale of non-current assets
512 29 -
Impairment and others results in associates and joint ventures
(61) (74) -
Shareholders Debentures (412) (167) (116)
Foreign Exchange 239 66 1,611
Monetary variation (6) (53) (56)
Currency and interest rate swaps 247 38 486
Other financial results (48) 14 (13)
Tax effects of Impairment - 833 -
Income tax over excluded items 32 34 (650)
Net Income (loss) 2,490 525 1,776
Net financial results showed a loss of US$ 613 million in 1Q17 in line with 4Q16. The main
components of net financial results were: (i) financial expenses (US$ 1.115 billion); (ii) financial
revenues (US$ 64 million); (iii) foreign exchange and monetary gains (US$ 229 million); (iv)
currency and interest rate swap gains (US$ 247 million); and (v) losses on other derivatives
(US$ 38 million), composed mainly of losses on the mark-to-market of bunker oil derivatives
(US$ 72 million).
The mark-to-market of Vale’s shareholders’ debentures affected net financial results by US$
412 million in 1Q17 because of the expectation of higher payments with the increase in iron ore
prices.
.

12
The end-to-end appreciation of BRL5 contributed to generate non-cash gains of US$ 483 million
with positive effects of currency swap (US$ 247 million) and foreign exchange (US$ 236
million).
The impact on financial results of the end-to-end appreciation of the BRL in 1Q17 was offset by
the introduction of a net investment hedge in 1Q17. On January 1st, 2017, Vale assigned part of
its USD and Euro designated debt as hedge against its net investments in its subsidiaries Vale
International S.A. and Vale International Holding GmbH. The objective was to mitigate the
foreign exchange risk. On March 31st, 2017, the carrying value of the debt assigned for the net
investment hedge was US$ 8.034 billion and € 750 million. The foreign exchange gains on their
translation of this debt portion to BRL were US$ 227 million and US$ 37 million, respectively.
These gains were recognized directly in the “Other comprehensive income” in the stockholders
equity.
The average appreciation of the BRL against the USD had a negative impact on cash flows, as
most revenues were denominated in USD, while COGS were 53% denominated in BRL, 29%
in USD and 14% in Canadian dollars (CAD) and about 66% of capital expenditures were
denominated in BRL. The appreciation of the BRL and of other currencies increased costs and
expenses by US$ 101 million in 1Q17.
Financial results
US$ million 1Q17 4Q16 1Q16
Financial expenses (1,115) (762) (614)
Gross interest (503) (441) (411)
Capitalization of interest 103 91 177
Tax and labor contingencies (18) 15 (21)
Shareholder debentures (412) (167) (116)
Others (159) (133) (129)
Financial expenses (REFIS) (126) (127) (114)
Financial income 64 52 57
Derivatives¹ 209 96 440
Currency and interest rate swaps 247 39 486
Others² (bunker oil, commodities, etc) (38) 57 (46)
Foreign Exchange 236 64 1,584
Monetary variation (7) (53) (56)
Financial result, net (613) (603) 1,411
¹The net derivatives gains of US$ 209 million in 1Q17 are comprised of mark-to-market gains of US$ 316 million and settlement losses of US$ 107 million.
² Other derivatives include mainly bunker oil derivatives losses of US$ 72 million
5 1Q17, from end-to-end, the Brazilian Real (BRL) appreciated 2.8% against the US Dollar (USD) from BRL 3.26/ USD as of
December 30 th, 2016 to BRL 3.17/ USD as of March 31 st, 2017. On a quarterly average, the exchange rate appreciated by 4.3%,
from an average BRL 3.29/ USD in 4Q16 to an average BRL 3.15/ USD in 1Q17.
13
At the Annual General Shareholders Meeting held on April 20th 2017, it was approved the
payment of R$ 4.667 billion as shareholder remuneration based on the results of the 2016
financial year. Including the first tranche paid out on December 16th, 2016, in the amount of R$
857 million, Vale's total gross payment to its shareholders is R$ 5.524 billion, for the 2016
financial year.
Equity income from affiliated companies
Equity income from affiliated companies was US$ 73 million in 1Q17 vs. a loss of US$ 83 million
in 4Q16. The main positive contributors to equity income were the leased pelletizing companies
in Tubarão (US$ 52 million), MRS (US$ 16 million) and CSI (US$ 9 million), which were partially
offset by the negative contributions of VLI (US$ 13 million) and CSP (US$ 10 million). The higher
contribution from the Tubarão pelletizing companies is a result of the higher lease payments
received by the pellet plants with the increase in iron ore prices and pellet premiums. This
increase partially offsets the higher Cost of Goods Sold reported in 1Q17.

14
Investments6
Capital expenditures totaled US$ 1.113 billion in 1Q17 with US$ 587 million in project execution
and US$ 526 million in sustaining capital. Capital expenditures decreased US$ 210 million vs.
the US$ 1.323 billion spent in 4Q16.
Vale’s capex guidance excluding the investments in the Fertilizers business segment is US$
4.2 billion, US$ 4.0 billion and US$ 3.7 billion, for 2017, 2018 and 2019, respectively.
Project Execution and Sustaining by business area
US$ million 1Q17 % 4Q16 % 1Q16 %
Ferrous minerals 830 72.1 769 58.1 917 65.0
Coal 56 5.1 171 12.9 133 9.4
Base metals 208 18.6 366 27.7 269 19.1
Power generation 14 1.1 17 1.3 26 1.8
Steel 5 0.4 - - 65 4.6
Others - - - - - -
Total 1,113 100.0 1,323 100.0 1,409 100.0
Project execution
Ferrous Minerals accounted for about 90% of the total investment in project execution in 1Q17.
Project execution by business area
US$ million 1Q17 % 4Q16 % 1Q16 %
Ferrous minerals 528 89.9 468 79.6 701 76.8
Coal 32 5.4 98 16.7 118 13.0
Base metals 10 1.6 6 1.0 2 0.3
Power generation 13 2.2 15 2.6 26 2.8
Steel 5 0.9 - 0.1 65 7.1
Total 587 100.0 588 100.0 913 100.0
FERROUS MINERALS
About 97% of the US$ 528 million invested in Ferrous Minerals in 1Q17 relates to the S11D
project and the expansion of its associated infrastructure (US$ 512 million).
6 Does not include Fertilizers investments.
15
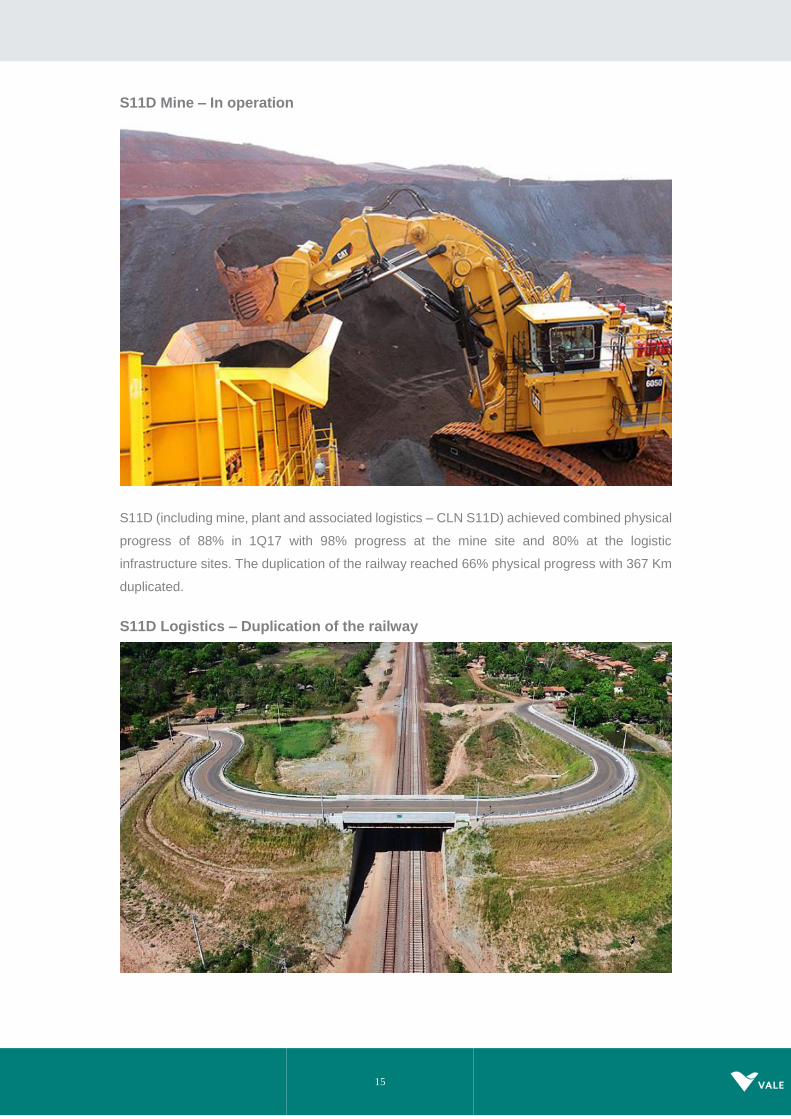
S11D Mine – In operation
S11D (including mine, plant and associated logistics – CLN S11D) achieved combined physical
progress of 88% in 1Q17 with 98% progress at the mine site and 80% at the logistic
infrastructure sites. The duplication of the railway reached 66% physical progress with 367 Km
duplicated.
S11D Logistics – Duplication of the railway

16
Description and status of main projects
Progress indicators7
Sustaining capex
Sustaining capital totaled US$ 526 million in 1Q17, decreasing 28% when compared to 4Q16.
The Ferrous Minerals and Base Metals business segments accounted for 57% and 38% of the
total sustaining capex in 1Q17, respectively.
Sustaining capex in the Base Metals business segment was mainly dedicated to: (i)
enhancement and replacement in operations (US$ 131 million), (ii) improvement in the current
standards of health and safety and environmental protection (US$ 53 million); (iii) maintenance
improvements and expansion of tailings dams (US$ 5 million). Base Metals sustaining capex
will be higher for 2017 due to the change in Sudbury to a single furnace operation and the
investments for the Air Emission Reduction project (AER).
Sustaining capital for the Ferrous Minerals business segment included, among others: (i)
enhancement and replacement in operations (US$ 210 million), (ii) improvement in the current
standards of health and safety, social and environmental protection (US$ 43 million), (iii)
maintenance, improvement and expansion of tailings dams (US$ 34 million). Maintenance of
railways and ports in Brazil and Malaysia accounted for US$ 105 million.
7 Pre-operating expenses were not included in the estimated capex for the year, although included in the total estimated
capex column, in line with Vale’s Board of Directors approvals. Estimated capex for the year is only reviewed once a year.
Project Description Capacity
(Mtpy) Status
Ferrous Minerals projects
CLN S11D Duplication of 570 km railway, with construction of rail spur of 101 km. Acquisition of wagons, locomotives, onshore and offshore expansions at PDM maritime terminal.
(80)a Duplication of the railway reached 66% physical progress, totaling 367 Km delivered
Onshore expansion reached 89% physical progress
a Net additional capacity
Project Capacity
(Mtpy) Estimated start-up
Executed capex (US$ million)
Estimated capex (US$ million) Physical
progress 2017 Total 2017 Total
Ferrous minerals projects
CLN S11D 230 (80)a 1H14 to 2H19 357 6,013 962 7,850b 80%
a Net additional capacity. b Original capex budget of US$ 11.582 bill ion.

17
Vale approved the restart of the São Luis pellet plant with its start-up planned for the first half
of 2018. The project which includes the revamp of the plant and the upgrade of its automation
system will cost US$ 105 million, charged to sustaining investments.
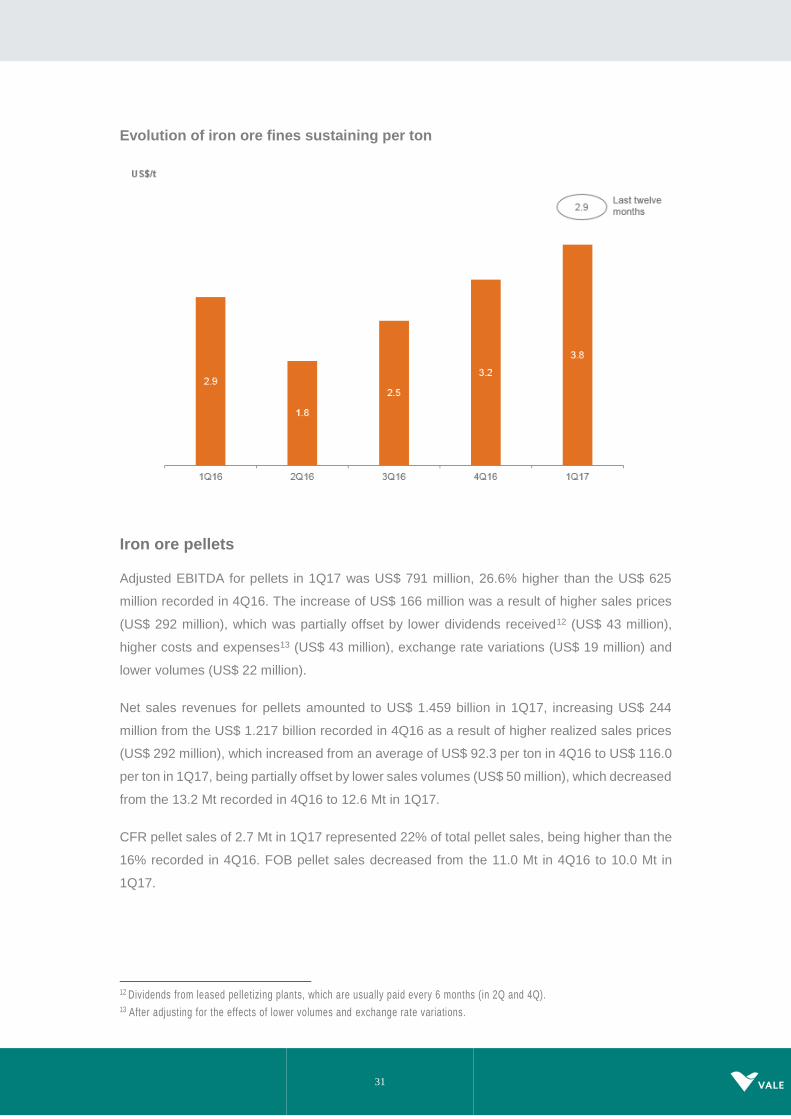
Sustaining investments in iron ore fines (excluding sustaining investments in pellet plants)
amounted to US$ 240 million, equivalent to US$ 3.8/dmt of iron ore fines in 1Q17, vs. the US$
3.2/dmt in 4Q16, mainly due to the reduced dilution on seasonally lower volumes (US$ 0.6/t).
The last twelve months average of sustaining capex for iron ore fines amounts to US$ 2.9/dmt.
US$ million Ferrous
Minerals Coal Base Metals TOTAL
Operations 210 21 131 362
Waste dumps and tailing dams 34 - 5 39
Health and Safety 33 3 12 48
CSR - Corporate Social Responsibility 10 - 41 51
Administrative & Others 16 1 9 26
Total 303 25 198 526
Sustaining capex by business area
US$ million 1Q17 % 4Q16 % 1Q16 %
Ferrous minerals 302 57.4 301 40.9 216 43.4
Coal 25 4.8 73 9.9 14 2.8
Base metals 198 37.6 360 49.0 267 53.8
Power generation 1 0.2 1 0.2 - -
Others - - - - - -
Total 526 100.00 735 100.0 497 100.0
Corporate social responsibility
Investments in corporate social responsibility totaled US$ 84 million in 1Q17, of which US$ 58
million dedicated to environmental protection and conservation and US$ 26 million dedicated
to social projects.
In association with the reparation and restoration efforts after the Samarco dam failure, Vale
contributed with:
(i) R$ 187 million (US$ 60 million) to Samarco for the reparation programs in accordance
with the Framework Agreement, and consequently, used this amount to offset the
provision of R$ 3.733 billion (US$ 1.163 billion) made as of June 30th 2016;
(ii) R$ 75 million (US$ 23 million) to the Renova Foundation to be used in the reparation
and compensation programs in accordance with the Framework Agreement with this
amount also used to offset the abovementioned provision; and
(iii) R$ 191 million (US$ 61 million) to fund Samarco’s working capital, from a total short
term line of credit of up to R$ 375 million (US$ 115 million) that was made available
for the 1H17, and recognized in Vale’s income statement under “Impairment and
other results in associates and joint ventures”.
18
Portfolio Management
In March 2017, we concluded the equity transaction with Mitsui & Co, Ltd (Mitsui), associated
with the divestment of part of our interest in the Moatize coal mine and in the Nacala Logistics
Corridor.

19
Free cash flow
Free cash flow was US$ 2.454 billion in 1Q17.
Cash generated from operations was US$ 4.056 billion in 1Q17, US$ 252 million lower than
EBITDA , mainly due to: (i) inventories build up in 1Q17 as part of the ongoing offshore blending
activities and (ii) payment of US$ 242 million of profit sharing, which was already provisioned
in 4Q16, thus not impacting EBITDA in 1Q17.
Free Cash Flow 1Q17
US$ million
20
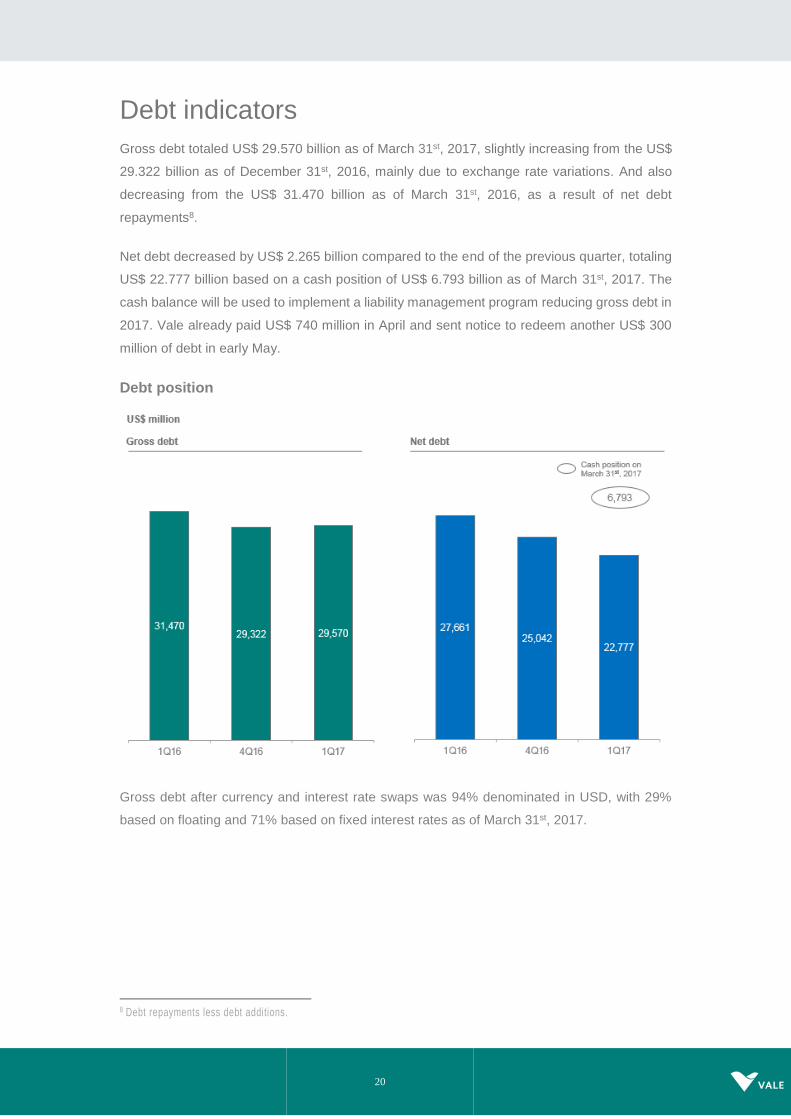
Debt indicators
Gross debt totaled US$ 29.570 billion as of March 31st, 2017, slightly increasing from the US$
29.322 billion as of December 31st, 2016, mainly due to exchange rate variations. And also
decreasing from the US$ 31.470 billion as of March 31st, 2016, as a result of net debt
repayments8.
Net debt decreased by US$ 2.265 billion compared to the end of the previous quarter, totaling
US$ 22.777 billion based on a cash position of US$ 6.793 billion as of March 31st, 2017. The
cash balance will be used to implement a liability management program reducing gross debt in
2017. Vale already paid US$ 740 million in April and sent notice to redeem another US$ 300
million of debt in early May.
Debt position
Gross debt after currency and interest rate swaps was 94% denominated in USD, with 29%
based on floating and 71% based on fixed interest rates as of March 31st, 2017.
8 Debt repayments less debt additions.

21
Average debt maturity increased slightly to 8.0 years on March 31st, 2017, against 7.9 years on
December 31ts, 2016. Average cost of debt, after the abovementioned currency and interest
rate swaps, increased slightly, to 4.71% per annum on March 31st, 2017, against 4.63% per
annum on December 31st, 2016.
Interest coverage, measured by the ratio of LTM9 adjusted EBITDA to LTM gross interest,
improved to 7.7x in 1Q17 vs. 6.8x in 4Q16 and vs. 4.2x in 1Q16.
9 Last twelve months.

22
Gross debt to LTM adjusted EBITDA decreased to 2.1x as of March 31st, 2017 from 2.4x as of
December 31st, 2016 and from 4.5x as of March 31st, 2016.
Debt indicators
US$ million 1Q17 4Q16 1Q16
Total debt 29,570 29,322 31,470
Net debt 22,777 25,042 27,661
Total debt / adjusted LTM EBITDA (x) 2.1 2.4 4.5
Adjusted LTM EBITDA / LTM gross interest (x) 7.7 6.8 4.2

23
Performance of the business segments
Segment information ― 1Q17, as per footnote of financial statements
Expenses
US$ million Net
Revenues Cost¹
SG&A and
others¹ R&D¹
Pre operating & stoppage¹
Dividends Adjusted EBITDA²
Ferrous minerals 6,497 (2,449) (16) (20) (45) - 3,967
Iron ore fines 4,826 (1,677) 2 (16) (41) - 3,094
ROM 15 - - - - - 15
Pellets 1,459 (652) (12) (3) (1) - 791
Others ferrous 111 (76) (4) (1) - - 30
Mn & Alloys 86 (44) (2) - (3) - 37
Coal 324 (248) (12) (3) - - 61
Base metals 1,597 (1,092) (46) (11) (38) - 410
Nickel³ 1,132 (862) (43) (9) (38) - 180
Copper4 465 (230) (3) (2) - - 230
Others 97 (99) (96) (31) (1) - (130)
Total 8,515 (3,888) (170) (65) (84) - 4,308
¹ Ex-depreciation and amortization
² Excluding non-recurring effects
3 Including copper and by-products from our nickel operations
4 Including by-products from our copper operations

24
Ferrous minerals
Adjusted EBITDA of the Ferrous Minerals business segment was US$ 3.967 billion in 1Q17,
3.5% lower than in 4Q16, mainly as a result of lower sales volumes10 (US$ 774 million), the
negative impact of exchange rate variations (US$ 84 million), higher bunker oil prices (US$ 51
million), which were partially offset by higher market prices (US$ 584 million), gains in
competitiveness and by the positive one-off effect of insurance recovery (US$ 183 million).
Sales volumes decreased as a result of the usual weather related seasonality and the build-up
of offshore inventory of iron ore fines.
EBITDA variation 4Q16 vs. 1Q17 – Ferrous Minerals business segment
Iron ore fines (excluding Pellets and ROM)
EBITDA
Adjusted EBITDA of iron ore fines was US$ 3.094 billion in 1Q17, 8.8% lower than in 4Q16,
mainly as a result of lower sales volumes (US$ 726 million), which were partially offset by the
positive impacts of higher realized prices (US$ 403 million).
SALES REVENUES AND VOLUME
Net sales revenues of iron ore fines, excluding pellets and Run of Mine (ROM), amounted to
US$ 4.826 billion in 1Q17 vs. US$ 5.576 billion in 4Q16, as a result of lower iron ore fines sales
10 Including the effect of lower CFR volumes on freight costs.

25
volumes (US$ 1.153 billion), which were partially offset by higher sales prices (US$ 403 million)
in 1Q17 vs. 4Q16.
Sales volumes of iron ore fines reached 63.7 Mt in 1Q17 vs. 80.3 Mt in 4Q16, 20.1% lower than
in 4Q16, due to the usual weather related seasonality.
CFR sales of iron ore fines totaled 42.8 Mt in 1Q17, representing 67% of all iron ore fines sales
volumes in 1Q17 and in line with the share of CFR sales in 4Q16 (69%).
Net operating revenue by product US$ million 1Q17 4Q16 1Q16
Iron ore fines 4,826 5,576 2,917
ROM 15 28 4
Pellets 1,459 1,216 753
Manganese & Ferroalloys 86 117 47
Others 111 110 83
Total 6,497 7,047 3,804
Volume sold
‘000 metric tons 1Q17 4Q16 1Q16
Iron ore fines 63,682 80,287 62,744
ROM 1,636 2,220 520
Pellets 12,582 13,190 11,130
Manganese ore 196 534 515
Ferroalloys 30 35 25
REALIZED PRICES
Pricing system breakdown

26
Price realization – iron ore fines
Vale’s CFR dmt reference price for iron ore fines (ex-ROM) increased by US$ 7.5/t from US$
79.1/t in 4Q16 to US$ 86.7/t in 1Q17, equivalent to a price realization of 101% of the average
Platts IODEX 62% of US$ 85.6/t in 1Q17.
Vale’s CFR/FOB wmt price for iron ore fines (ex-ROM) increased 9.2% (US$ 6.3/t) from US$
69.4/t in 4Q16 to US$ 75.8/t in 1Q17, after adjusting for moisture and the effect of FOB sales,
which accounted for 33% of the total sales volumes in 1Q17.
Price realization in 1Q17 was impacted by:
Provisional prices set at the end of 4Q16 at US$ 74.6/t, which were later adjusted based
on the price of delivery in 1Q17, and positively impacted prices in 1Q17 by US$ 4.1/t
compared to a positive impact of US$ 4.8/t in 4Q16 as a result of the higher realized
prices in 1Q17.
Provisional prices set at the end of 1Q17 at US$ 77.9/t vs. the IODEX average of US$
85.9/t in 1Q17, which negatively impacted prices in 1Q17 by US$ 3.2/t compared to a
positive impact of US$ 1.7/t in 4Q16.
Quarter-lagged contracts, priced at US$ 63.0/t based on the average prices for Sep-
Oct-Nov which negatively impacted prices in 1Q17 by US$ 2.1/t compared to a
negative impact of US$ 1.3/t in 4Q16.

27
Iron ore sales of 26.2 Mt, or 41% of Vale’s sales mix, were recorded under the provisional
pricing system, which was set at the end of 1Q17 at US$ 77.9/t. The final prices of these sales
and the required adjustment to sales revenues will be determined and recorded in 2Q17.
Average prices
US$/ metric ton 1Q17 4Q16 1Q16
Iron ore - Metal Bulletin 65% index 99.11 82.60 50.96
Iron ore – Platts’ 62% IODEX 85.64 70.76 48.30
Iron ore fines CFR reference price (dmt) 86.70 79.10 54.67
Iron ore fines CFR/FOB realized price 75.78 69.40 46.50
ROM 9.17 12.61 8.02
Pellets CFR/FOB (wmt) 115.96 92.27 67.61
Manganese ore 219.39 162.92 60.56
Ferroalloys 1,433.33 857.14 648.96
COSTS
Costs for iron ore fines amounted to US$ 1.677 billion (or US$ 1.930 billion with depreciation
charges) in 1Q17. Costs remained in line with 4Q16, after adjusting for the effects of lower
sales volumes (US$ 427 million) and exchange rate variations (-US$ 50 million), despite the
negative effect of iron ore price-linked cost factors such as royalties, feed purchased from third-
parties and provision for profit sharing payments to employees.
IRON ORE COGS - 4Q16 x 1Q17
Variance drivers
US$ million 4Q16 Volume Exchange
Rate Others
Total Variation 4Q16 x 1Q17
1Q17
Total costs before depreciation and amortization
2,013 (427) 50 40 (336) 1,677
Depreciation 323 (70) 15 (14) (70) 253
Total 2,336 (497) 65 26 (406) 1,930
Maritime freight costs, which are fully accrued as cost of goods sold, totaled US$ 608 million in
1Q17, having decreased US$ 117 million vs. 4Q16.
Unit maritime freight cost per iron ore metric ton was US$ 14.2/t in 1Q17, US$ 1.0/t higher than
in 4Q16, mainly due to the negative impacts of higher bunker oil prices (US$ 1.1/t). Vale’s
average bunker oil price increased from US$ 257/t in 4Q16 to US$ 314/t in 1Q17.
C1 CASH COST
C1 cash cost FOB port per metric ton for iron ore fines ex-royalties increased by US$0.3/t, from
the US$ 14.4 recorded in 4Q16 to US$ 14.7/t in 1Q17, as a result of the negative impact of
reduced fixed-costs dilution on seasonally lower production volumes (US$ 0.7/t) and the
negative impact of the BRL appreciation against the USD of 4.5% in 1Q17 (US$ 0.6/t), which

28
were partly offset by one-off events in 4Q16 (US$ 0.9/t) and by other savings in 1Q17 (US$
0.1/t).
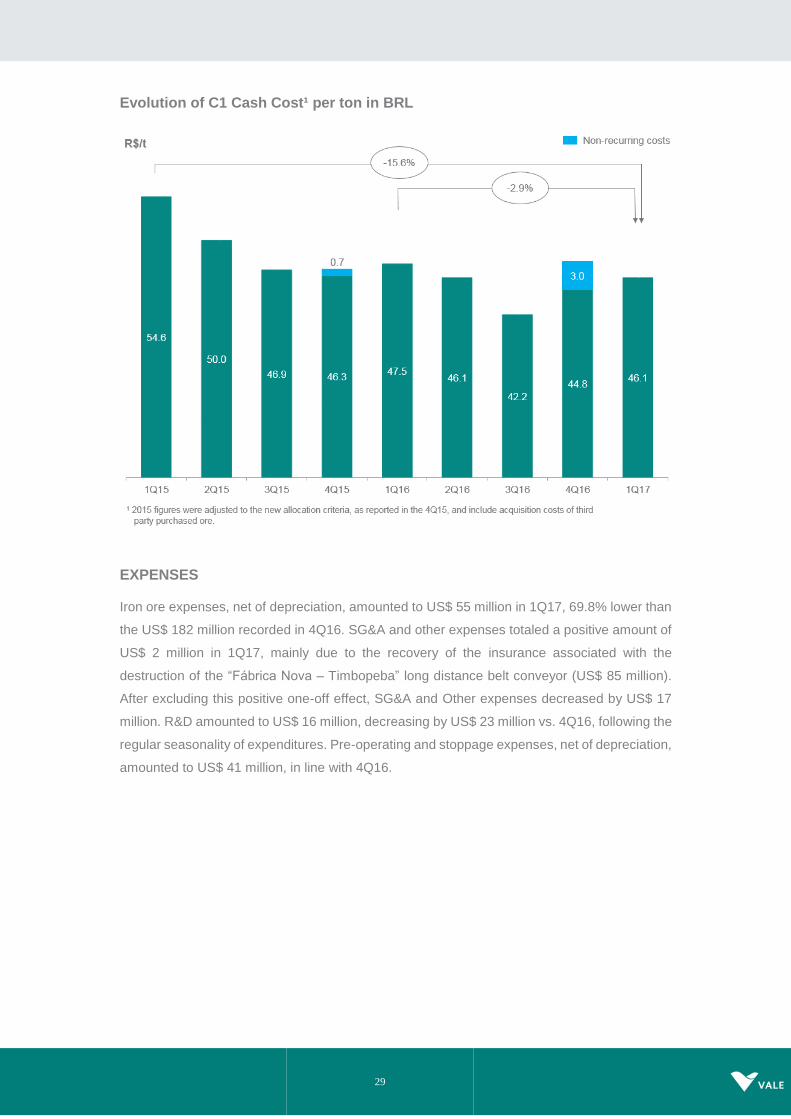
C1 cash cost FOB port per metric ton of iron ore fines in BRL was R$ 46.1/t in 1Q17, R$ 1.7/t
lower than the R$ 47.8/t recorded in 4Q16. After excluding the one-off effects of R$ 3.0/t in
4Q16, costs increased by R$ 1.3/t, mainly due to lower fixed-costs dilution on seasonally lower
production volumes in 1Q17. C1 unit cash cost was negatively impacted in 1Q17 by R$ 1.1/t,
due to the higher profit sharing provision resulting from higher iron ore prices, vs. R$ 0.8/t11 in
4Q16 and zero in 1Q16.
Iron Ore Fines Costs and Expenses in BRL
Iron Ore Fines Costs and Expenses in BRL
R$/t 1Q17 4Q16 1Q16
Costs¹ 46.1 47.8 47.5
Expenses¹ 2.7 7.5 12.2
Total 48.8 55.3 59.7
¹ Net of depreciation
11 After adjusting for the one-off effects.
29
Evolution of C1 Cash Cost¹ per ton in BRL
EXPENSES
Iron ore expenses, net of depreciation, amounted to US$ 55 million in 1Q17, 69.8% lower than
the US$ 182 million recorded in 4Q16. SG&A and other expenses totaled a positive amount of
US$ 2 million in 1Q17, mainly due to the recovery of the insurance associated with the
destruction of the “Fábrica Nova – Timbopeba” long distance belt conveyor (US$ 85 million).
After excluding this positive one-off effect, SG&A and Other expenses decreased by US$ 17
million. R&D amounted to US$ 16 million, decreasing by US$ 23 million vs. 4Q16, following the
regular seasonality of expenditures. Pre-operating and stoppage expenses, net of depreciation,
amounted to US$ 41 million, in line with 4Q16.
30
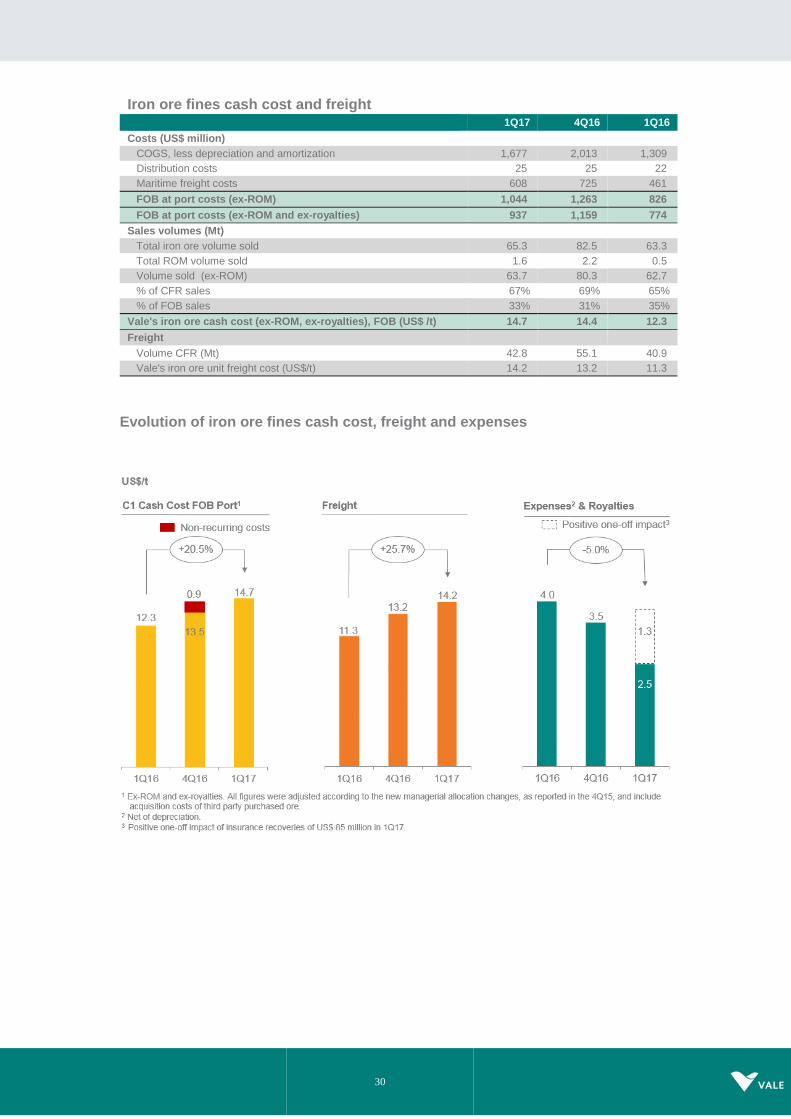
Iron ore fines cash cost and freight
1Q17 4Q16 1Q16
Costs (US$ million)
COGS, less depreciation and amortization 1,677 2,013 1,309
Distribution costs 25 25 22
Maritime freight costs 608 725 461
FOB at port costs (ex-ROM) 1,044 1,263 826
FOB at port costs (ex-ROM and ex-royalties) 937 1,159 774
Sales volumes (Mt)
Total iron ore volume sold 65.3 82.5 63.3
Total ROM volume sold 1.6 2.2 0.5
Volume sold (ex-ROM) 63.7 80.3 62.7
% of CFR sales 67% 69% 65%
% of FOB sales 33% 31% 35%
Vale's iron ore cash cost (ex-ROM, ex-royalties), FOB (US$ /t) 14.7 14.4 12.3
Freight
Volume CFR (Mt) 42.8 55.1 40.9
Vale's iron ore unit freight cost (US$/t) 14.2 13.2 11.3
Evolution of iron ore fines cash cost, freight and expenses
31
Evolution of iron ore fines sustaining per ton
Iron ore pellets
Adjusted EBITDA for pellets in 1Q17 was US$ 791 million, 26.6% higher than the US$ 625
million recorded in 4Q16. The increase of US$ 166 million was a result of higher sales prices
(US$ 292 million), which was partially offset by lower dividends received12 (US$ 43 million),
higher costs and expenses13 (US$ 43 million), exchange rate variations (US$ 19 million) and
lower volumes (US$ 22 million).
Net sales revenues for pellets amounted to US$ 1.459 billion in 1Q17, increasing US$ 244
million from the US$ 1.217 billion recorded in 4Q16 as a result of higher realized sales prices
(US$ 292 million), which increased from an average of US$ 92.3 per ton in 4Q16 to US$ 116.0
per ton in 1Q17, being partially offset by lower sales volumes (US$ 50 million), which decreased
from the 13.2 Mt recorded in 4Q16 to 12.6 Mt in 1Q17.
CFR pellet sales of 2.7 Mt in 1Q17 represented 22% of total pellet sales, being higher than the
16% recorded in 4Q16. FOB pellet sales decreased from the 11.0 Mt in 4Q16 to 10.0 Mt in
1Q17.
12 Dividends from leased pelletizing plants, which are usually paid every 6 months (in 2Q and 4Q). 13 After adjusting for the effects of lower volumes and exchange rate variations.

32
Pellet CFR/FOB prices increased by US$ 23.7/t to US$ 116.0/t in 1Q17, whereas the Platt’s
IODEX iron ore reference price (CFR China) increased by US$ 14.9/t in the quarter, mainly as
a result of the renewal of sales contracts with a higher pellet premium.
Pellet costs totaled US$ 652 million (or US$ 744 million with depreciation charges) in 1Q17.
After adjusting for the effects of lower volumes (-US$ 28 million) and exchange rate variations
(US$ 17 million), costs increased by US$ 69 million vs. 4Q16 mainly due to the higher leasing
costs of the pelletizing plants which are based on a predetermined formula linked to market
prices.
Pre-operating and stoppage expenses for pellets were US$ 1 million in 1Q17, US$ 4 million
lower than in 4Q16. SG&A and other expenses totaled US$ 12 million, decreasing US$ 18
when compared to 4Q16, mainly due to the write-down of inventory in 4Q16 (US$ 14 million).
EBITDA unit margin for pellets was US$ 62.8/t in 1Q17, 32.7% higher than in 4Q16 mainly due
to higher sales prices.
Pellets - EBITDA ex-Samarco 1Q17 4Q16
US$
million US$/wmt
US$ million
US$/wmt
Net Revenues / Realized Price 1,459 116.0 1,216 92.2
Dividends Received (Leased pelletizing plants) ex-Samarco - - 43 3.3
Cash Costs (Iron ore, leasing, freight, overhead, energy and other) (652) (51.8) (594) (45.0)
Expenses (SG&A, R&D and other) (16) (1.3) (40) (3.0)
EBITDA ex-Samarco 791 62.8 625 47.4
Iron ore fines and pellets cash break-even
Quarterly iron ore fines and pellets EBITDA break-even, measured by unit cash costs and
expenses on a landed-in-China basis (and adjusted for quality, pellets margins differential and
moisture, excluding ROM), remained in line when compared to 4Q16, totaling US$ 30.5/dmt in
1Q17, with the abovementioned increase in pellet premium and the one-off positive effect in
expenses offsetting the impacts of bunker oil, exchange rate variation and the reduced fixed-
costs dilution on seasonally lower production volumes.
Quarterly iron ore and pellets cash break-even on a landed-in-China basis, including sustaining
capex per ton of US$ 3.8/dmt, increased from US$ 33.7/dmt in 4Q16 to US$ 34.4/dmt in 1Q17.

33
Iron ore and pellets cash break-even landed in China¹
US$/t 1Q17 4Q16 1Q16
Vale's iron ore cash cost (ex-ROM, ex-royalties), FOB (US$ /t) 14.7 14.4 12.3
Iron ore fines freight cost (ex-bunker oil hedge) 14.2 13.2 11.3
Iron ore fines distribution cost 0.6 0.4 0.5
Iron ore fines expenses² & royalties 2.6 3.5 4.0
Iron ore fines moisture adjustment 2.9 2.7 2.5
Iron ore fines quality adjustment (2.4) (2.1) (1.5)
Iron ore fines EBITDA break-even (US$/dmt) 32.6 32.1 29.2
Iron ore fines pellet adjustment (2.1) (1.5) (1.2)
Iron ore fines and pellets EBITDA break-even (US$/dmt) 30.5 30.6 28.0
Iron ore fines sustaining investments 3.8 3.2 2.9
Iron ore fines and pellets cash break-even landed in China (US$/dmt) 34.4 33.7 30.9
¹ Measured by unit cost + expenses + sustaining investment adjusted for quality
² Net of depreciation
Quarterly iron ore and pellets cash break-even on a landed-in-China basis
Manganese and ferroalloys
Adjusted EBITDA of manganese ore and ferroalloys was US$ 37 million in 1Q17, US$ 8 million
lower than the US$ 45 million in 4Q16, mainly due to the impact of lower sales volumes (US$
29 million) and higher costs and expenses14 (US$ 4 million), which were partly offset by higher
realized prices (US$ 27 million).
14 After adjusting for the effects of lower volumes and exchange rates.
34
Net sales revenues for manganese ore decreased to US$ 43 million in 1Q17 from US$ 87
million in 4Q16 mainly due to lower sales volumes (US$ 54 million), which were partly offset by
higher sales prices (US$ 10 million) in 1Q17. Volumes sold of manganese ore reached 196,000
t in 1Q17 vs. 534,000 t in 4Q16.
Net sales revenues for ferroalloys increased to US$ 43 million in 1Q17 from the US$ 30 million
in 4Q16, mainly due to higher sales prices (US$ 17 million), which were partially offset by lower
sales volumes (US$ 4 million). Volumes sold of ferroalloys decreased to 30,000 t in 1Q17 from
the 35,000 t recorded in 4Q16.
Manganese ore and ferroalloys costs totaled US$ 44 million (or US$ 49 million with depreciation
charges) in 1Q17. Costs remained practically in line with 4Q16 after adjusting for the effect of
lower volumes (US$ 29 million) and the negative effect of exchange rate variations (US$ 3
million).
Market outlook – iron ore
1Q17 was positive for iron ore, as prices for the Platts IODEX 62% Fe material started the year
on the rise. By February, prices reached US$ 95.05/dmt, the highest level since August 2014,
supported by higher mill demand in China. In 1Q17, prices averaged US$ 85.64/dmt, also the
highest quarterly average since 3Q14, being 20.9% higher than in 4Q16.
In 1Q17 premiums for the higher grade iron ore relative to lower grades also improved The 65%
Fe Metal Bulletin Index averaged US$ 99.1/dmt, US$ 13.5/dmt higher than the average of the
62% Fe IODEX, and US$ 39/dmt higher than the 58% Fe Metal Bulletin Index. The increased
gap amongst different iron ore types is a result of productivity requirements by the Chinese
steel mills in times of high coking coal prices and signals an imbalance in the supply ratio of
high and low grade ores.
China’s steel demand remained strong in 1Q17, supported by an acceleration in its economic
activity. GDP in 1Q17 expanded 6.9%, up from 6.7% in 2016 and 6.8% in 4Q16, despite a slight
contraction in monetary policy. Fixed asset investments accelerated to 9.2% in 1Q17 year-on-
year, and the investment in the three major steel-consuming sectors - manufacturing,
infrastructure and property - all experienced a sound recovery in the quarter, reaching 5.8%,
23.5% and 9.1% respectively year-on-year. Although the property sector is now in a tightening
cycle, property sales have not decelerated much in 1Q17, increasing 19.5% year-on-year,
compared to 22.5% in 2016. The de-stocking efforts supported by government policies have
been showing positive results – by the end of 1Q17, unsold residential floor area was down
15% year-on-year.

35
On the back of a strong demand for steel, China’s steel production reached record highs in the
first quarter, up 4.6% year-on-year, an annualized output of 816Mt, which also boosted China’s
iron ore imports to 271Mt in 1Q17, a growth of 12.2% year-on-year.
The general picture of steel production elsewhere was also positive. According to WSA, crude
steel output reached 209.4 Mt in 1Q17, up 7% year-on-year. Monthly production records were
seen in different countries, such as Mexico, India, Pakistan and Vietnam.
For the remainder of the year, we believe that China’s implementation of the Belt and Road
projects, which are grounded in new investments in infrastructure, and its supply-side reform,
will not only benefit China’s steel industry, but also the global steel sector, being positive drivers
for iron ore demand.
Volume sold by destination – Iron ore and pellets
‘000 metric tons 1Q17 4Q16 1Q16
Americas 11,974 10,699 8,456
Brazil 10,100 8,679 6,653
Others 1,874 2,020 1,803
Asia 54,158 68,013 52,310
China 44,199 56,181 42,930
Japan 6,283 7,042 5,856
Others 3,676 4,790 3,524
Europe 8,971 12,619 11,488
Germany 3,988 5,839 4,791
France 936 1,851 1,410
Others 4,047 4,929 5,287
Middle East 1,901 2,795 1,699
Rest of the World 896 1,571 441
Total 77,900 95,697 74,394
Selected financial indicators - Ferrous minerals
US$ million 1Q17 4Q16 1Q16
Net Revenues 6,497 7,047 3,804
Costs¹ (2,449) (2,753) (1,851)
Expenses¹ (16) (141) (165)
Pre-operating and stoppage expenses¹ (45) (52) (39)
R&D expenses (20) (45) (11)
Dividends received - 53 -
Adjusted EBITDA 3,967 4,109 1,738
Depreciation and amortization (416) (489) (347)
Adjusted EBIT 3,551 3,567 1,391
Adjusted EBIT margin (%) 54.7 50.6 36.6
¹ Net of depreciation and amortization
Selected financial indicators - Iron ore fines
1Q17 4Q16 1Q16
Adjusted EBITDA (US$ million) 3,094 3,391 1,409
Volume Sold (Mt) 63.682 80.287 62.744
Adjusted EBITDA (US$/t) 48.59 42.24 22.46

36
Selected financial indicators - Pellets (excluding Samarco)
1Q17 4Q16 1Q16
Adjusted EBITDA (US$ million) 791 625 296
Volume Sold (Mt) 12.582 13.190 11.130
Adjusted EBITDA (US$/t) 62.87 47.38 26.59
Selected financial indicators - Iron ore fines and Pellets
1Q17 4Q16 1Q16
Adjusted EBITDA (US$ million) 3,885 4,016 1,705
Volume Sold (Mt) 76.264 93.477 73.874
Adjusted EBITDA (US$/t) 50.94 42.96 23.08
37
Base Metals
Adjusted EBITDA was US$ 410 million in 1Q17, decreasing US$ 133 million vs. 4Q16, mainly
as a result of planned lower volumes (US$ 82 million), higher costs15 (US$ 79 million), lower
nickel prices (US$ 21 million) and exchange rate variations (US$ 19 million), which were
partially offset by higher copper and cobalt prices (US$ 72 million) and lower expenses (US$
10 million).
SALES REVENUES AND VOLUMES
Nickel sales revenues were US$ 760 million in 1Q17, decreasing US$ 134 million vs. 4Q16 as
a result of the impact of seasonally lower volumes (US$ 113 million) and lower realized nickel
prices in 1Q17 (US$ 21 million). Sales volumes were 72 kt, a decrease of 11 kt when compared
to the previous quarter.
Copper sales revenues were US$ 568 million in 1Q17, decreasing US$ 17 million vs. 4Q16 as
a result of the impact of seasonally lower volumes (US$ 71 million), which was partially offset
by higher realized copper prices in 1Q17 (US$ 54 million). Sales volumes were 100 kt in 1Q17,
15 kt lower than in 4Q16.
PGMs (platinum group metals) sales revenues totaled US$ 85 million in 1Q17, increasing US$
33 million vs. 4Q16. Sales volumes were 104,000 oz in 1Q17 vs. 73,000 oz in 4Q16. PGMs
sales volumes increased, mainly due to higher production of platinum and palladium.
Sales revenues from gold contained as a by-product in our nickel and copper concentrates
amounted to US$ 130 million in 1Q17, decreasing by US$ 34 million vs. 4Q16 mainly as a result
of the impact of seasonally lower volumes (US$ 30 million). Sales volumes of gold as a by-
product amounted to 108,000 oz in 1Q17, 24,000 oz lower than in 4Q16.
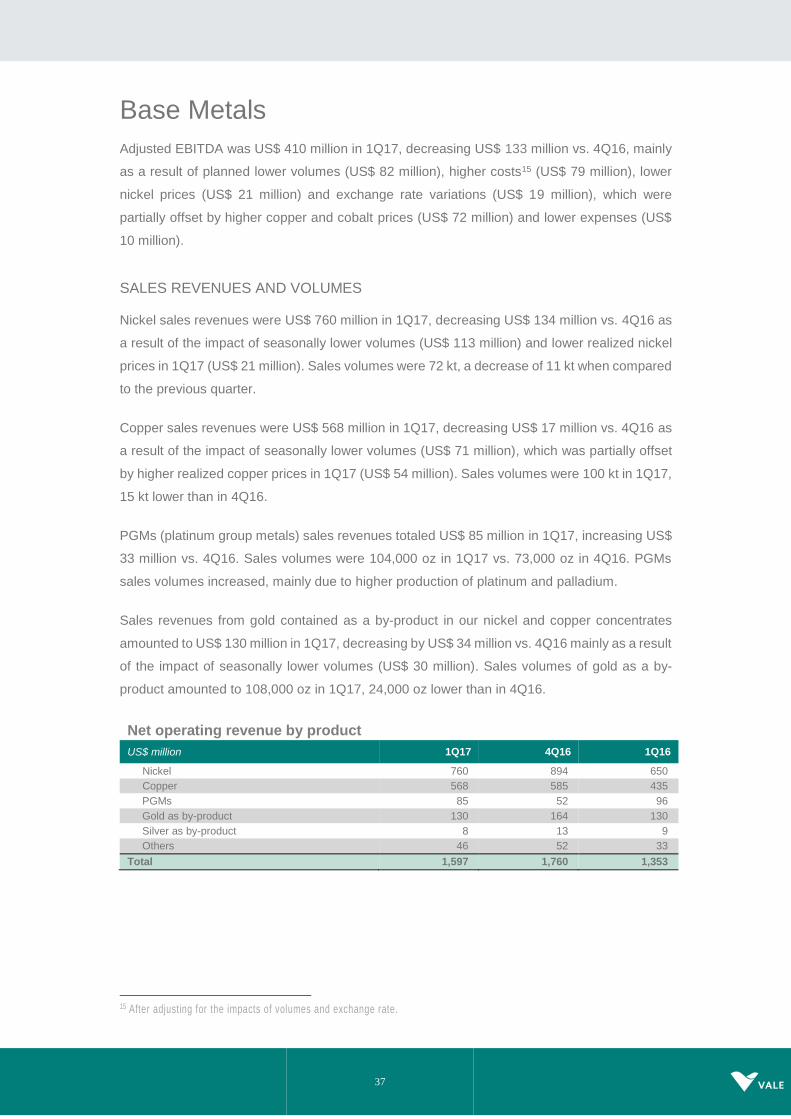
Net operating revenue by product US$ million 1Q17 4Q16 1Q16
Nickel 760 894 650
Copper 568 585 435
PGMs 85 52 96
Gold as by-product 130 164 130
Silver as by-product 8 13 9
Others 46 52 33
Total 1,597 1,760 1,353
15 After adjusting for the impacts of volumes and exchange rate.

38
REALIZED NICKEL PRICES
The realized nickel price was US$ 10,547/t, US$ 276/t higher than the average LME nickel
price of US$ 10,271/t in 1Q17.
Vale’s nickel products are divided into two categories, refined nickel (pellets, powder, cathode,
FeNi, Utility Nickel™ and Tonimet™) and intermediates (concentrates, matte, NiO and NHC).
Refined nickel products have higher nickel content, typically commanding a premium over the
average LME nickel price, whereas nickel intermediates are less pure as they are only partially
processed. Due to this difference, intermediate products are sold at a discount. The amount of
the discount will vary depending on the amount of processing still required, product forms and
level of impurities. The sales product mix is an important driver of nickel price realization.
Refined nickel sales accounted for 89% of total nickel sales in 1Q17. Sales of intermediate
products accounted for the balance.
The realized nickel price differed from the average LME price in 1Q17 due to the following
impacts:
Premium for refined finished nickel products averaged US$ 597/t, with an impact on
the aggregate realized nickel price of US$ 531/t;
Discount for intermediate nickel products averaged US$ 2,330/t, with an impact on the
aggregate realized nickel price of -US$ 255/t.
Price realization – nickel
39
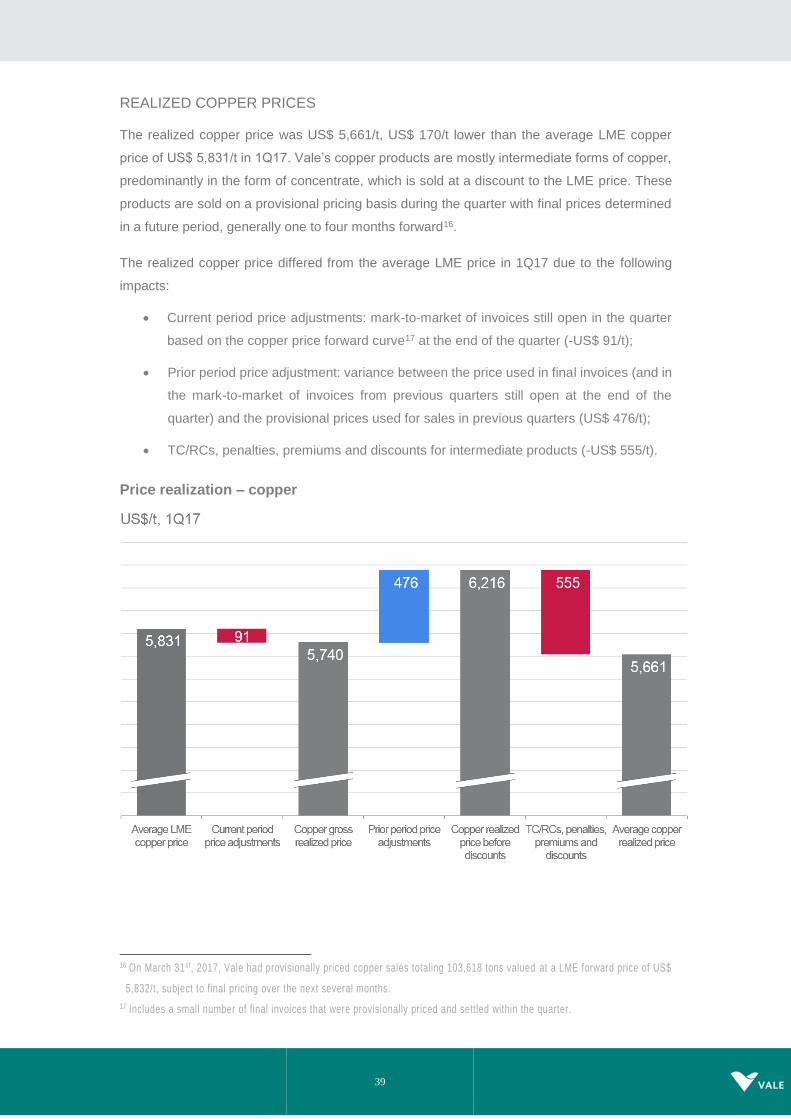
REALIZED COPPER PRICES
The realized copper price was US$ 5,661/t, US$ 170/t lower than the average LME copper
price of US$ 5,831/t in 1Q17. Vale’s copper products are mostly intermediate forms of copper,
predominantly in the form of concentrate, which is sold at a discount to the LME price. These
products are sold on a provisional pricing basis during the quarter with final prices determined
in a future period, generally one to four months forward16.
The realized copper price differed from the average LME price in 1Q17 due to the following
impacts:
Current period price adjustments: mark-to-market of invoices still open in the quarter
based on the copper price forward curve17 at the end of the quarter (-US$ 91/t);
Prior period price adjustment: variance between the price used in final invoices (and in
the mark-to-market of invoices from previous quarters still open at the end of the
quarter) and the provisional prices used for sales in previous quarters (US$ 476/t);
TC/RCs, penalties, premiums and discounts for intermediate products (-US$ 555/t).
Price realization – copper
16 On March 31st, 2017, Vale had provisionally priced copper sales totaling 103,618 tons valued at a LME forward price of US$
5,832/t, subject to final pricing over the next several months.
17 Includes a small number of final invoices that were provisionally priced and settled within the quarter.
40
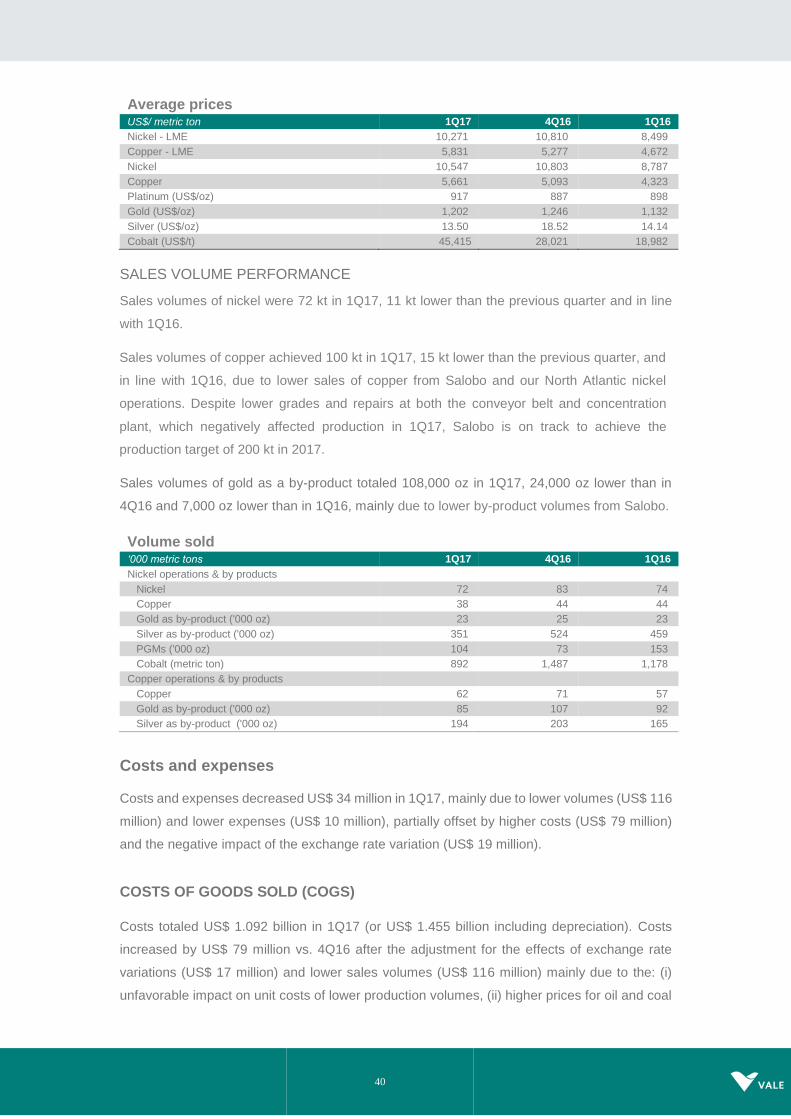
Average prices US$/ metric ton 1Q17 4Q16 1Q16
Nickel - LME 10,271 10,810 8,499
Copper - LME 5,831 5,277 4,672
Nickel 10,547 10,803 8,787
Copper 5,661 5,093 4,323
Platinum (US$/oz) 917 887 898
Gold (US$/oz) 1,202 1,246 1,132
Silver (US$/oz) 13.50 18.52 14.14
Cobalt (US$/t) 45,415 28,021 18,982
SALES VOLUME PERFORMANCE
Sales volumes of nickel were 72 kt in 1Q17, 11 kt lower than the previous quarter and in line
with 1Q16.
Sales volumes of copper achieved 100 kt in 1Q17, 15 kt lower than the previous quarter, and
in line with 1Q16, due to lower sales of copper from Salobo and our North Atlantic nickel
operations. Despite lower grades and repairs at both the conveyor belt and concentration
plant, which negatively affected production in 1Q17, Salobo is on track to achieve the
production target of 200 kt in 2017.
Sales volumes of gold as a by-product totaled 108,000 oz in 1Q17, 24,000 oz lower than in
4Q16 and 7,000 oz lower than in 1Q16, mainly due to lower by-product volumes from Salobo.
Volume sold ‘000 metric tons 1Q17 4Q16 1Q16
Nickel operations & by products
Nickel 72 83 74
Copper 38 44 44
Gold as by-product ('000 oz) 23 25 23
Silver as by-product ('000 oz) 351 524 459
PGMs ('000 oz) 104 73 153
Cobalt (metric ton) 892 1,487 1,178
Copper operations & by products
Copper 62 71 57
Gold as by-product ('000 oz) 85 107 92
Silver as by-product ('000 oz) 194 203 165
Costs and expenses
Costs and expenses decreased US$ 34 million in 1Q17, mainly due to lower volumes (US$ 116
million) and lower expenses (US$ 10 million), partially offset by higher costs (US$ 79 million)
and the negative impact of the exchange rate variation (US$ 19 million).
COSTS OF GOODS SOLD (COGS)
Costs totaled US$ 1.092 billion in 1Q17 (or US$ 1.455 billion including depreciation). Costs
increased by US$ 79 million vs. 4Q16 after the adjustment for the effects of exchange rate
variations (US$ 17 million) and lower sales volumes (US$ 116 million) mainly due to the: (i)
unfavorable impact on unit costs of lower production volumes, (ii) higher prices for oil and coal

41
and (iii) the one-off impact of a US$ 32 million cost normalization adjustment for the Thompson
operation as a result of certain operational issues experienced during the quarter including
deleterious elements in the smelter feed and a hot metal leak in the smelter.
Variance drivers
US$ million 4Q16 Volume Exchange
Rate Others
Total Variation 4Q16 x 1Q17
1Q17
Total costs before depreciation and amortization
1,112 (116) 17 79 (20) 1,092
Depreciation 386 (49) 7 19 (23) 363
Total 1,498 (165) 24 98 (43) 1,455
UNIT CASH COST
North Atlantic operations unit cash cost increased from the US$ 5,125/t recorded in 4Q16 to
US$ 6,699/t in 1Q17 mainly due to the one-off US$ 32 million cost normalization adjustment for
Thompson, accounting for US$ 770/t of the increase, as well as the unfavourable impact of
lower production volumes on unit costs.
PTVI unit cash cost increased from the US$ 5,770/t recorded in 4Q16 to US$ 6,821/t in 1Q17,
mainly due to the unfavorable impact of lower production volumes on unit costs, accounting for
approximately US$ 400/t of the increase, along with higher oil, coal and diesel prices, which
accounted for approximately US$ 700/t of the increase.
VNC unit cost net of by-product credits decreased slightly from the US$ 11,375/t recorded in
4Q16 to US$ 11,232/t in 1Q17, mainly due to the impact of higher cobalt by-product prices.
Onça Puma unit cost was in line with 4Q16.
Sossego unit cost decreased primarily due to the favorable impact of higher production on unit
costs as well as lower personnel and supplies expenses.
Salobo unit costs increased mainly due to higher expenses for services and supplies related to
maintenance work, higher energy costs and the unfavorable impact of lower production on unit
costs.

42
Base Metals – unit cash cost of sales per operation, net of by-product credits1
EXPENSES
SG&A and other expenses, excluding depreciation, totaled US$ 46 million, a decrease of US$
7 million when compared to the US$ 53 million in 4Q16.
Pre-operating and stoppage expenses, net of depreciation, totaled US$ 38 million, all related
to the ramp-up of the Long Harbour operation.
Performance by operation
The breakdown of the Base Metals EBITDA components per operation is detailed below.
Base Metals EBITDA overview – 1Q17
US$ million North
Atlantic PTVI Site
VNC Site
Sossego Salobo Onça Puma
Other1 Total Base
Metals
Net Revenues 860 144 91 152 313 51 (14) 1,597
Costs2 (630) (118) (118) (86) (144) (46) 50 (1,092)
SG&A and others (9) - (1) (3) - (3) (29) (46)
R&D (6) (2) (1) (2) - - - (11)
Pre-operating & stoppage
(38) - - - - - - (38)
EBITDA 177 24 (29) 61 169 2 6 410
Ni deliveries (kt) 41 17 8 - - 5 1 72
Cu deliveries (kt) 38 - - 24 38 - - 100 1 Includes the PTVI and VNC off - takes, intercompany sales, purchase of f inished nickel and corporate center expenses allocated for
base metals, SG&A and others. 2 Base Metals COGS currency exposure in 1Q17 was made up as follows: 46% in Canadian Dol lar, 21% in Brazilian Real, 20% in US
Dollar, 11% in Euro and 2% in Indonesian Rupiah.
EBITDA
Details of Base Metals’ adjusted EBITDA by operation are as follows:
US$ / t 1Q17 4Q164 1Q164
NICKEL
North Atlantic Operations (nickel)2 6,699 5,125 4,008
PTVI (nickel)2 6,821 5,770 6,636
VNC (nickel)3 11,232 11,375 13,691
Onça Puma (nickel) 9,341 9,204 8,064
COPPER
Sossego (copper) 2,941 3,207 2,692
Salobo (copper) 1,406 589 923
1 North Atlantic figures includes Clydach and Acton refining costs. 2 Prior periods restated to include royalties, freight and other period costs . 3 Unit cash cost of restated for periods prior to 1Q17 to exclude pre -operating and other operating expenses. 4 We real igned our uni t cash cost of sales methodology in 1Q17 to include all freight, royal ty and other costs reported as cost of goods sold and to exclude other operating expenses and pre -operating expenses for certain operations . Considering the previous cri teria, the uni t cash cost figures in prior periods would be: North Atlantic, US$ 3,412/t and US$ 3,218/t i n 4Q16 and 1Q16, respectively; PTVI, US$ 5,695/t and US$ 5,806/t in 4Q16 and 1Q16, respectively; VNC, US$ 11,017/t and US$ 12,711/t in 4Q16 and 1Q16, respectively.

43
(i) The North Atlantic operations EBITDA was US$ 177 million, decreasing by US$ 68
million vs. 4Q16 mainly due to: (i) lower revenues associated with lower volumes sold;
(ii) the unfavourable impact of lower production on unit costs; (iii) US$ 32 million cost
normalization for Thompson; and (iv) US$ 8 million higher pre-operating expense for
Long Harbour.
(ii) PTVI’s EBITDA was US$ 24 million, decreasing by US$ 25 million vs. 4Q16 mainly due
to higher costs (US$ 18 million) and lower volumes (US$ 11 million), partially offset by
lower expenses (US$ 4 million).
(iii) VNC's EBITDA was negative US$ 29 million, improving almost 10% when compared
to 4Q16, mainly as a result of higher cobalt prices (US$ 12 million), partially offset by
lower nickel prices (US$ 9 million).
(iv) Onça Puma’s EBITDA was US$ 2 million, decreasing US$ 5 million vs. 4Q16, mainly
as a result of the negative impact of exchange rate variations (US$ 3 million) and lower
volumes (US$ 2 million).
(v) Sossego’s EBITDA was US$ 61 million, increasing US$ 25 million vs. 4Q16 mainly as
a result of lower costs (US$ 16 million), lower expenses (US$ 11 million) and higher
copper prices (US$ 5 million), partially offset by exchange rate variations (US$ 5
million).
(vi) Salobo’s EBITDA was US$ 169 million, decreasing US$ 34 million vs. 4Q16, mainly as
a result of lower volumes (US$ 44 million), higher costs (US$ 20 million) and negative
exchange rate variations (US$ 7 million), partially offset by higher prices (US$ 35
million).
Base metals – EBITDA by operation
US$ million 1Q17 4Q16 1Q16
North Atlantic operation1, 3 177 245 191
PTVI 24 49 9
VNC (29) (32) (48)
Onça Puma 2 7 7
Sossego2 61 36 34
Salobo 169 203 131
Other2, 3 6 35 5
Total 410 543 329
1 Includes the operations in Canada and in the United Kingdom.
2 Includes the PTVI and VNC off - takes, intercompany sales, purchase of f inished nickel and corporate center al location for base metals.
3 Reflecting a realignment of our reporting for the North Atlantic operations and unit cash cost methodology for Q1, the EBITDA in
previous periods would change: North Atlantic would be US$ 298 mi ll ion and US$ 151 mill ion in 4Q16 and 1Q16, respectively; Others
would be US$ -18 mi ll ion and US$ 45 mil l ion in 4Q16 and 1Q16, respectively.
44
Market outlook – Base Metals
NICKEL
LME nickel prices retreated during 1Q17 to an average of US$ 10,271/t Ni, from US$ 10,810/t
Ni in 4Q16. The price decline can be attributed primarily to uncertainty surrounding export
volumes associated with the relaxation of the nickel ore export ban in Indonesia. Despite the
decrease in 1Q17 vs. 4Q16, the price of nickel increased 21% year-over-year.
Global stainless steel production continued to increase in 1Q17, rising approximately 11% vs.
the same period in 2016. Stainless steel production in China in 1Q17 was down approximately
7% vs. 4Q16, due to capacity closures during the fourth quarter and the slowdown associated
with the Spring Festival in China during 1Q17. Chinese stainless production increased 15% vs.
1Q16. Demand for nickel in non-stainless applications remained robust, particularly in the
automotive, battery and aerospace sectors.
Global refined nickel production was up approximately 1% in 1Q17 vs. 1Q16, with Chinese NPI
production increasing 21% over the same period. This increase comes as nickel ore imports
into China, which feed NPI production, were up by 34% in 2M17 vs. 2M16. Imports of FeNi into
China increased to 33 kt of contained Ni in 2M17 vs. 21 kt of contained Ni in 2M16, largely as
a result of the ramp-up of Indonesian nickel smelter production. Refined nickel imports into
China declined 56% in 2M17 vs. 2M16. This was due to increased NPI production, FeNi imports
and domestic inventory consumption.
Total exchange inventories continued to decline during the first quarter vs. 4Q16, with increases
in LME stocks (+6.2 kt) being outpaced by a decline in SHFE inventories (-10.4 kt). LME stocks
at the end of 1Q17 were 377.5 kt while SHFE inventories amounted to 83.5 kt, bringing total
exchange inventories to 461 kt by the end of the quarter.
On January 11th, 2017, the Indonesian government released a ministerial decree changing the
2009 Mining Law No. 4/2009, which stipulates a ban on the export of unprocessed and semi-
processed ores from the country. The ministerial decree allows for the controlled
recommencement of nickel ore exports from Indonesia, with 100% of input capacity being
allowed for export as “low-grade” ore (<1.7% Ni). The extra supply of Indonesian nickel ore
caused by this change is likely to put downward pressure on ore and nickel prices and may
have the unintended consequence of delaying investment in smelter development. On
February 2nd, 2017, the Philippine government announced the results of a country-wide mining
audit undertaken by the Department of Environment and Natural Resources (DENR) with over
half of the mines associated with Philippine nickel ore exports identified for potential closure.
However, mines identified for closure have been allowed to continue operating during the
appeals process. It is unclear how much ore could potentially be exported from Indonesia and,
likewise, it is uncertain if the Philippine mines will eventually be closed or only temporarily
45
suspended. Depending on Indonesian ore export volumes as well as Philippine mine closures,
if any, the deficit in 2017 is likely to be lower than previously expected and with that the
reduction in global inventories is also likely to slow down. As a result, price recovery is expected
to take longer than previously anticipated.
The long-term outlook for nickel continues to be positive. Capital investment for new projects
and replacement volumes are being deferred within the context of challenging economic
conditions that will widen future deficits given continued demand growth as global economies
stabilize. Furthermore, demand from the battery segment for electric vehicle manufacturing will
play an important role in demand growth over the coming years and is increasingly likely to
exceed expectations.
COPPER
LME copper prices continued to climb in 1Q17 as supply disruptions impacted the market. The
price reached a high of US$ 6,145/t Cu in mid-February, driven primarily by the commencement
of labor strikes at major copper mining operations in Chile and Peru as well as the stoppage of
copper concentrate exports from Indonesia. The average LME copper price increased 10.5%
in 1Q17 to US$ 5,831/t Cu from US$ 5,277/t Cu in 4Q16.
Global demand for refined copper remained subdued in 1Q17, partially due to the seasonal
slowdown associated with the Chinese New Year holiday. Nevertheless, copper consumption
in China was up by approximately 3% vs. 1Q16. Global demand also increased 2% in 1Q17
vs. 1Q16 as key copper consuming sectors including auto production and home appliances
remained strong in the first quarter.
On the supply side, global refined copper production was slightly down during the quarter driven
primarily by supply disruptions that began to impact the market in mid-February. Despite the
supply disruptions, copper concentrate imports into China increased approximately 2% in 2M17
vs. 2M16, reflecting demand associated with the ongoing expansion of smelter capacity in the
country. Meanwhile, refined copper imports declined 22% over the same period as higher
copper prices over the quarter drove more scrap into the market.
Chinese copper smelter spot TC/RCs have declined since the end of 2016 due to ongoing
tightness in the copper concentrate market, even as buying interest remained robust.
Shanghai and Comex inventories increased over the first quarter (160.8 kt and 55.1 kt,
respectively) while the LME declined by 31.1 kt. Total inventories increased by 184.8 kt across
all three exchanges over the course of 1Q17, totaling almost 742 kt Cu at the end of the quarter.
The market is expected to shift into balance in 2017 as demand for refined copper continues to
improve and supply growth levels off as projects and recent mine expansions complete theirs
ramp-up. However, recent mine supply disruptions related to ongoing labor strikes and

46
negotiations in Chile and Peru, as well as export issues in Indonesia, are likely to support prices
in the near term. Moving forward there remains some uncertainty regarding demand growth
levels in China during the second half of the year.
However, over the longer term the copper market is expected to improve as future supply is
constrained by declining ore grades and deferred capital investment.
Selected financial indicators - Base Metals US$ million 1Q17 4Q16 1Q16
Net Revenues 1,597 1,760 1,353
Costs¹ (1,092) (1,112) (956)
Expenses¹ (46) (57) (21)
Pre-operating and stoppage expenses¹ (38) (30) (32)
R&D expenses (11) (22) (15)
Dividends received - 4 -
Adjusted EBITDA 410 543 329
Depreciation and amortization (382) (410) (407)
Adjusted EBIT 28 129 (78)
Adjusted EBIT margin (%) 1.8 7.3 (5.8) 1 Net of depreciation and amortization.

47
Coal
EBITDA
Adjusted EBITDA for the Coal business segment was US$ 61 million in 1Q17, US$ 95 million
lower than the US$ 156 million recorded in 4Q16, mainly due to lower sales prices (US$ 104
million).
Adjusted EBITDA of coal shipped through the Nacala port totaled US$ 83 million in 1Q17, vs.
the US$ 163 million recorded in 4Q16, mainly due to lower prices, which were partially offset
by higher sales volumes and lower production costs18. The adjusted EBITDA of coal shipped
through the Beira port increased from the negative US$ 21 million to negative US$ 18 million
in 1Q17. The adjusted EBITDA from Australia was negative US$ 4 million in 1Q17, a reduction
of US$ 18 million from the US$ 14 million recorded in 4Q16, as a result of the divestment of
Carborough Downs in November 2016.
Despite the slightly negative EBITDA recorded in Australia in 1Q17, Vale Australia cash
balance was US$ 53 million as of March 31st, 2017, due to cash proceeds received from AMCI
as a result of the completion of the divestment transaction of Australian assets in 2016.
SALES REVENUES AND VOLUMES
Net sales revenues of metallurgical coal decreased to US$ 254 million in 1Q17 from US$ 300
million in 4Q16, as a result of lower sales prices (US$ 104 million), which were partially offset
by higher sales volumes (US$ 58 million). Net sales revenues of thermal coal decreased to
US$ 70 million in 1Q17 from US$ 76 million in 4Q16 as a result of lower sales volumes (US$ 6
million).
Sales volumes of metallurgical coal totaled 1.537 Mt in 1Q17, increasing 11.2% vs. 4Q16, as a
result of the ramp-up of Moatize II. Sales volumes of thermal coal totaled 1.031 Mt in 1Q17,
8.0% lower than in 4Q16, as a result of the increase in the metallurgical coal volume transported
through the Nacala Logistics Corridor with the continuing ramp-up of Moatize II. Thermal coal
inventories declined to the normal levels and the ratio of metallurgical to thermal coal sales
should stabilize going forward.
REALIZED PRICES
Coal sales are distributed across three pricing systems, namely the: (i) quarterly fixed
benchmark prices; (ii) index prices and (iii) fixed prices.
18 FOB cash cost at the Nacala port (mine, plant, railroad and port).

48
Quarterly fixed benchmark prices are used for pricing only metallurgical coal and are
determined based on negotiations between Australian coal producers and the main steel mills
in Japan, South Korea and Taiwan, usually prior to the beginning of the quarter. Once the
quarterly fixed benchmark price is agreed and announced to the market, other coal players
adopt it for pricing their coal trades.
Index prices are provided by several index providers, such as Platts, Global Coal, TSI and Metal
Bulletin, and used as price references considering product type (metallurgical or thermal) and
characteristics (low vs. mid volatile; hard vs. semi soft coking coal, high vs. low energy, among
others). A premium or discount is then applied over the index reference price depending on
Vale’s product quality.
Fixed prices are determined through negotiations based on product characteristics and quality.
Vale’s coal sales from Mozambique are mostly on a CFR basis with prices determined by
adding the specific freight differential to the Australia FOB index reference price.
The main coal products from the Moatize mine are the Chipanga hard coking coal (HCC), the
newly launched Moatize Low Volatile (MLV) HCC and the Moatize thermal coal.
Metallurgical coal
In 1Q17, metallurgical coal sales were priced as follows: (i) 6% based on the quarterly fixed
benchmark prices; (ii) 49% based on index lagged prices; and (iii) 46% based on fixed prices.
The increase of sales based on fixed prices was due to the large number of spot shipments in
the quarter and the increased number of trial cargoes of our new products.
The metallurgical coal realized price decreased 23.9% to US$ 165.2/t in 1Q17 from US$ 217.0/t
in 4Q16, following the premium low vol FOB Australia spot index, which decreased 36.8% to
US$ 168.2/t from US$ 266.2/t in 4Q16.
Metallurgical coal prices US$ / metric ton 1Q17 4Q16 1Q16
Premium Low Vol HCC index price 1 168.2 266.2 76.6
HCC benchmark price 285.0 200.0 81.0
Vale’s metallurgical coal realized price 165.2 217.0 75.9
1 Platts Premium Low Vol Hard Coking Coal FOB Australia.
Price realization in 1Q17 for metallurgical coal from Mozambique was impacted by:
Quality adjustment over the index reference price due to different product
characteristics and value in use adjustments associated with trial shipments of our new
premium and non-premium coking coal products, which negatively impacted prices in
1Q17 by US$ 8.1/t.

49
Sales not evenly spread across the quarter, which negatively impacted prices by US$
0.9/t.
Sales using lagged index prices which positively impacted prices in 1Q17 by US$ 9.1/t,
as index prices sharply decreased over 1Q17.
Sales using the quarterly benchmark pricing system which positively impacted prices
in 1Q17 by US$ 4.2/t mainly as a result of the gap between the quarterly benchmark
price and the average index price in 1Q17.
Freight differentials which positively impacted prices in 1Q17 by US$ 0.6/t, mainly due
to freight differentials between Vale’s freight rates contracted from Mozambique to the
delivery ports and the freight rates set in the sales contracts, which are determined
considering the delivery from the index reference port.
Other adjustments, including penalties and trial cargo incentives associated with the
new products or testing campaigns as part of the marketing development plans, which
negatively impacted prices in 1Q17 by US$ 7.9/t.
Price realization – Metallurgical coal from Mozambique
US$/t 1Q17
Thermal coal
In 1Q17, thermal coal sales were priced as follows: (i) 41% based on index prices and (ii) 59%
based on fixed prices (spot shipments).

50
The realized price of thermal coal was US$ 68.2/t in 1Q17, in line with 4Q16, despite the 3.3%
decrease in the thermal coal index.
Price realization in 1Q17 for thermal coal was impacted by:
Quality adjustment against the reference index given our lower calorific values and
higher ash levels, which negatively impacted prices by US$ 14.0/t.
Sales not evenly spread across the quarter, which positively impacted prices by US$
1.0/t
Lagged index and fixed pricing which positively impacted prices by US$ 0.9/t.
Freight differentials which negatively impacted prices in 1Q17 by US$ 0.1/t, mainly due
to freight differentials between Vale’s freight rates contracted from Mozambique to the
delivery ports and the freight rates set in the sales contracts, which are determined
considering the delivery from the index reference port
Other adjustments, mainly commercial premiums/discounts which negatively impacted
prices by US$ 2.0/t.
Price realization – Thermal coal from Mozambique
US$/t, 1Q17

51
COSTS AND EXPENSES
Coal costs and expenses, net of depreciation, totaled US$ 263 million in 1Q17, increasing US$
43 million against the US$ 220 million recorded in 4Q16. After adjusting for higher sales
volumes (US$ 7 million), costs and expenses increased by US$ 35 million mainly due to the
lower realization of the low cost impaired19 thermal coal inventory (US$ 56 million). This
negative impact was partially offset by the decrease in FOB production costs20.
MOZAMBIQUE PERFORMANCE
Adjusted EBITDA for the operations in Mozambique decreased to US$ 65 million from
the US$ 142 million in 4Q16. The decrease of US$ 77 million vs. 4Q16 was mainly
driven by the above-mentioned impact of lower prices, which were partially offset by
higher volumes.
Production at Moatize was 2.4 Mt in 1Q17, a quarterly production record, driven by
monthly production records in January (0.8 Mt) and March (0.9 Mt).
Production cost per ton of coal shipped through the Nacala port21 decreased 14% to
US$ 83.9/t in 1Q17 from US$ 97.8/t in 4Q16, due to the ramp-ups of Moatize II and the
Nacala Logistics Corridor (NCL), as well as the reestablishment of the supply of
explosives, which affected production in 4Q16.
Railed volume22 was 2.7 Mt in 1Q17, being 12.5% higher than the 2.4 Mt railed in 4Q16.
Shipped volume22 was 2.6 Mt in 1Q17, 24% higher than the 2.1 Mt shipped in 4Q16.
COAL MARKET OUTLOOK
The spot and quarterly benchmark coking coal prices followed different directions in 1Q17, with
spot prices following a downward trend, while the quarterly benchmark was set 42% higher
than in 4Q16. Coking coal spot prices averaged US$ 186.8/t in 1Q17, falling from the US$ 310/t
peaks of November 2016 (down 40%) due to the correction of short term supply issues seen in
4Q16, good weather conditions in Australia (apart from the very end of the quarter) and high
inventories in Asia and Europe. On the other hand, quarterly benchmark prices were set before
these effects could have been noticed, which led to an increase from US$ 200/t in 4Q16 to US$
19 Average costs of the inventories are monthly tested vs. the expected sales prices, leading to positive or negative variations
depending on previous impairments recorded.
20 FOB cash cost at the port (mine, plant, railroad and port).
21 FOB cash cost at the port (mine, plant, railroad and port). 22 Includes Sena-Beira and Nacala Logistics Corridor.
52
285/t in 1Q17. This created a very high average spread, about US$ 100/t, between spot and
quarterly benchmark prices in 1Q17.
Chinese domestic prices were much less volatile during 1Q17, but showed a more subtle
decline from US$ 220/t to US$ 190/t by the end of the quarter, creating new arbitrage positions
for Chinese traders. There is still some uncertainty around Chinese government policy on
domestic coal production and around the amount of coal that might be imported, which are key
drivers for the seaborne demand.
China's coal imports continued to rise. Coking coal imports totalled 10.6 Mt in Jan-Feb 2017,
an increase of nearly 68% vs. Jan-Feb 2016, increasing approximately 8% vs. 4Q16 as
arbitrage window was open and steel prices continued to support higher coking coal and coke
prices. India coking coal imports were 3.92 Mt in January 2017, reducing approximately 6% vs.
January 2016 as Indian buyers delayed their restocking amid a price decline trend and short-
term impact of the demonetization policy. In Germany, coking coal imports dropped 8% in 1Q17
vs. 4Q16 but increased 17% vs. 1Q16.
Australian supply was surprisingly flat year-on-year amid a weak cyclone season that allowed
producers to maximize production to capture high coking coal prices, while in the United States
coal producers managed to ship approximately 11 Mt in 1Q17, which would annualize 45 Mt at
the current pace.
At the end of 1Q17, Australian producers were hit by the tropical Cyclone “Debbie” coming at
the Queensland coastline near the Hay Point/Dalrymple Bay Coal Terminals. Market was
expecting spot coking coal prices to reverse their downward trend due to the extent of the
cyclone damage caused by the flooding across the Northern/Central and Southern Bowen
Basin logistics corridors and the timing required for resuming normal operational levels. At the
time of printing this report, quarterly benchmark prices were still not closed, renewing the
questions on how much longer will quarterly benchmark pricing be in the market place, and
whether Japanese FY17 will be the first year we see a major shift to index pricing, in particular
by the Japanese Steel Mills.
The API4 (RBCT) thermal coal index started and ended the quarter around US$ 80/t, however
it did surge to above US$ 90/t in mid January due to a rebound in the European market. This
rebound was partially due to a surge in power consumption amid lower temperatures and
supply tightness, followed by a fall to US$ 75/t in mid March as expectation on the resume
NDRC production controls did not materialize. The current rise seen at the end of the quarter
is following the sentiment of possible supply disruptions in Australia from Cyclone Debbie
(though in lesser extend when compared to metallurgical coal), and due to the arbitrage window
created as a result of the surge in Chinese domestic prices and coastal freight.

53
Thermal coal imports to China in Jan-Feb 2017 totaled 28 Mt, increasing 50% vs. Jan-Feb
2016. Chinese thermal generation jumped to a total of 728 TWh in Jan-Feb, increasing 7.3%
year-on-year, supported by heating season and positive economic growth. Turning to India,
domestic production in January totaled 55.99 Mt, 8% below its targeted output for the month,
despite Indian Government continued effort to increase internal sourcing from its state-owned
operations. January thermal coal imports of 8.88 Mt were down 33% year-on-year.
Looking ahead, uncertanties regarding Australian supply disruption from Cyclone Debbie are
likely to be shortlived once the true impact on operations is known. Thus, as soon as production
is back to usual levels in Queensland, less sentiment-based price volatility can be expected in
both coal markets.
Coal business performance
Net operating revenue by product US$ million 1Q17 4Q16 1Q16
Metallurgical coal 254 300 104
Thermal coal 70 76 50
Total 324 376 154
Average prices
US$/ metric ton 1Q17 4Q16 1Q16
Metallurgical coal 165.17 217.01 75.93
Thermal coal 68.16 67.67 38.57
Volume sold
US$/ metric ton 1Q17 4Q16 1Q16
Metallurgical coal 1,537 1,382 1,368
Thermal coal 1,031 1,121 1,299
Total 2,568 2,503 2,667
Selected financial indicators - Coal US$ million 1Q17 4Q16 1Q16
Net Revenues 324 376 154
Costs¹ (248) (185) (293)
Expenses¹ (12) (10) 49
Pre-operating and stoppage expenses¹ - (18) (1)
R&D expenses (3) (7) (2)
Adjusted EBITDA 61 156 (93)
Depreciation and amortization (105) (111) (23)
Adjusted EBIT (44) 45 (116)
Adjusted EBIT margin (%) (14) 12 (75)
¹ Net of depreciation and amortization
54
Financial indicators of non-consolidated companies
For selected financial indicators of the main non-consolidated companies, see our quarterly
financial statements on www.vale.com / investors / information to the market / financial
statements.
Conference call and webcast
Vale will host two conference calls and webcasts on Thursday, April 27th, 2017. The first, in
Portuguese (non-translated), will start at 10:00 a.m. Rio de Janeiro time. The second, in
English, will start at 12:00 p.m. Rio de Janeiro time (11:00 a.m. US Eastern Daylight Time and
4:00 p.m. British Standard Time)
Information on Dial-in to conference calls/webcasts:
In Portuguese:
Participants from Brazil: (55 11) 3193-1001 or (55 11) 2820-4001
Participants from the US: (1 888) 700-0802
Participants from other countries: (1 786) 924-6977
Access code: VALE
In English:
Participants from Brazil: (55 11) 3193-1001 or (55 11) 2820-4001
Participants from the U.S: (1 866) 262-4553
Participants from other countries: (1 412) 317-6029
Access code: VALE
Instructions for participation will be available on the website: www.vale.com/investors. A
podcast will be available on Vale’s Investor Relations website.
This press release may include statements that present Vale’s expectations about future events or results. Al l statements, when based upon
expectations about the future, involve various risks and uncertainties. Vale cannot guarantee that such statements will prove correct. These
risks and uncertainties include factors related to the following: (a) the countries where we operate, especially Brazil and Canada; (b) the global
economy; (c) the capital markets; (d) the mining and metals prices and their dependence on global industrial production, which is cyclical by
nature; and (e) global competition in the markets in which Vale operates. To obtain further information on factors that may lead to results
different from those forecast by Vale, please consult the reports Vale files with the U.S. Securities and Exchange Commission (SEC), the
Brazilian Comissão de Valores Mobiliários (CVM) and the French Autorité des Marchés Financiers (AMF), and in particular the factors discussed
under “Forward-Looking Statements” and “Risk Factors” in Vale’s annual report on Form 20-F.

55
ANNEX 1 – SIMPLIFIED FINANCIAL STATEMENTS Income statement US$ million 1Q17 4Q16 1Q16
Net operating revenue 8,515 9,265 5,335
Cost of goods sold (4,734) (5,103) (3,889)
Gross profit 3,781 4,162 1,446
Gross margin (%) 44.4 44.9 27.1
Selling, general and administrative expenses (124) (136) (107)
Research and development expenses (65) (112) (55)
Pre-operating and stoppage expenses (115) (129) (97)
Other operational expenses (77) (152) (36)
Results on measurement or sale of non-current assets
512 29 -
Impairment of non-current assets and onerous contracts
- (1,174) -
Operating profit 3,912 2,488 1,151
Financial revenues 64 52 57
Financial expenses (1,115) (762) (614)
Gains (losses) on derivatives, net 209 96 440
Monetary and exchange variation 229 11 1,528
Equity results in associates and joint ventures 73 (83) 155
Impairment and others results in associates and joint ventures
(61) (74) -
Income (loss) before taxes 3,311 1,728 2,717
Current tax (501) (125) (341)
Deferred tax (222) 67 (607)
Net Earnings (loss) from continuing operations 2,588 1,670 1,769
Loss attributable to noncontrolling interest (15) 33 1
Gain (loss) from discontinued operations (83) (1,178) 6
Net earnings (attributable to the Company's stockholders)
2,490 525 1,776
Earnings (loss) per share (attributable to the Company's stockholders - US$)
0.48 0.10 0.34
Diluted earnings (loss) per share (attributable to the Company's stockholders - US$)
0.48 0.10 0.34
Equity income (loss) by business segment US$ million 1Q17 % 4Q16 % 1Q16 %
Ferrous minerals 57 78 41 (49) 39 25
Coal 10 14 4 (5) (10) (6)
Base metals 1 1 - - (2) (1)
Steel (1) (1) (140) 169 111 72
Others 6 8 12 (14) 17 11
Total 73 100 (83) 100 155 100

56
Balance sheet US$ million 31/3/2017 31/12/2016 31/3/2016
Assets
Current assets 22,421 22,567 17,225
Cash and cash equivalents 6,716 4,262 3,782
Accounts receivable 3,237 3,663 2,553
Other financial assets 2,196 363 268
Inventories 3,641 3,349 3,801
Prepaid income taxes 73 159 625
Recoverable taxes 1,553 1,625 1,523
Others 486 557 582
Non-current assets held for sale and discontinued operation
4,519 8,589 4,091
Non-current assets 13,125 10,461 10,707
Judicial deposits 990 962 984
Other financial assets 3,379 628 364
Recoverable income taxes 538 527 517
Recoverable taxes 767 727 544
Deferred income taxes 7,127 7,343 7,675
Others 324 274 623
Fixed assets 67,462 65,986 67,340
Total assets 103,008 99,014 95,272
Liabilities
Current liabilities 11,825 11,232 11,399
Suppliers and contractors 3,647 3,630 3,147
Loans and borrowing 2,407 1,660 3,255
Other financial liabilities 1,358 1,086 2,361
Taxes payable 687 657 612
Provision for income taxes 120 171 167
Provisions 651 952 593
Dividends and interest on capital 821 798 -
Liabilities related to associates and joint ventures 284 292 -
Others 811 896 1,170
Liabilities directly associated with non-current assets held for sale and discontinued operations
1,039 1,090 94
Non-current liabilities 47,612 46,758 45,101
Loans and borrowing 27,163 27,662 28,215
Other financial liabilities 3,194 2,127 1,850
Taxes payable 5,098 4,961 4,502
Deferred income taxes 1,677 1,700 1,817
Provisions 5,938 5,748 5,778
Liabilities related to associates and joint ventures 787 785 -
Gold stream transaction 2,032 2,090 1,715
Others 1,723 1,685 1,572
Total liabilities 59,437 57,990 56,500
Stockholders' equity 43,571 41,024 38,772
Total liabilities and stockholders' equity 103,008 99,014 95,272
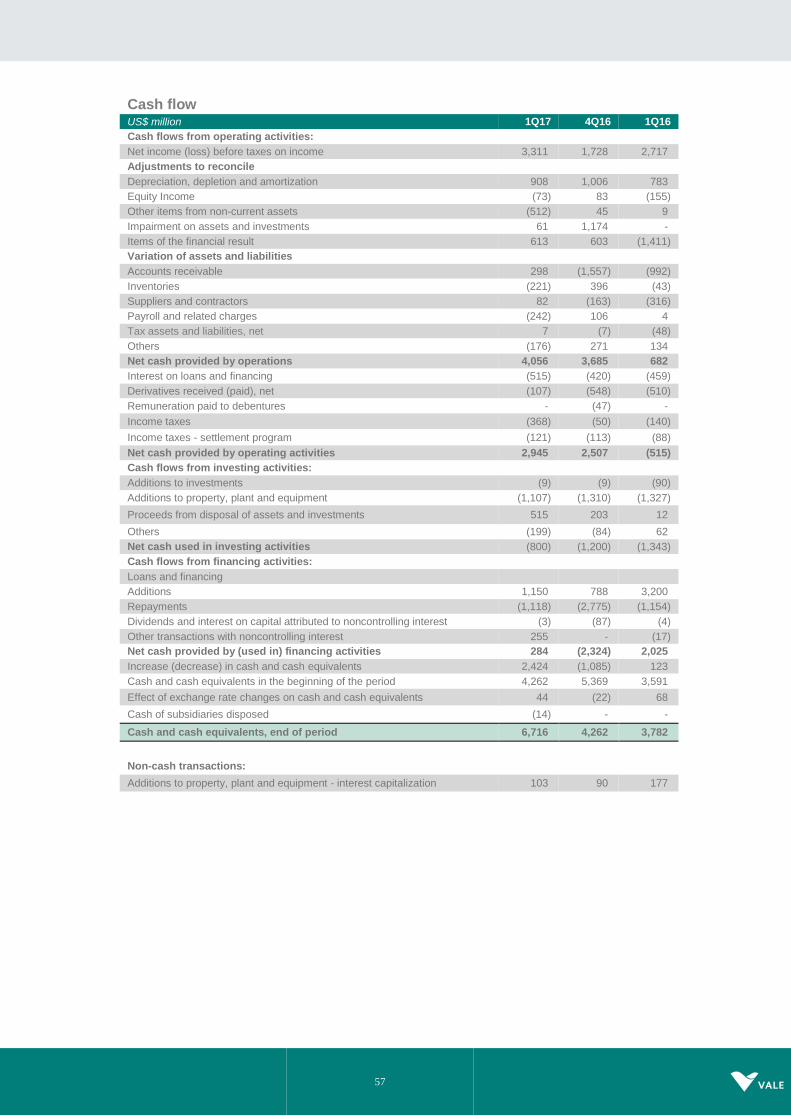
57
Cash flow US$ million 1Q17 4Q16 1Q16
Cash flows from operating activities:
Net income (loss) before taxes on income 3,311 1,728 2,717
Adjustments to reconcile
Depreciation, depletion and amortization 908 1,006 783
Equity Income (73) 83 (155)
Other items from non-current assets (512) 45 9
Impairment on assets and investments 61 1,174 -
Items of the financial result 613 603 (1,411)
Variation of assets and liabilities
Accounts receivable 298 (1,557) (992)
Inventories (221) 396 (43)
Suppliers and contractors 82 (163) (316)
Payroll and related charges (242) 106 4
Tax assets and liabilities, net 7 (7) (48)
Others (176) 271 134
Net cash provided by operations 4,056 3,685 682
Interest on loans and financing (515) (420) (459)
Derivatives received (paid), net (107) (548) (510)
Remuneration paid to debentures - (47) -
Income taxes (368) (50) (140)
Income taxes - settlement program (121) (113) (88)
Net cash provided by operating activities 2,945 2,507 (515)
Cash flows from investing activities:
Additions to investments (9) (9) (90)
Additions to property, plant and equipment (1,107) (1,310) (1,327)
Proceeds from disposal of assets and investments 515 203 12
Others (199) (84) 62
Net cash used in investing activities (800) (1,200) (1,343)
Cash flows from financing activities:
Loans and financing
Additions 1,150 788 3,200
Repayments (1,118) (2,775) (1,154)
Dividends and interest on capital attributed to noncontrolling interest (3) (87) (4)
Other transactions with noncontrolling interest 255 - (17)
Net cash provided by (used in) financing activities 284 (2,324) 2,025
Increase (decrease) in cash and cash equivalents 2,424 (1,085) 123
Cash and cash equivalents in the beginning of the period 4,262 5,369 3,591
Effect of exchange rate changes on cash and cash equivalents 44 (22) 68
Cash of subsidiaries disposed (14) - -
Cash and cash equivalents, end of period 6,716 4,262 3,782
Non-cash transactions:
Additions to property, plant and equipment - interest capitalization 103 90 177
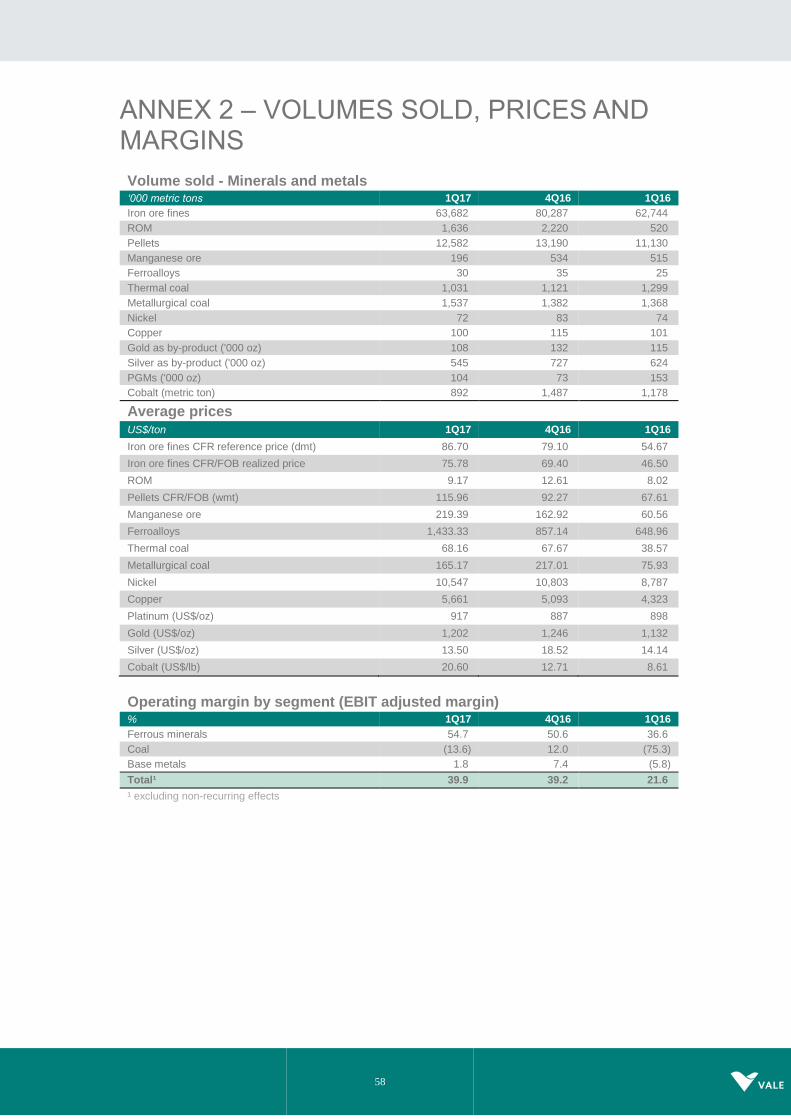
58
ANNEX 2 – VOLUMES SOLD, PRICES AND MARGINS
Volume sold - Minerals and metals
‘000 metric tons 1Q17 4Q16 1Q16
Iron ore fines 63,682 80,287 62,744
ROM 1,636 2,220 520
Pellets 12,582 13,190 11,130
Manganese ore 196 534 515
Ferroalloys 30 35 25
Thermal coal 1,031 1,121 1,299
Metallurgical coal 1,537 1,382 1,368
Nickel 72 83 74
Copper 100 115 101
Gold as by-product ('000 oz) 108 132 115
Silver as by-product ('000 oz) 545 727 624
PGMs ('000 oz) 104 73 153
Cobalt (metric ton) 892 1,487 1,178
Average prices US$/ton 1Q17 4Q16 1Q16
Iron ore fines CFR reference price (dmt) 86.70 79.10 54.67
Iron ore fines CFR/FOB realized price 75.78 69.40 46.50
ROM 9.17 12.61 8.02
Pellets CFR/FOB (wmt) 115.96 92.27 67.61
Manganese ore 219.39 162.92 60.56
Ferroalloys 1,433.33 857.14 648.96
Thermal coal 68.16 67.67 38.57
Metallurgical coal 165.17 217.01 75.93
Nickel 10,547 10,803 8,787
Copper 5,661 5,093 4,323
Platinum (US$/oz) 917 887 898
Gold (US$/oz) 1,202 1,246 1,132
Silver (US$/oz) 13.50 18.52 14.14
Cobalt (US$/lb) 20.60 12.71 8.61
Operating margin by segment (EBIT adjusted margin) % 1Q17 4Q16 1Q16
Ferrous minerals 54.7 50.6 36.6
Coal (13.6) 12.0 (75.3)
Base metals 1.8 7.4 (5.8)
Total¹ 39.9 39.2 21.6
¹ excluding non-recurring effects
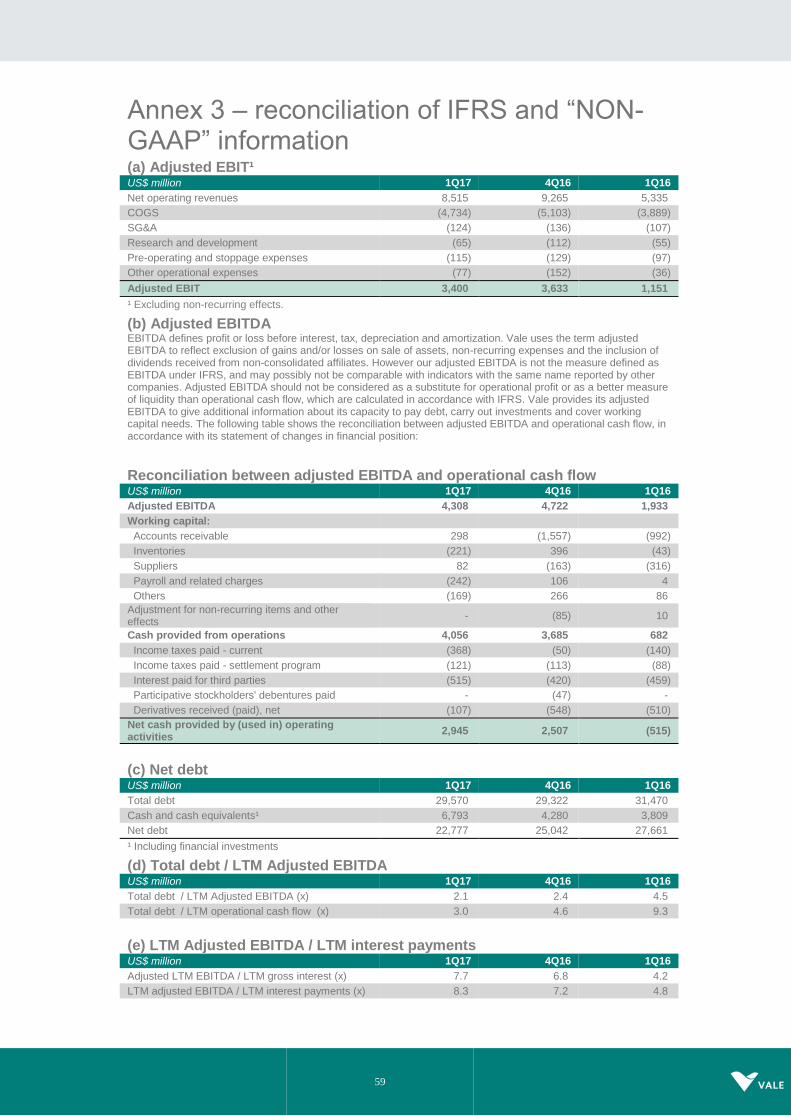
59
Annex 3 – reconciliation of IFRS and “NON-GAAP” information (a) Adjusted EBIT¹ US$ million 1Q17 4Q16 1Q16
Net operating revenues 8,515 9,265 5,335
COGS (4,734) (5,103) (3,889)
SG&A (124) (136) (107)
Research and development (65) (112) (55)
Pre-operating and stoppage expenses (115) (129) (97)
Other operational expenses (77) (152) (36)
Adjusted EBIT 3,400 3,633 1,151
¹ Excluding non-recurring effects.
(b) Adjusted EBITDA
EBITDA defines profit or loss before interest, tax, depreciation and amortization. Vale uses the term adjusted EBITDA to reflect exclusion of gains and/or losses on sale of assets, non-recurring expenses and the inclusion of dividends received from non-consolidated affiliates. However our adjusted EBITDA is not the measure defined as EBITDA under IFRS, and may possibly not be comparable with indicators with the same name reported by other companies. Adjusted EBITDA should not be considered as a substitute for operational profit or as a better measure of liquidity than operational cash flow, which are calculated in accordance with IFRS. Vale provides its adjusted EBITDA to give additional information about its capacity to pay debt, carry out investments and cover working capital needs. The following table shows the reconciliation between adjusted EBITDA and operational cash flow, in accordance with its statement of changes in financial position:
Reconciliation between adjusted EBITDA and operational cash flow
US$ million 1Q17 4Q16 1Q16
Adjusted EBITDA 4,308 4,722 1,933
Working capital:
Accounts receivable 298 (1,557) (992)
Inventories (221) 396 (43)
Suppliers 82 (163) (316)
Payroll and related charges (242) 106 4
Others (169) 266 86
Adjustment for non-recurring items and other effects
- (85) 10
Cash provided from operations 4,056 3,685 682
Income taxes paid - current (368) (50) (140)
Income taxes paid - settlement program (121) (113) (88)
Interest paid for third parties (515) (420) (459)
Participative stockholders' debentures paid - (47) -
Derivatives received (paid), net (107) (548) (510)
Net cash provided by (used in) operating activities
2,945 2,507 (515)
(c) Net debt US$ million 1Q17 4Q16 1Q16
Total debt 29,570 29,322 31,470
Cash and cash equivalents¹ 6,793 4,280 3,809
Net debt 22,777 25,042 27,661
¹ Including financial investments
(d) Total debt / LTM Adjusted EBITDA
US$ million 1Q17 4Q16 1Q16
Total debt / LTM Adjusted EBITDA (x) 2.1 2.4 4.5
Total debt / LTM operational cash flow (x) 3.0 4.6 9.3
(e) LTM Adjusted EBITDA / LTM interest payments
US$ million 1Q17 4Q16 1Q16
Adjusted LTM EBITDA / LTM gross interest (x) 7.7 6.8 4.2
LTM adjusted EBITDA / LTM interest payments (x) 8.3 7.2 4.8


