vale’s performance in 2015 vale’s performance in 2015 rio de janeiro, february 25, 2016 – vale...
TRANSCRIPT

VALE’S PERFORMANCE
IN 2015

www.vale.com
Tel.: (55 21) 3814-4540
Investor Relations Department
Rogério T. Nogueira
André Figueiredo
Carla Albano Miller
Fernando Mascarenhas
Andrea Gutman
Bruno Siqueira
Claudia Rodrigues
Mariano Szachtman
Renata Capanema
BM&F BOVESPA: VALE3, VALE5
NYSE: VALE, VALE.P
HKEx: 6210, 6230
EURONEXT PARIS: VALE3, VALE5
LATIBEX: XVALO, XVALP
Except where otherwise indicated the operational and financial information in this release is based o n the consolidated
figures in accordance with IFRS and, with the exception of information on investments and behavior of markets, quarterly
financial statements are reviewed by the company’s independent auditors. The main subsidiaries that are consolidated are
the following: Compañia Minera Miski Mayo S.A.C., Mineração Corumbaense Reunida S.A., PT Vale Indonesia Tbk (formerly
International Nickel Indonesia Tbk), Salobo Metais S.A, Vale Australia Pty Ltd., Vale International Holdings GMBH, Vale
Canada Limited (formely Vale Inco Limited), Vale Fertilizantes S.A., Vale International S.A., Vale Manganês S.A., Vale
Moçambique S.A., Vale Nouvelle-Calédonie SAS, Vale Oman Pelletizing Company LLC and Vale Shipping Holding PTE Ltd.

3
Vale’s performance in 2015
Rio de Janeiro, February 25, 2016 – Vale S.A. (Vale) delivered a sound operational
performance, achieving several annual production records in 2015, such as: (i) iron ore
annual supply of 345.9 Mt; (ii) Carajás production of 129.6 Mt; and (iii) nickel production of
291,000 t; (iv) copper production of 423,800 t.
Gross revenues totaled US$ 26.047 billion in 2015, decreasing US$ 12.189 billion vs. 2014
as a result of lower prices of iron ore fines (US$ 8.614 billion), pellets (US$ 2.030 billion),
nickel (US$ 1.394 billion) and others, partly offset by higher sales volumes (US$ 2.060
billion).
Quarterly gross revenues totaled US$ 5.986 billion in 4Q15, decreasing US$ 632 million vs.
3Q15, as a result of lower prices of iron ore fines (US$ 739 million), nickel (US$ 112 million)
and others, partly offset by higher sales volumes (US$ 325 million).
Costs and expenses, net of depreciation charges, totaled US$ 18.846 billion in 2015,
decreasing US$ 5.908 billion vs. 2014. Costs decreased US$ 4.223 billion (20%), SG&A and
other expenses decreased US$ 1.260 billion (65%), R&D decreased US$ 257 million (35%)
and pre-operating and stoppage expenses decreased US$ 168 million (19%) in 2015 vs.
2014.
Quarterly costs and expenses, net of depreciation charges, totaled US$ 4.595 billion in 4Q15,
practically in line with the US$ 4.649 billion recorded in 3Q15. Costs increased US$ 65 million
(2%), mainly due to the sales volume increase in the Ferrous Minerals and the Base Metals
business segments. SG&A and other expenses decreased US$ 105 million (63%), mainly due
to the positive one-off effect of the adjustment in Asset Retirement Obligations1 (ARO)
recorded in 4Q15. R&D decreased US$ 2 million (2%) and pre-operating and stoppage
expenses decreased US$ 12 million (7%) in 4Q15 vs. 3Q15.
C1 cash cost FOB port per metric ton for iron ore fines ex-royalties reached the lowest mark
in the iron ore industry at US$ 11.9/t in 4Q15 vs. US$ 12.7/t in 3Q15. The reduction in C1
cash cost was mainly driven by the BRL depreciation and by the ongoing cost reduction
initiatives.
Adjusted EBITDA was US$ 7.081 billion in 2015, 47% lower than in 2014 mainly as a result of
lower sales prices which impacted EBITDA negatively by US$ 14.005 billion. Higher sales
volumes and lower costs and expenses partly offset the EBITDA impact of lower prices by
US$ 1.237 billion and US$ 6.746 billion, respectively. Adjusted EBITDA margin was 27.7% in
2015.
1 Provision for mine and other assets closures

4
Quarterly adjusted EBITDA was US$ 1.391 billion in 4Q15, 26% lower than in 3Q15 mainly as
a result of lower sales prices which impacted EBITDA negatively by US$ 943 million. Higher
sales volumes and lower costs2 and expenses partly offset the EBITDA impact of lower prices
by US$ 57 million and US$ 334 million, respectively. Adjusted EBITDA margin was 23.6% in
4Q15.
Quarterly adjusted EBITDA was positively impacted by the above-mentioned effect of the
adjustment in ARO (US$ 331 million) and negatively impacted by decisions and/or events
from previous quarters, with effects in 4Q15, such as: (i) bunker oil hedge accounting
program for iron fines (US$ 134 million); (ii) provisional copper price adjustments (US$ 60
million); (iii) provisional manganese ore price adjustments (US$ 28 million); and (iv) the write-
off of materials inventories in Base Metals (US$ 31 million).
Capital expenditures totaled US$ 2.193 billion in 4Q15 and US$ 8.401 billion in 2015,
decreasing US$ 3.578 billion vs. 2014. Investments in project execution totaled US$ 1.366
billion and US$ 5.548 billion in 4Q15 and in 2015, respectively. Sustaining capex totaled US$
827 million and US$ 2.853 billion in 4Q15 and in 2015, respectively. Total annual capex
exceeded the previous guidance by US$ 0.2 billion as a result of a better than expected
execution of the S11D project and its associated logistics.
Asset sales totaled US$ 3.525 billion in 2015, with US$ 1.316 billion coming from the sale of
12 very large ore carriers to Chinese shipowners, US$ 1.089 billion coming from the sale of
36.4% of MBR preferred shares, US$ 900 million from another goldstream transaction and
US$ 97 million from the sale of energy assets. In 4Q15, Vale sold four very large ore carriers
of 400,000 tons deadweight to ICBC Financial Leasing. The transaction totaled US$ 423
million.
Net loss totaled US$ 12.129 billion in 2015 vs. a net income of US$ 657 million in 2014. The
US$ 12.786 billion decrease in income was mostly driven by higher impairment charges
recorded in 2015 vs. 2014 and the effect on financial results of the 47% end to end
depreciation of the BRL against the USD in 2015. Underlying earnings were negative US$
1.698 billion in 2015, against positive US$ 4.419 billion in 2014.
Impairments on assets and on investments3 and the recognition of onerous contracts totaled
US$ 9.372 billion in 2015. The increase of US$ 8.189 billion vs. 2014 was mainly due to the
significant reduction in the price assumptions used for the impairment tests.
Quarterly net loss totaled US$ 8.569 billion in 4Q15 compared to a net loss of US$ 2.117
billion in 3Q15. The US$ 6.452 billion decrease was mostly driven by impairments, which
2 Net effect on costs after adjusting for higher volumes .
3 Of associates and joint ventures.

5
were partly offset mainly by the effect on financial results of monetary and foreign exchange
variation gains. Underlying earnings were negative US$ 1.032 billion in 4Q15, against
negative US$ 961 million in 3Q15.
Gross debt totaled US$ 28.853 billion as of December 31, 2015, slightly higher than the US$
28.675 billion as of September 30, 2015, but in line with the US$ 28.807 billion registered as
of December 31, 2014. After the dividends payment of US$ 1.5 billion in 2015, net debt
totaled US$ 25.234 billion vs. US$ 24.685 billion as of December 31, 2014 and US$ 24.213
billion as of September 30, 2015, with a cash balance of US$ 3.619 billion. Average debt
maturity was 8.1 years with an average cost of debt of 4.47% per annum.
EBITDA from the Ferrous Minerals business segment decreased 15% in 4Q15 driven by
lower realized prices despite higher volumes and reductions in costs and expenses
Adjusted EBITDA of the Ferrous Minerals business segment was US$ 5.899 billion in
2015, 47.9% lower than in 2014, mainly as result of lower sales prices (-US$ 11.414
billion), which were partially offset by real competitiveness gains of US$ 3.477 billion
such as: (i) marketing and commercial initiatives (US$ 680 million); (ii) higher sales
volumes (US$ 1.599 billion); (iii) favorable renegotiations of chartering freight
contracts (US$ 300 million); and (iv) the ongoing cost reduction initiatives (US$ 898
million).
Adjusted EBITDA for Ferrous Minerals in 4Q15 was US$ 1.409 billion, US$ 243
million lower than the US$ 1.652 billion achieved in 3Q15, mainly as a result of lower
realized sales prices (US$ 782 million), which were partially offset by higher sales
volumes (US$ 62 million), lower expenses4 (US$ 245 million) and lower costs
5 (US$
188 million).
Adjusted EBITDA will no longer be impacted by Vale’s hedge accounting program
since all outstanding bunker oil exposure recorded under this program was settled in
4Q15. Vale’s hedge accounting program for iron ore fines had a negative impact of
US$ 134 million in 4Q15 and US$ 412 million in 2015.
Cash flow, measured as adjusted EBITDA6 less sustaining and growth capex, was
US$ 363 million in 4Q15.
CFR dmt reference price for iron ore fines (ex-ROM) decreased US$ 10.9/t from US$
56.0/t in 3Q15 to US$ 45.1/t in 4Q15 whereas CFR/FOB wmt price for iron ore fines
4 The reduction in expenses is mainly driven by the positive one -off effect of the adjustment in Asset Retirement Obligations
(ARO).
5 Net effect on costs, after adjusting for volume.
6 Excluding the positive one off effect of the Asset Retirement Obligations (ARO).
6
(ex-ROM) decreased US$ 9.3/t from US$ 46.5/t per metric ton in 3Q15 to US$ 37.2/t
in 4Q15 after adjusting for moisture and the effect of the lower FOB sales prices on
32% of the total sales volumes.
Product quality measured by Fe content improved from 63.5% in 3Q15 to 63.7% in
4Q15 mostly due to the ramp-up of the N4WS and N5S mines and of the Itabirites
projects.
Unit freight cost per iron ore metric ton, excluding the impact of hedge accounting,
was US$ 14.1/t in 4Q15, US$ 2.3/t lower than the US$ 16.4/t recorded in 3Q15.
Unit cash costs and expenses for iron ore fines landed in China (and adjusted for
quality and moisture and excluding the positive one-off effect of the ARO adjustment)
decreased from US$ 34.2/t in 3Q15 to US$ 32.0/t in 4Q15 on a dry metric ton (dmt)
basis.
Sustaining capex for iron ore fines totaled US$ 178 million (US$ 2.3/ wmt) in 4Q15,
US$ 0.8/ wmt lower than in 3Q15.
Physical progress reached 80% at the S11D mine and plant, 57% at the railway and
port, and 81% on the railway spur.
EBITDA from the Base Metals business segment decreased with lower nickel and
copper prices
Sales revenues totaled US$ 1.458 billion in 4Q15, US$ 103 million higher than in
3Q15 mainly due to higher volumes that were partially offset by lower LME nickel and
copper prices.
Realized prices were negatively impacted by US$ 60 million in provisional copper
price adjustments.
Adjusted EBITDA was US$ 111 million in 4Q15, US$ 82 million lower than in 3Q15,
mainly as a result of: (i) lower prices (US$ 158 million), including the above-
mentioned negative impact in provisional copper price adjustments; and (ii) the
negative impact of the write-off of materials inventories in 4Q15 (US$ 31 million).
Adjusted EBITDA was impacted by VNC’s negative EBITDA of US$ 107 million in
4Q15.
Salobo´s EBITDA remained in line with 3Q15´s EBITDA at US$ 75 million despite
weaker copper prices as production reached a quarterly record of 42,000 t in 4Q15.

7
Salobo is expected to reach its full production capacity in 2H16 as rain decreases and
higher grade mine faces are accessed.
EBITDA from the Coal business segment decreased as a result of one-off effects on
costs and lower prices
Adjusted EBITDA was negative US$ 149 million in 4Q15, compared to negative US$
129 million in 3Q15, mainly driven by lower prices and higher costs in Australia.
Costs in Mozambique in 4Q15 were in line with 3Q15, after adjusting for the effects of
higher volumes whereas costs in Australia increased in 4Q15 due to the write-down
of mine development expenses.
Moatize II reached 99% physical progress with a capital expenditure of US$ 196
million while the Nacala Logistics Corridor (NLC) reached 97% physical progress with
capital expenditures of US$ 259 million in 4Q15.
EBITDA from the Fertilizers business segment improved in 2015 mainly driven by lower
costs and expenses
Adjusted EBITDA for the Fertilizer business segment increased to US$ 567 million in
2015 from US$ 278 million in 2014 with an increase of US$ 289 million mainly driven
by exchange rates and commercial and cost savings initiatives.
Adjusted EBITDA for the Fertilizer business segment decreased to US$ 117 million in
4Q15 from US$ 197 million in 3Q15, mainly driven by lower sales volumes (US$ 86
million) as a result of the usual market seasonality.
In 2015 we successfully reduced our costs and expenses, progressed with the
implementation of our critical projects and advanced with our divestment process while
maintaining our gross debt position.
Despite all our efforts, our accomplishments in 2015 were overshadowed by Samarco’s
tailings dam failure in the beginning of November. We have been working diligently with
Samarco since the beginning and will remain fully committed to supporting the people and the
environment of the affected regions.
We acknowledge the additional challenges brought by the declining commodity prices and the
consequent impact on our cash flow generation. Nonetheless we remain confident in our
ability to move through these more difficult times, by maintaining operating discipline and the
courage to implement the required strategic actions.

8
Selected financial indicators
US$ million 2015 2014 2013 2012 2011
Gross operating revenues 26,047 38,236 47,486 48,753 62,345
Net operating revenues 25,609 37,539 46,767 47,694 60,946
Adjusted EBIT 2,734 8,497 17,576 14,430 28,748
Adjusted EBIT margin (%) 10.7 22.6 37.6 30.3 47.2
Adjusted EBITDA 7,081 13,353 22,560 19,178 33,730
Adjusted EBITDA margin (%) 27.7 35.6 48.2 40.2 55.3
Net income (loss) (12,129) 657 585 5,197 22,652
Underlying earnings (1,698) 4,419 12,269 10,365 23,015
Underlying earnings per share on a fully diluted basis (US$ / share)
(0.33) 0.86 2.38 2.03 4.39
Total gross debt 28,853 28,807 29,655 30,546 23,143
Cash and cash equivalent 3,619 4,122 5,324 6,078 3,531
Total Net Debt 25,234 24,685 24,331 24,468 19,612
Total gross debt/ adjusted EBITDA (x) 4.1 2.2 1.3 1.6 0.7
Capital expenditures 8,401 11,979 14,233 16,196 16,252
US$ million 4Q15 3Q15 4Q14
Gross operating revenues 5,986 6,618 9,226
Net operating revenues 5,899 6,505 9,072
Adjusted EBIT 320 834 856
Adjusted EBIT margin (%) 5.4 12.8 9.4
Adjusted EBITDA 1,391 1,875 2,187
Adjusted EBITDA margin (%) 23.6 28.8 24.1
Net income (loss) (8,569) (2,117) (1,849)
Underlying earnings (1,032) (961) (251)
Underlying earnings per share on a fully diluted basis (US$ / share) (0.20) (0.19) (0.05)
Capital expenditures 2,193 1,879 3,747

9
Operating revenues
Gross operating revenues in 2015 were US$ 26.047 billion, 31.8% lower than the US$ 38.236
billion registered in 2014. The decrease in sales revenues was mainly due to lower realized
prices of iron ore fines (US$ 8.614 billion), pellets (US$ 2.030 billion) and nickel (U$ 1.394
billion) which were partially offset by higher volumes of iron ore and pellets (US$ 1.869 billion)
and base metals (US$ 666 million).
Gross operating revenues in 4Q15 were US$ 5.986 billion, 9.5% lower than in 3Q15. The
decrease in sales revenues was mainly due to lower realized prices (US$ 956 million), partly
offset by higher sales volumes (US$ 325 million).
The tables below show gross operating revenues by destination and by business segments,
with the following highlights:
Revenues by destination in 2015 were in line with 2014, with sales to Asia
representing 51.3% of total gross revenues in 2015.
Contribution by business segment was marked by: (i) the increase in the Base Metals
and the Fertilizers business segment share in Vale’s total gross revenues to 23.7%
and 9.2% in 2015 from 20.1% and 6.8% in 2014, respectively; and (ii) the decrease in
the Ferrous Minerals business segment share to 64.6% in 2015 from 68.4% in 2014.
Gross operating revenue by destination
US$ million 4Q15 3Q15 4Q14 2015 % 2014 %
North America 450 409 642 2,008 7.7 2,771 7.2
USA 168 188 278 855 3.3 1,368 3.6
Canada 279 206 361 1,123 4.3 1,393 3.6
Mexico 3 15 3 31 0.1 10 -
South America 964 1,289 1,769 4,807 18.5 7,308 19.1
Brazil 871 1,191 1,645 4,396 16.9 6,624 17.3
Others 93 98 124 411 1.6 684 1.8
Asia 3,189 3,550 4,798 13,371 51.3 19,590 51.2
China 2,180 2,556 3,091 9,096 34.9 12,657 33.1
Japan 460 498 848 1,959 7.5 3,627 9.5
South Korea 186 171 300 790 3.0 1,555 4.1
Others 363 325 559 1,526 5.9 1,751 4.6
Europe 1,144 1,114 1,556 4,663 17.9 6,697 17.5
Germany 355 332 442 1,437 5.5 2,111 5.5
Italy 111 104 130 461 1.8 849 2.2
Others 678 678 985 2,765 10.6 3,737 9.8
Middle East 170 227 288 969 3.7 1,266 3.3
Rest of the World 69 29 173 230 0.9 605 1.6
Total 5,986 6,618 9,226 26,047 100.0 38,236 100.0

10
Gross operating revenue by business segments
US$ million 4Q15 3Q15 4Q14 2015 % 2014 %
Ferrous minerals 3,883 4,367 6,213 16,821 64.6 26,140 68.4
Iron ore fines 2,956 3,290 4,593 12,382 47.5 19,439 50.8
ROM 14 27 42 111 0.4 233 0.6
Pellets 806 908 1,308 3,717 14.3 5,424 14.2
Manganese ore 4 24 92 101 0.4 226 0.6
Ferroalloys 10 3 51 82 0.3 218 0.6
Others 93 115 127 428 1.6 600 1.6
Coal 108 127 201 526 2.0 739 1.9
Metallurgical coal 98 115 181 480 1.8 661 1.7
Thermal coal 10 12 20 47 0.2 78 0.2
Base metals 1,458 1,355 1,948 6,171 23.7 7,694 20.1
Nickel 782 785 1,064 3,412 13.1 4,468 11.7
Copper 413 368 556 1,728 6.6 2,122 5.5
PGMs 96 59 152 404 1.6 564 1.5
Gold 122 115 115 477 1.8 418 1.1
Silver 8 7 11 31 0.1 37 0.1
Others 37 22 50 119 0.5 85 0.2
Fertilizer nutrients 513 747 607 2,386 9.2 2,585 6.8
Potash 33 47 45 147 0.6 169 0.4
Phosphates 387 588 432 1,818 7.0 1,904 5.0
Nitrogen 76 92 108 355 1.4 411 1.1
Others 17 20 22 66 0.3 101 0.3
Others 24 22 257 143 0.5 1,078 2.8
Total 5,986 6,618 9,226 26,047 100.0 38,236 100.0

11
Costs and expenses
ANNUAL PERFORMANCE
Costs and expenses decreased to US$ 22.875 billion in 2015 from the US$ 29.042 billion
recorded in 2014, due to: (i) the impact of exchange rate variations in COGS and SG&A
(US$ 4.9 billion), (ii) cost savings initiatives (US$ 1.8 billion), (iii) positive one-off effects from
gains on the goldstream transaction recorded in 1Q15 (US$ 0.2 billion) and from the
adjustment in the Asset Retirement Obligations (ARO)7 recorded in 4Q15 (US$ 0.3 billion);
and (iv) the reduction in expenses excluding the above mentioned positive one-off effects
(US$ 0.7 billion). These reductions were partly offset by higher sales volumes (US$ 1.0
billion) and by the negative impact of the bunker oil hedge accounting program for iron ore
fines (US$ 0.4 billion).
Costs will no longer be impacted by Vale’s hedge accounting program since all outstanding
bunker oil exposure recorded under this program was settled in 4Q15. After deducting the
above-mentioned positive one-off effects and the negative impact of the bunker oil hedge
accounting program for iron ore fines, costs and expenses decreased US$ 6.0 billion, a
reduction of 20.7%.
QUARTERLY PERFORMANCE
Costs and expenses decreased to US$ 5.579 billion in 4Q15 from the US$ 5.671 billion
recorded in 3Q15, mainly due to the positive one-off effect from the adjustment in ARO (US$
331 million) and exchange rate variations in COGS & SG&A (US$ 210 million), which were
partly offset by higher sales volumes (US$ 282 million) and by an increase in Other Operating
Expenses (US$ 154 million).
Costs and expenses
US$ million 4Q15 3Q15 4Q14 2015 2014
Costs 5,119 5,040 6,892 20,513 25,064
Expenses 460 631 1,324 2,362 3,978
Total costs and expenses 5,579 5,671 8,216 22,875 29,042
Depreciation 984 1,022 1,242 4,029 4,288
Costs and expenses ex-depreciation 4,595 4,649 6,974 18,846 24,754
7 The annual revision for the provisions for mine and other assets closure s generated a positive impact as a result of the life
extension of some mines and a revision on the scope of the work needed for closing the assets.

12
Cost of Goods Sold (COGS)
ANNUAL PERFORMANCE
COGS8 totaled US$ 20.513 billion in 2015, reducing US$ 4.6 billion in comparison with the
US$ 25.064 billion recorded in 2014, despite the increase in sales volumes in iron ore fines,
pellets and base metals in 2015. Ferrous Minerals costs decreased by US$ 3.041 billion,
Fertilizers costs decreased by US$ 510 million, Base Metals costs decreased by US$ 318
million and Coal costs decreased by US$ 214 million in 2015 vs. 2014.
After adjusting for the effects of higher sales volumes, costs decreased by US$ 5.5 billion in
2015 vs. 2014. The cost reductions were mostly driven by exchange rate variations (US$ 4.2
billion) and by the positive results of cost reduction initiatives (US$ 1.8 billion), especially in
the Ferrous Minerals business segment, as a result of by reductions in iron ore fines and
pellets freight, the ramp-ups of the N4WS and N5S mines, and the Vargem Grande and both
the Conceição I and II Itabirites projects.
QUARTERLY PERFORMANCE
COGS9 totaled US$ 5.119 billion in 4Q15, increasing US$ 79 million in comparison with the
US$ 5.040 billion recorded in 3Q15, mainly due to the increase in sales volumes of iron ore
fines and base metals in 4Q15.
After adjusting for the effects of higher sales volumes, costs decreased by US$ 203 million in
4Q15 vs. 3Q15. The cost reductions were mainly driven by exchange rate variations (US$
186 million) and by the positive results of cost reduction initiatives in iron ore fines (US$ 153
million), which were partly offset by a net increase in costs in other business segments.
Further details on cost performance are provided in the “Performance of the Business
Segments” section.
COGS by business US$ million 4Q15 3Q15 4Q14 2015 % 2014 %
Ferrous minerals 2,846 2,813 4,278 11,759 57.3 14,800 59.0
Base metals 1,551 1,406 1,718 5,863 28.6 6,181 24.7
Coal 296 239 285 977 4.8 1,191 4.8
Fertilizers 386 536 492 1,763 8.6 2,273 9.1
Other products 40 46 119 151 0.7 619 2.5
Total COGS 5,119 5,040 6,892 20,513 100.0 25,064 100.0
Depreciation 875 861 1,122 3,529 3,857
COGS, ex-depreciation 4,244 4,179 5,770 16,984 21,207
8 COGS currency exposure in 2015 was made up as follows: 49% Brazilian Reais, 34% US dollar, 13% Canadian d ollar,1%
Australian dollar and 3% other currencies.
9 COGS currency exposure in 4Q15 was made up as follows: 45% Brazilian Reais, 37% US dollar, 13% Canadian dollar,2%
Australian dollar and 3% other currencies.

13
Expenses
ANNUAL PERFORMANCE
Total expenses decreased to US$ 2.362 billion in 2015 from the US$ 3.978 billion recorded in
2014, mainly due to: (i) a reduction in Other Expenses10
(US$ 851 million); (ii) SG&A (US$
447 million); and (iii) R&D (US$ 257 million). After deducting the positive one-off effects of
US$ 230 million from the goldstream transaction recorded in 1Q15 and adjusting for the Asset
Retirement Obligations (ARO) of US$ 331 million recorded in 4Q15, expenses decreased by
US$ 1.1 billion, a reduction of 26.5%.
SG&A totaled US$ 652 million in 2015, representing a 40.7% decrease from the US$ 1.099
billion recorded in 2014. SG&A net of depreciation reduced by US$ 357 million in 2015 vs.
2014, as a result of the depreciation of the BRL and of the CAD (US$ 179 million), as well as
the simplification of corporate functions (US$ 178 million).
R&D expenses totaled US$ 477 million in 2015, representing a 35.0% decrease from the US$
734 million recorded in 2014. R&D expenses were mostly concentrated in iron ore and pellets
(US$ 128 million) and nickel (US$ 103 million).
Pre-operating and stoppage expenses totaled US$ 1.027 billion in 2015, representing a 5.6%
decrease from the US$ 1.088 billion recorded in 2014. The decrease in pre-operating
expenses at VNC, S11D and Vargem Grande Itabirites11
were partly offset by their increase
at Long Harbour and Nacala.
Other operating expenses12
totaled US$ 767 million in 2015, representing a 27.4% decrease
from the US$ 1.057 billion recorded in 2014.
QUARTERLY PERFORMANCE
Total expenses decreased to US$ 460 million in 4Q15 from the US$ 631 million recorded in
3Q15, mainly due to the positive one-off effect of the adjustment in ARO (US$ 331 million),
partly offset by an increase in Other Expenses (US$ 154 million) and SG&A (US$ 36 million).
SG&A totaled US$ 167 million in 4Q15, representing a 27.5% increase from the US$ 131
million recorded in 3Q15, and a 45.4% decrease from the US$ 306 million recorded in 4Q14.
SG&A net of depreciation increased by US$ 29 million in 4Q15 vs. 3Q15, despite the positive
impact of the depreciation of the BRL and of the CAD (US$ 5 million), mainly as a result of: (i)
10
Including the positive one-off effects of US$ 230 million from the goldstream transaction recorded in 1Q15 and of US$ 331
million from the adjustment in ARO recorded in 4Q15 .
11 Vargem Grande Itabiritos project was concluded in 2014.
12 After deducting the positive one-off effects of US$ 230 million from the goldstream transaction recorded in 1Q15 and of US$
331 million from the adjustment in ARO recorded in 4Q15.

14
a gain on the reversal of the provision for doubtful debts recorded in 3Q15 (US$ 10 million);
(ii) the impact of the collective bargaining agreement for corporate and sales functions located
in Brazil (US$ 4 million); (iii) higher expenses for global IT services (US$ 3 million); and (iv)
termination of corporate contracts in Australia (US$ 2 million).
R&D expenses totaled US$ 119 million in 4Q15, in line with the US$ 121 million recorded in
3Q15, and representing a 49.4% decrease from the US$ 235 million recorded in 4Q14. R&D
expenses were mostly concentrated in iron ore and pellets (US$ 27 million) and nickel (US$
30 million).
Pre-operating and stoppage expenses totaled US$ 238 million in 4Q15, representing a 10.5%
decrease from the US$ 266 million recorded in 3Q15, and representing a 18.5% decrease
from the US$ 292 million recorded in 4Q14. Lower pre-operating expenses at VNC were the
main driver for the reduction achieved in 4Q15 vs. 4Q14.
Other operating expenses totaled US$ 267 million in 4Q15, representing a 136.3% increase
from the US$ 113 million recorded in 3Q15, mainly due to write-off of assets and settlement of
insurance claims, and representing a 45.6% decrease from the US$ 491 million recorded in
4Q14.
Expenses US$ million 4Q15 3Q15 4Q14 2015 % 2014 %
SG&A ex-depreciation 129 100 247 519 876
SG&A 167 131 306 652 27.6 1,099 27.6
Administrative 150 132 292 603 25.5 1,019 25.6
Personnel 55 56 118 267 11.3 436 11.0
Services 33 26 53 113 4.8 196 4.9
Depreciation 38 31 59 133 5.6 223 5.6
Others 24 19 62 90 3.8 164 4.1
Selling 17 (1) 14 49 2.1 80 2.0
R&D 119 121 235 477 20.2 734 18.5
Pre-operating and stoppage expenses¹
238 266 292 1,027 43.5 1,088 27.4
VNC 93 97 141 394 16.7 549 13.8
Long Harbour 47 65 42 278 11.8 125 3.1
S11D 14 11 15 52 2.2 29 0.7
Moatize 14 25 10 62 2.6 16 0.4
Others 70 68 84 241 10.2 369 9.3
Other operating expenses² (64) 113 491 206 8.7 1,057 26.6
Total Expenses 460 631 1,324 2,362 100.0 3,978 100.0
Depreciation 110 161 120 501 431
Expenses ex-depreciation 350 470 1,204 1,861 3,547 1 Includes U$ 67 mill ion of depreciati on charges in 4Q15, US$ 83 mi ll ion in 3Q15, US$ 61 mill ion in 4Q14, US$ 314 mil l ion in 2015 and
US$ 209 mil l ion in 2014. 2 Include the posi tive one-off effects of US$ 230 mill ion from the gold stream transaction recorded in 1Q15 and of US$ 331 mill ion from
the adjustment in ARO recorded in 4Q15.

15
Adjusted earnings before interest,
taxes, depreciation and
amortization13
ANNUAL PERFORMANCE
Adjusted EBITDA was US$ 7.081 billion in 2015, 47% lower than the US$ 13.353 billion
registered in 2014, mainly as a result of lower sales prices in ferrous minerals (-US$ 10.734
billion) and base metals (-US$ 2.195 billion). Lower costs and expenses partly offset the
impact of lower prices by US$ 6.746 billion. Adjusted EBITDA margin was 27.7% in 2015.
Adjusted EBITDA was impacted by the following effects: (i) gains on the goldstream
transaction recorded in 1Q15 (US$ 230 million), (ii) the adjustment in the Asset Retirement
Obligations14
which reduced expenses in 4Q15 (US$ 331 million), and (iii) the hedge
accounting related to freight costs which increased iron ore fines costs (-US$ 412 million).
Adjusted EBITDA will no longer be impacted by Vale’s hedge accounting program since all
outstanding bunker oil exposure recorded under this program was settled in 4Q15.
Adjusted EBIT was US$ 2.734 billion in 2015, 67.8% lower than in 2014.
QUARTERLY PERFORMANCE
Adjusted EBITDA was US$ 1.391 billion in 4Q15, 25.8% lower than in 3Q15, mainly as a
result of lower sales prices in most of our commodities which impacted EBITDA negatively by
US$ 943 million. Lower costs and expenses partly offset the impact of lower prices by US$
334 million. Adjusted EBITDA margin was 23.6% in 4Q15.
Quarterly adjusted EBITDA was positively impacted by the above-mentioned effect of the
adjustment in ARO (US$ 331 million) and negatively impacted by decisions and/or events
from previous quarters, with effects in 4Q15, such as: (i) bunker oil hedge accounting
program for iron fines (US$ 134 million); (ii) provisional copper price adjustments (US$ 60
million); (iii) provisional manganese ore price adjustments (US$ 28 million); and (iv) the write-
off of materials inventories in Base Metals (US$ 31 million).
Adjusted EBIT was US$ 320 million in 4Q15, 61.6% lower than in 3Q15.
13
Net revenues less costs and expenses net of depreciation plus dividends received.
14 The annual revision of the provisions for mine and other assets closures generated a positive impact as a result of the
extension of working life for some of the mines and a revision of the scope of the work needed for closing the assets.

16
Adjusted EBITDA
US$ million 4Q15 3Q15 4Q14 2015 2014
Gross operating revenues 5,986 6,618 9,226 26,047 38,236
Net operating revenues 5,899 6,505 9,072 25,609 37,539
COGS (5,119) (5,040) (6,892) (20,513) (25,064)
SG&A (167) (131) (306) (652) (1,099)
Research and development (119) (121) (235) (477) (734)
Pre-operating and stoppage expenses (238) (266) (292) (1,027) (1,088)
Other operational expenses 64 (113) (491) (206) (1,057)
Adjusted EBIT 320 834 856 2,734 8,497
Depreciation, amortization & depletion 984 1,022 1,242 4,029 4,288
Dividends received 87 19 89 318 568
Adjusted EBITDA 1,391 1,875 2,187 7,081 13,353
Adjusted EBITDA by business area
US$ million 4Q15 3Q15 4Q14 2015 2014
Ferrous minerals 1,409 1,652 1,702 5,899 11,321
Coal (149) (129) (204) (508) (669)
Base metals 111 193 582 1,388 2,521
Fertilizer nutrients 117 197 75 567 278
Others (97) (38) 32 (265) (98)
Total 1,391 1,875 2,187 7,081 13,353

17
Net income
ANNUAL PERFORMANCE
Vale posted a net loss of US$ 12.129 billion in 2015 compared to a net gain of US$ 657
million in 2014. The US$ 12.786 billion decrease was mostly driven by: (i) lower EBITDA (-
US$ 6.272 billion); (ii) higher impairments on assets, onerous contracts and investments15
(-
US$ 8.189 billion), and (iii) higher losses on foreign exchange and monetary variation (-US$
5.280 billion). This decrease was partially offset by higher deferred taxes (US$ 5.638 billion)
and lower financial expenses (US$ 1.681 billion).
Underlying earnings were a negative US$ 1.698 billion in 2015, mainly due to: (i) the impact
of lower EBITDA (-US$ 6.272 billion); (ii) the financial loss on derivatives16
(-US$ 975 million);
and (iii) loss on equity income from affiliated companies (-US$ 439 million). The negative
impact on underlying earnings was partly offset by deferred taxes (US$ 5.489 billion).
Impairments on assets and investments17
and the recognition of onerous contracts totaled
US$ 9.372 billion in 2015. The increase vs. 2014 was mainly due to the significant reduction
in the price assumptions used for the impairment tests.
Impairments on assets and the recognition of onerous contracts (excluding impairments on
investments) totaled US$ 8.926 billion in 2015 and were mainly driven by the impact of: (i) the
decline in iron ore prices in the Midwestern system and the consequent production plan
revision (US$ 522 million on assets and US$ 357 million on onerous contracts); (ii) the
decision not to restart the pellet plants in the Northern system (US$ 55 million); (iii) the lower
coal prices and the revision of mining plans in the Australian coal mines (US$ 635 million); (iv)
the lower coal prices and the increase in logistic costs in Mozambique (US$ 2.403 billion); (v)
the lower nickel prices in New Caledonia (US$ 1.462 billion) and in Newfoundland and
Labrador (US$ 3.460 billion); (vi) the lower expectations on the recovery of amounts invested
in the Rio Colorado potash project (US$ 548 million). The above-mentioned impairment
charges were partially offset by impairment reversals, driven by the impact of: (i) the recovery
of Onça Puma´s nickel production (US$ 252 million); and (ii) the depreciation of the BRL
against the USD which benefited the Brazilian phosphate operations (US$ 391 million).
15
Of associates and joint ventures.
16 Composed mainly of bunker oil and commodities.
17 Of associates and joint ventures.

18
Impairment US$ million
Impairments on assets in 2015
Recognition on onerous contracts in 2015
Book Value after impairments Dec 31, 2015
Ferrous minerals
Iron ore in the Midwestern system¹ 522 357 -
Pellets plants 55 - -
Others 58 - -
Coal
Coal assets in Mozambique 2,403 - 1,729
Coal assets in Australia¹ 635 - 74
Base metals
Vale New Caledonia (VNC) 1,462 - 3,725
Vale New Foundland and Labrador (VNL) 3,460 - 2,353
Onça Puma (252) - 2,331
Others 62 - -
Fertilizers -
Phosphate assets (391) - 3,842
Rio Colorado Project (PRC) 548 - 20
Others 7 - -
Total 8,569 357 14,000
¹ Includes intangible assets of US$ 81 mi ll ion.
Impairments of investments of associates and joint ventures totaled US$ 446 million,
comprising investments made in Samarco of US$ 132 million and Teal Minerals, a joint
venture of Vale with ARM, which holds an 80% stake in the Lubambe copper operation, of
US$ 314 million. The above-mentioned impairment on Samarco´s investments relates to
Vale´s share of Samarco’s declared but unpaid dividends and royalties.
Impairment on investments US$ million
Total impairments in 2015
Book Value after impairments Dec 31, 2015
Iron ore
Samarco 132 -
Base metals
Teal Minerals 314 -
Total 446 0
Net financial results showed a loss of US$ 10.801 billion in 2015, compared to a loss of US$
6.069 billion in 2014. The main components of the net financial results are: (i) financial
expenses (-US$ 1.112 billion); (ii) financial revenues (US$ 268 million); (iii) foreign exchange
and monetary losses (-US$ 7.480 billion); (iv) currency and interest rate swaps losses (-US$
1.502 billion) and (v) losses on other derivatives (-US$ 975 million), composed mainly of
bunker oil derivative losses of US$ 742 million.
In 2015, the 47% depreciation of the BRL against the USD led to losses of US$ 8.666 billion,
of which, US$ 7.164 billion came from the US$ 16.720 billion exposure on the net position of
the USD denominated liabilities and USD denominated assets recorded mainly in Vale’s
(parent company) financial statements, and US$ 1.502 billion loss from the mark-to-market of
the swap transactions implemented to convert debt instruments into USD. In 2014, the
depreciation of the BRL vs. the USD of 13% led to a US$ 2.802 billion loss.
19
At the end of 2014, Brazilian corporate tax legislation was amended by Law number
12.973/13, taking effect in 2015. Under the amended legislation, income from foreign
subsidiaries is recognized on an accrual basis for Brazilian tax purposes and top-up taxes are
applicable in Brazil up to the standard Brazilian corporate tax rate of 34%. In compliance with
the Brazilian legislation, and based on the tax losses carried forward at foreign subsidiaries
and on economic and financial projections, US$ 2.952 billion was recorded as a deferred tax
asset in 3Q15.
QUARTERLY PERFORMANCE
Vale posted a net loss of US$ 8.569 billion in 4Q15 compared to a net loss of US$ 2.117
billion in 3Q15. The US$ 6.452 billion loss was mostly driven by the above mentioned
impairments on assets, onerous contracts and investments of US$ 9.372 billion, which was
partially offset by gains on monetary and foreign exchange variation of US$ 5.290 billion.
Underlying earnings were a negative US$ 1.032 billion in 4Q15 after excluding the one-off
effects, mainly due to financial expenses result of US$ 246 million and financial losses on
derivatives18
of US$ 289 million.
Net financial results showed a gain of US$ 353 million in 4Q15, compared to a loss of US$
7.176 billion in 3Q15. The main components of net financial results are: (i) financial expenses
(-US$ 326 million); (ii) financial revenues (US$ 80 million); (iii) foreign exchange and
monetary gains in USD denominated debt (US$ 173 million); (iv) currency and interest rate
swap gains (US$ 715 million) as a result of the mark-to-market of Vale’s swap liabilities driven
by the increase in Vale’s Credit Default Swap (CDS) and (v) losses on other derivatives (-US$
289 million), composed mainly of bunker oil derivatives losses of US$ 212 million.
Differently from the 28% depreciation of the BRL vs. the USD throughout 3Q15 which led to a
US$ 6.221 billion loss, the 2% appreciation of the BRL against the USD in 4Q15 led to a US$
970 million gain, of which US$ 255 million came from the US$ 17.402 billion exposure on the
net position of the USD denominated liabilities and USD denominated assets recorded19
in
Vale’s (parent company) financial statements, and US$ 715 million from the mark-to-market
of the swap liabilities.
Equity income from affiliated companies
ANNUAL PERFORMANCE
Equity income from affiliated companies was a negative US$ 439 million in 2015 against a
positive US$ 505 million recorded in 2014. The main negative contributors to equity income
18
Composed mainly of bunker oil and commodities.
19 The US$ 216 million gain includes the impact of the BRL appreciation on: (i) the USD denominated debt recorded as
financial results (US$ 134 million); and (ii) other assets and liabilities (US$ 82 million).
20
were CSP (US$ 307 million) and Samarco (US$ 167 million) due to the impact of the BRL
depreciation on the USD denominated debt of these companies, and Teal Minerals (US$ 129
million). Positive contributors to Vale’s equity income were the leased pelletizing companies in
Tubarão (US$ 106 million), Aliança Geração Energia (US$ 50 million) and VLI (US$ 46
million), MRS (US$ 43 million) and MRN (US$ 40 million).
QUARTERLY PERFORMANCE
Equity income from affiliated companies was a negative US$ 37 million in 4Q15 against a
negative US$ 349 million recorded in 3Q15. The main negative contributors to equity income
were Teal Minerals (-US$ 99 million) and CSA (-US$ 20 million). Positive contributors to
Vale’s equity income were the leased pelletizing companies in Tubarão (US$ 26 million),
Aliança Geração Energia (US$ 24 million), MRN (US$ 20 million), VLI (US$ 14 million) and
MRS (US$ 11 million).
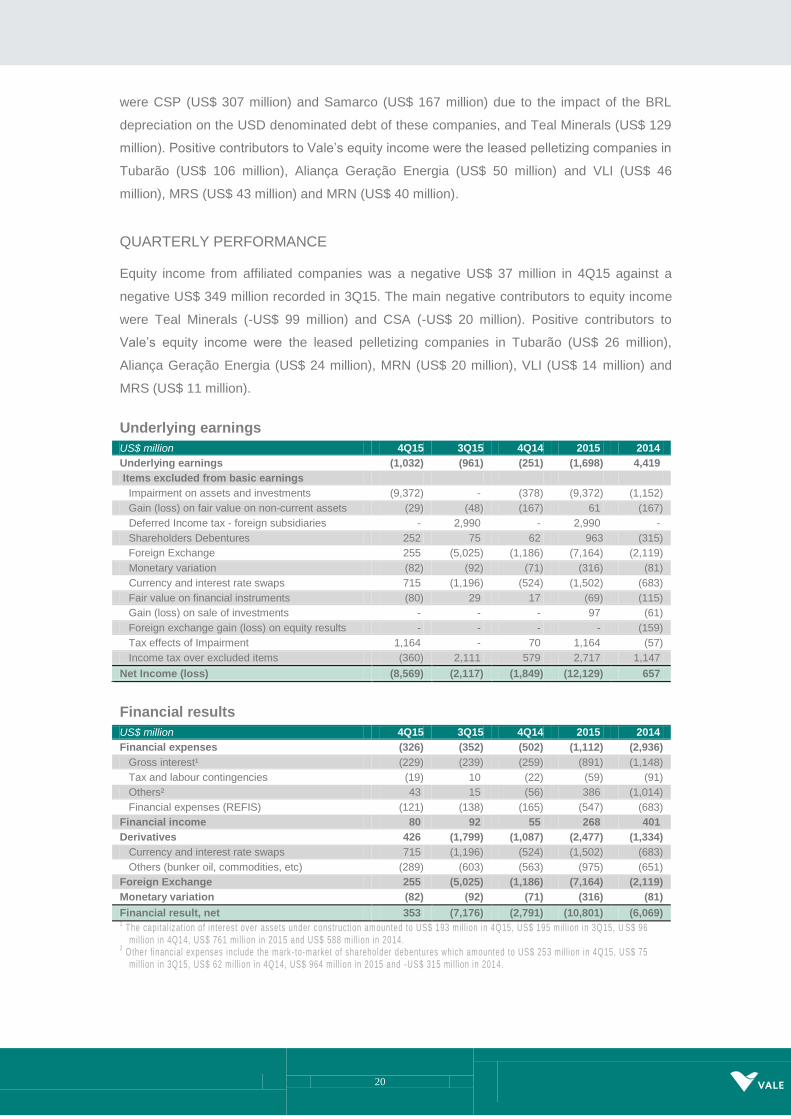
Underlying earnings
US$ million 4Q15 3Q15 4Q14 2015 2014
Underlying earnings (1,032) (961) (251) (1,698) 4,419
Items excluded from basic earnings
Impairment on assets and investments (9,372) - (378) (9,372) (1,152)
Gain (loss) on fair value on non-current assets (29) (48) (167) 61 (167)
Deferred Income tax - foreign subsidiaries - 2,990 - 2,990 -
Shareholders Debentures 252 75 62 963 (315)
Foreign Exchange 255 (5,025) (1,186) (7,164) (2,119)
Monetary variation (82) (92) (71) (316) (81)
Currency and interest rate swaps 715 (1,196) (524) (1,502) (683)
Fair value on financial instruments (80) 29 17 (69) (115)
Gain (loss) on sale of investments - - - 97 (61)
Foreign exchange gain (loss) on equity results - - - - (159)
Tax effects of Impairment 1,164 - 70 1,164 (57)
Income tax over excluded items (360) 2,111 579 2,717 1,147
Net Income (loss) (8,569) (2,117) (1,849) (12,129) 657
Financial results
US$ million 4Q15 3Q15 4Q14 2015 2014
Financial expenses (326) (352) (502) (1,112) (2,936)
Gross interest¹ (229) (239) (259) (891) (1,148)
Tax and labour contingencies (19) 10 (22) (59) (91)
Others² 43 15 (56) 386 (1,014)
Financial expenses (REFIS) (121) (138) (165) (547) (683)
Financial income 80 92 55 268 401
Derivatives 426 (1,799) (1,087) (2,477) (1,334)
Currency and interest rate swaps 715 (1,196) (524) (1,502) (683)
Others (bunker oil, commodities, etc) (289) (603) (563) (975) (651)
Foreign Exchange 255 (5,025) (1,186) (7,164) (2,119)
Monetary variation (82) (92) (71) (316) (81)
Financial result, net 353 (7,176) (2,791) (10,801) (6,069) 1 The capital ization of interest over assets under construction amounted to US$ 193 mill ion in 4Q15, US$ 195 mill ion in 3Q15, U S$ 96
mill ion in 4Q14, US$ 761 mi ll ion in 2015 and US$ 588 mill ion in 2014. 2 Other financial expenses include the mark -to-market of shareholder debentures which amounted to US$ 253 mill ion in 4Q15, US$ 75
mill ion in 3Q15, US$ 62 mill ion in 4Q14, US$ 964 mil l ion in 2015 and -US$ 315 mi ll ion in 2014.

21
EFFECTS OF CURRENCY PRICE
VOLATILITY ON VALE’S FINANCIAL
PERFORMANCE
ANNUAL PERFORMANCE
In 2015, from end to end, the Brazilian Real (BRL) depreciated 47% against the US Dollar
(USD) from BRL 2.66/ USD as of December 30th, 2014 to BRL 3.90/ USD as of December
30th, 2015. On an annual average, the exchange rate depreciated by 42%, from an average
BRL 2.35/ USD in 2014 to an average BRL 3.34/USD in 2015.
Although Vale reports its financial performance in USD, the BRL depreciation impacts its
results since the functional currency of Vale’s parent company, Vale S. A., is the BRL.
The end to end depreciation of the BRL against the USD and other currencies caused mainly
non-cash losses of US$ 8.666 billion on our earnings before taxes in 2015, driven by its
impact on:
The net position of the USD and other currency denominated liabilities and the USD
and other currency denominated assets (accounts receivable and others) – which
amounted to a loss of US$ 7.164 billion in 2015, recorded in the financial statements
as "Foreign exchange".
The forward and swaps derivatives that are used to reduce the volatility of our cash
flows in USD. In 2015, the changes in fair value and the settlements of the currency
swaps from the BRL and other currencies to the USD caused one-off losses of US$
1.502 billion.
The BRL depreciation, on an annual average, had positive impacts on our cash flows. In 2015
most of our revenues were denominated in USD, while our COGS were 49% denominated in
BRL, 34% in USD and 13% in Canadian dollars (CAD) and about 75% of our capital
expenditures were denominated in BRL. The depreciation of the BRL and of other currencies
in 2015 reduced our costs and expenses by US$ 4.862 billion.
QUARTERLY PERFORMANCE
In 4Q15, from end to end, the Brazilian Real (BRL) appreciated 1.7% against the US Dollar
(USD) from BRL 3.97/ USD as of September 30th, 2015 to BRL 3.90/ USD as of December
30th, 2015. On a quarterly average, the exchange rate depreciated by 8.7%, from an average
BRL 3.54/ USD in 3Q15 to an average BRL 3.84/USD in 4Q15.
The end to end appreciation of the BRL against the USD and other currencies caused mainly

22
non-cash gains of US$ 970 million on our earnings before taxes in 4Q15, driven by its impact
on:
The net position of the USD and other currency denominated liabilities and the USD
and other currency denominated assets (accounts receivable and others) – which
amounted to a gain of US$ 255 million in 4Q15, recorded in the financial statements
as "Foreign exchange".
The forward and swaps derivatives that are used to reduce the volatility of our cash
flows in USD. In 4Q15, the changes in fair value and the settlements of the currency
swaps from the BRL and other currencies to the USD caused one-off gains of US$
715 million.
The BRL depreciation on a quarterly average had positive impacts on our cash flows. In 4Q15
most of our revenues were denominated in USD, while our COGS were 45% denominated in
BRL, 37% in USD and 13% in Canadian dollars (CAD) and about 75% of our capital
expenditures were denominated in BRL. The depreciation of the BRL and of other currencies
in 4Q15 reduced our costs and expenses by US$ 210 million.

23
Investments
Capital expenditures totaled US$ 8.401 billion in 2015 with US$ 5.548 billion in project
execution and US$ 2.853 billion in sustaining capital. Capital expenditures decreased US$
3.578 billion in 2015 vs. the U$ 11.979 billion spent in 2014. Total annual capex exceeded the
previous guidance by US$ 0.2 billion as a result of a better than expected execution of the
S11D project and its associated logistics.
In 4Q15, Vale’s capital expenditures totaled US$ 2.193 billion with US$ 1.366 billion in project
execution and US$ 827 million in sustaining capital.
Project execution and sustaining by business area
US$ million 4Q15 3Q15 4Q14 2015 % 2014 %
Ferrous minerals 1,087 1,099 2,382 4,946 58.9 7,140 59.6
Coal 464 333 555 1,539 18.3 2,336 19.5
Base metals 533 370 608 1,556 18.5 1,604 13.4
Fertilizer nutrients 97 55 122 257 3.1 320 2.7
Power generation 10 16 59 78 0.9 160 1.3
Steel 3 6 15 22 0.3 222 1.9
Others - - 8 3 - 195 1.6
Total 2,193 1,879 3,749 8,401 100.0 11,979 100.0
Project execution
Vale´s investments in project execution decreased from US$ 7.920 billion in 2014 to US$
5.548 billion in 2015, with the completion of projects, scope optimization and the positive
impact of exchange rates.
The Ferrous Minerals and the Coal business segments accounted for about 65% and 32%,
respectively, of the total investment in capital execution in 4Q15.
Project execution by business area
US$ million 4Q15 3Q15 4Q14 2015 % 2014 %
Ferrous minerals 894 878 1,523 3,878 69.9 4,836 61.1
Coal 431 311 510 1,472 26.5 2,184 27.6
Base metals 16 10 149 54 1.0 462 5.8
Fertilizer nutrients 13 11 27 45 0.8 63 0.8
Power generation 9 16 56 77 1.4 155 2.0
Steel 3 6 15 22 0.4 222 2.8
Total 1,366 1,232 2,279 5,548 100.0 7,920 100.0
FERROUS MINERALS
About 85% of the US$ 894 million invested in Ferrous Minerals in 4Q15 relates to project
execution in iron ore, primarily on the S11D project and the expansion of its associated
infrastructure (US$ 760 million).
24
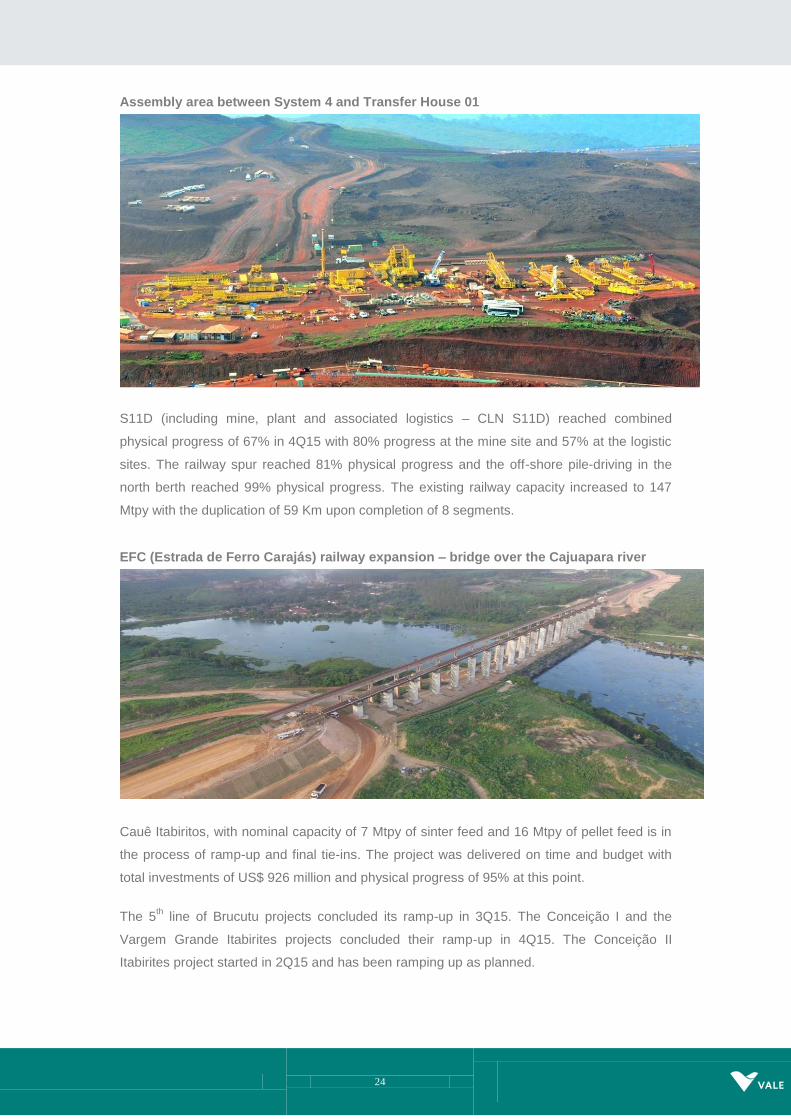
Assembly area between System 4 and Transfer House 01
S11D (including mine, plant and associated logistics – CLN S11D) reached combined
physical progress of 67% in 4Q15 with 80% progress at the mine site and 57% at the logistic
sites. The railway spur reached 81% physical progress and the off-shore pile-driving in the
north berth reached 99% physical progress. The existing railway capacity increased to 147
Mtpy with the duplication of 59 Km upon completion of 8 segments.
EFC (Estrada de Ferro Carajás) railway expansion – bridge over the Cajuapara river
Cauê Itabiritos, with nominal capacity of 7 Mtpy of sinter feed and 16 Mtpy of pellet feed is in
the process of ramp-up and final tie-ins. The project was delivered on time and budget with
total investments of US$ 926 million and physical progress of 95% at this point.
The 5th line of Brucutu projects concluded its ramp-up in 3Q15. The Conceição I and the
Vargem Grande Itabirites projects concluded their ramp-up in 4Q15. The Conceição II
Itabirites project started in 2Q15 and has been ramping up as planned.

25
COAL
Investments in the Moatize II project and in the Nacala Logistics Corridor totaled US$ 196
million and US$ 259 million, respectively, in 4Q15.
Moatize II achieved physical progress of 99% in 4Q15 with commissioning on the handling
system and cargo testing in one line of the CPP (Coal Preparation Plant) initiated. The two
lines are expected to have their cargo testing completed by March.
The upgrade of the brownfield sections of the railway was completed in 4Q15. The Nacala
Logistics Corridor (NLC) successfully transported and discharged 523,000 tons of thermal
coal at the Nacala port, having completed the four shipments of coal as of January 2016.
Description and status of main projects
Project Description Capacity
(Mtpy) Status
Ferrous Minerals projects
Carajás Serra Sul S11D
Development of a mine and processing plant, located in the Southern range of Carajás, Pará, Brazil.
90 Delivery of eletrocenters of the mine and plant ongoing
Transmission line connecting Carajás to Canaã energized
CLN S11D Duplication of 570 km railway, with construction of rail spur of 101 km. Acquisition of wagons, locomotives, and onshore and offshore expansions at PDM maritime terminal.
(80)a Foundation work on the PDM port
expansion ongoing – pile driving in the off-shore north berth reached 99% physical progress
Duplication of the railway reached 41% physical progress
Railway spur reached 81% physical progress
CSPb Development of a steel slab plant in
partnership with Dongkuk and Posco, located in Ceará, Brazil.
1.5 Assembly of the steel structure reached 97% physical progress
Civil works reached 99% physical progress
Coal Projects
Moatize II New pit and duplication of the Moatize CHPP, as well as all related infrastructure, located in Tete, Mozambique.
11 Electromechanical assembly reached 99% physical progress
Commissioning on the belt conveyors initiated
Testing on one line of the CHPP initiated
a Net additional capacity .
b Relative to Vale’s stake in the project.

26
Progress indicators20
Sustaining capex
Sustaining capital expenditures decreased from US$ 4.059 billion in 2014 to US$ 2.853 billion
in 2015.
On a quarter on quarter basis, Vale’s investment increased due to seasonality. Sustaining
capital expenditures amounted to US$ 827 million in 4Q15, increasing US$ 180 million vs.
3Q15. The base metals and ferrous minerals business segment accounted for 62% and 23%,
respectively, of the total sustaining capex in 4Q15.
Sustaining capital expenditures for the ferrous minerals business segment included, among
others: (i) the replacement and acquisition of new equipment (US$ 94 million), (ii) the
improvement in the current standards of health and safety and environmental protection (US$
23 million), (iii) the maintenance, improvement and expansion of tailing dams (US$ 17 million)
and (iv) operational enhancements (US$ 20 million). Maintenance of railways and ports in
Brazil and Malaysia accounted for US$ 65 million.
Sustaining investments in iron ore (excluding sustaining investments in pellets plants)
amounted to US$ 178 million, equivalent to US$ 2.3/wmt of iron ore fines in 4Q15, a 25.8%
decrease vs. US$ 3.1/wmt in 3Q15. This quarter over quarter decrease reflects scope
optimization, positive impact of the depreciation of the BRL and the effect of higher volumes.
Sustaining capex in the base metals business segment operations was mainly dedicated to:
(i) operational enhancement (US$ 371 million), (ii) improvement in the current standards of
20
In this table we do not include pre-operating expenses in the estimated capex for the year, although these expenses are
included in the total estimated capex column, in line with our Board of Directors approval process. Moreover, our estimated
capex for the year is only reviewed once a year.
Project Capacity
(Mtpy) Estimated start-up
Executed capex (US$ million)
Estimated capex (US$ million) Physical
progress 2015 Total 2016 Total
Ferrous minerals projects
Carajás Serra Sul S11D
90 2H16 1,163 4,655 921 6,405c 80%
CLN S11D 230 (80)b
1H14 to 2H18
1,814 4,467 1,372 7,850d 57%
CSPa 1.5 1H16 - 1,055 188 1,224
e 97%
Coal projects
Moatize II 11 1H16 558 1,942 105 2,068f 99%
a Relative to Vale’s stake in the project.
b Net additional capacity.
c Original capex budget of US$ 8.089 bill ion.
d Original capex budget of US$ 11.582 bi ll ion .
e Original capex of US$ 2.734 bill ion; Out of the original capex - US$ 1.491 bill ion financed directly by the CSP project.
f Original capex of US$ 2.068 bill ion plus US$ 0.45 b i ll ion of rol l ing stock .

27
health and safety and environmental protection (US$ 69 million), (iii) replacement and
acquisition of new equipment (US$ 48 million) and (iv) maintenance, improvement and
expansion of tailing dams (US$ 21 million).
Capex for operational enhancements in the base metals business segment in 4Q15 was
52.9% higher than in 3Q15. The increase was mainly driven by higher than average
payments for services related to Long Harbour project in 4Q15, according to the usual
seasonality and in line with the 2015 budget. Long Harbour achieved an important milestone
of operating exclusively with feed from Voisey’s Bay by the end of 4Q15. For 2016, the Base
Metals business segment budget for sustaining investments is roughly 25% lower than in
2015.
Sustaining capex by type - 4Q15
US$ million Ferrous Minerals
Coal Base
Metals Fertilizer TOTAL
Operations 114 14 419 54 601
Waste dumps and tailing dams 17 3 21 7 48
Health and Safety 19 1 65 8 92
CSR - Corporate Social Responsibility 10 - 5 10 25
Administrative & Others 35 15 7 4 61
Total 194 33 517 83 827
Sustaining capex by business area
US$ million 4Q15 3Q15 4Q14 2015 % 2014 %
Ferrous minerals 193 221 859 1,068 37.4 2,305 56.7
Coal 33 22 46 67 2.3 153 3.8
Base metals 517 360 459 1,502 52.6 1,144 28.2
Fertilizer nutrients 83 44 95 212 7.4 258 6.4
Power generation 1 - 3 1 0.1 5 0.1
Others - - 8 3 0.1 197 4.8
Total 827 647 1,470 2,853 100.0 4,061 100.0
Portfolio management
Vale sold four very large ore carriers of 400,000 tons deadweight to ICBC Financial Leasing
in 4Q15. The transaction totaled US$ 423 million.
Sales of assets totaled US$ 3.525 billion in 2015, with US$ 1.316 billion coming from the sale
of 12 very large ore carriers to Chinese shipowners, US$ 1.089 billion coming from the sale of
36.4% of MBR preferred shares, US$ 900 million from another goldstream transaction and
US$ 97 million from the sale of energy assets.
Corporate social responsibility
Investments in corporate social responsibility totaled US$ 366 million in 4Q15, of which US$
269 million dedicated to environmental protection and conservation and US$ 97 million
dedicated to social projects.

28
Debt indicators
Gross debt totaled US$ 28.853 billion as of December 31st, 2015, slightly higher than the US$
28.675 billion as of September 30th, 2015 mainly as a result of the: (i) distribution of dividends
in the amount of US$ 500 million in October and (ii) impact of exchange rate on the
translation of BRL denominated debt into USD21
. Those impacts were partly offset by the
cash proceeds of US$ 423 million from the sale of vessels in 4Q15. Gross debt was in line
with the US$ 28.807 billion as of December 31st, 2014. Net debt increased by US$ 1.021
billion compared to the end of the previous quarter, totaling US$ 25.234 billion based on a
cash position of US$ 3.619 billion as of December 31st, 2015.
Debt position
After currency and interest rates hedge, Vale’s gross debt on December 31st, 2015 was
composed of 24% of floating and 76% of fixed interest rates, and 93% was denominated in
US dollars.
Average debt maturity decreased slightly to 8.1 years. The average cost of debt, after the
above-mentioned hedge, increased to 4.47% per annum on December 31st, 2015, against
4.37% on September 30th, 2015.
Interest coverage, measured by the ratio of the LTM22
adjusted EBITDA to LTM interest
payment, was 4.8x on December 31st, 2015 against 5.3x on September 30
th, 2015.
21
In 4Q15, from end to end, the BRL appreciated 1.7% against the USD.
22 Last twelve months.

29
Gross debt to LTM adjusted EBITDA was 4.1x as of December 31st, 2015. Although the vast
majority of financing agreements do not contain financial covenants, Vale had 21% of total
debt at the end of 2015 with this leverage measure as a financial covenant in contracts with
BNDES and other export and development agencies. As a preventive measure, during the
last quarter of 2015, Vale reached agreements to increase the upper limit of the gross debt to
adjusted EBITDA financial covenant from 4.5x to 5.5x, until the end of 2016. This measure
brings more flexibility during a period in which Vale is finalizing its investment cycle.
Debt indicators US$ million 4Q15 3Q15 4Q14
Gross debt 28,853 28,675 28,807
Net debt 25,234 24,213 24,685
Gross debt / adjusted LTM EBITDA (x) 4.1 3.6 2.2
Adjusted LTM EBITDA / LTM interest expenses (x) 4.8 5.3 8.6

30
Performance of the business
segments
The share of the Ferrous Minerals business segment in the adjusted EBITDA decreased to
83.3% in 2015 from 84.8% in 2014, while the Base Metals business segment increased its
share in total EBITDA to 19.6% from 18.9% in 2014 and the Fertilizers business segment
improved its share to 8.0% from 2.1% in 2014. The contribution from the Coal business
segment and Others went from -5.0% in 2014 to -7.2% in 2015 and from -0.7% in 2014 to -
3.7% in 2015, respectively.
The Ferrous Minerals business segment contribution to total EBITDA in 4Q15 reached
101.3%, followed by the Fertilizer business segment which contributed with 8.4%, the Base
Metals business segment contributed with 8.0%, while the Coal business segment and Others
contributed with -10.7% and -7.0% of Vale´s total adjusted EBITDA, respectively.
Segment information ― 2015, as per footnote of financial statements
Operating
revenues Expenses
US$ million Gross Net Cost
SG&A
and
others
R&D
Pre
operating
&
stoppage
Dividends Adjusted
EBITDA¹
Ferrous minerals
16,821 16,562 (10,241) (380) (128) (169) 255 5,899
Iron ore fines 12,382 12,330 (7,604) (398) (121) (124) 22 4,105
ROM 111 102 (50) 0 0 0 0 52
Pellets 3,717 3,600 (2,121) 9 (4) (24) 225 1,685
Others ferrous 428 368 (291) 8 (3) (2) 8 88
Mn & Alloys 183 162 (175) 1 0 (19) 0 (31)
Coal 526 526 (839) (140) (22) (61) 28 (508)
Base metals 6,171 6,163 (4,296) 44 (111) (412) 0 1,388
Nickel² 4,693 4,693 (3,393) (154) (103) (411) 0 632
Copper³ 1,478 1,470 (903) 198 (8) (1) 0 756
Fertilizer nutrients
2,386 2,225 (1,469) (37) (82) (70) 0 567
Others 143 133 (139) (160) (134) 0 35 (265)
Total 26,047 25,609 (16,984) (673) (477) (712) 318 7,081
¹ Excluding non-recurring effects . ² Including copper and by products from our nickel operations . ³ Including by products from our copper operations .

31
Segment information ― 4Q15, as per footnote of financial statements
Operating revenues
Expenses
US$ million Gross Net Cost SG&A
and othes
R&D Pre
operating & stoppage
Dividends Adjusted EBITDA¹
Ferrous minerals
3,883 3,830 (2,497) 120 (27) (61) 44 1,409
Iron ore fines 2,956 2,945 (1,924) 128 (26) (50) 22 1,095 ROM 14 13 (4) - - - - 9 Pellets 806 780 (453) (7) (1) (5) 22 336 Others ferrous 93 79 (71) (4) - (1) - 3 Mn & Alloys 14 13 (45) 3 - (5) - (34)
Coal 108 108 (260) (9) (4) (12) 28 (149)
Base metals 1,458 1,458 (1,131) (95) (32) (89) - 111
Nickel2 1,107 1,107 (892) (74) (30) (89) - 22
Copper3 351 351 (239) (21) (2) - - 89
Fertilizer nutrients
513 481 (319) (14) (22) (9) - 117
Others 24 22 (37) (63) (34) - 15 (97)
Total 5,986 5,899 (4,244) (61) (119) (171) 87 1,391 2 Excluding non-recurring effects .
3 Including copper and by products from our nickel operations .
4 Including by products from our copper operations .

32
Ferrous minerals
Adjusted EBITDA of the Ferrous Minerals business segment was US$ 5.899 billion in 2015,
47.9% lower than in 2014, mainly as result of lower sales prices (-US$ 11.414 billion), which
were partially offset by real competitiveness gains of US$ 3.477 billion such as: (i) marketing
and commercial initiatives (US$ 680 million); (ii) higher sales volumes (US$ 1.599 billion); (iii)
favorable renegotiations of chartering freight contracts (US$ 300 million); and (iv) the ongoing
cost reduction initiatives (US$ 898 million).
Commercial, marketing and operational initiatives amounted to roughly US$ 680 million and
thus positively impacted sales revenues in 2015. Those initiatives were mainly: (i) the
increase in the average negotiated premiums for iron ore fines; (ii) the increase in realized
prices for FOB sales contracts; (iii) the change in the mix of products; and (iv) the increase in
product quality.
EBITDA variation

33
Iron ore
ANNUAL PERFORMANCE
EBITDA
Adjusted EBITDA of iron ore fines was US$ 4.105 billion in 2015, 49.2% lower than in 2014,
which negatively impacted adjusted EBITDA by US$ 3.971 billion mainly as a result of lower
sales prices.
Adjusted EBITDA will no longer be impacted by Vale’s hedge accounting program since all
outstanding bunker oil exposure recorded under such program was settled in 4Q15. Vale’s
hedge accounting program for iron ore fines had a negative impact of US$ 412 million in
2015.
SALES REVENUES AND VOLUME
Net sales revenues for iron ore fines, excluding pellets and Run of Mine (ROM), decreased to
US$ 12.330 billion in 2015, 36.1% lower than in 2014. The decrease was a result of lower iron
ore sales prices (US$ 8.549 billion), which were partially offset by the sales volumes increase,
which contributed with US$ 1.578 billion to sales revenues when compared to 2014.
The main factors that contributed to the increase in sales volumes of iron ore fines from the
255.9 Mt in 2014 to 276.4 Mt in 2015 were the annual supply record of 345.9 Mt of iron ore
fines (including the acquisition of iron ore from third parties). ROM sales totaled 12.3 Mt in
2015.
Vale’s realized CFR/FOB wmt price23
for iron ore fines (ex-ROM) was US$ 44.6 per metric ton
in 2015, significantly lower than the US$ 75.4 per metric ton in 2014.
COST AND EXPENSES
Iron ore fines costs totaled US$ 7.604 billion (or US$ 8.720 billion with depreciation charges)
in 2015 against US$ 9.532 billion in 2014. After adjusting for the effects of higher sales
volumes (US$ 1.023 billion) and exchange rate variations (-US$ 1.442 billion), costs
decreased by US$ 1.510 billion when compared to 2014, driven by the ongoing cost reduction
initiatives and the ramp-up of both the N4WS and N5S extension mines, Conceição Itabiritos
II and Vargem Grande Itabiritos.
Total cash cost at the port (mine, plant, railroad and port, ex-royalties) was US$ 3.825 billion.
Cash cost was calculated after deducting from COGS: (i) iron ore freight costs of US$ 2.825
23
The realized CFR/FOB wmt price is the weighted average price of Vale’s CFR sales and Vale’s FOB sales

34
billion; (ii) depreciation of US$ 1.116 billion; (iii) iron ore acquired from third parties of US$
210 million and (iv) bunker oil hedge costs accounted for as “hedge accounting” of US$ 412
million. Cash cost per metric ton (ex-ROM and ex-royalties) in 2015 was US$ 14.4/t,
significantly lower than the US$ 20.8/t from 2014.
SG&A and other expenses significantly decreased to US$ 398 million, 68.4% lower than in
2014, after the adjustment of the US$ 322 million from the Asset Retirement Obligations
(ARO).
Pre-operational expenses decreased to US$ 124 million, 25.5% lower than in 2014 as a result
of the ramp-up of the N4WS, N5S extension, Conceição Itabiritos II and Vargem Grande
Itabiritos.
Adjusted EBITDA margin for iron ore fines (excluding ROM and third party ores) was US$
14.7 /t in 2015.
QUARTERLY PERFORMANCE
EBITDA
Adjusted EBITDA for iron ore fines was US$ 1.095 billion in 4Q15, US$ 127 million lower than
the US$ 1.222 billion achieved in 3Q15, mainly due to the decrease in sales prices (-US$ 738
million), which was partially offset by higher sales volumes (US$ 125 million), lower SG&A
and other expenses (US$ 258 million) as result of the positive impact of adjustments to the
Asset Retirement Obligations (US$ 322 million).
Adjusted EBITDA will no longer be impacted by Vale’s hedge accounting program since all
outstanding bunker oil exposure recorded under such program was settled in 4Q15. Vale’s
hedge accounting program for iron ore fines had a negative impact on EBITDA of US$ 134
million in 4Q15.
SALES REVENUES AND VOLUME
Net sales revenues for iron ore fines were US$ 2.945 billion in 4Q15, 10.1% lower than in
3Q15 due to lower sales prices. ROM sales revenues in 4Q15 were US$ 13 million.
Iron ore own production, excluding Samarco’s attributable production and third party ore, was
85.4 Mt in 4Q15, a quarterly production record for a fourth quarter and 2.4 Mt higher than in
4Q14. The good operational performance was driven by the ramp-up of the N4WS, N5S
extension, Conceição Itabiritos II and Vargem Grande Itabiritos.
Sales volumes of iron ore fines reached 79.2 Mt in 4Q15, 12.3% higher than in 3Q15 and
6.2% higher than in 4Q14 on the back of: (i) production of 85.4 Mt; (ii) acquisition of 3.1 Mt of

35
iron ore from third parties; (iii) deduction of 11.6 Mt of iron ore fines used for the production of
pellets; (iv) consumption of 3.9 Mt allocated from product inventories and (v) deduction of 1.6
Mt of ROM sales.
CFR sales of iron ore fines increased from 44.9 Mt in 3Q15 to 53.6 Mt in 4Q15, representing
68% of all iron ore fines sales volumes in 4Q15. The increase was mainly due to higher sales
to China, which are mostly negotiated on a CFR basis.
Net Operating revenue by product
US$ million 4Q15 3Q15 4Q14 2015 2014
Iron ore fines 2,945 3,278 4,568 12,330 19,301
ROM 13 24 42 102 215
Pellets 780 883 1,270 3,600 5,263
Manganese & Ferroalloys 13 26 131 162 392
Others 79 101 105 368 526
Total 3,830 4,312 6,116 16,562 25,697
Volume sold
‘000 metric tons 4Q15 3Q15 4Q14 2015 2014
Iron ore fines 79,213 70,530 74,603 276,393 255,877
ROM 1,627 3,546 3,552 12,269 14,075
Pellets 10,837 11,961 12,686 46,284 43,682
Manganese ore 568 448 828 1,764 1,879
Ferroalloys 12 3 36 69 150
REALIZED PRICES
Iron ore sales in 4Q15 were distributed across three pricing systems: (i) 47% based on the
current quarter, month and daily spot prices, including provisional price sales that were settled
within the quarter; (ii) 42% based on provisional prices with settlement price based on the
market price defined on the delivery date, in which case prices had not yet been settled at the
end of the quarter; and (iii) 11% linked to past prices (quarter-lagged).
Vale’s CFR dmt reference price for iron ore fines (ex-ROM) decreased by US$ 10.9/t from
US$ 56.0/t in 3Q15 to US$ 45.1/t in 4Q15, being US$ 1.6/t lower than the average Platts
IODEX 62% of US$ 46.7/t in 4Q15.
Vale’s CFR/FOB wmt price for iron ore fines (ex-ROM) decreased by US$ 9.3/t from US$
46.5/t in 3Q15 to US$ 37.2/t in 4Q15, after adjusting for moisture and the effect of FOB sales
on 32% of the total sales volumes.
Price realization in 4Q15 was impacted by:
Provisional prices set at the end of 3Q15 at US$ 51.5/t, which were later adjusted
based on the price of delivery in 4Q15, impacted prices in 4Q15 by a negative US$
1.0/t compared to a negative US$ 0.7/t in 3Q15 as a result of the downward trend
curve observed in the IODEX in 4Q15.

36
Provisional prices set at the end of 4Q15 at US$ 41.0/t vs. the IODEX average of
US$ 46.7/t in 4Q15, negatively impacted prices in 4Q15 by US$ 2.4/t compared to a
negative impact of US$ 1.1/t in 3Q15.
Quarter-lagged contracts, priced at US$ 56.7/t based on the average prices for Jun-
Jul-Aug, positively impacted prices in 4Q15 by US$ 1.1/t compared to a positive
impact of US$ 0.2/t in 3Q15.
In 4Q15, iron ore sales of 33.3 Mt, or 42% of Vale’s sales mix, were recorded under the
provisional pricing system, which was set at the end of 4Q15 at US$ 41.0/t. The final prices of
these sales and the required adjustment to sales revenues will be determined and recorded in
1Q16.
The decrease in bunker oil prices positively impacted the settlement of FOB prices in 4Q15 by
US$ 1.0/t compared to a reduction of US$ 1.3/t in 3Q15. Bunker oil prices impacted the
settlement of FOB sales prices as the decrease in bunker oil prices led to a lower freight
deduction from the IODEX CFR reference price used to determine the FOB price.
Price realization – iron ore fines

37
Average sale price
US$/ metric ton 4Q15 3Q15 4Q14 2015 2014
Iron ore - Metal Bulletin 65% index 50.09 62.11 82.90 62.12 105.82
Iron ore - Platts's 62% IODEX 46.65 54.90 74.28 55.50 96.70
Iron ore fines CFR reference price (dmt) 45.10 56.00 75.50 54.60 92.70
Iron ore fines CFR/FOB realized price 37.18 46.48 61.21 44.61 75.43
ROM 7.99 6.77 11.82 8.31 15.28
Pellets CFR/FOB (wmt) 71.98 73.80 100.11 77.78 120.48
Manganese ore 7.04 52.14 111.11 58.44 118.15
Ferroalloys 750.00 836.67 1,083.33 904.16 1,125.83
COSTS AND EXPENSES
Costs for iron ore fines amounted to US$ 1.924 billion (or US$ 2.183 billion with depreciation
charges) in 4Q15. Costs decreased by US$ 131 million when compared to 3Q15 after
deducting the effects of higher sales volumes (US$ 280 million) and exchange rates
variations (-US$ 63 million). The decrease was mainly driven by lower freight costs (-US$ 122
million), lower materials costs (-US$ 17 million), and lower energy costs (-US$ 9 million).
Energy (electricity, diesel and gas) totaled US$ 118 million in 4T15 against US$ 112 million in
3T15. Oil costs, more specifically, in the form of diesel totaled US$ 108 million in 4Q15
against US$ 92 million in 3Q15. Costs increased by US$ 13 million in 4Q15 after adjusting for
higher volumes (US$ 10 million) and exchange rates variations (-US$ 7 million). Falling oil
prices had a limited positive impact on fuel costs, since there is no direct correlation between
prices of diesel in Brazil and international oil prices.
Maritime freight costs, which are fully accrued as cost of goods sold, totaled US$ 757 million
in 4Q15, showing a decrease of US$ 122 million after adjusting for higher volumes (US$ 143
million) as a result of lower freight rates and lower bunker oil prices when compared to 3Q15.
Unit freight cost per iron ore metric ton was US$ 14.1/t in 4Q15, US$ 2.3/t lower than the US$
16.4/t recorded in 3Q15. This US$ 2.3/t decrease is explained by the positive impact of lower
bunker oil prices in our chartering contracts and higher exposure to the freight spot market.
Vale’s average bunker oil price decreased from US$ 296.6/t in 3Q15 to US$ 235.0/t in 4Q15.
The impact of the outstanding bunker oil hedge position accounted for as “hedge accounting”
in Vale’s unit freight cost was US$ 2.5/t with the final settlement of 472,500 tons of bunker oil
derivative contracts from the 472,500 tons of contracts that were outstanding at the end of
September 2015, totaling a negative EBITDA impact of US$ 134 million. EBITDA will be
favourably impacted as of next year as there will be no hedge accounting impact in 2016. For
further details, please refer to the ‘The Impact of Bunker Oil Hedging on Vale’s Financial
Performance’ box on page 49.
The acquisition of products (cost of ore acquired from third parties) amounted to US$ 44
million on 2.8 Mt sold in 4Q15. On a per-ton basis, cost of ore acquired from third parties

38
decreased from US$ 17.7/t in 3Q15 to US$ 15.9/t in 4Q15. Other operational costs amounted
to US$ 160 million, decreasing from US$ 177 million in 3Q15.
Iron ore COGS - 3Q15 x 4Q15
Variance drivers
US$ million 3Q15 Volume Exchange
Rate Others
Total Variation 3Q15 x 4Q15
4Q15
Personnel 185 20 (14) 4 10 195
Outsourced services and Materials
274 31 (17) (8) 6 280
Energy (electricity, diesel & gas)
112 12 (9) 3 6 118
Acquisition of products
40 9 - (5) 4 44
Maintenance 205 22 (19) 28 31 236
Maritime Freight 736 143 - (122) 21 757
Bunker oil hedge 109 21 - 4 25 134
Other Operational 177 22 (4) (35) (17) 160
Total costs before depreciation and amortization
1,838 280 (63) (131) 86 1,924
Depreciation 269 30 (18) (22) (10) 259
Total 2,107 310 (81) (153) 76 2,183
C1 CASH COST
Total C1 cash cost at the port (mine, plant, railroad and port, ex-royalties) was US$ 906
million after deducting depreciation of US$ 259 million, iron ore acquired from third parties of
US$ 44 million, iron ore freight costs of US$ 757 million and bunker oil hedge accounting
effects of US$ 134 million.
C1 cash cost FOB port per metric ton of iron ore fines (ex-ROM and ex-royalties) was US$
11.9/t in 4Q15 vs. US$ 12.7/t in 3Q15, reducing US$ 0.8/t mostly due to the depreciation of
the BRL against the USD. C1 cash cost FOB port per metric ton of iron ore fines in BRL
increased slightly from R$ 45.2/t in 3Q15 to R$ 45.6/t in 4Q15 (or R$ 44.9/t after excluding
the negative effect of R$ 55.5 million of the collective bargain agreement settled with our
employees in Brazil).
Iron ore expenses, net of depreciation, excluding the positive effect of US$ 322 million of the
asset retirement obligation, amounted to US$ 270 million in 4Q15 vs. the US$ 218 million
recorded in 3Q15. Expenses increased by US$ 62 million when compared to 3Q15 after
adjusting for the effects of exchange rates (-US$ 10 million). R&D amounted to US$ 26
million, the same as in 3Q15. Pre-operating and stoppage expenses, net of depreciation,
amounted to US$ 50 million, US$ 27 million higher than the US$ 23 million recorded in 3Q15,
mainly due to stoppage expenses in the Southeastern Mining System due to the rupture of
the Samarco tailings dam.

39
Unit cash costs and expenses (adjusted for quality and moisture, excluding ore from third
parties, ROM and the positive effect of the ARO) landed in China decreased from US$ 34.2/t
in 3Q15 to US$ 32.0/t in 4Q15.
Evolution of iron ore fines cash cost, freight and expenses
Cost and expenses landed in China for iron ore fines

40
Iron ore fines cash cost and freight
4Q15 3Q15 4Q14 2015 2014
Costs (US$ million)
COGS, less depreciation and amortization 1,924 1,838 2,831 7,604 9,532
Costs of ore acquired from third parties 44 40 89 210 443
Maritime freight 757 736 1,037 2,825 3,325
Bunker oil hedge 134 109 - 412 -
One-off items - - 48 - 48
FOB at port costs (ex-ROM and ex-third party ores)¹
989 953 1,657 4,157 5,716
FOB at port costs (ex-ROM, ex-third party ores and ex-royalties)
906 868 1,534 3,825 5,079
Sales volumes (Mt)
Total iron ore volume sold 80.8 74.1 78.2 288.7 270.0
Volume acquired from third parties 2.8 2.3 3.2 11.1 12.2
Total ROM volume sold 1.6 3.5 3.6 12.3 14.1
Volume sold of Vale's own ore (ex-ROM) 76.4 68.3 71.4 265.3 243.7
% of CFR sales 68.0% 64.0% 64.2% 64.1% 57.4%
% of FOB sales 32.0% 38.0% 35.8% 35.9% 42.6%
Vale's iron ore cash cost (ex-ROM, ex-royalties), FOB (US$ /t)
11.9 12.7 21.5 14.4 20.8
Freight
Volume CFR (Mt) 53.6 44.9 47.9 177.1 146.9
Vale's iron ore unit freight cost (US$/t) 16.6 18.8 21.7 18.3 22.6
Vale's iron ore unit freight cost (ex- bunker oil hedge) (US$/t)
14.1 16.4 21.7 16.0 22.6
Iron ore fines unit cost + expenses adjusted for quality landed in China
US$/t 4Q15 3Q15 4Q14 2015 2014
Vale's iron ore cash cost (ex-ROM, ex-royalties), FOB (US$ /t)
11.9 12.7 21.5 14.4 20.8
Iron ore fines freight cost (ex-bunker oil hedge) 14.1 16.4 21.7 16.0 22.6
Iron ore fines expenses1 & royalties 4.6 4.4 11.0 4.9 9.7
Iron ore fines moisture adjustment 2.6 2.8 4.7 3.0 4.8
Iron ore fines quality adjustment -1.1 -2.1 0.9 -1.9 0.9
Iron ore fines unit cost + expenses landed in China (US$/dmt)
32.0 34.2 59.8 36.4 58.9
1 Net of depreciation, excluding the posi tive one-off effect of the ARO adjustment .
Iron Ore Fines Costs and Expenses in BRL
R$/t 4Q15 3Q15 4Q14 2015 2014
Costs 45.6 45.2 54.5 47.9 50.1
Expenses1 12.9 10.8 16.0 12.2 22.6
Total 58.5 56.0 70.5 60.1 72.7 1 Net of depreciation.
Iron ore pellets
ANNUAL PERFORMANCE
Adjusted EBITDA for pellets was US$ 1.685 billion in 2015, 43.5% lower than the US$ 2.981
billion recorded in 2014. The decrease of US$ 1.296 billion was mainly a result of lower sales
prices (US$ 1.986 billion) which were partially offset by higher sales volumes (US$ 204
million), lower costs (US$ 163 million) and exchange rate variations (US$ 551 million).

41
Net sales revenues for pellets were US$ 3.600 billion in 2015, 31.6% lower than in 2014,
mainly due to the decrease in sales prices, from US$ 120.48 per metric ton in 2014 to US$
77.8 per metric ton in 2015. Sales prices negatively impacted sales revenues by US$ 1.986
billion in 2015 compared with 2014. Sales volumes increased to 46.28 Mt vs. 43.68 Mt in
2014 as a result of the ramp-up of Tubarão VIII pellet plant.
Costs for pellets totaled US$ 2.121 billion in 2015 (or US$ 2.436 billion with depreciation
charges). Costs decreased by US$ 162 million when compared to 2014 after adjusting for the
effects of higher volumes (US$ 119 million) and exchange rate variations (-US$ 540 million).
This decrease is mainly due to lower leasing costs (-US$ 63 million), lower diesel costs (-US$
57 million) and lower materials costs (-US$ 45 million).
QUARTERLY PERFORMANCE
Adjusted EBITDA for pellets in 4Q15 was US$ 336 million, compared to the US$ 382 million
in 3Q15. Adjusted EBITDA was negatively impacted by the lower sales prices (-US$ 18
million), lower sales volumes (-US$ 32 million) and higher costs (-US$ 20 million) in 4Q15 vs.
3Q15. The unfavorable impacts were partly offset by exchange rate variations (US$ 22
million) and higher dividends received from the leased pelletizing plants (US$ 22 million).
Net sales revenues for pellets amounted to US$ 780 million in 4Q15, decreasing US$ 103
million from the US$ 883 million recorded in 3Q15 as a result of the lower sales prices of US$
72.0 per ton in 4Q15 vs. US$ 73.8 /t in 3Q15 and of the 1.2 Mt decrease in sales volumes to
10.8 Mt in 4Q15 from 12.0 Mt in 3Q15. Sales volumes decreased by 1.8 Mt in 4Q15 vs. 4Q14.
Production reached 10.4 Mt in 4Q15, 1.8 Mt lower than in 3Q15 mainly due to scheduled
maintenance stoppages in some plants.
Pellet CFR/FOB prices decreased by US$ 1.8/t, from US$ 73.8/t in 3Q15 to US$ 72.0 per
metric ton in 4Q15, whereas the Platt’s IODEX iron ore reference price (CFR China)
decreased by US$ 8.3/t in the quarter.
The decrease in Vale´s realized pellet price was less than the decrease in the average Platts
IODEX as a result of higher pellet premiums and the positive impact of pricing systems.
CFR pellet sales of 2.4 Mt in 4Q15 represented 22% of total pellets sales and were 0.7 Mt
lower than in 3Q15. FOB pellet sales decreased from 8.9 Mt in 3Q15 to 8.5 Mt in 4Q15.
Pellet costs totaled US$ 453 million (or US$ 524 million with depreciation charges) in 4Q15.
Costs increased by US$ 20 million when compared to 3Q15 after adjusting for the effects of
lower volumes (-US$ 53 million) and exchange rate variations (-US$ 22 million).

42
The increase in pellets costs is mainly due to higher maintenance costs (US$ 9 million) and
higher leasing costs (US$ 7 million). Pre-operating and stoppage expenses for pellets were
US$ 5 million in 4Q15, in line with the previous quarter.
EBITDA unit margin for pellets ex-Samarco was US$ 31.0/t in 4Q15, US$ 0.9/t lower than in
3Q15 mainly due to the decrease in sales prices (-US$ 18 million).
Pellets - EBITDA ex-Samarco
4Q15 3Q15
US$ million US$/wmt US$ million US$/wmt
Gross Revenues / Realized Price 806 74.4 908 75.9
Net Revenues / Realized Price 780 72.0 883 73.8
Dividends Received (Leased pelletizing plants) ex-Samarco
22 2.0 - -
Cash Costs (Iron ore, leasing, freight, overhead, energy and other)
-453 -41.8 -508 -42.5
Expenses (SG&A, R&D and other) -13 -1.2 7 0.6
EBITDA ex-Samarco 336 31.0 382 31.9
Manganese and ferroalloys
ANNUAL PERFORMANCE
Adjusted EBITDA of manganese and ferroalloys was negative US$ 31 million in 2015, US$
126 million lower than in 2014, mainly due to lower prices (US$ 98 million), lower volumes
(US$ 73 million) and higher costs (US$ 46 million) which were partially offset by exchange
rates variations (US$ 82 million) and expenses reductions (US$ 9 million).
Net sales revenues for manganese decreased to US$ 100 million in 2015, down from US$
222 million in 2014, due to the effect of lower prices (US$ 108 million) and lower sales
volumes (US$ 14 million). In 2015, manganese ore production totaled to 2.441 Mt, slightly
higher than in 2014.
Net sales revenues for ferroalloys decreased in 2015 to US$ 62 million from US$ 170 million
in 2014, mainly due to the effect of lower sales volumes (US$ 118 million) and lower prices. In
2015, the output of ferroalloys was 99,000 t, significantly lower than in 2014.
QUARTERLY PERFORMANCE
Adjusted EBITDA of Manganese ore and ferroalloys was negative US$ 34 million in 4Q15,
US$ 23 million lower than the negative US$ 11 million in 3Q15, mainly due to the impact of
provisional prices from previous quarters (-US$ 28 million), which were partially offset by
exchange rate variations (US$ 2 million) and higher sales volumes (US$ 1 million).
Net sales revenues for manganese decreased to US$ 4 million from US$ 23 million in 3Q15
due to lower sales prices. In 4Q15, production of manganese ore reached 651,000 t,
compared to 644,000 t in 3Q15 and 723,000 t in 4Q14.

43
Net sales revenues for ferroalloys amounted to US$ 9 million, increasing US$ 6 million from
the US$ 3 million in 3Q15, due to higher sales volumes. Ferroalloys production decreased to
20,000 t in 4Q15 from the 21,000 t recorded in 3Q15.
Market outlook - iron ore
The price of iron ore averaged US$ 55.5/t in 2015, 42% lower than in 2014. The price
reduction was driven by an oversupply of iron ore amid lower than expected steel production
in China and in the rest of the world.
The price of iron ore decreased 15%, from US$ 54.90/t in 3Q15 to US$ 46.65/t in 4Q15, as
steel production deteriorated whilst iron ore supply increased driven by seasonality factors.
According to the World Steel Association (WSA), world crude steel production totaled 1.622Mt
in 2015, declining 2.8% vs. 2014. China’s crude steel production totaled 803.8Mt, declining
2.3% year-on-year. The annual production decline was the first one since 1981 as the country
continues its transition towards an economy more reliant on domestic consumption and
services.
China’s GDP grew 6.9% in 2015, slowing down mainly as a result of a decline in fixed asset
investments, and growing only 10% year-on-year vs. 15.7% growth in 2014. Chinese steel
demand declined, leading steel mills to rely more on overseas market to maintain their
production levels. Net exports of finished steel reached a record 100Mt, rising 25.5% year-on-
year, in 2015.
The increasing exports from China impacted steel production in other regions such as the
Middle East, South East Asia, Europe, where production contracted by 0.5%, 3.6% and 1.8%
year-on-year respectively, and to a certain extent India. The excess supply with the high
export volumes from China translated into lower worldwide steel prices.
The seaborne iron ore supply amounted to roughly 1.410 Mt in 2015, increasing 30 Mt, or
approximately 2% year-on-year with additional production from major iron ore players, such
as Brazil and Australia. Brazil, Australia, South Africa and Peru increased their exports to
China whilst all other regions together reduced exports by 62 Mt, representing a 39% year-on-
year reduction.
2016 should still be a challenging year for iron ore producers as no major stimulus is
expected from the Chinese government to boost investments. Steel demand and production
should remain mild, posing additional challenges for higher cost iron ore producers.

44
Volume sold by destination – Iron ore and pellets
‘000 metric tons 4Q15 3Q15 4Q14 2015 % 2014 %
Americas 8,549 10,760 11,590 41,187 12.3 44,071 14.1
Brazil 7,346 9,363 10,078 35,665 10.6 37,623 12.0
Others 1,203 1,397 1,512 5,522 1.6 6,448 2.1
Asia 65,574 59,597 62,563 229,268 68.4 208,536 66.5
China 52,898 46,512 46,411 179,470 53.6 156,692 50.0
Japan 7,782 8,548 7,505 29,499 8.8 27,229 8.7
Others 4,894 4,537 8,648 20,299 6.1 24,615 7.8
Europe 15,006 13,014 13,209 53,385 15.9 49,042 15.6
Germany 5,471 5,219 4,660 21,991 6.6 19,075 6.1
France 1,474 1,497 2,103 5,814 1.7 6,242 2.0
Others 8,061 6,298 6,446 25,580 7.6 23,725 7.6
Middle East 2,095 2,401 2,337 9,745 2.9 8,694 2.8
Rest of the World 453 265 1,141 1,360 0.4 3,291 1.0
Total 91,677 86,037 90,841 334,946 100.0 313,634 100.0
Selected financial indicators - Ferrous minerals
US$ million 4Q15 3Q15 4Q14 2015 2014
Net Revenues 3,830 4,312 6,116 16,562 25,697
Costs1 (2,497) (2,447) (3,792) (10,241) (13,063)
Expenses1 120 (153) (504) (380) (1,289)
Pre-operating and stoppage expenses1 (61) (32) (48) (169) (221)
R&D expenses (27) (28) (117) (128) (329)
Dividends received 44 - 47 255 526
Adjusted EBITDA 1,409 1,652 1,702 5,899 11,321
Depreciation and amortization (388) (402) (548) (1,669) (1,930)
Adjusted EBIT 977 1,250 1,107 3,975 8,865
Adjusted EBIT margin (%) 25.5 29.0 18.1 24.0 34.5 1 Net of depreciation and amortization .
Selected financial indicators - Iron ore fines (excluding third party ores)
4Q15 3Q15 4Q14 2015 2014
Adjusted EBITDA (US$ million) 1,040 1,180 1,060 3,912 7,759
Volume Sold (Mt) 76.432 68.261 71.394 265.313 243.650
Adjusted EBITDA (US$/t) 13.61 17.29 14.84 14.75 31.85
Selected financial indicators - Pellets (excluding Samarco)
4Q15 3Q15 4Q14 2015 2014
Adjusted EBITDA (US$ million) 336 382 526 1,539 2,579
Volume Sold (Mt) 10.837 11.961 12.686 46.284 43.682
Adjusted EBITDA (US$/t) 31.00 31.94 41.46 33.24 59.04
Selected financial indicators - Iron ore fines and Pellets
4Q15 3Q15 4Q14 2015 2014
Adjusted EBITDA (US$ million) 1,376 1,562 1,586 5,451 10,338
Volume Sold (Mt) 87.269 80.222 84.080 311.598 287.332
Adjusted EBITDA (US$/t) 15.77 19.47 18.86 17.49 35.98
45
MANAGERIAL ALLOCATION CHANGES
Vale will promote changes in its reporting estimates beginning 2016. These changes will not
modify absolute cost and expense levels but will alter the allocation of costs and expenses by
nature or business segments. The main impact of these changes will be in the allocation of
costs between (i) SG&A, (ii) ICMS; and (iii) distribution costs intra business unit. The impacts
of the proposed changes are as follows:
(i) SG&A
Currently a disproportionate amount of Vale’s SG&A expenses in Brazil is allocated to the iron
ore division, more specifically to iron ore fines. Upon re-assessing the allocation of SG&A
across business segments, a decision was made on the use of different allocation criteria
from 1Q16 onwards
(ii) ICMS
ICMS is a kind of value-added tax in Brazil. Vale is exposed to different ICMS tax regimes in
the states where its operations are located. In general ICMS is credited on the acquisition of
goods and services and realized upon sales into the domestic market, negotiations of credits
with governments and third parties. Historically Vale has accumulated ICMS tax credits
without being able to use them fully since exports from Brazil are exempted from the ICMS
charge.
Given the continuous accumulation of ICMS without use, Vale periodically impairs the
excessive tax credits and records the respective losses under ‘other expenses account’.
In order to reflect the regular nature of the ICMS tax credit impairment, Vale will record them
as Cost of Goods Sold (COGS) on a more regular basis as of 1Q16, thus increasing COGS
but at the same time not charging ‘other expenses account’.
The above mentioned changes will not alter absolute levels of costs and expenses for Vale’s
business units as a whole, being only a slightly relocation of absolute amounts between
business units and from expenses to costs.
(iii) DISTRIBUTION COSTS
Currently, Vale includes its distribution costs into its C1 cash cost FOB port in Brazil.
However, a higher percentage of these distribution costs are being incurred overseas after
the implementation of the pellet plant in Oman, the distribution center in Malaysia and the
more frequent utilization of ports in China for blending iron ore.

46
In order to adjust for these recent changes in its supply chain, Vale will report the distribution
costs incurred in Oman, Malaysia, China and other facilities outside Brazil as a separate line
item, named “Distribution Costs”. Maritime freight costs and distribution costs will be reported
separately.
Iron ore fines unit cost + expenses adjusted for quality
landed in China – After accounting reporting changes
US$/t 1Q15 2Q15 3Q15 4Q15 2015
Vale's iron ore cash cost (ex-ROM, ex-royalties),
FOB (US$ /t) 18.6 16.1 13.1 12.1 14.7
Iron ore fines freight cost (ex-bunker oil hedge) 17.2 16.8 16.4 14.1 16.0
Distribution costs 0.4 0.5 0.3 0.5 0.4
Iron ore fines expenses¹ & royalties 4.6 4.2 3.6 3.9 4.1
Iron ore fines moisture adjustment 3.4 3.1 2.8 2.5 3.0
Iron ore fines quality adjustment -1.3 -2.0 -2.1 -1.1 -1.9
Iron ore fines unit cost + expenses landed in
China (US$/dmt) 42.9 38.7 34.1 32.0 36.3
¹ Net of depreciation

47
THE IMPACT OF BUNKER HEDGING ON
VALE’S FINANCIAL PERFORMANCE
The total effect of bunker oil prices on Vale’s financial performance is dependent on the bunker
oil hedge previously taken out by Vale. Vale stopped contracting bunker oil hedges since the
structural decline in oil prices, but still faces the impact of the outstanding hedge positions.
However, costs will no longer be impacted in 2016 since all outstanding bunker oil exposure
recorded under hedge accounting program was settled in 4Q15.
As previously discussed, bunker oil hedges are recorded as follows:
(i) The hedge of the bunker oil exposure associated with our FOB and domestics sales is
marked-to-market every quarter and recorded as financial results.
(ii) The hedge of the bunker oil exposure associated with our CFR sales is recorded as
hedge accounting, being marked-to-market every quarter and recorded in other
comprehensive income and impacting costs of goods sold only at the actual settlement
dates.
More specifically, the impact of the hedged positions in Vale’s results can be summarized as
follows:
(i) Impact on the financial statements related to the derivatives under Vale’s hedge
accounting program:
a. In 4Q15: freight costs increased by US$ 2.5/t with the settlement of derivatives
contracts in 4Q15, driving COGS up.
Impact of bunker oil hedging in Vale’s financial performance
Concept Current impact
Drivers of future impact
Freight contract type
Hedge accounting
Impact of derivative positions
in P/L statement
Impact incurred in 4Q15 P/L statement
Type of Instrument
Bunker oil derivative open positions
(,000 tons)
Average strike price (US$/t)
CFR Yes Impact on COGS at settlement date
US$ 2.5/t (US$ 134 million)
increase on iron ore COGS
NA 0 NA
FOB No Impact on financial
results
US$ 242 million decrease on
financial results
Forward 2,206 508
Zero Cost Collar
2,042 314 - 385

48
b. In 1Q16 and subsequent quarters: no impact
(ii) Impact on the financial statements related to the trades that are not under Vale´s
hedge accounting program:
a. In 4Q15: a negative impact of US$ 242 million recognized in 4Q15 as financial
expenses due to the realized loss on the settlements which occurred in the
quarter and on the mark-to-market of the open positions on December 31st,
2015.
b. In 1Q16 and subsequent quarters: financial results will be impacted by the
changes in the mark-to-market of the open derivative positions at the end of
each quarter and by the gains or losses related to the settlements recorded in
each quarter.

49
SAMARCO DAM FAILURE
On November 5, 2015, one of Samarco´s sand tailings dam (Fundão) failed unexpectedly,
sending 32Mm3 tailings downstream and impacting several communities including the
community at Bento Rodrigues, a small mining town of 600 people. The dam failure resulted
in 17 fatalities, with 2 people still missing, and caused extensive property and environmental
damage to the affected areas in the states of Minas Gerais and Espírito Santo.
Immediately after the dam failure, together with the Civil Defense, Fire Department, Military
Police and other authorities, Samarco provided first aid, food, water, housing, social
assistance and financial aid to hundreds of affected families and individuals. As of now,
Samarco has already: (i) finished the recovery of all the seven bridges impacted by the dam
failure; (ii) accommodated 369 families who lost their homes (100%); (iii) distributed 2,907
financial-aid cards for residents of the affected communities (75% of total affected families);
(iv) provided psychological and social support for 1,185 families; (v) distributed 553 million
liters of drinkable water and 59 million liters of mineral water. Both Vale and BHP Billiton,
Samarco’s shareholders, have been actively involved in supporting Samarco during this
crisis.
Besides the community and welfare initiatives, Samarco has been monitoring the affected
area and carrying out emergency work to contain any tailings movement, reinforcing the
dams' and dikes’ structures to ensure the safety of the region.
As well as cooperating with the investigations conducted by the Civil & Federal Police, and
also the public prosecutors, Samarco, together with its shareholders, also engaged a
specialized firm to conduct an external investigation. There is no set date for the completion
of the report, due to the complexity of the event.
In order to assess the environmental and socio-economic impacts of the dam failure and
assist in the development of a remediation plan, Samarco has engaged two external experts:
a world class consulting specialist in engineering, environment and environmental
emergencies; and another international firm specialized in environmental, health & safety,
social and security services. The above-refferred plan will also include programs for the
recovery of regional economic activity.
The impact of the dam failure on Samarco’s activities was mainly the immediate stoppage of
its mining operations in the state of Minas Gerais. Vale’s operation in the Mariana Complex,
near to Samarco’s mining area, was also negatively impacted with the destruction of a major
conveyor belt. Consequently, Vale´s production in the Mariana region was 3Mt lower in 4Q15
(which was offset by the increase in output from other mines) and will probably be 9Mt lower
in 2016 (which will be offset by the increase in output from other mines). Vale has also

50
interrupted the sale of its ROM to Samarco’s processing plant in Minas Gerais.
As a consequence of the Fundão dam failure, Samarco incurred in expenses, wrote off assets
and recognized provisions for remediation, which affected its balance sheet and income
statement. Vale accounts for Samarco’s results under the equity method, and, therefore, the
impacts of Samarco´s dam failure on Vale´s balance sheet and income statement are limited
to Vale´s interest in Samarco´s capital as per the Brazilian Corporation Law. Vale’s
investment in Samarco was reduced to zero and no liability was recognized in Vale’s financial
statements. The dam failure had no effect on Vale’s cash flow for the year ended December
31, 2015.24
.
Vale S.A. was summoned by the Federal Union, the States of Minas Gerais and Espirito
Santo, and other entities in a public civil action filed at the 12ª Vara Federal of Belo Horizonte.
The action, which was brought against Samarco S.A. (“Samarco”) and its shareholders, BHP
Billiton Brasil Ltda. (“BHP”) and Vale, requests (i) a freeze on transfer of the mining rights of
the three respondents, without, however, limiting their commercial and production activities
and (ii) remediation of the damages caused by the failure of the Samarco Fundão dam. The
claimants valued the action at R$ 20.2 billion. Vale has adopted the necessary measures to
guarantee its right of defense.
24
For more details on accounting effects, please refer to IFRS note 4.

51
Base Metals
Annual performance
Base Metals adjusted EBITDA totaled US$ 1.388 billion in 2015, representing a decrease of
US$ 1.133 billion from the US$ 2.521 billion recorded in 2014. The decrease was mainly due
to lower base metals prices (US$ 2.195 billion) and higher costs (US$ 137 million), which
were partly offset by favorable exchange rate variations (US$ 594 million) and higher volumes
(US$ 498 million).
SALES REVENUES AND VOLUME
Gross sales from base metals and their by-products totaled US$ 6.172 billion in 2015 against
US$ 7.694 billion in 2014. The decrease was mainly driven by lower nickel prices (US$ 1.394
billion) and lower copper prices (US$ 641 million), which were partially offset by higher sales
of nickel (US$ 338 million) and copper (US$ 246 million).
Nickel production achieved the new annual record of 291,000 t, 16,000 t higher than in 2014,
as a result of the higher production at VNC and Onça Puma. Copper production, supported by
Salobo’s ramp-up, totaled 423,800 t, 44,100 t higher than in 2014 and a new annual record.
Gold production reached a record 420,100 troy ounces (oz) in 2015, an all-time record, with
the continued ramp-up of Salobo.
COSTS AND EXPENSES
Base metals COGS were US$ 4.296 billion (US$ 5.863 billion including depreciation). After
adjusting for the effects of volumes (US$ 168 million) and exchange rate variations (-US$ 594
million), costs increased by US$ 137 million vs. 2014. The primary reason for the higher cost
was the increased allocation of VNC pre-operating expenses to COGS.
SG&A and other expenses, excluding depreciation, were a positive US$ 44 million in 2015
due to the positive effect of US$ 230 million from the gold stream transaction recorded in the
1Q15. SG&A and other expenses, excluding the positive effects of insurance (US$ 276
million) in 2014 and of the gold streaming transaction in 1Q15, remained stable in 2015 vs.
2014.
Pre-operating and stoppage expenses, net of depreciation, totaled US$ 412 million, US$ 117
million lower than in 2014, mainly reflecting the lower expenses with VNC (US$ 129 million)
and Salobo (US$ 15 million), which were partially offset by higher expenses in Long Harbour
(US$ 26 million).

52
Quarterly performance
Adjusted EBITDA totaled US$ 111 million in 4Q15, decreasing US$ 82 million vs. 3Q15
mainly as a result of lower prices (US$ 158 million) and the write-off of materials inventories
related to the initial construction of Onça Puma and Salobo of -US$ 31 million, which were
partly compensated by higher sales volumes (US$ 93 million) and favorable exchange rates
variation (US$ 30 million). Adjusted EBITDA was negatively impacted by VNC’s EBITDA of -
US$ 107 million and by the provisional copper price adjustments of -US$ 60 million.
SALES REVENUES AND VOLUMES
Nickel gross sales revenues totaled US$ 782 million in 4Q15, in line with 3Q15. The negative
impact of lower nickel realized prices in 4Q15 (US$ 112 million) was offset by higher sales
volumes (US$ 109 million). Sales volumes were 84 kt in 4Q15, 12 kt higher than in 3Q15.
Copper gross sales revenues totaled US$ 413 million in 4Q15, increasing 12.2% vs. 3Q15,
mainly as a result of higher volumes (US$ 54 million). Copper sales volumes totaled 108 kt in
4Q15 vs. 94 kt in 3Q15.
PGMs (platinum group metals) gross sales revenues totaled US$ 96 million in 4Q15,
increasing 62.7% vs. 3Q15, due to higher sales volumes of 140 koz in 4Q15 vs. 83 koz in
3Q15. PGMs sales volumes increased as Sudbury operated without the major maintenance
stoppage which occurred in the third quarter.
Gold gross sales revenues totaled US$ 122 million in 4Q15, 6.1% higher than in 3Q15 as a
result of higher sales volumes of 114 koz in 4Q15 vs. 105 koz in 3Q15.
Gross operating revenue by product
US$ million 4Q15 3Q15 4Q14 2015 2014
Nickel 782 785 1,064 3,412 4,468
Copper 413 368 556 1,728 2,122
PGMs 96 59 152 404 564
Gold 122 115 115 477 418
Silver 8 7 11 31 37
Others 37 22 50 120 85
Total 1,458 1,355 1,948 6,172 7,694
NICKEL REALIZED PRICES
Nickel realized price was US$ 9,310/t, US$ 127/t lower than the average nickel LME price of
US$ 9,437/t in 4Q15.
Vale’s nickel products are divided in two categories, refined nickel (pellets, powder, cathode,
FeNi, Utility Nickel™ and Tonimet™) and intermediates (concentrates, matte, NiO and NHC).

53
Refined nickel products have greater nickel content, typically commanding a premium over
the average LME nickel price, whereas nickel intermediates are less pure as they are only
partially processed. Due to this difference, intermediate products are sold at a discount. The
amount of the discount will vary depending on the amount of processing still required, product
forms and level of impurities. The sales product mix is also an important driver of nickel price
realization. Refined nickel sales accounted for 87% of total nickel sales in 4Q15; with
intermediate sales accounting for the balance. This was the same ratio as in 3Q15.
The realized nickel price differed from the average LME price in 4Q15 based on the following
impacts:
Premium for refined finished nickel products averaging US$ 313/t, with an impact on
the aggregate realized nickel price of US$ 270/t;
Discount for intermediate nickel products averaging US$ 2,943/t, with an impact on
the aggregate realized nickel price of -US$ 397/t.
Price realization - nickel
COPPER REALIZED PRICES
Copper realized price was US$ 3,824/t, US$ 1,068/t lower than the average copper LME price
of US$ 4,892/t in 4Q15. Vale’s copper products are mostly intermediate forms of copper,
predominately in the form of concentrate which is sold at a discount to the LME. These

54
products are sold on provisional pricing during the quarter with final prices determined at a
future period, generally one to four months forward25
.
The realized copper price differed from the average LME price in 4Q15 based on the following
impacts:
Current period price adjustments: mark-to-market of invoices still open in the quarter
based on the copper price forward curve26
at the end of the quarter (-US$ 317/t).
Prior period price adjustments: variance between the price used in final invoices (and
on the mark-to-market of invoices from previous quarters still open at the end of the
current quarter) and the provisional prices used for sales in previous quarters (US$ -
239/t).
TC/RCs, penalties, premiums and discounts for intermediate products (-US$ 512/t).
Price realization – copper
The total impact of the provisional pricing system (mark-to-market of open invoices and
differences between provisional and final prices) on sales revenues was US$ 60 million as the
net result of: (i) current period price adjustment for the mark-to-market of invoices still open in
the quarter based on the copper price forward curve (-US$ 317/t on 108 kt27
of copper sales
volumes, resulting in -US$ 34 million); and (ii) prior period price adjustment based on the
variance between the price used in final invoices and provisional prices used in previous
quarters (-US$ 239/t on 108 kt of copper sales volumes, resulting in -US$ 26 million).
25
At December 31, 2015 Vale had provisionally priced copper sales totaling 81,229 tons valued at a LME forward price of
US$ 4,710/t, subject to final pricing over the next several months.
26 Includes a small amount of final invoices that were provisionally priced and settled within the quarter .
27 Copper production includes 43 kt in North Atlantic nickel operations and 65 kt in South Atlantic copper operatio ns.

55
Average sale price
US$/ metric ton 4Q15 3Q15 4Q14 2015 2014
Nickel - LME 9,437 10,561 15,799 11,807 16,867
Copper - LME 4,892 5,259 6,624 5,494 6,862
Nickel 9,310 10,866 15,420 11,684 16,426
Copper 3,824 3,892 5,842 4,353 6,015
Platinum (US$/oz) 818 1,005 1,225 1,020 1,262
Gold (US$/oz) 1,064 1,095 1,190 1,123 1,193
Silver (US$/oz) 10.00 13.49 14.16 12.63 19.42
Cobalt (US$/lb) 8.55 14.54 9.34 9.95 10.67
PRODUCTION PERFORMANCE
Nickel production reached a quarterly record of 82,700 t in 4Q15, being 15.4% higher than in
3Q15, as a result of higher finished nickel production from the operations in Canada,
Indonesia, New Caledonia and Brazil.
Copper production reached the quarterly record of 112,500 t in 4Q15, being 13.4% higher
than in 3Q15, as a result of the higher copper production from the Canadian operations and
the ramp-up of Salobo II.
Gold production reached the quarterly record of 117,500 oz in 4Q15, being 17.6% higher than
in 3Q15, as a result of Salobo’s ongoing ramp-up.
Volume sold
‘000 metric tons 4Q15 3Q15 4Q14 2015 2014
Nickel operations & by products
Nickel 84 72 69 292 272
Copper 43 32 37 148 156
Gold ('000 oz) 15 15 20 79 103
Silver ('000 oz) 582 374 574 1,655 1,431
PGMs ('000 oz) 140 83 168 519 577
Cobalt (metric ton) 1,433 468 1,311 3,840 3,188
Copper operations & by products
Copper 65 62 58 249 197
Gold ('000 oz) 99 90 76 346 248
Silver ('000 oz) 178 154 182 648 458
COSTS AND EXPENSES
Costs totaled US$ 1.131 billion in 4Q15 (or US$ 1.551 billion including depreciation). After
adjusting for the effects of higher sales volumes (US$ 168 million) and exchange rate
variations (-US$ 30 million), costs decreased by US$ 45 million vs. 3Q15, mainly due to the
higher dilution of fixed costs in Sudbury (US$ 42 million).
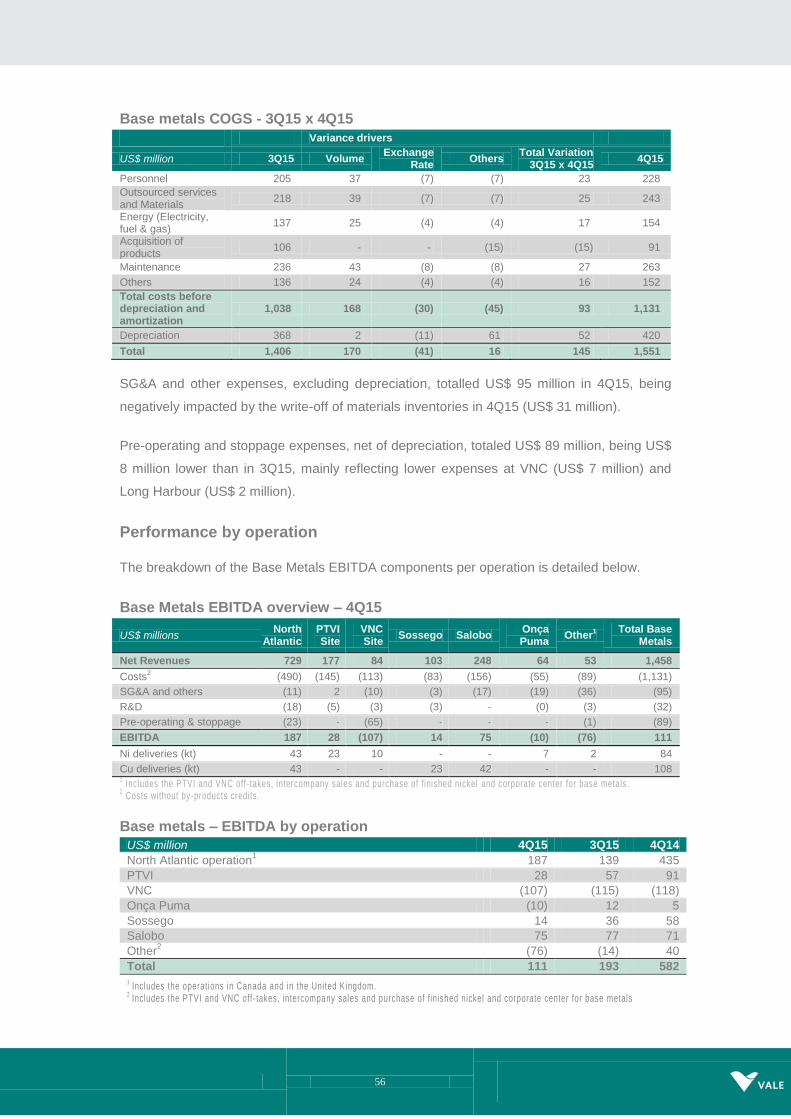
56
Base metals COGS - 3Q15 x 4Q15
Variance drivers
US$ million 3Q15 Volume Exchange
Rate Others
Total Variation 3Q15 x 4Q15
4Q15
Personnel 205 37 (7) (7) 23 228
Outsourced services and Materials
218 39 (7) (7) 25 243
Energy (Electricity, fuel & gas)
137 25 (4) (4) 17 154
Acquisition of products
106 - - (15) (15) 91
Maintenance 236 43 (8) (8) 27 263
Others 136 24 (4) (4) 16 152
Total costs before depreciation and amortization
1,038 168 (30) (45) 93 1,131
Depreciation 368 2 (11) 61 52 420
Total 1,406 170 (41) 16 145 1,551
SG&A and other expenses, excluding depreciation, totalled US$ 95 million in 4Q15, being
negatively impacted by the write-off of materials inventories in 4Q15 (US$ 31 million).
Pre-operating and stoppage expenses, net of depreciation, totaled US$ 89 million, being US$
8 million lower than in 3Q15, mainly reflecting lower expenses at VNC (US$ 7 million) and
Long Harbour (US$ 2 million).
Performance by operation
The breakdown of the Base Metals EBITDA components per operation is detailed below.
Base Metals EBITDA overview – 4Q15
US$ millions North
Atlantic PTVI Site
VNC Site
Sossego Salobo Onça Puma
Other1
Total Base Metals
Net Revenues 729 177 84 103 248 64 53 1,458
Costs2 (490) (145) (113) (83) (156) (55) (89) (1,131)
SG&A and others (11) 2 (10) (3) (17) (19) (36) (95)
R&D (18) (5) (3) (3) - (0) (3) (32)
Pre-operating & stoppage (23) - (65) - - - (1) (89)
EBITDA 187 28 (107) 14 75 (10) (76) 111
Ni deliveries (kt) 43 23 10 - - 7 2 84
Cu deliveries (kt) 43 - - 23 42 - - 108 1 Includes the PTVI and VNC off - takes, intercompany sales and purchase of f inished nickel and corporate center for base metals .
2 Costs without by-products credi ts.
Base metals – EBITDA by operation
US$ million 4Q15 3Q15 4Q14
North Atlantic operation1 187 139 435
PTVI 28 57 91
VNC (107) (115) (118)
Onça Puma (10) 12 5
Sossego 14 36 58
Salobo 75 77 71
Other2 (76) (14) 40
Total 111 193 582
1 Includes the operations in Canada and in the United Kingdom.
2 Includes the PTVI and VNC off - takes, intercompany sales and purchase of finished nickel and corporate center for base metals

57
Base metals – EBITDA per ton by operation
EBITDA
Details of Base Metals’ adjusted EBITDA by operations are as follows:
(i) North Atlantic operations’ EBITDA was US$ 187 million, increasing by US$ 48 million
compared with 3Q15 mainly as a result of lower costs and expenses (US$ 81 million)
and higher volumes (US$ 66 million) partially offset by lower prices (US$ 91 million).
(ii) PTVI’s EBITDA was US$ 28 million, decreasing US$ 29 million vs. 3Q15 mainly as a
result of lower prices (US$ 30 million) while costs and expenses remained stable in
4Q15 vs 3Q15.
(iii) VNC's EBITDA was -US$ 107 million, increasing US$ 8 million vs. 3Q15 mainly as a
result of lower costs and expenses (US$ 13 million).
(iv) Onça Puma’s EBITDA was -US$ 10 million, decreasing by US$ 22 million vs. 3Q15
as a result of higher expenses (US$ 25 million), which was primarily associated with a
one-time inventory write-off of US$ 16 million related to materials purchased for initial
construction.
(v) Sossego’s EBITDA was US$ 14 million, decreasing by US$ 22 million mainly as a
result of higher costs and expenses (US$ 22 million) related to a 10.2% production
decline due to lower grades and an inventory write-off of US$ 2 million.
(vi) Salobo’s EBITDA was US$ 75 million, decreasing by US$ 2 million vs. 3Q15 mainly
as a result of a one-time materials inventory write-off related to material purchased for
the initial construction (US$ 13 million) and lower sales prices (US$ 3 million). These
negative impacts were partially offset by higher sales volumes (US$ 17 million) and
positive exchange rate impacts (US$ 12 million).
Unit cash cost in the North Atlantic Operations decreased in 4Q15 due to higher sales
volumes, higher by-product deliveries and the dilution of fixed costs. Cash cost in Onça Puma
was positively impacted by the depreciation of the BRL. Sossego’s costs increased due to
lower copper grades.
US$ million 4Q15 3Q15 4Q14
North Atlantic operation1 2,179 1,961 5,764
PTVI 1,231 2,543 4,483
Onça Puma (1,405) 2,291 1,000
Sossego 614 1,397 2,191
Salobo 1,790 2,099 2,240 1 Includes the operations in Canada and in the United Kingdom.

58
Base Metals – unit cash cost of sales, net of by-product credits1
As previously reported, VNC was subject to a production test that it had to meet by December
31, 2015 pursuant to the shareholder’s agreement between Vale and Sumic Nickel
Netherlands B.V., (Sumic) a joint venture between Sumitomo Metal Mining Co., Ltd. and
Mitsui & Co., Ltd,. While VNC set a new production record in the fourth quarter producing
9,600 t of nickel, it did not achieve the threshold required for Sumic to remain a shareholder in
VNC. With respect to the test which had a nickel oxide threshold and a total nickel threshold,
VNC achieved 93% of the target nickel oxide level and 77% of the total nickel target. Sumic
will exit VNC by March 31, 2016 and Vale will pay them proceeds of US$ 135 million in March
2017 for their equity stake. Vale will then hold 95% of the shares of VNC. A further US$ 218
million is due to Sumic in March 2017 for debt funding they provided to VNC.
Market outlook – base metals
Base metal prices were negatively impacted in the fourth quarter reflecting decelerating
growth of Chinese industrial production and consumer spending.
NICKEL
LME cash nickel prices declined steadily over 4Q15 mainly due to weakening demand in
China which resulted in continued decline in stainless steel production. LME prices averaged
US$ 9,437/t in the quarter, representing a 10.6% decline vs. 3Q15 and a 40.3% decline vs.
4Q14. Total nickel inventories in major exchanges increased from 478kt at the end of 3Q15 to
493kt at the end of 4Q15, as inventory was added to the SHFE.
Ore shipments from the Philippines into China declined 1.7Mt (18%) in 4Q15 vs. 4Q14 while
ore inventories declined 1.2Mt during the fourth quarter, suggesting lower NPI production.
Net imports of finished nickel into China remained relatively high with 91kt being imported in
4Q15 vs. exports of 2.7kt for the same period of 2014. Ferronickel net imports in 4Q15 were
also high, with 28kt contained Ni vs. 20kt in 4Q14.
While the duration of the current price weakness is uncertain, at these prices well over half of
nickel operations have negative cash flows. Global supply is anticipated to decline in 2016 led
by falling NPI production and an anticipated fall in non-China refined production as producers
US$ / t 4Q15 3Q15 4Q14
Nickel
North Atlantic Operations (nickel) 3,582 6,242 5,267
PTVI (nickel) 6,326 6,157 7,990
Onça Puma (nickel) 7,710 8,596 13,831
Copper
Sossego (copper) 2,840 2,301 3,668
Salobo (copper) 1,571 1,520 2,218 1 North Atlantic figures include Clydach and Acton refining cos ts while PTVI only includes the standalone operation .

59
become unable to sustain losses. Relatively flat demand outlook coupled with reduced
production should positively impact prices as the market moves into a deficit in 2016.
COPPER
LME cash copper prices also declined in 4Q15 averaging US$ 4,892/t. Prices declined 7% vs.
3Q15 and 26% vs. 4Q14. Inventories on all three major exchanges declined over the quarter
with total exchange inventories ending the quarter at 484kt from 520kt at the beginning.
Copper concentrate imports into China have been strong, having increased 11% in 2015
year-over-year vs. 2014 while refined copper imports decreased slightly (-0.6%) in 2015 year-
over-year vs. 2014. Over 100kt of price related supply cuts were announced in the fourth
quarter along with the postponement of several projects, including expansion projects for key
copper mines in Latin America. However, over the same period additional copper units were
added to supply resulting in a net increase year-over-year moving the market into surplus for
2015. In 2016, with relatively flat demand outlook the market is expected to remain in surplus.
Selected financial indicators - Base Metals
US$ million 4Q15 3Q15 4Q14 2015 2014
Net Revenues 1,458 1,347 1,953 6,163 7,692
Costs¹ (1,131) (1,038) (1,205) (4,296) (4,587)
Expenses¹ (95) 7 15 44 89
Pre-operating and stoppage expenses¹ (89) (97) (136) (412) (530)
R&D expenses (32) (26) (45) (111) (143)
Adjusted EBITDA 111 193 582 1,388 2,521
Depreciation and amortization (484) (437) (563) (1,840) (1,791)
Adjusted EBIT (373) (244) 19 (452) 730
Adjusted EBIT margin (%) (25.6) (18.1) 1.0 (7.3) 9.5
¹ Net of depreciation and amortization

60
Coal
Annual performance
Adjusted EBITDA for the Coal business segment was negative US$ 508 million in 2015,
compared to negative US$ 669 million in 2014. The increase of US$ 161 million was mainly
driven by the stoppage of the Integra and Isaac Plains operations, by lower expenses and by
the Australian Dollar devaluation, which were partly offset by lower prices.
Gross sales revenues of metallurgical coal decreased to US$ 480 million in 2015, compared
to US$ 661 million in 2014. The decrease of US$ 181 million was driven by lower prices (US$
108 million) and by lower sales volumes (US$ 73 million) in 2015 as a result of the stoppage
of Integra and Isaac Plains. Gross sales revenues of thermal coal decreased to US$ 46
million in 2015 from US$ 78 million in 2014, as a result of lower prices (US$ 12 million) and
lower sales volumes (US$ 20 million).
Sales volumes of metallurgical coal reached 5.6 Mt in 2015 decreasing by 716 kt vs. 2014,
while sales volumes of thermal coal reached 892 kt in 2015, 260 kt lower than in 2014 as a
result of the above-mentioned stoppage of the Integra and Isaac Plains operations.
Coal costs amounted to US$ 839 million (or US$ 977 million with depreciation charges) in
2015, decreasing US$ 232 million in comparison with the US$ 1.071 billion recorded in 2014.
After adjusting for the effects of lower volumes (US$ 134 million) and for the AUD
depreciation (US$ 84 million), costs decreased by US$ 14 million.
Coal expenses, excluding depreciation charges, decreased by US$ 142 million from US$ 365
million in 2014 to US$ 223 million in 2015. The decrease was mainly due to lower inventory
adjustments on thermal coal in Mozambique.
Annual performance by operation
Highlights by operation are:
Australia
Adjusted EBITDA for the Australian operations was negative US$ 28 million in 2015
compared to the negative US$ 191 million in 2014. The increase of US$ 163 million
vs. 2014 was mainly driven by the above-mentioned stoppage of the non-profitable
operations of Isaac Plains and Integra, as well as the good operational performance
of Carborough Downs, partly offset by lower prices, the write-down of assets and the
write-down of mine development expenses.
Free Cash Flow for the Australian operations totaled US$ 24 million in 2015, after
deducting the above-mentioned non-cash write-down events.

61
Costs net of depreciation for the Australian operations amounted to US$ 256 million
in 2015, decreasing by US$ 261 million vs. 2014. After adjusting for the effects of
lower volumes (-US$ 134 million) and the AUD depreciation (-US$ 84 million), costs
decreased by US$ 43 million as a result of the above-mentioned stoppage of Integra
and Isaac Plains, as well as the good operational performance and cost reduction
initiatives in Carborough Downs.
Mozambique
Adjusted EBITDA for the Mozambique operations was negative US$ 508 million in
2015 in line with the negative US$ 506 million registered in 2014. The negative
impact of lower prices was mainly offset by lower expenses.
Mozambique costs, net of depreciation, amounted to US$ 583 million in 2015,
increasing by US$ 29 million, mainly as a result of the waste removal brought forward
during the plant shutdown held in the third quarter and higher maintenance costs,
which were partly offset by lower logistics costs.
Quarterly performance
Adjusted EBITDA for the Coal business segment was negative US$ 149 million in 4Q15,
compared to negative US$ 129 million in 3Q15. The decrease of US$ 20 million was mainly
driven by lower prices and higher costs in Australia.
Gross sales revenues of metallurgical coal decreased to US$ 98 million in 4Q15, compared to
US$ 115 million in 3Q15. The decrease of US$ 17 million was driven by lower prices (US$ 11
million) and by lower sales volumes (US$ 6 million) in 4Q15 as a result of a longwall move at
Carborough Downs. Gross sales revenues of thermal coal decreased to US$ 10 million in
4Q15 from US$ 12 million in 3Q15, as a result of lower prices (US$ 1 million) and lower sales
volumes (US$ 1 million).
Sales volumes of metallurgical coal reached 1.329 Mt in 4Q15 decreasing by 90 kt vs. 3Q15,
mainly due to the above-mentioned longwall move at Carborough Downs. The decrease was
partly offset by higher sales volumes from Mozambique. Sales volumes of thermal coal
reached 226 kt in 4Q15, 17 kt lower than in 3Q15 as a result of the priority given to haul
metallurgical coal.
Coal costs totaled US$ 260 million (or US$ 296 million with depreciation charges) in 4Q15,
increasing US$ 53 million in comparison with the US$ 207 million recorded in 3Q15. After
adjusting for the effects of lower volumes in Australia (-US$ 23 million) and of higher volumes
in Mozambique (US$ 28 million), costs increased by US$ 48 million, mainly due to the one-off
effect of the write-down of mine development expenses in Australia.

62
Coal expenses, excluding depreciation charges, decreased by US$ 24 million from US$ 49
million in 3Q15 to US$ 25 million in 4Q15. The decrease was mainly due to the positive
impact of the final settlement of an insurance claim in Australia.
Quarterly performance by operation
Highlights by operation are:
Australia
Adjusted EBITDA for the Australian operations was negative US$ 33 million in 4Q15
compared to the negative US$ 4 million in 3Q15. The decrease of US$ 29 million vs.
3Q15 was mainly driven by the above-mentioned write-down of mine development
expenses at Carborough Downs.
Costs net of depreciation for the Australian operations totaled US$ 84 million in 4Q15,
increasing by US$ 25 million vs. 3Q15. After adjusting for the effects of lower
volumes (-US$ 23 million), costs increased by US$ 48 million as a result of the
above-mentioned write-down at Carborough Downs.
Free Cash Flow for the Australian operations totaled US$ 8 million in 4Q15.
Mozambique
Adjusted EBITDA for the Mozambique operations was negative US$ 144 million in
4Q15 compared to the negative US$ 125 million in 3Q15. The decrease of US$ 19
million vs. 3Q15 was mainly driven by lower prices.
Mozambique costs net of depreciation amounted to US$ 176 million in 4Q15,
increasing by US$ 28 million vs. 3Q15, driven by higher volumes.
Market outlook - metallurgical coal
Prices for the low volatility premium hard coking coal benchmark FOB Australia fell 8.9% from
US$ 89/t in 3Q15 to US$81/t in 4Q15, while prices for PCI dropped 2.8%, from US$ 71/t in
3Q15 to US$ 69/t in 4Q15.
Chinese seaborne demand decreased by 22% to 48Mt in 2015 compared to 62Mt in 2014.
This decrease was partially offset by a 14% increase in Indian demand which increased from
40Mt in 2014 to roughly 46Mt in 2015. Global metallurgical imports declined 4% on a
worldwide basis in 2015 further pressuring coal prices.
Australian producers benefited from low freight rates and increased sales into the Atlantic
market. Preliminary data shows that Australian exports of metallurgical coal totaled 186Mt in

63
2015 (slightly less than in 2014), while US exports totaled 38Mt, (28% lower than in 2014).
Further supply cuts are expected with the consolidation of US producers, whereas currency
depreciation in other exporting countries slowed down supply reductions outside the US.
Demand will most likely remain subdued with additional supply curtailments being the focus of
2016.
Coal business performance
Gross operating revenue by product
US$ million 4Q15 3Q15 4Q14 2015 2014
Metallurgical coal 98 115 181 480 661
Thermal coal 10 12 20 46 78
Total 108 127 201 526 739
Average sale price
US$/ metric ton 4Q15 3Q15 4Q14 2015 2014
Metallurgical coal 73.75 81.22 99.72 85.55 104.37
Thermal coal 44.19 48.24 64.52 52.42 67.65
Volume sold
‘000 metric tons 4Q15 3Q15 4Q14 2015 2014
Metallurgical coal 1,329 1,419 1,815 5,614 6,330
Thermal coal 226 243 310 891 1,152
Total 1,555 1,662 2,125 6,505 7,482
Selected financial indicators - Coal
US$ million 4Q15 3Q15 4Q14 2015 2014
Net Revenues 108 127 201 526 739
Costs¹ (260) (207) (249) (839) (1.071)
Expenses¹ (9) (17) (164) (140) (309)
Pre-operating and stoppage expenses¹ (12) (25) (10) (61) (38)
R&D expenses (4) (7) (10) (22) (18)
Dividends received 28 - 28 28 28
Adjusted EBITDA (149) (129) (204) (508) (669)
Depreciation and amortization (41) (80) (36) (192) (120)
Adjusted EBIT (218.0) (209.0) (268.0) (728.0) (817.0)
Adjusted EBIT margin (%) (202) (165) (133) (138) (111)
¹ Net of depreciation and amortization .

64
Fertilizer nutrients
Annual performance
Adjusted EBITDA for the Fertilizer business segment increased to US$ 567 million in 2015
from US$ 278 million in 2014. The increase of US$ 289 million from 2014 was driven by: (i)
exchange rate (US$ 248 million); (ii) cost saving initiatives (US$ 83 million); (iii) gains on
realized price due to commercial initiatives (US$ 74 million); and (iv) expense reductions28
(US$ 45 million). The increase was partly offset by: (i) inflation (US$ 79 million)29
; (ii) lower
volumes (US$ 37 million); (iii) higher R&D expenses30
(US$ 23 million) and (iv) lower market
prices (US$ 22 million).
Potash gross sales revenues totaled US$ 147 million in 2015, decreasing by US$ 22 million in
2015 vs. 2014. Sales volumes decreased from 475 kt in 2014 to 463 kt in 2015, due to lower
grades at the mine, which impacted production. Realized prices decreased from US$ 356/t in
2014 to US$ 318/t in 2015, alongside the reduction of the international potash prices.
Phosphate products gross sales revenues totaled US$ 1.818 billion in 2015, US$ 86 million
lower than in 2014 as a result of lower sales volumes (US$ 39 million) and of lower realized
prices (US$ 47 million), which were impacted by the reduction of international prices.
Nitrogen fertilizers gross sales revenues totaled US$ 355 million in 2015 vs. US$ 411 million
in 2014, as a result of lower sales volumes (US$ 28 million) and lower sales prices (US$ 28
million).
Despite the reduction in sales volumes in 2015, the Fertilizer business segment increased its
market share in Brazil.
Fertilizer costs, net of depreciation, totaled US$ 1.469 billion in 2015 (or US$ 1.763 billion
with depreciation charges), decreasing by US$ 416 million vs. 2014. After excluding the
effects of lower volumes (-US$ 60 million) and exchange rate variations (-US$ 343 million),
costs decreased US$ 13 million, as cost saving initiatives (US$ 83 million) were partly offset
by inflation (US$ 70 million).
SG&A and Other expenses, net of depreciation, decreased to US$ 37 million in 2015 from
US$ 95 million in 2014, due to the BRL depreciation (US$ 19 million) and downsizing
initiatives (US$ 30 million), which were partly offset by inflation (US$ 9 million). R&D
expenses totaled US$ 82 million in 2015, increasing 14% from the US$ 72 million recorded in
2014, mainly due to higher expenditures with the Kronau project study. Pre-operating and 28
SG&A and Other expenses, pre operational and stoppage expenses, a fter adjusting for the effect of exchange rates.
29 Includes US$ 96 million of inflation on costs, -US$26 million of ammonia and sulphur price decreases and US$ 9 million of
inflation in expenses.
30 After adjusting for the effect of exchange rates.

65
stoppage expenses totaled US$ 70 million in 2015, decreasing US$ 15 million vs. 2014,
mainly as a result of a reduction in stoppage expenses (US$ 17.5 million).
Quarterly performance
Adjusted EBITDA for the Fertilizer business segment decreased to US$ 117 million in 4Q15
from US$ 197 million in 3Q15. The decrease of US$ 80 million from 3Q15 was mainly driven
by lower volumes (US$ 86 million), following the usual seasonality.
Potash gross sales revenues totaled US$ 33 million in 4Q15, decreasing by US$ 14 million in
4Q15 vs. 3Q15. Sales volumes decreased from 155 kt in 3Q15 to 114 kt in 4Q15, due to
typical market seasonality. Realized prices decreased from US$ 302/t in 3Q15 to US$ 293/t in
4Q15, alongside the reduction of international potash prices.
Phosphate products gross sales revenues totaled US$ 387 million in 4Q15, US$ 201 million
lower than in 3Q15 as a result of lower sales volumes. Sales volumes decreased due to
usual market seasonality.
Nitrogen fertilizers gross sales revenues totaled US$ 76 million in 4Q15 vs. US$ 92 million in
3Q15, mainly as a result of lower sales volumes.
Fertilizer costs, net of depreciation, totaled US$ 319 million in 4Q15 (or US$ 386 million with
depreciation charges), decreasing US$ 125 million vs. 3Q15. After excluding the effects of
lower volumes (-US$ 130 million) and exchange rate variations (-US$ 19 million), costs
increased by US$ 24 million, mainly as a result of idle capacity (US$ 10 million), inventory
adjustments (US$ 6 million) and higher taxes on freight (US$ 3 million).
SG&A and Other expenses, net of depreciation, increased to US$ 14 million in 4Q15 from
US$ 5 million in 3Q15. R&D expenses totaled US$ 22 million in 4Q15, in line with US$ 23
million recorded in 3Q15. Pre-operating and stoppage expenses totaled US$ 9 million in
4Q15, decreasing US$ 20 million vs. 3Q15, mainly as a result of a reduction in stoppage
expenses.
Market outlook - fertilizer nutrients
Fertilizers posted another quarter of lackluster demand as a result of lower than expected
agricultural commodities prices. Demand in Brazil was further undermined by the depreciation
of the BRL against the USD and the shortage of credit to farmers. Demand in India was
negatively impacted by the consumption of inventories.
The phosphate and nitrogen market remained weak with supply reductions not matching
demand slowdowns. Lower phosphate demand also reduced demand for sulphur and
ammonia, the most relevant raw materials for the production of nitrogen and phosphate

66
products. Altogether the conditions in these segments will establish a lower pricing level for
the nitrogen and phosphate markets.
The potash market remained oversupplied with still sluggish demand. However, supported by
the annual contracts agreed with Chinese purchasers in the beginning of each year, prices of
potash fertilizers remained relatively high for the current market conditions, prompting buyers
to wait for the new, upcoming price negotiations.
Looking forward, consumption may remain weak, especially in Brazil, as fertilizer buyers
continue to postpone purchases with the hope of credit recovery and higher agricultural
commodities prices. The potash market may come to balance in the short term with
production cuts and no additional capacity installed in 2015. The phosphate market may also
improve with production cuts.
Fertilizers COGS – 3Q15 x 4Q15
Variance drivers
US$ million 3Q15 Volume Exchange
Rate Others
Total Variation 3Q15 x 4Q15
4Q15
Personnel 73 (18) (6) 1 (23) 50
Outsourced services and Materials
269 (69) (8) (9) (86) 183
Energy (Electricity, fuel & gas)
56 (16) (3) - (19) 37
Maintenance 23 (4) (1) - (5) 18
Others 23 (23) (1) 32 8 31
Total costs before depreciation and amortization
444 (130) (19) 24 (125) 319
Depreciation 93 (25) (6) 5 (26) 67
Total 537 (155) (25) 29 (151) 386
Fertilizer nutrients business performance
Gross operating revenue by product
US$ million 4Q15 3Q15 4Q14 2015 2014
Potash 33 47 45 147 169
Phosphates 387 588 432 1,818 1,904
Nitrogen 76 92 108 355 411
Others 17 20 22 66 101
Total 513 747 607 2,386 2,585
Average sale price
US$/ metric ton 4Q15 3Q15 4Q14 2015 2014
Potash 293.08 302.42 371.90 318.32 355.79
Phosphates
MAP 496.45 505.21 550.70 511.70 542.44
TSP 394.48 391.50 448.41 398.05 428.98
SSP 212.88 197.17 217.14 204.45 212.61
DCP 514.90 536.10 584.94 554.88 591.51
Phosphate rock 81.73 78.02 88.77 82.55 70.88
Nitrogen 490.89 497.96 627.91 554.11 604.41

67
Volume sold
‘000 metric tons 4Q15 3Q15 4Q14 2015 2014
Potash 114 155 121 463 475
Phosphates
MAP 266 348 249 1,081 1,040
TSP 113 317 112 744 749
SSP 317 740 367 1,847 2,091
DCP 119 118 118 459 493
Phosphate rock 811 769 935 3,193 3,259
Others phosphates 68 74 71 330 271
Nitrogen 154 185 172 641 680
Selected financial indicators - Fertilizers
US$ million 4Q15 3Q15 4Q14 2015 2014
Net Revenues 481 698 569 2.225 2.415
Costs¹ (319) (444) (411) (1,469) (1,885)
Expenses¹ (14) (5) (29) (37) (95)
Pre-operating and stoppage expenses¹ (9) (29) (34) (70) (85)
R&D expenses (22) (23) (20) (82) (72)
Adjusted EBITDA 117 197 75 567 278
Depreciation and amortization (67) (99) (88) (310) (419)
Adjusted EBIT 50 98 (13) 257 (141)
Adjusted EBIT margin (%) 10.4 14.0 (2.3) 11.6 (5.8)
¹ Net of depreciation and amortization .

68
FINANCIAL INDICATORS OF NON-
CONSOLIDATED COMPANIES
For selected financial indicators of the main non-consolidated companies, see our quarterly
financial statements on www.vale.com / Investors / Information for the market / Financial
statements.
CONFERENCE CALL AND WEBCAST
Vale will host two conference calls and webcasts on Thursday, February 25th. The first, in
Portuguese (without translation), will begin at 10:00 a.m. Rio de Janeiro time. The second, in
English, at 12:00 p.m. Rio de Janeiro time, 10:00 a.m. US Eastern Daylight Time, 3:00 p.m.
British Standard Time, and 11:00 p.m. Hong Kong time.
Dial in to conference calls/webcasts:
In Portuguese:
Participants from Brazil: (55 11) 3193-1001 or (55 11) 2820-4001
Participants from the US: (1 888) 700-0802
Participants from other countries: (1 786) 924-6977
Access code: VALE
In English:
Participants from Brazil: (55 11) 3193-1001 or (55 11) 2820-4001
Participants from the U.S.: (1 866) 262-4553
Participants from other countries: (1 412) 317-6029
Access code: VALE
Instructions for participation will be available on the website: www.vale.com/Investors. A
recording will be available on Vale’s website for 90 days as of February 25th, 2016.
This press release may include statements that present Vale's expectations about future events or results. All statements,
when based upon expectations about the future and not on historical facts, involve various risks and uncertainties. Vale
cannot guarantee that such statements will prove correct. These risks and uncertainties include factors related to the
following: (a) the countries where we operate, especially Brazil and Canada; (b) the global economy; (c) the capital markets;
(d) the mining and metals prices and their dependence on global industrial production, which is cyclical by nature; and (e)
global competition in the markets in which Vale operates. To obtain further information on factor s that may lead to results
different from those forecast by Vale, please consult the reports Vale files with the U.S. Securities and Exchange Commission
(SEC), the Brazilian Comissão de Valores Mobiliários (CVM), the French Autorité des Marchés Financiers (AMF), and The
Stock Exchange of Hong Kong Limited, and in particular the factors discussed under “Forward -Looking Statements” and “Risk
Factors” in Vale’s annual report on Form 20 -F.

69
ANNEX 1 – SIMPLIFIED FINANCIAL
STATEMENTS Income statement
US$ million 4Q15 3Q15 4Q14 2015 2014
Gross operating revenues 5,986 6,618 9,226 26,047 38,236
Net operating revenue 5,899 6,505 9,072 25,609 37,539
Cost of goods sold (5,119) (5,040) (6,892) (20,513) (25,064)
Gross profit 780 1,465 2,180 5,096 12,475
Gross margin (%) 13.2 22.5 24.0 19.9 33.2
Selling, general and administrative expenses (167) (131) (306) (652) (1,099)
Research and development expenses (119) (121) (235) (477) (734)
Pre-operating and stoppage expenses (238) (266) (292) (1,027) (1,088)
Other operational expenses 64 (113) (491) (206) (1,057)
Gain (loss) from sale of assets (29) (48) (167) 61 (167)
Impairment of non-current assets (8,926) - (378) (8,926) (1,152)
Operating profit (8,635) 786 311 (6,131) 7,178
Financial revenues 80 92 55 268 401
Financial expenses (326) (352) (502) (1,112) (2,936)
Gains (losses) on derivatives, net 426 (1,799) (1,087) (2,477) (1,334)
Monetary and exchange variation 173 (5,117) (1,257) (7,480) (2,200)
Equity income (37) (349) 31 (439) 505
Results on sale or write-off of investments from associates and joint ventures
- - 31 97 (30)
Impairment on investments from association and joint ventures
(446) - (31) (446) (31)
Income (loss) before taxes (8,765) (6,739) (2,449) (17,720) 1,553
Current tax (152) (100) 363 (389) (1,051)
Deferred tax 74 4,603 106 5,489 (149)
Net Earnings (loss) from continuing operations (8,843) (2,236) (1,980) (12,620) 353
Loss attributable to noncontrolling interest 274 119 131 491 304
Net earnings (attributable to the Company's stockholders)
(8,569) (2,117) (1,849) (12,129) 657
Earnings (loss) per share (attributable to the Company's stockholders - US$)
(1.66) (0.41) (0.36) (2.35) 0.13
Diluted earnings (loss) per share (attributable to the Company's stockholders - US$)
(1.66) (0.41) (0.36) (2.35) 0.13
Equity income (loss) by business segment
US$ million 4Q15 3Q15 4Q14 2015 % 2014 %
Ferrous minerals 44 (65.0) 86 26 (5.9) 652 129.1
Coal 3 (9.0) 5 (3) 0.7 32 6.3
Base metals (99) (10.0) (10) (132) 30.1 (36) (7.1)
Logistics - - - - - 13 2.6
Steel (21) (282.0) (3) (414) 94.3 (92) (18.2)
Others 36 17.0 (47) 84 (19.1) (64) (12.7)
Total (37) (349.0) 31 (439) 100.0 505 100.0

70
Balance sheet
US$ million 12/31/2015 9/30/2015 12/31/2014
Assets
Current assets 15,473 17,701 20,234
Cash and cash equivalents 3,591 4,397 3,974
Financial investments 28 65 148
Derivative financial instruments 121 158 166
Accounts receivable 1,476 2,028 3,275
Related parties 70 343 579
Inventories 3,528 3,808 4,501
Prepaid income taxes 900 904 1,581
Recoverable taxes 1,404 1,364 1,700
Others 311 746 670
Non-current assets held for sale and discontinued operation
4,044 3,888 3,640
Non-current assets 10,653 10,857 7,180
Related parties 1 23 35
Loans and financing agreements receivable 188 194 229
Judicial deposits 882 838 1,269
Recoverable income taxes 471 417 478
Deferred income taxes 7,904 7,982 3,976
Recoverable taxes 501 527 401
Derivative financial instruments 93 133 87
Others 613 743 705
Fixed assets 62,366 70,467 89,075
Total assets 88,492 99,025 116,489
Liabilities
Current liabilities 10,545 10,226 10,737
Suppliers and contractors 3,365 3,482 4,354
Payroll and related charges 375 455 1,163
Derivative financial instruments 2,076 1,422 1,416
Loans and financing 2,506 3,030 1,419
Related parties 475 141 306
Income taxes settlement program 345 330 457
Taxes payable and royalties 250 261 550
Provision for income taxes 241 217 353
Employee postretirement obligations 68 69 67
Asset retirement obligations 89 81 136
Redeemable noncontrolling interest - 135 -
Others 648 323 405
Liabilities directly associated with non-current assets held for sale and discontinued operations
107 280 111
Non-current liabilities 42,243 44,298 49,431
Derivative financial instruments 1,429 2,808 1,610
Loans and financing 26,347 25,645 27,388
Related parties 213 76 109
Employee postretirement obligations 1,750 1,881 2,236
Provisions for litigation 822 858 1,282
Income taxes settlement program 4,085 3,992 5,863
Deferred income taxes 1,670 2,896 3,341
Asset retirement obligations 2,385 2,648 3,233
Participative stockholders' debentures 342 603 1,726
Redeemable noncontrolling interest - - 243
Gold stream transaction 1,749 1,785 1,323
Others 1,451 1,106 1,077
Total liabilities 52,788 54,524 60,168
Stockholders' equity 35,704 44,501 56,321
Total liabilities and stockholders' equity 88,492 99,025 116,489

71
Cash flow
US$ million 4Q15 3Q15 4Q14 2015 2014
Cash flows from operating activities:
Net income (loss) from operations (8,843) (2,236) (1,980) (12,620) 353
Adjustments to reconcile net income with cash provided by operating activities:
Depreciation, depletion and amortization 984 1,022 1,242 4,029 4,288
Impairment 9,372 - 409 9,372 1,183
Loss on measurement or sales of non-current assets 29 48 167 (158) 167
Items of the financial result (2,007) 6,801 - 7,628 -
Others 642 (4,365) 1,820 (5,013) 3,029
Variation of assets and liabilities
Accounts receivable 985 343 107 1,671 2,546
Inventories (73) (331) (63) (304) (535)
Suppliers and contractors 491 422 503 740 1,013
Payroll and related charges (79) 53 53 (603) (77)
Tax assets and liabilities, net - (37) (701) (357) 312
Goldstream transaction - - - 532 -
Others (166) (91) (369) (426) 705
Net cash provided by operating activities 1,335 1,629 1,188 4,491 12,984
Cash flows from investing activities:
Additions to investments (12) (8) (24) (66) (244)
Acquisition of subsidiary - - - (90) -
Additions to property, plant and equipment (2,190) (1,870) (3,449) (8,371) (11,813)
Proceeds from disposal of assets and investments 423 472 - 1,456 1,246
Dividends and interest on capital received from joint ventures and associates
87 19 89 318 568
Proceeds from goldstream transaction - - - 368 -
Others (36) 76 466 226 275
Net cash used in investing activities (1,728) (1,311) (2,918) (6,159) (9,968)
Cash flows from financing activities:
Loans and financing
Additions 1,045 1,066 962 4,995 2,341
Repayments (1,012) (928) (842) (2,826) (1,936)
Payments to shareholders:
Dividends and interest on capital attributed to shareholders (500) - (2,100) (1,500) (4,200)
Dividends and interest on capital attributed to noncontrolling interest
(3) - (55) (15) (66)
Other transactions with noncontrolling interest - 1,089 - 1,049 -
Net cash provided by (used in) financing activities (470) 1,227 (2,035) 1,703 (3,861)
Increase (decrease) in cash and cash equivalents (863) 1,545 (3,765) 35 (1,022)
Cash and cash equivalents in the beginning of the period 4,397 3,158 7,882 3,974 5,321
Effect of exchange rate changes on cash and cash equivalents
57 (306) (143) (418) (325)
Cash and cash equivalents, end of period 3,591 4,397 3,974 3,591 3,974
Cash paid during the period for:
Interest on loans and financing (305) (381) (324) (1,462) (1,560)
Income taxes (162) (47) (197) (527) (504)
Income taxes - settlement program (86) (89) (111) (384) (494)
Derivatives received (paid), net (275) (167) (319) (1,202) -
Non-cash transactions:
Additions to property, plant and equipment - interest capitalization
193 195 184 761 588

72
ANNEX 2 – VOLUMES SOLD, PRICES AND
MARGINS
Volume sold - Minerals and metals
‘000 metric tons 4Q15 3Q15 4Q14 2015 2014
Iron ore fines 79,213 70,530 74,603 276,393 255,877
ROM 1,627 3,546 3,552 12,269 14,075
Pellets 10,837 11,961 12,686 46,284 43,682
Manganese ore 568 448 828 1,764 1,879
Ferroalloys 12 3 36 69 150
Thermal coal 226 243 310 891 1,152
Metallurgical coal 1,329 1,419 1,815 5,614 6,330
Nickel 84 72 69 292 272
Copper 108 94 95 397 353
Gold ('000 oz) 114 105 97 425 351
Silver ('000 oz) 761 528 757 2,303 1,889
PGMs ('000 oz) 140 83 168 517 577
Cobalt (metric ton) 1,433 468 1,311 3,840 3,188
Potash 114 155 121 463 475
Phosphates
MAP 266 348 249 1,081 1,040
TSP 113 317 112 744 749
SSP 317 740 367 1,847 2,091
DCP 119 118 118 459 493
Phosphate rock 811 769 935 3,193 3,259
Others phosphates 68 74 71 330 271
Nitrogen 154 185 172 641 680
Average sale prices
US$/ton 4Q15 3Q15 4Q14 2015 2014
Iron ore fines CFR reference price (dmt) 45.10 56.00 75.50 54.60 92.70
Iron ore fines CFR/FOB realized price 37.18 46.48 61.23 44.61 75.43
ROM 7.99 6.77 11.82 8.31 15.28
Pellets CFR/FOB (wmt) 71.98 73.82 100.11 77.78 120.48
Manganese ore 7.04 52.14 111.11 56.44 118.15
Ferroalloys 750.00 836.67 1083.33 904.16 1,125.83
Thermal coal 44.19 48.24 64.52 52.42 67.65
Metallurgical coal 73.75 81.22 99.72 85.55 104.37
Nickel 9,309.52 10,865.81 15,420.29 11,684.33 16,426.47
Copper 3,823.90 3,891.78 5,842.10 4,352.94 6,015.47
Platinum (US$/oz) 817.60 1,004.75 1,224.87 1,020.14 1,261.87
Gold (US$/oz) 1,064.48 1,094.81 1,189.96 1,064.48 1,192.51
Silver (US$/oz) 10.00 13.49 14.16 12.63 19.42
Cobalt (US$/lb) 8.55 14.54 9.34 9.95 10.67
Potash 293.08 302.42 371.90 318.32 355.79
Phosphates
MAP 496.45 505.21 550.70 511.70 542.44
TSP 394.48 391.50 448.41 398.05 428.98
SSP 212.88 197.17 217.14 204.45 212.61
DCP 514.90 536.10 584.94 554.88 591.51
Phosphate rock 81.73 78.02 88.77 82.55 70.88

73
Operating margin by segment (EBIT adjusted margin)
% 4Q15 3Q15 4Q14 2015 2014
Ferrous minerals 25.5 29.0 18.1 24.0 34.5
Coal (201.9) (164.6) (133.3) (138.4) (110.6)
Base metals (25.6) (18.1) 1.0 (7.3) 9.5
Fertilizer nutrients 10.4 14.0 (2.3) 11.6 (5.8)
Total¹ 5.4 12.8 9.4 10.7 22.6
¹ Excluding non-recurring effects

74
Annex 3 – reconciliation of IFRS
and “NON-GAAP” information
(a) Adjusted EBIT¹
US$ million 4Q15 3Q15 4Q14 2015 2014
Net operating revenues 5,899 6,505 9,072 25,609 37,539
COGS (5,119) (5,040) (6,892) (20,513) (25,064)
SG&A (167) (131) (306) (652) (1,099)
Research and development (119) (121) (235) (477) (734)
Pre-operating and stoppage expenses (238) (266) (292) (1,027) (1,088)
Other operational expenses 64 (113) (491) (206) (1,057)
Adjusted EBIT 320 834 856 2,734 8,497
¹ Excluding non-recurring effects.
(b) Adjusted EBITDA EBITDA defines profit or loss before interest, tax, depreciation and amortization. Vale uses the term adjusted
EBITDA to reflect exclusion of gains and/or losses on sale of assets, non-recurring expenses and the inclusion of
dividends received from non-consolidated affiliates. However our adjusted EBITDA is not the measure defined as
EBITDA under IFRS, and may possibly not be comparable with indicators with the same name reported by other
companies. Adjusted EBITDA should not be considered as a substitute for operational profit or as a better measure
of liquidity than operational cash flow, which are calculated in accordance with IFRS. Vale provides its adjusted
EBITDA to give additional information about its capacity to pay debt, carry out investments and cover working
capital needs. The following table shows the reconciliation between adjusted EBITDA and operational cash flow, in
accordance with its statement of changes in financial position:
Reconciliation between adjusted EBITDA and operational cash flow
US$ million 4Q15 3Q15 4Q14 2015 2014
Adjusted EBITDA 1,391 1,875 2,187 7,081 13,353
Working capital:
Accounts receivable 985 343 107 1,671 2,546
Inventories (73) (331) (63) (304) (535)
Suppliers 491 422 503 740 1,013
Payroll and related charges (79) 53 53 (603) (77)
Gold stream transaction - - - 532 -
Others (414) (78) (257) (517) (167)
Adjustment for non-recurring items and other effects
(112) 29 (332) (470) (477)
Cash provided from operations 2,189 2,313 2,198 8,130 15,656
Income taxes paid - current (162) (47) (197) (527) (504)
Income taxes paid - settlement program (86) (89) (111) (384) (494)
Interest paid for third parties (305) (381) (324) (1,462) (1,560)
Participative stockholders' debentures paid (26) - (60) (65) (112)
Derivatives received (paid), net (275) (167) (318) (1,201) (179)
Net cash provided by (used in) operating activities
1,335 1,629 1,188 4,491 12,807
(c) Net debt
Reconciliation between total debt and net debt
US$ million 4Q15 3Q15 4Q14 2015 2014
Total debt 28,853 28,675 28,807 28,853 28,807
Cash and cash equivalents¹ 3,619 4,462 4,122 3,619 4,122
Net debt 25,234 24,213 24,685 25,234 24,685
¹ Including financial investments .

75
(d) Total debt / LTM Adjusted EBITDA
US$ million 4Q15 3Q15 4Q14 2015 2014
Total debt / LTM Adjusted EBITDA (x) 4.1 3.6 2.2 4.1 2.2
Total debt / LTM operational cash flow (x) 6.4 6.6 2.2 6.4 2.2
(e) LTM Adjusted EBITDA / LTM interest payments
US$ million 4Q15 3Q15 4Q14 2015 2014
LTM adjusted EBITDA / LTM interest payments (x) 4.8 5.3 8.6 4.8 8.6
LTM operational profit / LTM interest payments (x) (4.3) 2.0 4.7 (4.3) 4.7