THE EAGLE FORD COMPLETION TRENDS
YOU NEED TO KNOW
Todd Bush
http://www.energentgroup.com
@EnergentGroup
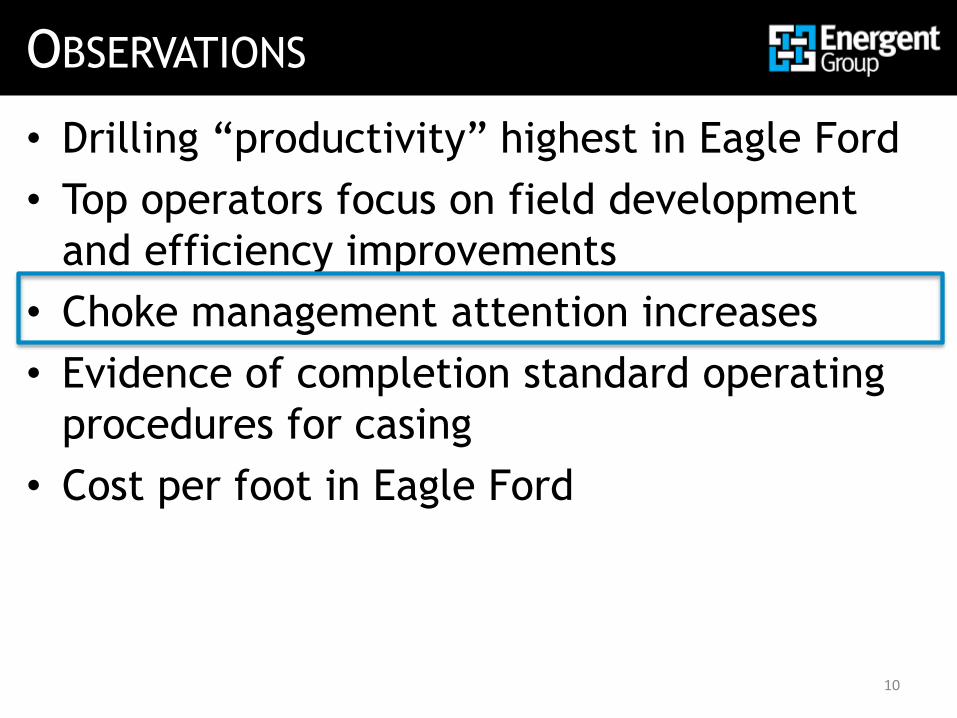
OBSERVATIONS
• Drilling “productivity” highest in Eagle Ford
• Top operators focus on field development
and efficiency improvements
• Choke management attention increases
• Evidence of completion standard operating
procedures for casing
• Cost per foot in Eagle Ford
2
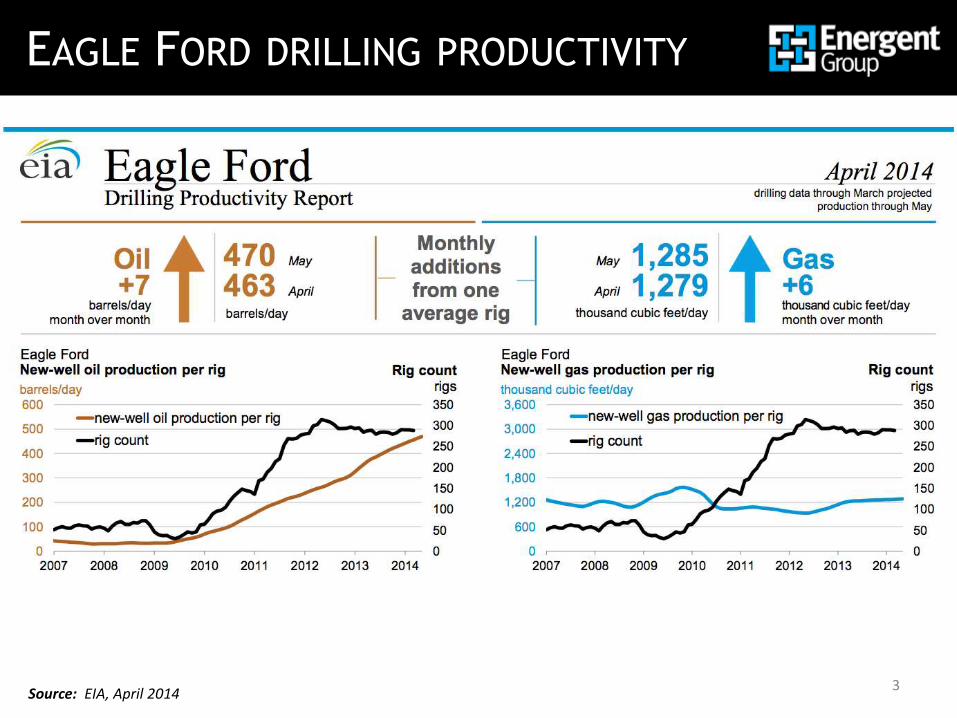
EAGLE FORD DRILLING PRODUCTIVITY
3Source: EIA, April 2014
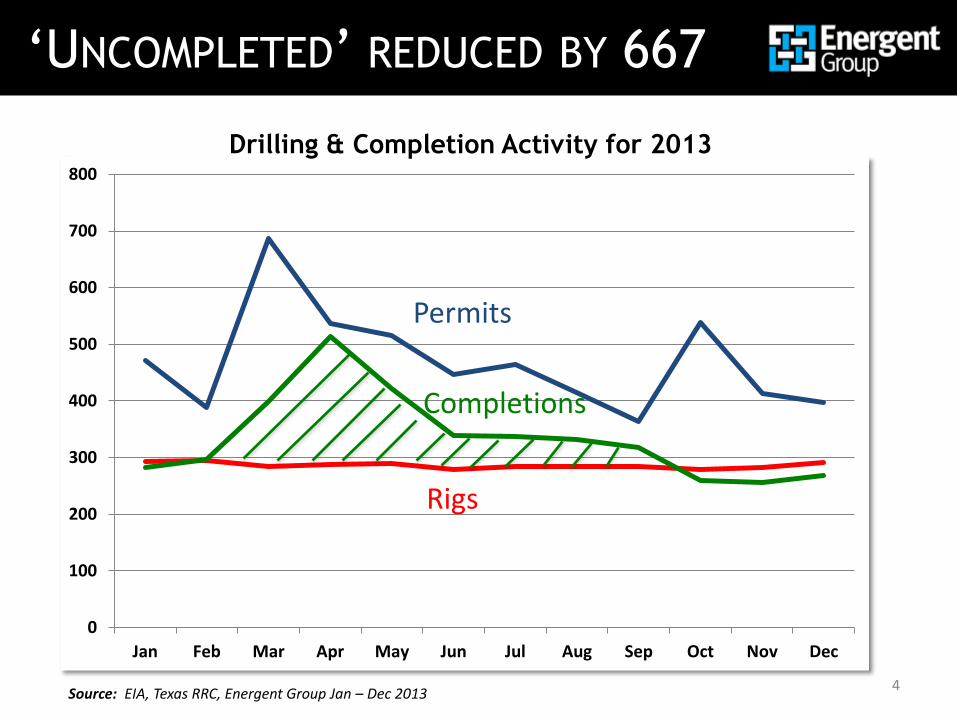
‘UNCOMPLETED’ REDUCED BY 667
4
0
100
200
300
400
500
600
700
800
Jan Feb Mar Apr May Jun Jul Aug Sep Oct Nov Dec
Permits
Completions
Rigs
Drilling & Completion Activity for 2013
Source: EIA, Texas RRC, Energent Group Jan – Dec 2013
OBSERVATIONS
• Drilling “productivity” highest in Eagle Ford
• Top operators focus on field development
and efficiency improvements
• Choke management increases
• Evidence of completion standard operating
procedures for casing
• Cost per foot in Eagle Ford
5
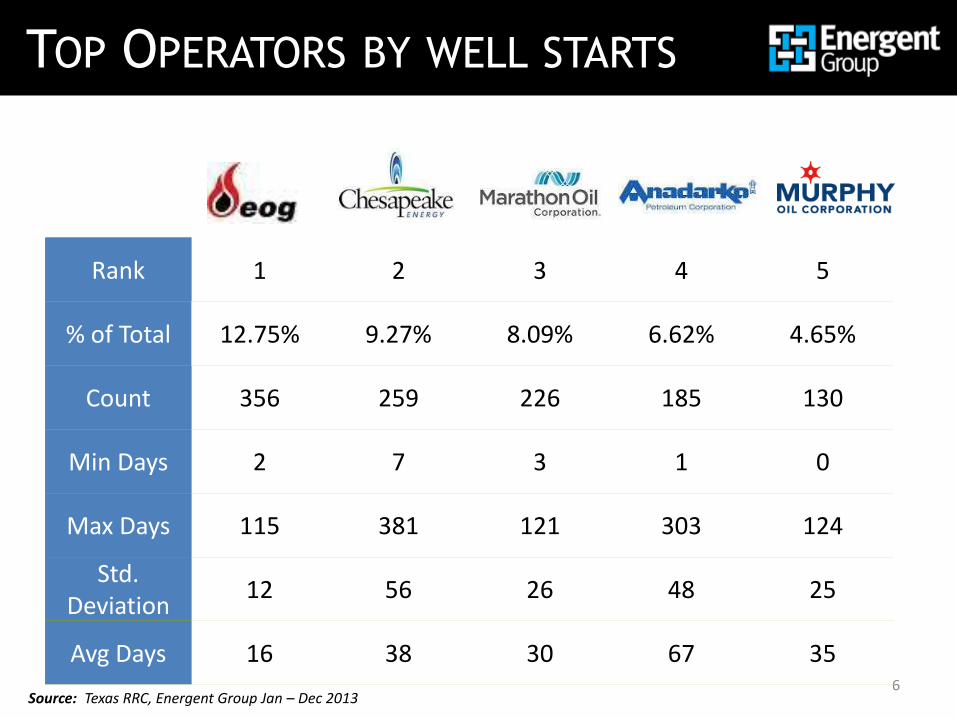
TOP OPERATORS BY WELL STARTS
6
Rank 1 2 3 4 5
% of Total 12.75% 9.27% 8.09% 6.62% 4.65%
Count 356 259 226 185 130
Min Days 2 7 3 1 0
Max Days 115 381 121 303 124
Std. Deviation
12 56 26 48 25
Avg Days 16 38 30 67 35
Source: Texas RRC, Energent Group Jan – Dec 2013
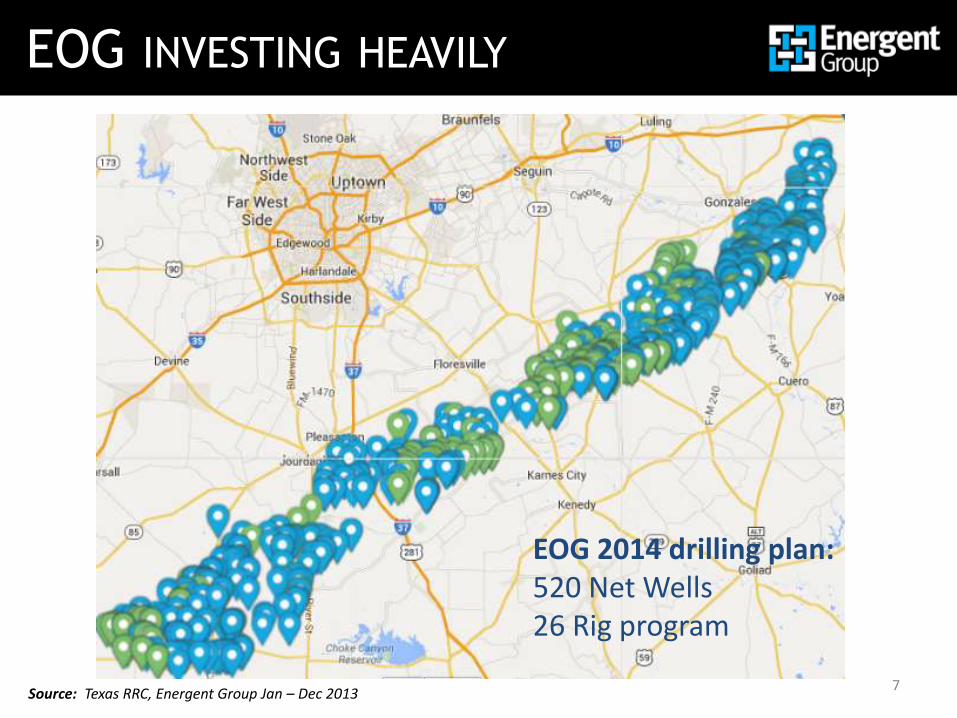
EOG INVESTING HEAVILY
7Source: Texas RRC, Energent Group Jan – Dec 2013
EOG 2014 drilling plan:520 Net Wells26 Rig program
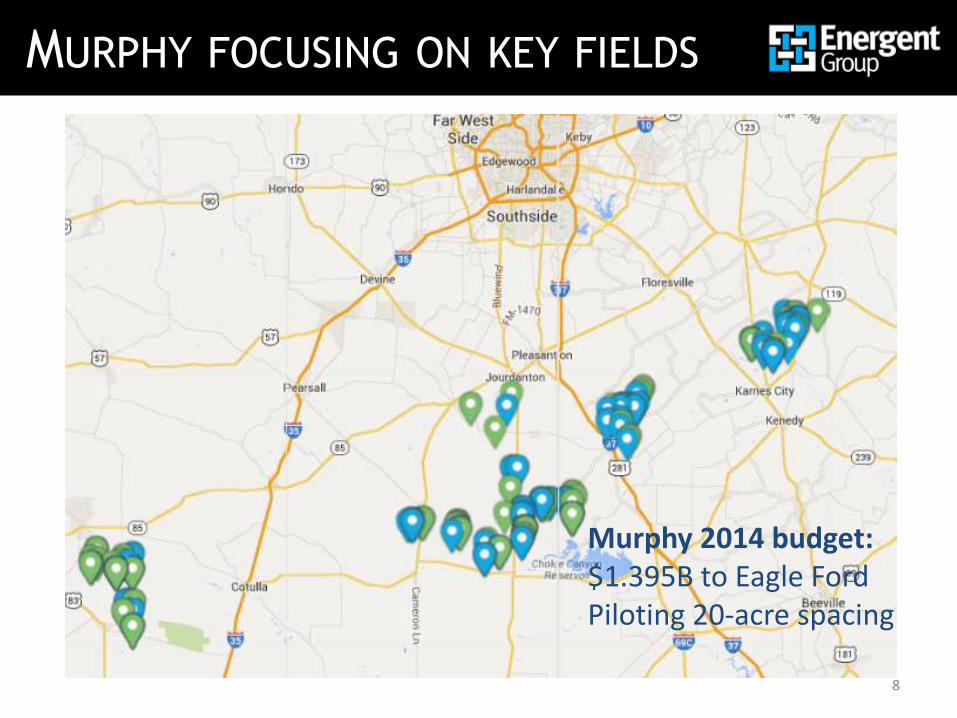
MURPHY FOCUSING ON KEY FIELDS
8
Murphy 2014 budget:$1.395B to Eagle FordPiloting 20-acre spacing
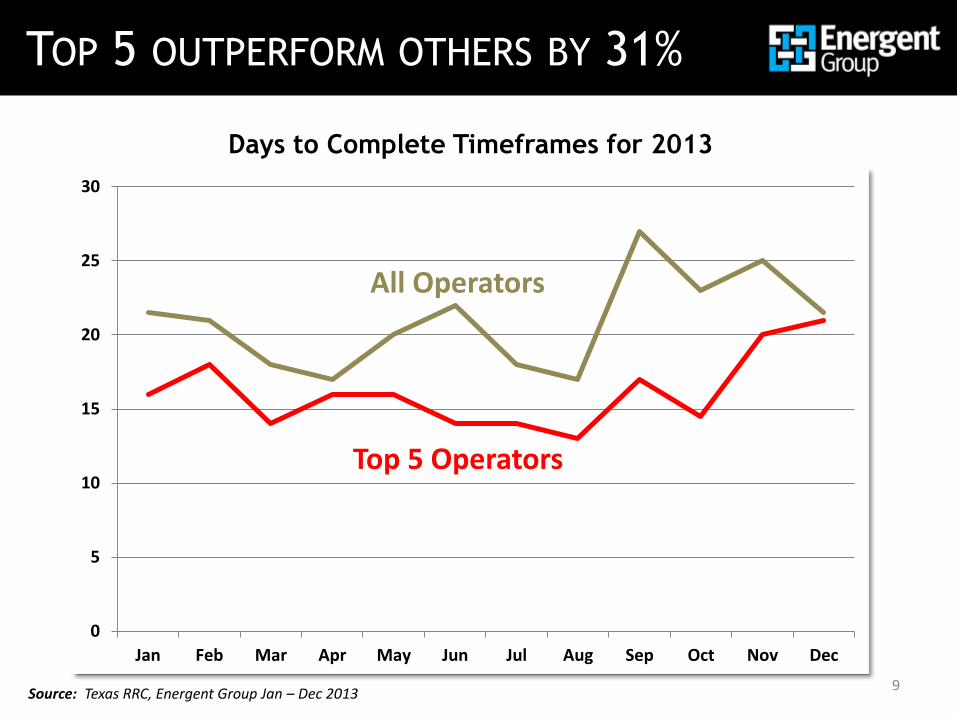
TOP 5 OUTPERFORM OTHERS BY 31%
9
0
5
10
15
20
25
30
Jan Feb Mar Apr May Jun Jul Aug Sep Oct Nov Dec
Days to Complete Timeframes for 2013
All Operators
Top 5 Operators
Source: Texas RRC, Energent Group Jan – Dec 2013
OBSERVATIONS
• Drilling “productivity” highest in Eagle Ford
• Top operators focus on field development
and efficiency improvements
• Choke management attention increases
• Evidence of completion standard operating
procedures for casing
• Cost per foot in Eagle Ford
10
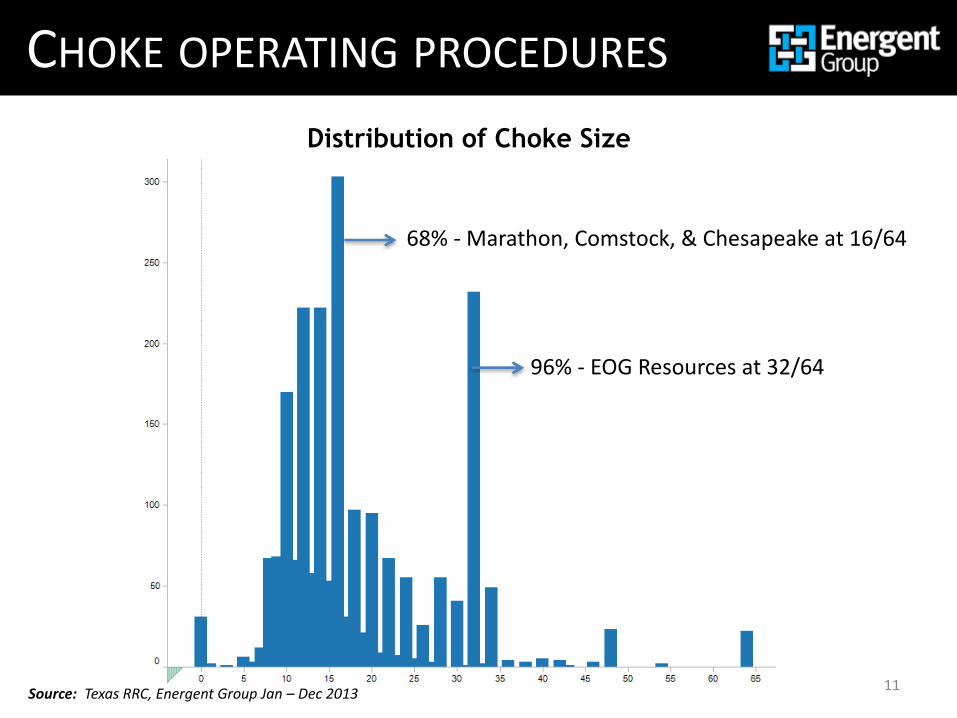
CHOKE OPERATING PROCEDURES
11
Distribution of Choke Size
68% - Marathon, Comstock, & Chesapeake at 16/64
96% - EOG Resources at 32/64
Source: Texas RRC, Energent Group Jan – Dec 2013
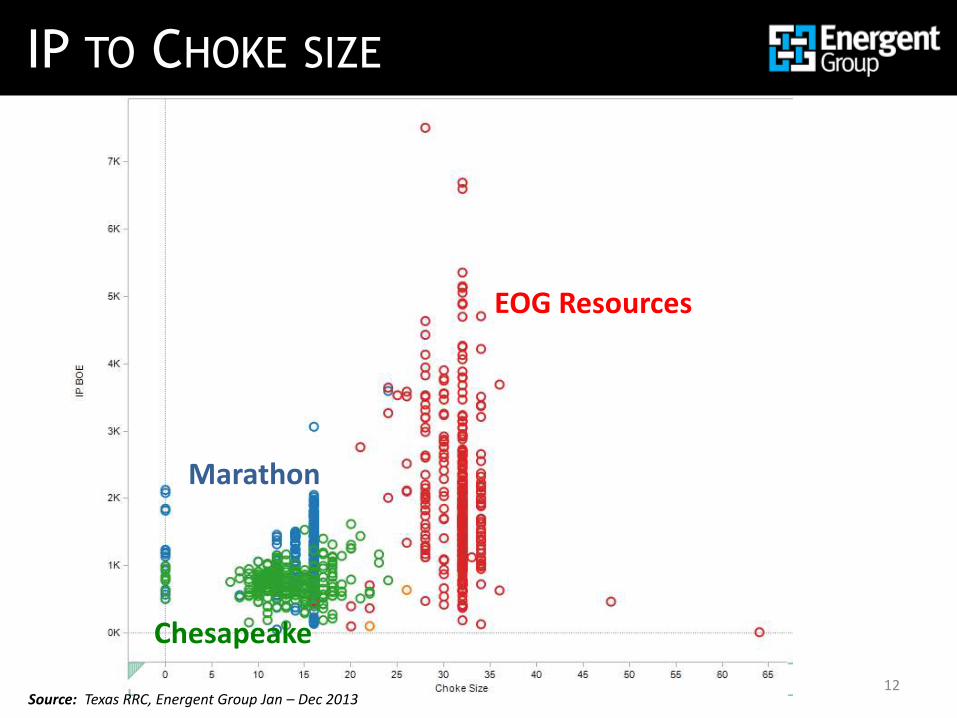
IP TO CHOKE SIZE
12
EOG Resources
Marathon
Chesapeake
Source: Texas RRC, Energent Group Jan – Dec 2013
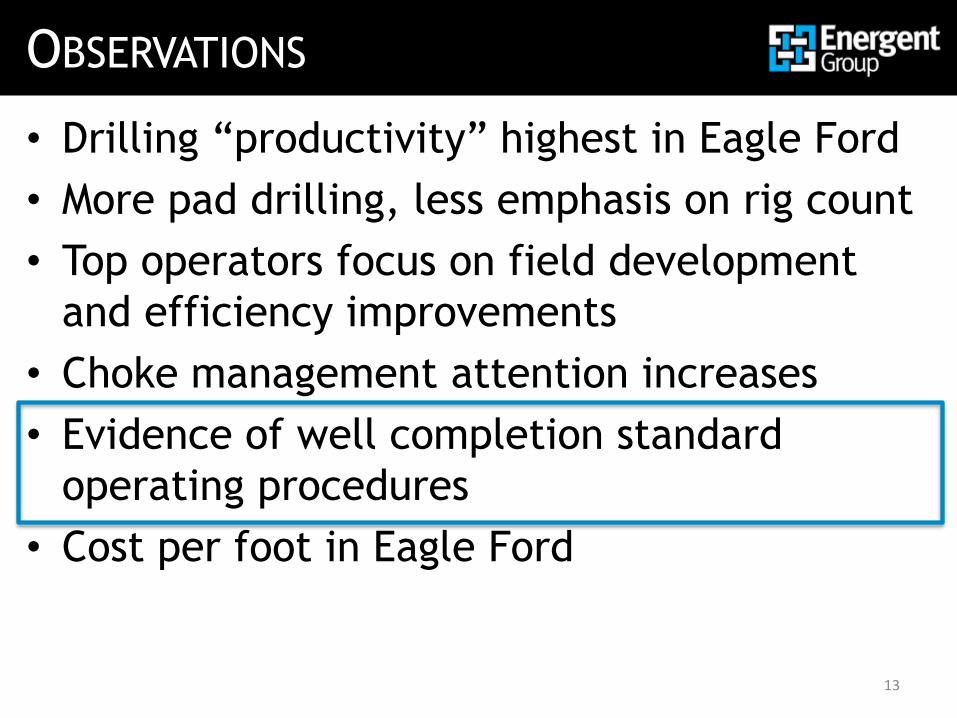
OBSERVATIONS
• Drilling “productivity” highest in Eagle Ford
• More pad drilling, less emphasis on rig count
• Top operators focus on field development
and efficiency improvements
• Choke management attention increases
• Evidence of well completion standard
operating procedures
• Cost per foot in Eagle Ford
13
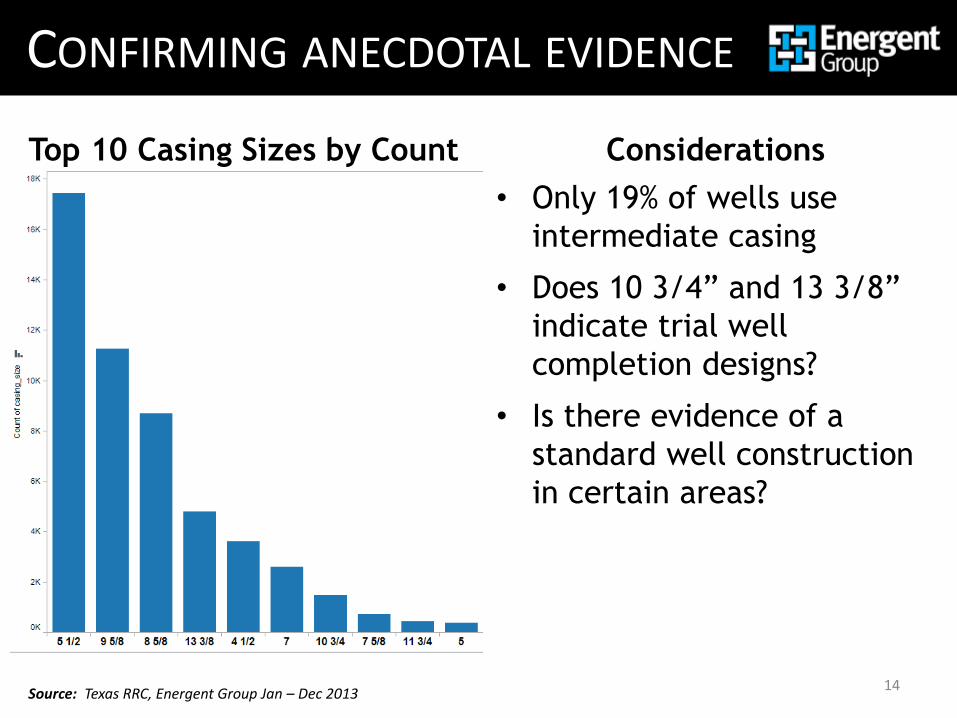
CONFIRMING ANECDOTAL EVIDENCE
Considerations
• Only 19% of wells use
intermediate casing
• Does 10 3/4” and 13 3/8”
indicate trial well
completion designs?
• Is there evidence of a
standard well construction
in certain areas?
14Source: Texas RRC, Energent Group Jan – Dec 2013
Top 10 Casing Sizes by Count
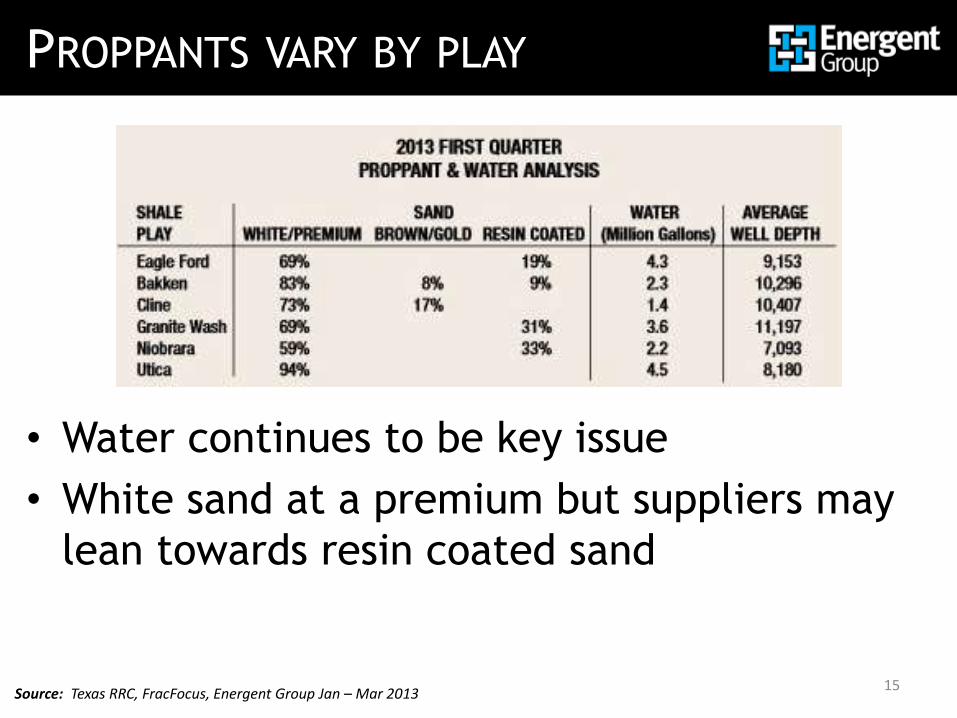
PROPPANTS VARY BY PLAY
• Water continues to be key issue
• White sand at a premium but suppliers may
lean towards resin coated sand
15Source: Texas RRC, FracFocus, Energent Group Jan – Mar 2013
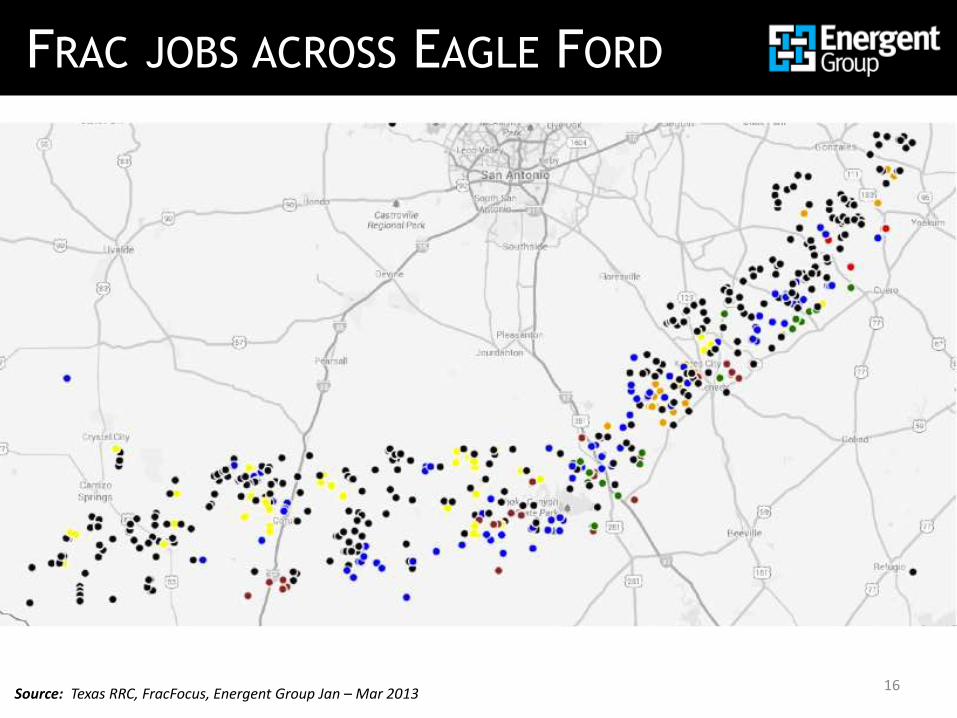
FRAC JOBS ACROSS EAGLE FORD
16Source: Texas RRC, FracFocus, Energent Group Jan – Mar 2013
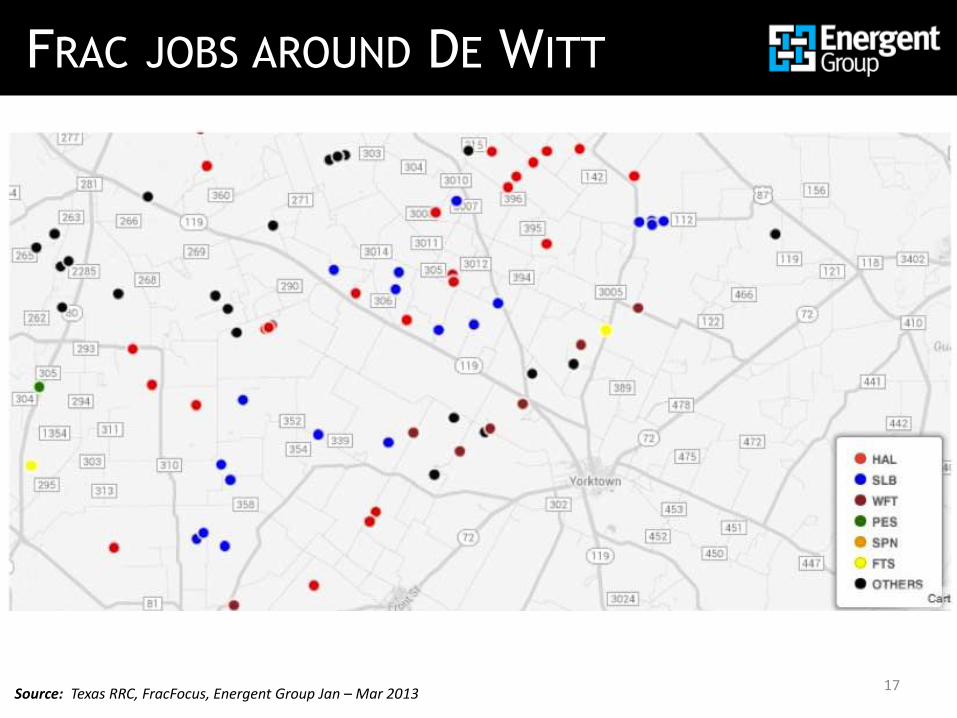
FRAC JOBS AROUND DE WITT
17Source: Texas RRC, FracFocus, Energent Group Jan – Mar 2013
OBSERVATIONS
• Drilling “productivity” highest in Eagle Ford
• Top operators focus on field development
and efficiency improvements
• Choke management attention increases
• Evidence of well completion standard
operating procedures
• Cost per foot in Eagle Ford
18
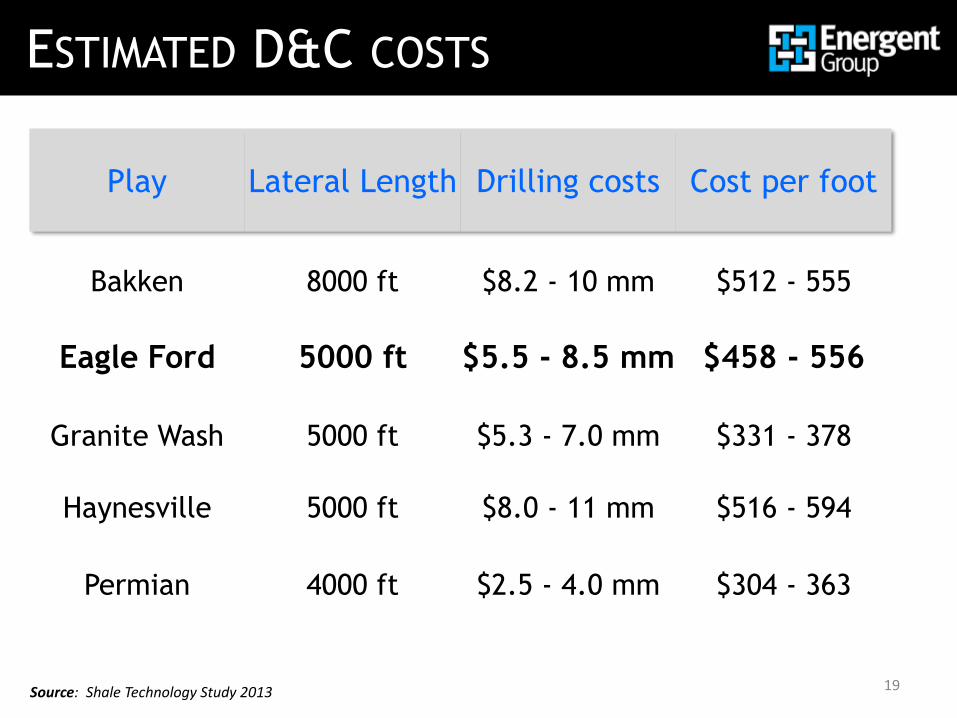
ESTIMATED D&C COSTS
Play Lateral Length Drilling costs Cost per foot
Bakken 8000 ft $8.2 - 10 mm $512 - 555
Eagle Ford 5000 ft $5.5 - 8.5 mm $458 - 556
Granite Wash 5000 ft $5.3 - 7.0 mm $331 - 378
Haynesville 5000 ft $8.0 - 11 mm $516 - 594
Permian 4000 ft $2.5 - 4.0 mm $304 - 363
19Source: Shale Technology Study 2013
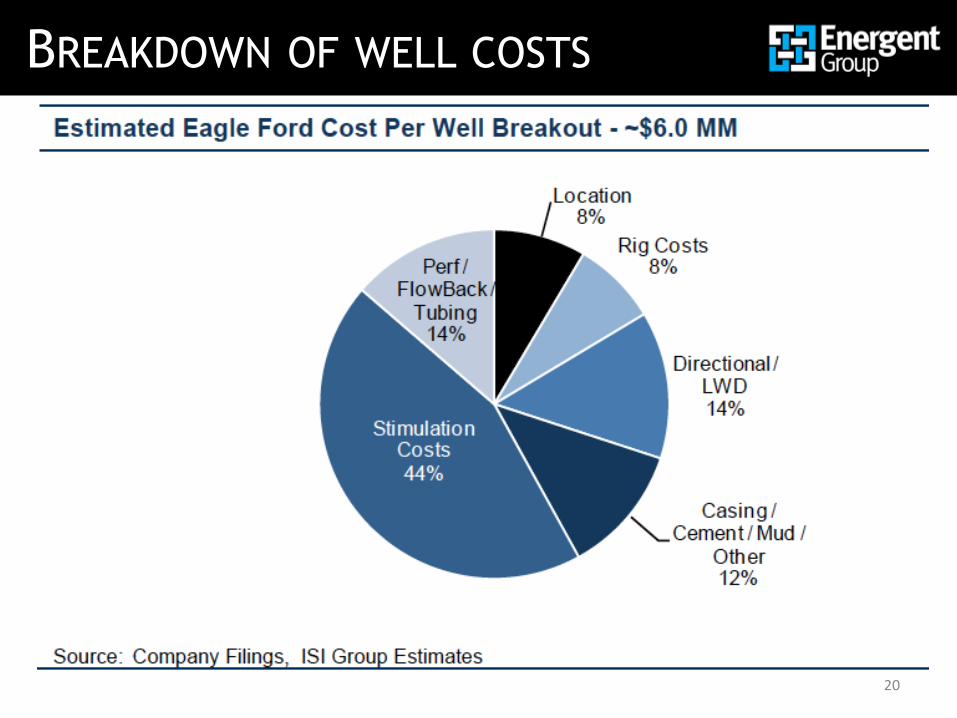
BREAKDOWN OF WELL COSTS
20
CLOSING THOUGHTS
• Consider the productivity of the Eagle Ford
compared to other shale plays
• Identify who is pad drilling for benchmarking
or sales opportunities
• Understand the asset team’s standard
operating procedure
• Stay informed of regional news and market
conditions
21


