Download - TECHNOLOGY & DIGITAL Talent insights

Talent insightsTECHNOLOGY & DIGITAL
Critical roles, skills and salaries to shape your team in 2017

2
1Improving the digital customer experience
2Increased customer demands
3 Economic uncertainty
4 Increasing speed to market of new products and services
5 New/emerging competitors
The business context:Change is the new normal
IT functions are under pressure from both internal and external factors, according to data from a Hudson survey of employers in Australia.
Employers name their top 5 challenges for:
The business
Hudson research Nov 2016: Technology & Digital employers, Australia
Improving the customer experience
Increased customer demands are driving organisations to invest in technology and digital initiatives to improve the customer experience. This includes retail platforms, mobile solutions for e-commerce, better access to public services and service simplification. Often organisations do not have the in-house skills or experience to carry out large-scale digital transformation projects, so they are increasingly hiring permanent and contracting staff to bring new and diverse capabilities into their teams.
The need to move faster
As customer demands increase, organisations need to bring new products and services to market faster than their competitors. Many markets are also facing new entrants who typically have the benefit of lower cost structures as they don't have legacy infrastructure. This puts pressure on technology professionals to find solutions that can increase the speed of product development and distribution.

3
The workplace
1Organisation or team restructures
2 Cultural transformation
3Implementing new technology platforms
4 Budget cuts
5New approaches to managing projects, eg: Agile
The team
1 Upskilling staff
2Keeping employees engaged and motivated
3Helping staff adapt to change
4Improving employee performance
5Retaining top performing staff
Workplaces in transformation
Where once technology teams may have been more focused on maintaining current IT systems, organisations are now responding to the changing environment by restructuring and looking to new systems that are more responsive and customer-centric. These changes are happening alongside cultural transformations within organisations, so IT teams are in a constant state of flux.
Keeping spirits up
In the midst of change, employees can become frustrated and disengaged. As their organisation shifts around them, employers have the responsibility to keep their staff engaged and motivated - or risk losing their best people.
Finding candidates who have it all
Employers continue to have strong demand for specialist skillsets, and are facing skills shortages across many role types and technologies. Professionals who have the right technical skillsets and who can also thrive in an environment of change will be in demand. Any managers not continually upskilling staff will be left with a team that's below the industry standard and may find it harder to retain top-performing employees.
With employers under pressure to manage through
change, hiring becomes an
opportunity to bring in people with
a positive and adaptable mindset.

4
The demand for talent: Hiring intentions remain strong
Permanent hiring expectations: Net effect (% of employers intending to increase headcount minus % of employers intending to decrease headcount).
2016 20172014 20152012 20132010 2011
19.1
23.5
18.7
12.2
9.1
25.8
33.2
29.2
Australian permanent hiring expectations: net effect (%)
For the last 10 years, Hudson has taken the pulse on employers' intention to hire. In H1 2017, the net effect has dipped slightly compared to H2 2016, during a period in which economic growth slowed in Australia.
Hudson's research was undertaken shortly before the Australian Bureau of Statistics released September quarter gross domestic product (GDP) figures, showing a surprising 0.5% contraction in the economy, driven largely by a decline in business investment.1
The Hudson data correlates with the subdued business conditions2 experienced by employers in the second half of 2016, easing from a peak in May, and a dip in consumer confidence in the second half of 2016.3
Despite the recent slowdown, the NAB Monthly Business Survey shows that business conditions remain above average levels.4 Overall hiring intentions remain strong and are still higher than during 2012-2015.
1 Australian National Accounts: National Income, Expenditure and Product, Sep 2016, Australian Bureau of Statistics 2,3 NAB Monthly Business Survey, October 2016 4 Westpac Melbourne Institute Index of Consumer Sentiment, December 2016
30.8%increase
57.6%maintain
11.7%decrease
2017

5
”
“Australian hiring intentions remain
strong, however economic growth
will be watched closely by
employers as they plan their teams in 2017.
Dean Davidson
Executive General Manager — Recruitment Australia & NZ
Permanent hiring expectations: % of employers increasing headcount by region.
33.6% SA
34.2% VIC
45.6% ACT
24.2% WA 30.4%
NSW
27.8% QLD
ACT tops hiring activity
The ACT continues to lead Australia in terms of hiring growth, not only in the public sector but in private sectors as well.
The jobs markets in WA, QLD and SA have improved from recent periods as they recover from a tough year in 2015 impacted by the resources downturn, while NSW and VIC continue to have strong demand for new hires.
6
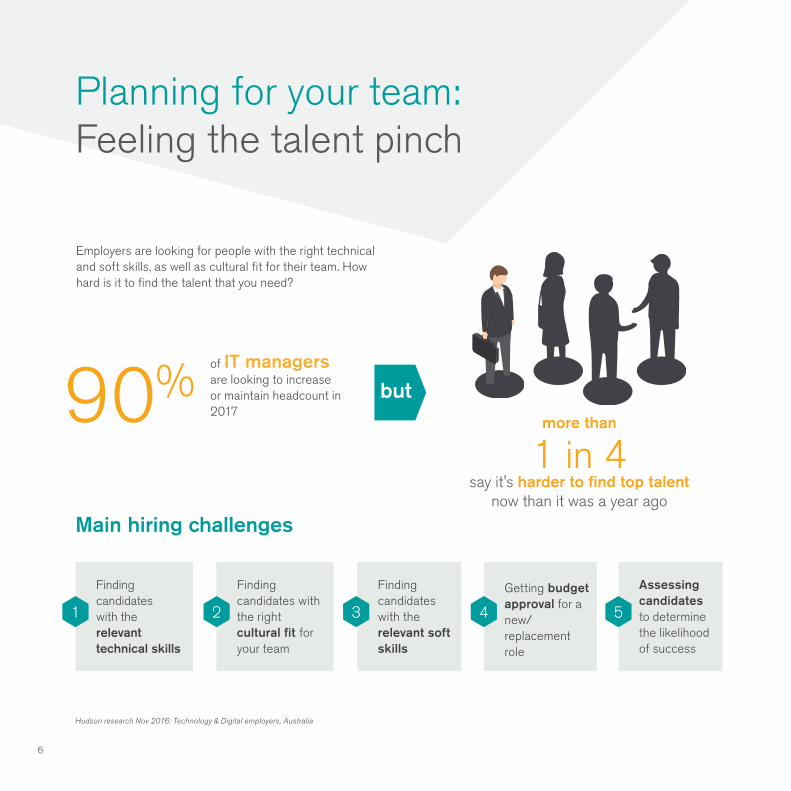
more than
1 in 4say it's harder to find top talent
now than it was a year ago
but
Planning for your team:Feeling the talent pinch
of IT managers are looking to increase or maintain headcount in 201790%
Main hiring challenges
Hudson research Nov 2016: Technology & Digital employers, Australia
Finding candidates with the relevant technical skills
Finding candidates with the relevant soft skills
Getting budget approval for a new/replacement role
Finding candidates with the right cultural fit for your team
Assessing candidates to determine the likelihood of success
1 2 3 4 5
Employers are looking for people with the right technical and soft skills, as well as cultural fit for their team. How hard is it to find the talent that you need?

7
A finite pool of candidates
With almost all employers looking to maintain or increase headcount in 2017, competition for top talent will be tough.
Organisations are seeking candidates with highly specific expertise but there is a noticeable skills shortage in many role types and for particular technologies.
Agile approach sought after
A solid understanding of the Agile approach to project management is continuously in high demand. There's also a greater emphasis being placed on how organisations manage their data and information.
Soft skills a high priority
With IT teams expected to do much of the heavy lifting within organisations when it comes to implementing new systems and platforms, it's no surprise that employers are prioritising people with soft skills that involve envisioning, communicating and managing change.
Different demands for different sectors
In the public sector, particularly in Canberra, the Digital Transformation Agency is transforming the way the government operates to make it more end-user focused. Organisations across government departments are seeking IT or technology professionals with experience in projects and technologies that enable higher levels of service to both the public and internal stakeholders.
Meanwhile, in the financial services sector, businesses are looking to technology to increase market share by identifying, engaging and retaining customers, and are seeking out new talent with the skills for such large-scale transformations.
Soft skills
Innovative thinking
Driving and managing change
Stakeholder management
Critical thinking
Drive for results
Technical skills
Business analysis
JavaScript frameworks
CMS
.NET
Solution architecture
Roles
Business Analyst
Project Manager
.NET
1st, 2nd Level Support
Solution Architecture
Top 5 in demand:

8
A large number of potential hires might be interested in a role but aren't actively looking for jobs.
Beyond the job ad:Winning strategies to source today's best talent
of technology employees are open to new opportunities
Hudson research Nov 2016: Technology & Digital employers, Australia
H2 2016
43%
Activelyseeking
25%
H1 2017 H2 2016
34%
Passive/open to opportunities
47%
H1 2017 H2 2016
23%
Planning to stay
28%
H1 2017
47%There's been a significant shift from technology professionals who considered themselves to be active job seekers to those who are passive job seekers open to new opportunities.
The changing job market reflects a shift happening across Australia in the way that employers should approach sourcing top talent. They need to look beyond reactive job ads to get the best candidates in the market, not just the best available at the time.

9
1. Plan ahead
Successful sourcing is built on knowing the roles you need, the talent you want and when you’ll need it. Identify business critical and hard-to-fill roles, plus roles with high turnover.
2. Know who you want
Develop a profile of the people you need, starting with their skills, competencies and experience. Then look beyond technical knowledge to consider motivations and cultural fit.
3. Be where your talent is
There’s an abundance of sourcing channels — blogs, SEO, events, referrals, networking, associations, LinkedIn, video, traditional media, online advertising, job boards, databases — and your next great candidate could be attracted through any of them. They could even be already within your organisation.
4. Sell a compelling employee value proposition (EVP)
Understand what your target audience wants, then create an appealing employment offering that engages candidates throughout the hiring process. With job interviews an increasingly two-way street, candidates care about issues like social responsibility, flexible work options, diversity and corporate culture.
5. Access a talent pool
Having ready access to a pool of qualified candidates will maximise your chances of finding top talent quickly when roles become available.
Strategic sourcing for the best talent

10
Attracting talent:What are job seekers looking for?
Hudson candidate engagement research, 2016, Australia
Hudson's research shows that most employees surveyed in Australia are most attracted to roles in companies where the work environment suits them, with enough flexibility for a good work/life balance and challenges to keep them motivated.
Ensure you have a compelling EVP
Be clear about your employee value proposition. Only a compelling offer will lure top talent. If you can't offer the best salaries, ensure you have a compelling narrative about why people would want to work at your organisation.
What attracts job seekers to a company
Work/life balance
Challenging role
Chance to make a difference
Work environment
1 2 3 Advancement opportunity
4 5
Just like employers look for good cultural
fit, candidates are looking for a work environment that
suits them.

11
Attracting talent:What are job seekers looking for?
Hudson candidate engagement research, 2016, Australia
Continuous engagement is essential to developing a relationship with a potential hire, even when a role is not yet available. When asked which channels were the most effective for engaging their interest, Australian professionals showed clear preferences.
Nurturing potential hires:Personalised communication is key
The best methods of continually engaging with prospective candidates:
91%via personalised email
92%via phone call
42%via company website
49%via LinkedIn InMail
Maintaining good relationships
Ensure you provide a personalised, positive and consistent experience for candidates, from the point of initially engaging with them right through to the job offer.
Professionals don't want you to reinvent the wheel when it comes to contacting them. Overwhelmingly, they prefer the tried and true methods of phone and email.

12
The hiring process:A crucial factor in securing top talent
The top 5 important aspects during the application and interview experience
Hudson candidate engagement research, 2016, Australia
86%
Understanding the details of the position requirements
1
A good quality hiring process is a chance to demonstrate your employee value proposition and is fundamental to a strong employer brand. If it's a disorganised or disengaging process, candidates will assume that it reflects the workplace and steer clear.
Ongoing communication about application status
A reasonable time frame for a final decision
Ease of application submission
Knowing the next steps in the process
2 53 4
of Australian professionals believe that the experience with an organisation's
job application and interview process is important when deciding to join a company

13
Remuneration:Underpaid and underappreciated?
Getting salary right is an essential part of the equation for hiring managers as they cope with the challenge of engaging and motivating employees. This may be particularly challenging in the context of record low wages growth in Australia.1 If people are feeling underpaid, they may also be feeling underappreciated. The answer? Communication and transparency.
46%
51%Of those who received an increase,
69%
How much has your base salary increased by in 2016?
Ensuring salary satisfaction
Refer to up-to-date salary data and clearly communicate that when making a salary offer to ensure continued engagement and job satisfaction.
Alternatives to pay risesEmployees say they would be willing to swap a pay rise for:
1. More annual leave
2. Bonuses and incentives
3. Flexible work conditions The Hudson Report: Forward Focus 2016
of IT or technology employees surveryed
feel they are underpaid
received
no increase
received an
increase of 1-5%
1 Wage Price Index September quarter 2016, Australian Bureau of Statistics
Hudson research Nov 2016: Technology & Digital employees Australia

14
Salary guide:Technology & Digital
Sydney Newcastle Canberra
Permanent AUD '000
Contractor AUD/hour
Permanent AUD '000
Contractor AUD/hour
Permanent AUD '000
Contractor AUD/hour
Senior ManagementCIO/GMIT/IT Director 180 - 350 N/A 180 - 250 N/A 160 - 300 N/ACTO 150 - 250 N/A 120 - 160 80 - 120 150 - 300 N/AIT Manager 150 - 250 N/A 110 - 150 65 - 90 100 - 150 90 - 125Infrastructure Manager 110 - 150 80 - 130 110 - 160 65 - 90 100 - 140 90 - 120Network Manager 110 - 140 80 - 130 N/A N/A 120 - 160 110 - 150Business Systems Manager 120 - 160 110 - 130 110 - 140 85 - 95 100 - 140 90 - 130Development Manager 130 - 200 110 - 140 110 - 150 65 - 95 100 - 140 90 - 120Enterprise Architect 110 - 160 100 - 150 130 - 150 80 - 120 130 - 180 130 - 200Information Security Manager 150 - 200 110 - 175 N/A N/A 150 - 200 110 - 150Security Architect 150 - 200 110 - 175 N/A N/A 130 - 180 130 - 180Solutions Architect - Infrastructure 110 - 160 110 - 150 110 - 150 100 - 130 120 - 160 100 - 140
Solutions Architect - Applications 110 - 160 110 - 150 130 - 150 100 - 130 120 - 160 105 - 140
Salary ranges relate to base salaries and exclude superannuation/bonuses/incentive schemes/stock options.
Sydney, Newcastle & Canberra: pages 14-18
Canberra & Melbourne: pages 19-22
Adelaide & Perth: pages 23-26

15
Sydney Newcastle Canberra
Permanent AUD '000
Contractor AUD/hour
Permanent AUD '000
Contractor AUD/hour
Permanent AUD '000
Contractor AUD/hour
Project ServicesPMO Manager 180 - 240 170 - 200 130 - 160 100 - 130 180 - 210 175 - 185Portfolio Manager 170 - 220 125 - 175 130 - 150 80 - 100 N/A N/AProgram Manager 130 - 200 120 - 150 130 - 150 100 - 130 130 - 200 125 - 180Senior Project Manager 140 - 165 120 - 150 130 - 140 80 - 100 N/A N/AProject Manager 110 - 150 100 - 130 110 - 120 70 - 110 120 - 170 110 - 130Project Scheduler 85 - 105 55 - 90 N/A N/A N/A N/AProject Coordinator 80 - 120 60 - 80 65 - 80 45 - 65 65 - 90 50 - 80Project Administrator 60 - 75 40 - 60 45 - 60 30 - 40 55 - 75 50 - 60PMO Analyst 85 - 110 65 - 100 N/A N/A N/A N/AChange Manager 100 - 150 100 - 130 120 - 140 80 - 100 100 - 130 100 - 150Change Analyst 90 - 115 80 - 110 80 - 100 60 - 70 N/A N/AChange Communications Manager 100 - 150 90 - 120 140 - 160 100 - 120 N/A N/A
Senior Business Analyst 110 - 130 90 - 110 100 - 110 60 - 75 N/A N/ABusiness Analyst 90 - 110 80 - 110 80 - 100 55 - 65 80 - 120 90 - 120Business Architect 110 - 150 100 - 135 N/A N/A N/A N/AScrum Master 130 - 150 90 - 125 N/A N/A 120 - 140 110 - 130Agile Coach 150 - 185 110 - 160 N/A 70 - 90 N/A N/AData Scientist 110 - 150 90 - 120 90 - 120 70 - 90 140 - 160 100 - 130Data Analyst 130 - 160 125+ 90 - 110 60 - 75 N/A N/AProcess Analyst 80 - 105 75 - 100 75 - 95 60 - 70 N/A N/ATrainer 85 - 110 50 - 75 80 - 100 60 - 70 N/A N/ATechnical Writer 95 - 130 55 - 100 80 - 100 65 - 85 N/A N/A

16
Sydney Newcastle Canberra
Permanent AUD '000
Contractor AUD/hour
Permanent AUD '000
Contractor AUD/hour
Permanent AUD '000
Contractor AUD/hour
Enterprise ApplicationsJDE/Oracle/PeopleSoft Functional Consultant 90 - 140 75 - 100 90 - 140 75 - 100 110 - 160 125 - 150
JDE/Oracle/PeopleSoft Technical Consultant 90 - 140 75 - 100 90 - 140 75 - 100 120 - 160 130 - 160
JDE/Oracle/PeopleSoft Developer 90 - 130 75 - 100 90 - 110 75 - 100 100 - 150 120 - 140
SAP Functional Consultant 85 - 130 75 - 120 85 - 130 75 - 120 130 - 180 N/ASAP Technical Consultant 85 - 130 75 - 120 85 - 130 75 - 120 130 - 200 N/ASAP Architect 120 - 180 110 - 160 120 - 180 110 - 160 150 - 220 N/ASAP Administrator 75 - 140 60 - 95 80 - 110 60 - 95 120 - 140 N/ADynamics/CRM Functional Consultant 90 - 130 70 - 100 90 - 130 75 - 100 130 - 150 100 - 115
Dynamics/CRM Technical Consultant 90 - 130 75 - 100 90 - 130 75 - 100 130 - 160 110 - 130
Dynamics/CRM Developer 85 - 130 70 - 95 90 - 110 70 - 95 120 - 150 100 - 130Salesforce Functional Consultant 90 - 150 70 - 110 90 - 140 70 - 110 N/A N/A
Salesforce Technical Consultant 90 - 150 70 - 110 90 - 140 70 - 110 N/A N/A
Salesforce Developer 90 - 150 65 - 95 90 - 110 65 - 95 N/A N/ASalesforce Administrator 90 - 150 60 - 90 80 - 110 60 - 90 N/A N/ABusiness Intelligence Developer/Analyst 80 - 130 60 - 120 80 - 120 60 - 120 95 - 140 90 - 125
95 - 140 90 - 125DevelopmentDeveloper - .NET 80 - 130 75 - 100 80 - 115 60 - 90 90 - 140 100 - 125Developer - Java/J2EE 80 - 130 75 - 100 80 - 115 60 - 90 100 - 140 90 - 125Front End/UI Developer 90 - 135 60 - 90 80 - 110 60 - 90 85 - 130 75 - 120
17
Sydney Newcastle Canberra
Permanent AUD '000
Contractor AUD/hour
Permanent AUD '000
Contractor AUD/hour
Permanent AUD '000
Contractor AUD/hour
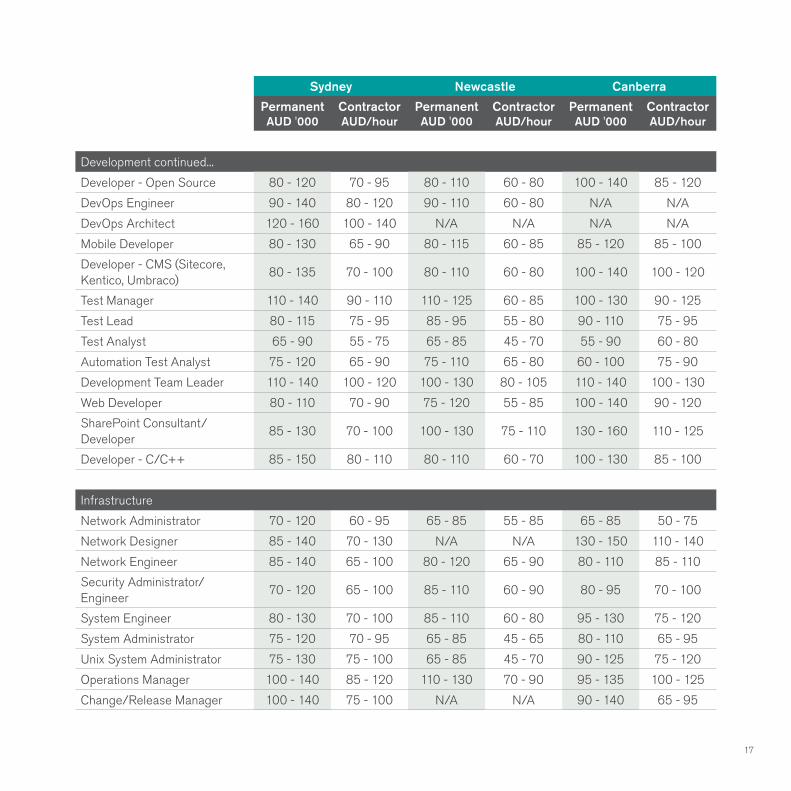
Development continued...Developer - Open Source 80 - 120 70 - 95 80 - 110 60 - 80 100 - 140 85 - 120DevOps Engineer 90 - 140 80 - 120 90 - 110 60 - 80 N/A N/ADevOps Architect 120 - 160 100 - 140 N/A N/A N/A N/AMobile Developer 80 - 130 65 - 90 80 - 115 60 - 85 85 - 120 85 - 100Developer - CMS (Sitecore, Kentico, Umbraco) 80 - 135 70 - 100 80 - 110 60 - 80 100 - 140 100 - 120
Test Manager 110 - 140 90 - 110 110 - 125 60 - 85 100 - 130 90 - 125Test Lead 80 - 115 75 - 95 85 - 95 55 - 80 90 - 110 75 - 95Test Analyst 65 - 90 55 - 75 65 - 85 45 - 70 55 - 90 60 - 80Automation Test Analyst 75 - 120 65 - 90 75 - 110 65 - 80 60 - 100 75 - 90Development Team Leader 110 - 140 100 - 120 100 - 130 80 - 105 110 - 140 100 - 130Web Developer 80 - 110 70 - 90 75 - 120 55 - 85 100 - 140 90 - 120SharePoint Consultant/Developer 85 - 130 70 - 100 100 - 130 75 - 110 130 - 160 110 - 125
Developer - C/C++ 85 - 150 80 - 110 80 - 110 60 - 70 100 - 130 85 - 100
InfrastructureNetwork Administrator 70 - 120 60 - 95 65 - 85 55 - 85 65 - 85 50 - 75Network Designer 85 - 140 70 - 130 N/A N/A 130 - 150 110 - 140Network Engineer 85 - 140 65 - 100 80 - 120 65 - 90 80 - 110 85 - 110Security Administrator/Engineer 70 - 120 65 - 100 85 - 110 60 - 90 80 - 95 70 - 100
System Engineer 80 - 130 70 - 100 85 - 110 60 - 80 95 - 130 75 - 120System Administrator 75 - 120 70 - 95 65 - 85 45 - 65 80 - 110 65 - 95Unix System Administrator 75 - 130 75 - 100 65 - 85 45 - 70 90 - 125 75 - 120Operations Manager 100 - 140 85 - 120 110 - 130 70 - 90 95 - 135 100 - 125Change/Release Manager 100 - 140 75 - 100 N/A N/A 90 - 140 65 - 95

18
Sydney Newcastle Canberra
Permanent AUD '000
Contractor AUD/hour
Permanent AUD '000
Contractor AUD/hour
Permanent AUD '000
Contractor AUD/hour
Infrastructure continued...Helpdesk/Service Desk Manager 85 - 120 65 - 80 65 - 85 40 - 60 75 - 100 50 - 70
Helpdesk - 1st Level Support 50 - 70 30 - 50 50 - 55 25 - 35 65 - 80 35 - 45Service Desk - 2nd Level Support 50 - 70 30 - 50 50 - 55 25 - 35 70 - 85 35 - 50
Helpdesk/Service Desk Lead 65 - 90 50 - 70 55 - 65 40 - 60 45 - 65 35 - 55DBA - Oracle 85 - 130 80 - 120 90 - 120 65 - 100 85 - 110 90 - 125DBA - SQL Server 85 - 130 80 - 120 85 - 110 65 - 90 85 - 110 90 - 125Desktop Support Analyst 75 - 90 50 - 80 50 - 65 25 - 35 75 - 90 90 - 125DevOps Engineer 90 - 130 70 - 110 90 - 110 65 - 85 N/A N/AApplications Packager 70 - 110 65 - 90 60 - 70 40 - 50 90 - 130 100 - 125 Application Support Analyst 60 - 90 45 - 65 N/A N/A 85 - 120 85 - 110
UX & Digital DesignUX/CX & Service Designer 80 - 130 65 - 110 N/A N/A 100 - 150 90 - 135UX Manager 140 - 180 100 - 140 N/A N/A 120 - 170 120 - 140 UI Designer 80 - 130 65 - 110 75 - 110 50 - 70 90 - 150 85 - 130 UX Designer 80 - 130 65 - 110 75 - 110 50 - 70 90 - 150 85 - 130Digital Designer 70 - 100 50 - 75 70 - 100 50 - 70 75 - 130 55 - 100 Web Designer 65 - 110 50 - 85 70 - 100 50 - 70 60 - 110 45 - 100 UX Architect 110 - 160 80 - 120 100 - 130 70 - 100 120 - 170 120 - 140Graphic, Visual & Interactive Designer 60 - 90 50 - 75 60 - 80 40 - 55 60 - 110 65 - 85

19
Brisbane Melbourne
Permanent AUD '000
Contractor AUD/hour
Permanent AUD '000
Contractor AUD/hour
Senior ManagementCIO/GMIT/IT Director 200 - 300 N/A 190 - 280 N/ACTO 160 - 230 N/A 170 - 260 N/AIT Manager 120 - 150 100 - 120 150 - 250 100 - 150Infrastructure Manager 110 - 140 90 - 110 110 - 170 80 - 110Network Manager 90 - 110 75 - 90 100 - 130 80 - 100Business Systems Manager 120 - 160 120 - 160 120 - 160 90 - 120Development Manager 120 -150 100 - 120 120 - 190 85 - 120Enterprise Architect 150 - 180 120 - 140 150 - 210 110 - 150Information Security Manager 150 - 180 120 - 140 150 - 200 110 - 150Security Architect 150 - 180 120 - 140 150 - 200 110 - 150Solutions Architect - Infrastructure 130 - 150 90 - 110 130 - 180 105 - 135Solutions Architect - Applications 130 - 150 90 - 110 130 - 180 105 - 135
Project ServicesPMO Manager 130 - 160 90 - 115 160 - 220 100 - 130Portfolio Manager 130 - 160 90 - 115 170 - 220 80 - 100Program Manager 150 - 180 115 - 150 150 - 210 100 - 130Senior Project Manager 140 - 160 100 - 115 140 - 180 80 - 100Project Manager 120 - 150 90 - 105 110 - 160 100 - 120Project Scheduler 80 - 120 80 - 100 90 - 130 75 - 100Project Coordinator 65 - 80 55 - 75 80 - 100 60 - 80Project Administrator 50 - 70 35 - 60 60 - 80 60 - 80PMO Analyst 70 - 100 70 - 90 85 - 110 70 - 85Change Manager 120 - 150 85 - 125 110 - 150 110 - 140Change Analyst 90 - 110 80 - 95 90 - 110 70 - 90Change Communications Manager 100 - 130 85 - 115 120 - 180 90 - 120

20
Brisbane Melbourne
Permanent AUD '000
Contractor AUD/hour
Permanent AUD '000
Contractor AUD/hour
Project Services continued...Senior Business Analyst 110 - 130 85 - 100 110 - 150 105 - 125Business Analyst 95 - 110 75 - 90 90 - 110 85 - 100Business Architect 120 - 150 100 - 125 110 - 150 100 - 135Scrum Master 130 - 160 100 - 125 100 - 120 90 - 110Agile Coach 150 - 180 125 - 150 150 - 180 110 - 140Data Scientist 120 - 160 100 - 140 110 - 150 90 - 120Data Analyst 60 - 90 35 - 65 90 - 120 80 - 95Process Analyst 90 - 110 75 - 90 90 - 110 85 - 100Trainer 80 - 100 60 - 85 80 - 105 75 - 100Technical Writer 80 - 100 60 - 85 90 - 110 70 - 100
Enterprise ApplicationsJDE/Oracle/PeopleSoft Functional Consultant 70 - 110 80 - 130 90 - 140 75 - 100
JDE/Oracle/PeopleSoft Technical Consultant 65 - 95 80 - 110 90 - 140 75 - 100
JDE/Oracle/PeopleSoft Developer 65 - 95 70 - 100 90 - 130 75 - 100SAP Functional Consultant 110 - 170 80 - 150 85 - 130 75 - 120SAP Technical Consultant 110 - 150 80 - 135 85 - 130 75 - 120SAP Architect 120 - 165 125 - 200 120 - 180 110 - 160SAP Administrator 80 - 120 65 - 95 75 - 140 60 - 95Dynamics/CRM Functional Consultant 95 - 135 80 - 130 90 - 130 70 - 100
Dynamics/CRM Technical Consultant 95 - 135 80 - 110 90 - 130 75 - 100Dynamics/CRM Developer 80 - 100 70 - 100 85 - 130 70 - 95Salesforce Functional Consultant 90 - 150 70 - 80 90 - 150 70 - 110Salesforce Technical Consultant 90 - 150 70 - 80 90 - 150 70 - 110

21
Brisbane Melbourne
Permanent AUD '000
Contractor AUD/hour
Permanent AUD '000
Contractor AUD/hour
Enterprise Applications continued...Salesforce Developer 90 - 150 70 - 100 90 - 150 65 - 100Salesforce Administrator 90 - 150 60 - 80 90 - 150 60 - 100Business Intelligence Developer/Analyst 75 - 125 80 - 120 90 - 120 70 - 85
75 - 125 80 - 120DevelopmentDeveloper - .NET 60 - 130 60 - 110 80 - 120 70 - 95Developer - Java/J2EE 80 - 110 60 - 100 80 - 120 70 - 95Front End/UI Developer 70 - 120 60 - 100 80 - 120 65 - 90Developer - Open Source 70 - 110 50 - 90 80 - 120 70 - 95DevOps Engineer 90 - 130 70 - 90 90 - 140 95 - 115DevOps Architect 90 - 120 80 - 100 110 - 160 125 - 170Mobile Developer 90- 120 80 - 100 80 - 120 70 - 95Developer - CMS (Sitecore, Kentico, Umbraco) 100 - 140 80 - 110 80 - 120 70 - 100
Test Manager 120 - 150 100 - 150 110 - 150 95 - 115Test Lead 100 - 130 90 - 100 80 - 120 75 - 95Test Analyst 60 - 80 65 - 95 70 - 95 55 - 75Automation Test Analyst 80 - 100 75 - 95 90 - 130 75 - 110Development Team Leader 110 - 140 90 - 120 110 - 140 85 - 105Web Developer 60 - 120 60 - 100 80 - 120 65 - 90SharePoint Consultant/Developer 90 - 130 70 - 100 80 - 120 65 - 95Developer - C/C++ 80 - 120 70 - 100 85 - 140 80 - 110
InfrastructureNetwork Administrator 70 - 100 45 - 65 80 - 110 60 - 95Network Designer 80 - 120 55 - 80 85 - 150 65 - 110

22
Brisbane Melbourne
Permanent AUD '000
Contractor AUD/hour
Permanent AUD '000
Contractor AUD/hour
Infrastructure continued...Network Engineer 80 - 120 60 - 80 85 - 150 65 - 110Security Administrator/Engineer 70 - 110 60 - 100 85 - 130 65 - 110System Engineer 70 - 110 65 - 90 80 - 130 65 - 100System Administrator 70 - 100 50 - 80 80 - 130 65 - 100Unix System Administrator 70 - 90 50 - 65 75 - 130 75 - 100Operations Manager 90 - 120 70 - 90 100 - 140 85 - 120Change/Release Manager 100 - 130 75 - 95 100 - 140 85 - 120Helpdesk/Service Desk Manager 80 - 110 40 - 60 85 - 120 70 - 100Helpdesk - 1st Level Support 50 – 70 25 - 35 50 - 70 30 - 50Service Desk - 2nd Level Support 60 - 80 30 - 45 50 - 70 30 - 50Helpdesk/Service Desk Lead 65 - 90 35 - 50 65 - 90 50 - 70DBA - Oracle 80 - 120 50 - 70 90 - 130 70 - 105DBA - SQL Server 80 - 120 50 - 70 90 - 130 65 - 95Desktop Support Analyst 65 - 90 35 - 45 75 - 90 50 - 80DevOps Engineer 90 - 130 70 - 90 90 - 140 95 - 120Applications Packager 70 - 100 50 - 70 70 - 110 65 - 95Application Support Analyst 55 - 85 45 - 60 70 - 100 45 - 60
70 - 100 50 - 70 UX & Digital DesignUX/CX & Service Designer 80 - 120 50 - 75 80 - 130 65 - 110UX Manager 120 - 150 75 - 95 140 - 180 100 - 140UI Designer 80 - 110 50 - 75 90 - 130 65 - 105UX Designer 80 - 110 50 - 75 90 - 130 65 - 105Digital Designer 90 - 110 55 - 85 70 - 100 50 - 75Web Designer 60 - 120 60 - 90 65 - 110 50 - 85UX Architect 90 - 140 100 - 140 80 - 160 80 - 120Graphic, Visual & Interactive Designer 60 - 120 60 - 90 60 - 100 50 - 85

23
Adelaide Perth
Permanent AUD '000
Contractor AUD/hour
Permanent AUD '000
Contractor AUD/hour
Senior ManagementCIO/GMIT/IT Director 150 - 300 N/A 150 - 350 N/ACTO 150 - 280 N/A 100 - 250 N/AIT Manager 100 - 160 75 - 100 100 - 160 80 - 120Infrastructure Manager 100 - 130 80 - 105 100 - 130 80 - 100Network Manager 100 - 160 75 - 100 90 - 120 80 - 100Business Systems Manager 100 - 120 80 - 105 120 - 140 80 - 100Development Manager 105 - 130 75 - 110 100 - 150 80 - 100Enterprise Architect 120 - 160 100 - 150 120 - 200 100 - 150Information Security Manager 100 - 150 70 - 100 150 - 200 80 - 120Security Architect 110 - 140 90 - 150 100 - 150 100 - 150Solutions Architect - Infrastructure 110 - 140 90 - 150 100 - 150 90 - 120Solutions Architect - Applications 110 - 140 90 - 150 120 - 180 100 - 120
Project ServicesPMO Manager 170 - 200 160+ 120 - 180 80 - 110Portfolio Manager 130 - 150 80 - 100 120 - 160 80 - 120Program Manager 120 - 160 100 - 130 130 - 180 80 - 110Senior Project Manager 120 - 140 120 - 130 115 - 165 80 - 110Project Manager 95 - 130 80 - 120 85 - 130 60 - 100Project Scheduler 75 - 90 70 - 90 70 - 100 50 - 70Project Coordinator 50 - 70 45 - 65 60 - 80 45 - 65Project Administrator 45 - 55 35 - 45 55 - 65 40 - 50PMO Analyst 70 - 90 55 - 65 70 - 110 50 - 80Change Manager 100 - 140 75 - 110 80 - 120 60 - 90Change Analyst 70 - 90 55 - 70 65 - 90 40 - 60Change Communications Manager 100 - 140 75 - 110 80 - 120 80 - 100Senior Business Analyst 110 - 120 110 - 130 90 - 115 70 - 90

24
Adelaide Perth
Permanent AUD '000
Contractor AUD/hour
Permanent AUD '000
Contractor AUD/hour
Project Services continued...Business Analyst 75 - 100 65 - 85 70 - 100 60 - 80Scrum Master 100 - 140 100 - 130 100 - 140 90 - 110Agile Coach 100 - 120 90 - 120 100 - 140 90 - 110Data Scientist 120 - 160 80 - 100 120 - 160 90 - 120Data Analyst 75 - 85 45 - 55 70 - 100 60 - 80Process Analyst 75 - 100 65 - 85 60 - 100 50 - 80Trainer 70 - 85 45 - 55 70 - 110 60 - 80Technical Writer 70 - 85 45 - 55 70 - 110 60 - 80
Enterprise ApplicationsJDE/Oracle/PeopleSoft Functional Consultant 90 - 140 75 - 100 80 - 120 70 - 90
JDE/Oracle/PeopleSoft Technical Consultant 90 - 140 75 - 100 80 - 120 70 - 90
JDE/Oracle/PeopleSoft Developers 90 - 130 75 - 100 80 - 120 70 - 90SAP Functional Consultant 85 - 130 75 - 120 80 - 130 75 - 120SAP Technical Consultant 85 - 130 75 - 120 80 - 130 75 - 120SAP Architect 120 - 180 110 - 160 120 - 180 110 - 160SAP Administrator 75 - 140 60 - 95 80 - 130 70 - 110Dynamics/CRM Functional Consultant 90 - 130 75 - 100 90 - 140 75 - 100
Dynamics/CRM Technical Consultant 90 - 130 75 - 100 90 - 140 75 - 90Dynamics/CRM Developers 85 - 130 70 - 95 80 - 140 70 - 90Salesforce Functional Consultant 90 - 150 70 - 110 90 - 130 70 - 90Salesforce Technical Consultant 90 - 150 70 - 110 90 - 130 70 - 90Salesforce Developers 90 - 150 65 - 95 90 - 130 60 - 85Salesforce Administrators 90 - 150 60 - 90 90 - 130 55 - 80

25
Adelaide Perth
Permanent AUD '000
Contractor AUD/hour
Permanent AUD '000
Contractor AUD/hour
Enterprise Applications continued...Business Intelligence Developer/Analyst 90 - 110 55 - 70 100 - 150 80 - 120
DevelopmentDeveloper - .Net 80 - 130 60 - 80 70 - 120 60 - 90Developer - Java/J2EE 80 - 130 65 - 85 70 - 120 60 - 90Front End/UI Developer 80 - 120 60 - 90 70 - 110 60 - 90Developer - Open Source 70 - 90 60 - 80 70 - 110 60 - 90DevOps Engineer 80 - 140 80 - 120 90 - 120 70 - 100DevOps Architect 120 - 160 100 - 140 100 - 140 80 - 110Mobile Developer 70 - 120 60 - 85 70 - 110 60 - 90Developer - CMS (Sitecore, Kentico, Umbraco) 85 - 130 70 - 120 70 - 110 60 - 90
Test Manager 85 - 110 75 - 95 90 - 140 90 - 110Test Lead 75 - 100 55 - 80 80 - 120 70 - 90Test Analyst 60 - 90 45 - 65 60 - 90 40 - 70Automation Test Analyst 75 - 120 65 - 90 60 - 90 40 - 70Development Team Leader 100 - 130 80 - 105 90 - 130 70 - 100Web Developer 80 - 100 70 - 90 60 - 90 40 - 70SharePoint Consultant/Developer 85 - 130 75 - 110 90 - 140 70 - 110Developer - C/C++ 75 - 110 60 - 80 70 - 120 60 - 90
InfrastructureNetwork Administrator 70 - 90 45 - 65 65 - 80 45 - 60Network Designer 85 - 115 60 - 80 75 - 110 55 - 80Network Engineer 85 - 115 60 - 80 75 - 110 55 - 80Security Administrator/Engineer 80 - 100 45 - 65 60 - 90 50 - 65
26
Adelaide Perth
Permanent AUD '000
Contractor AUD/hour
Permanent AUD '000
Contractor AUD/hour
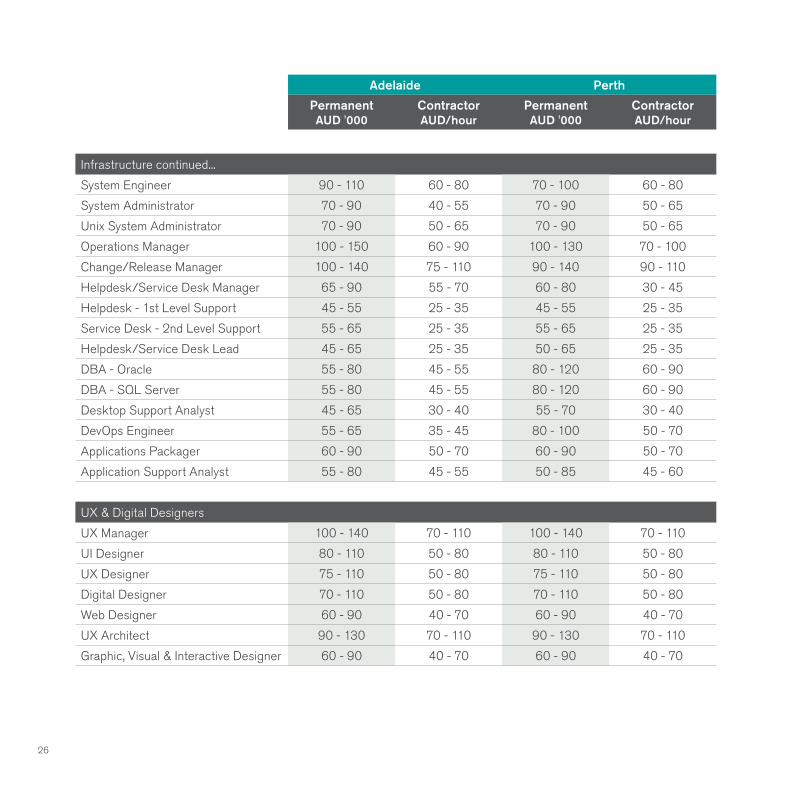
Infrastructure continued...System Engineer 90 - 110 60 - 80 70 - 100 60 - 80System Administrator 70 - 90 40 - 55 70 - 90 50 - 65Unix System Administrator 70 - 90 50 - 65 70 - 90 50 - 65Operations Manager 100 - 150 60 - 90 100 - 130 70 - 100Change/Release Manager 100 - 140 75 - 110 90 - 140 90 - 110Helpdesk/Service Desk Manager 65 - 90 55 - 70 60 - 80 30 - 45Helpdesk - 1st Level Support 45 - 55 25 - 35 45 - 55 25 - 35Service Desk - 2nd Level Support 55 - 65 25 - 35 55 - 65 25 - 35Helpdesk/Service Desk Lead 45 - 65 25 - 35 50 - 65 25 - 35DBA - Oracle 55 - 80 45 - 55 80 - 120 60 - 90DBA - SQL Server 55 - 80 45 - 55 80 - 120 60 - 90Desktop Support Analyst 45 - 65 30 - 40 55 - 70 30 - 40DevOps Engineer 55 - 65 35 - 45 80 - 100 50 - 70Applications Packager 60 - 90 50 - 70 60 - 90 50 - 70Application Support Analyst 55 - 80 45 - 55 50 - 85 45 - 60
UX & Digital DesignersUX Manager 100 - 140 70 - 110 100 - 140 70 - 110UI Designer 80 - 110 50 - 80 80 - 110 50 - 80UX Designer 75 - 110 50 - 80 75 - 110 50 - 80Digital Designer 70 - 110 50 - 80 70 - 110 50 - 80Web Designer 60 - 90 40 - 70 60 - 90 40 - 70UX Architect 90 - 130 70 - 110 90 - 130 70 - 110Graphic, Visual & Interactive Designer 60 - 90 40 - 70 60 - 90 40 - 70

27
This salary guide is a compilation of salary and market information provided by Hudson consultants, clients, candidates and other sources across Australia. Information was gathered by drawing on the extensive knowledge of our specialist recruitment consultants across Hudson’s specialist practice groups. Salary ranges are approximate guides only. They relate to base salaries and exclude superannuation/bonuses/incentive schemes/stock options.

au.hudson.com
Methodology
Hudson undertook quantitative research with hiring managers and employees across Australia to analyse the talent landscape and provide insights on what employers might expect in 2017 and beyond.
We canvassed the views of 3,754 Australian employers and employees in November 2016. From these findings we developed this report — a combination of the survey findings and Hudson's specialist insights on the hiring landscape.
We have also included data and insights from Hudson quantitative and qualitative research of 3,555 candidates from the Asia Pacific region undertaken in H1 2016 to better understand the way that job seekers engage with recruiters and the job selection process.
Percentages don't always total 100% as respondents could select more than one option for certain questions.
Hudson Technology & Digital
Hudson's specialist recruitment consultants have the in-depth market knowledge of salaries, job titles and hiring trends to ensure you achieve the best outcome for your organisation at the appropriate remuneration.
We build highly nurtured and engaged pools of select talent so you can find the right person quickly. This means greater speed and precision in placements, and higher satisfaction for both clients and candidates.
Our proprietary assessment tools and techniques will help you find candidates with the right technical skills and capabilities for the role and for your team, so you can achieve higher performance and superior business results.


