
SURVEY RESEARCH OF THE CANNED CRAFT BEER INDUSTRY
Presented to the
Faculty of the Agribusiness Department
California Polytechnic State University
In Partial Fulfillment
of the Requirements for the Degree
Bachelor of Science
By
Scott Taylor Hogland
December 2013

ABSTRACT
This study on the canned craft beer industry was done to see whether or not a
significant correlation between one’s age and their willingness to purchase craft beers in
cans exists. Furthermore, it sets out to test how creating further consumer awareness
highlighting the beneficial aspects of cans versus bottles could affect one’s purchasing
decisions.
In order to test the hypothesis that millennials are more open to purchasing
canned craft beer, the statistical analysis software SPSS has been utilized. Frequencies
have been run on every survey question to obtain an analysis of the entire population.
Chi-square variance tests and independence sample t tests were utilized to examine any
correlation between millennials and non-millennials.
As expected, it has been determined that millennials are more open to purchasing
craft beers in cans. Furthermore, boosting the promotion of cans over bottles would likely
increase the purchasing for all age groups. Craft brewers should redirect some of their
marketing strategy towards a younger demographic. The concept of their marketing plan
should focus on the idea of a convenient product that has no compromise of taste.

TABLE OF CONTENTS
Chapter Page
I. INTRODUCTION ........................................................................................... 1
Statement of the Problem ..................................................................... 2
Hypothesis ........................................................................................... 3
Objectives of the Study ........................................................................ 3
Significance of the Study ..................................................................... 3
II. REVIEW OF THE LITERATURE .................................................................. 5
Craft Beer Industry History .................................................................. 5
Study on Consumer Perception ............................................................ 8
Addressing Survey Issues and Selecting Survey Method .................... 9
Survey Research on Social Networks .................................................. 11
III. METHODOLOGY ........................................................................................... 15
Procedures for Data Collection ............................................................ 15
Procedures for Data Analysis ............................................................... 16
Assumptions and Limitations ............................................................... 18
IV. DEVELOPMENT OF THE STUDY ............................................................... 19
Overview of Total Population .............................................................. 19
Testing the Hypothesis ......................................................................... 23
V. SUMMARY, CONCLUSIONS, AND RECCOMMENDATIONS ................ 31
Summary .............................................................................................. 31
Conclusions .......................................................................................... 31
Recommendations ................................................................................ 32
References Cited ........................................................................................................... 34
APPENDIX .................................................................................................................. 36

Chapter 1
INTRODUCTION
As of March 2013, there were 2,360 reported craft breweries throughout the
United States (Brewers Association, 2013). This statistic accounts for 47.6% brewpubs,
48.3% microbreweries, and 4.1% regional craft breweries. According to the Brewers
Association, craft breweries are responsible for an estimated 108,440 jobs. In 2012, this
industry experienced a 17% growth in total dollars and 15% in total volume (Brewers
Association, 2013). From 2011 to 2012, craft brewing saw a drastic growth of 1.76
million barrels of beer sold. Finally, the total retail dollar value was estimated to be $10.2
billion, a substantial jump from the previous year (Brewers Association, 2013).
The previous statistical values clearly demonstrate the recent success of the craft
beer industry. Many of these breweries thrive off product differentiation, taste, unique
labels, locality, etc. Amongst the many qualities that place craft beers in the upper
echelon of the beer family is consumer perception. Until recently, a majority of
consumers often connected the phrase “craft beer” with a bottle. However, many craft
breweries have recently introduced canned beers to their line of production. Currently,
262 craft breweries have implemented cans in the United States. Of the 824 different
brands that been released in cans from 2012 to 2013, 528 have been packaged in 12 oz.
cans, 276 in 16 oz. cans, and the remaining 20 in varying sizes (Canned Craft Beer Stats,
2013). Some notable names include Sierra Nevada, New Belgium, and Boston Beer
Brewing Companies.
1

Despite canned beers being introduced by brewers in 2002 and experiencing
positive sales, producers continue to fight the perception that craft beers in cans lose their
“premium status” without the bottle. This is possibly more prevalent amongst older beer
drinkers as they are more rigid with their purchasing decisions. Millennials, generally
living a more carefree lifestyle, appear much more open to purchasing craft beers in cans.
Furthermore, enhancing consumer awareness amongst millennials concerning the
beneficial aspects of aluminum cans vs. bottles could have a huge influence on consumer
perception.
Appealing to the millennial demographic by highlighting drinkability,
environmental statistics of cans, and the increased “on-the-go” efficiency of this
packaging would be very beneficial to craft brewers and consumers alike. For instance,
consumers must be informed that almost every craft beer can contains a water based
epoxy that assures the aluminum and beer never meet each other, solidifying an excellent
taste. Concerning the environment, aluminum cans are 100% recyclable and have 68%
recycled content, the highest of any beverage package material (Can Manufacturers
Institute, 2013). Finally, cans present the best opportunity for enjoying beer on the go as
many cities forbid the usage of bottles in public spaces such as parks and beaches.
Problem Statement
What can be done to get rid of the stigma attached to canned craft beers amongst the
older demographic (34+ years of age)?
2

Hypothesis
The millennial demographic (21-33) is more open to purchasing craft beers in
cans than other age groups. Creating consumer awareness amongst both milliennials and
the older demographic highlighting the beneficial aspects of cans versus bottles will
further enhance their willingness to purchase.
Objectives
1) To examine how consumers perceive canned craft beers prior to gaining knowledge
about certain characteristics.
2) Compare the millennial demographic (21-33) against the rest of consumers.
2) To see how highlighting the positive aspects of cans versus bottles changes millennials’
mindset and purchasing decisions.
Significance of the Study
Craft breweries are a fast expanding sector of the alcohol industry that make up
6.6% of the entire United States beer market (Beer Association, 2013). Taking a closer
look at how consumers will react to canned craft beers could be a strong indicator of what
to look forward to in the future. This study is very important for both the consumer and
producer. The consumer, especially the younger demographic, ultimately wants to figure
out if paying extra for a craft beer that is not bottled is worth it. The producer wants to
know if it is economically feasible and smart to continue canning their beers. Gaining a
3

deeper understanding about consumer perceptions and willingness to buy is the deciding
factor that could decide the future of craft beers in cans.
4

Chapter 2
REVIEW OF THE LITERATURE
Craft Beer Industry History
Craft breweries are part of a fast expanding industry despite being very small
in scale compared to the entire beer market. Craft breweries make up 6.6% of the
entire United States beer market but have experienced 17% growth in total sales
since 2012 (Beer Association, 2013). According to Kleban and Nickerson (2011),
craft breweries tend to be independent and produce fewer than 6 million barrels
each year. The concept of being independent means that at least 75% of the
company is owned by someone who is a craft brewer themselves. By introducing
non-traditional brewing methods to coincide with conventional ingredients such as
malted barley, they are able to create full tasting beers. Microbreweries thrive off
product differentiation.
Kleban and Nickerson (2011) explain how there are 6 categories of craft
breweries depending on total output of barrels per year. The list from smallest to
largest goes in this order: microbreweries, brewpub, contract brewing company,
regional craft brewery, and large brewery. To be classified a microbrewery, at least
75% of beer must be sold off-site and less than 15,000 barrels per year can be
produced (Beer Association, 2013). A brewpub primarily sells their product at a
restaurant or bar, with at least 25% of beer sales on site (Beer Association, 2013).
Contract Brewing Companies hire another party to produce their beer. The Beer
5

Association (2013) goes into deeper detail by stating, “The contract brewing company
handles marketing, sales, and distribution of its beer, while generally leaving the brewing
and packaging to its producer-brewery.” Finally, a large brewery is one that has a yearly
beer production of 6,000,000 barrels or more (Beer Association, 2013).
Kleban and Nickerson (2011) continue to reiterate the concept of product
differentiation in stating, “competition within the domestic craft beer segment and
other high quality beer categories is based on product quality, consistency,
freshness, and taste. Craft breweries must also be keen in their ability to produce by
utilizing a variety of methods, mainly: promotional tactics, customer satisfaction
programs, distribution costs and price.” The most competitive segment of the craft
brewery segments is microbreweries due to the fact there are many of them but
make up a small portion of the market share amongst the total beer market (Beer
Association, 2013). Although national breweries tend to have the financial capability
for expensive promotion, microbreweries thrive off local consumers that desire a
“unique” product. Strong competitors are in the international market as imports
make up a strong percentage of craft beer sales. Furthermore, the general beer
segment continues to lose nearly 1% of market share to the wine segment each year
since 2003 (US Census Bureau, 2013).
Despite the strong presence of large National Beer companies, the Global
Market Information Data Resource (GMID) (2012) states that the “movement of
smaller craft breweries has been extremely dynamic.” In fact, there are around 100
new microbreweries opening up across the United States each year. Despite this
6

significant growth, GMID (2012) shows that it is very hard for these small-privatized
labels to gain a significant share of the United States beer market due to the three-
tier system that enforces varying regulations in different states. Boston Beer Co Inc.,
Sierra Nevada Brewing Company, and New Belgium comprise the top three craft
breweries in the United States but only make up 1.8% of national beer shares in
volume (Beer Association, 2013). A strong majority of the total United States beer
sales in total volume belong to MillerCoors LLC and AB InBev. Furthermore, GMID
explains how many big corporations such as these two are buying out craft
breweries, leading a trend towards mergers. Along this topic, the top four brands in
the US market have similar inexpensive pricing strategies of $5-$6 per six pack. This
competitive marketing segment makes it essential for craft breweries to
differentiate their generally higher priced products.
Various studies have been completed attempting to project craft beer market
growth over the next few years. Infiniti Research Ltd conducted a research
highlighting where they believe the market will be in 2016. Contributing
researchers to this study believe the craft beer market will grow at a rate of 17.46
over the span of 2012-2016. Much of this projection is based on an apparent change
in consumer taste and desire for craft beer. Furthermore, they believe a huge
contributing factor to this growth rate is the addition of cans to many packaging
lines for craft breweries. Along with the three big craft breweries mentioned in the
previous paragraph, contributors to this report also discuss a list of other craft
breweries making an impact in the craft beer market. This list goes includes the
following: Anheuser Busch Inc., Bell’s Brewery Inc., Boulevard Brewing Co.,
7
Deschutes Brewery Co., Lagunitas Brewing Co., Matt Brewing Co., MillerCoors LLC,
and Oskar Blues Brewing Co.
Although the numerous studies on the craft beer industry may vary, there
appears to be one reappearing theme. Even though the market is somewhat
dominated my mass-producing brewing companies, the number of small craft
breweries continue to increase rather steadily. Stanford Professor Glenn Carroll
(2013) believes that these apparently contradictory trends may be in fact be
interrelated and have some sense of organizational ecology.
Study on Consumer Perception
Many factors come in to play when analyzing consumer perception
concerning a particular brand of beer. Looking at cans vs. bottles implies a variety
of characteristics including price, taste, labels, etc. that influence overall perception.
Allison and Uhl (1994) attempt to explain this complex relationship in their survey
study of beer brand identification on taste perception. Their study strives to prove
that beer drinkers cannot distinguish between two unlabeled brands based on taste,
strengthening the argument that perception is what drives consumer purchasing.
To perform this study, 326 randomly selected beer drinkers were given an
unlabeled 6 pack of beer, consisting of multiple regional and national brands with
differing taste characteristics. The taste test proved there was no difference
between the brands at a .05 significance level. If the p-value is lower than .05, the
null is rejected and relationship is concluded. Allison and Uhl (1994) found a strong
8

correlation. In fact, most respondents couldn’t even distinguish their favorite brand
from others.
The label test performed by Allison and Uhl discussed in the previous
paragraphs show that knowing the label of beer prior to the survey resulted in much
higher ratings on the specified categories of taste, once again strengthening the
argument that perception is a huge factor in gaining purchasing and brand loyalty.
In relation to cans vs. bottles, this study shows that the main focus must be on
marketing efforts that emphasize certain characteristics whether it be
environmental/sustainability issues, convenience, label designs, etc. Huffington
(2012) demonstrates this concept in her related survey study as a mere 44% of
respondents correctly identified a canned Sierra Nevada Torpedo vs. bottled when
the beer was poured into cups. Therefore, creating enhanced consumer awareness
is vital in influencing a certain product characteristic such as cans over bottles.
Addressing Survey Issues and Selecting Survey Method
William M.K. Trochim’s study examines multiple issues that must be
considered when deciding a proper survey method. The first issue discussed is
population issues. Some of the various factors include whether or not the population
can be counted, literacy issues, language barriers, and most importantly whether or
not the respondents will cooperate (Trochim, 2006). Many people have very busy
schedules or simply do not want to partake in a survey. Furthermore, some surveys
9
try to examine controversial subjects and respondents don’t feel comfortable
helping out with the research. The final aspect of population issues is geography.
Some survey requires the study to examine a wide geographic range, which makes
proper findings less feasible (Trochim, 2006).
The next important survey aspect to consider are issues with the questions
that will be asked. It is important to decide what types of questions are to be asked,
how complex they will be, and whether or not screening questions will be needed
(Trochim, 2006). For example, in the case of an alcohol survey, it is mandatory to
have an age screening question to assure no one under 21 completes the survey.
Quite possibly the most important part of the questioning is the actual content and
how it relates to the population being surveyed. The respondent should have at least
some background knowledge of the topic of study being examined (Trochim, 2006).
Once again, this applies to an alcohol study as the respondent should be a consumer
of the product being discussed whether beer, wine, spirits, etc.
The next issue is one that every survey administer attempts to avoid, bias
issues. A main concern for many people is standing out socially. No respondent
wants to be embarrassed, feel unintelligent, etc. so they are often tempted to lie
(Trochim, 2006). This is often more of an issue when delivering surveys face-to-face.
Trochim explains some tactics to approaching a face-face survey. For instance, an
interviewer may pretend to listen less attentively for questions that could
potentially put the respondent in an awkward position. Furthermore, they could
avoid asking the question all together (Trochim, 2006).
10

This leads into the discussion of deciding what form of survey to conduct.
Surveys can be broadly divided into two main categories, questionnaires and
interviews (Sincero 2012). Questionnaires generally contain close-ended questions
and can be both self and group administered. Self-administered tests are often
referred to as mail survey. However, mail surveys generally don’t result in the best
response rate so many surveyors now utilize web survey resources (Sincero 2012).
Questionnaires are often regarded as best for conducting consumer research, but
presents more limited responses compared to interviews (Sincero 2012).
Clearly, interviews are a much more personal form of interviewing. Different
forms of interviewing include phone interviews, face-to-face interviews, and online
interviews (Sincero 2012). One main advantage is that interviewing offers time to
conduct follow up questions based on the responses given. However, personal
interviews are extremely time consuming, a common problem faced by many
surveyors (Sincero 2012).
Survey Research on Social Networks
Survey research is a measurement tool that helps assess particular opinions,
feelings, concerns, etc. in various fields of study. This study utilizes survey research
to examine consumer perception of canned vs. bottled craft beers. Due to the fact
11

this is a rather unexplored area of study, it is important to take every measure
possible to gain a fair population representation.
The most important part of creating a fair survey study is targeting a sample
population that accurately represents a larger population. Sampling is a very fickle
form of market analysis as it is open to selection bias through unique population
demographics (Brickman-Bhutta, 2000). Another common problem is a small
sample size, as it may not accurately estimate unknown parameters. Therefore, it is
essential that proper survey techniques are utilized to assure the most accurate
results possible. Brickman-Bhutta (2000) analyzes the various new opportunities of
Internet research methods through social networks, stressing distribution efficiency
while maintaining validity. Furthermore, Brickman-Bhutta highlights the multiple
challenges that exist with Internet research methods.
According to Brickman-Bhutta (2000), “Online social networking sites offer
new ways for researchers to run surveys quickly, cheaply, and single-handedly –
especially when seeking to construct “snowball” samples of small or stigmatized
subsets of the general population.” Out of all the social networking sites, Facebook is
best suited for performing market research because each user has their own set of
online friends while also having access to millions of users worldwide if needed.
This is especially relevant to the study of canned vs. bottled craft beers as the study
targets the younger demographic between the age of 21 and 33, which is an easily
accessible demographic.
12

Along with being the biggest and fastest growing social network in the world,
Facebook presents various other positive qualities. For instance, Facebook provides
information and designated pages for different interests, education levels, and
hobbies that could be used to analyze sub populations of beer drinkers. Also, this
form of social networking is becoming more and more representative of the United
States population. According to O’Dell (2011), nearly 43% of the American
population uses Facebook at least once a month compared to only 7% on twitter.
Furthermore, a strong majority of the Facebook population falls under the age
demographic of 21-25.
One of the biggest research methods discussed in Brickmann-Bhutta’s (2000)
study is called snowballing, a chain-referral type of online survey. This technique is
useful in that it takes a small sample population related to a certain population, and
asks these individuals to recommend others for the survey study based on certain
characteristics. Doing this is beneficial in that it gradually increases the sample size
and targets desired subpopulations. For the study of consumer perception of canned
craft beer vs. bottled, it could be very useful to delineate the population into various
groups such as college undergraduate, graduate, post-graduate work etc.
Furthermore, people feel more willing to offer up personal information such as
income, marital status and current living location online rather than face-to-face.
However, the only downside as mentioned by Brickmann-Bhutta (2009) is the
possibility for sample bias, which needs to be avoided. Some of the other potential
problems according to Schmidt (1998) include incomplete responses, unacceptable
13

responses, and multiple submissions. These are all risks that can be avoided by
taking the proper measures.
14

Chapter 3
METHODOLOGY
Procedures for Data Collection-
Consumer perception is the main point of focus in this survey study. The first
portion of the survey will measure the current level of knowledge and perception
concerning canned versus bottled craft beer. Once this area of the survey is completed,
consumers will be asked to read a list of qualities comparing aluminum cans versus
bottles. Furthermore, the survey will measure the level of importance that drinkability
convenience, recycling, pricing, etc. has when it comes to purchasing decisions. The final
portion will attempt to analyze how consumer perception is changed with new awareness
and whether or not future purchasing decisions will vary. The hypothesis states that
millennials are more open to purchasing canned craft beers.
In order to fulfill the survey requirements, a sample size of 150+ will be needed.
Of the desired 150 respondents, at least 75 will be of the age range 21-33 and the other
half will fall under the age range of 28+. This gives the surveyor a chance to compare
data from millennial respondents against the rest of the population. A mix of primary and
secondary data will be utilized to perform the necessary statistical analysis. Online survey
distribution via the social network Facebook will be utilized to reach the quota of 75+
respondents in the age group 21-33. Facebook and Email will be used to obtain the
desired 75+ respondents above the age of 33. Surveys will be hand distributed throughout
the process as well to help meet the desired level of responses. Ultimately, there is no
15

limit on the sample size as bigger samples help limit bias and statistical error. The
fluctuant time range of when the data must be obtained is from September 2013-
November 2013. This will give ample time to perform the desired statistical analysis and
test the hypothesis.
The survey will begin with two screening questions. The first one will determine
the age of the respondent. If the respondent is under 21 years of age, the survey will be
terminated. The next screening question asks what types of beers they have purchased in
the past month. The list includes domestic, imported, craft, and none of the above. Once
again, the survey will be terminated if a “none of the above” response is provided. These
two questions will be presented on the first page of the survey.
This canned beer study will consist of 15 questions. The survey format will be
comprised of eight ordinal, four nominal, and three ratio questions. Three demographic
questions including gender, age, and income will also be included to help analyze our
results.
Procedures for Data Analysis
A .05 level for extreme significance and .1 level for moderate significance will be
used for any test that examines a correlation. A list of the analysis functions that will be
utilized include the following: frequencies, descriptives, chi square tests of variance, and
independent sample t tests. Once the data is gathered, frequencies will be run on each
question to make sure no bad data was obtained. “Bad data” means that a respondent
16
answered with a number that does not correspond with the survey options. If bad data is
present, it will be necessary to recode and add the unwanted data as “system missing.”
This is a very important step as not doing so would skew our data, a very concerning
possibility for survey analysis.
Once all bad data is removed, frequencies will be run on every question to obtain
a statistical overview of the entire population. It is important to note any skewed data or
interesting trends before subdividing the data. Once results from the total population are
obtained, the data on the spss software will be recoded into two groups, millennials and
non-millennials. Therefore, all respondents of age groups 21-33 will be recoded and
entered into the system as 1 and the rest of the population will be recoded and entered as
a 2. This makes it possible to test the target population against the older demographic
when performing chi square test of variance and independent sample t tests.
The first test that will be run is a chi square variance test comparing what types of
beer the respondents had purchased over the past three months. The list will include
domestic, imported, and craft. The next two tests will be independent sample t tests to
determine how much the two age groups spend on beer in a typical month and the
number of 12 oz. bottles/cans of beer they purchase in a typical month. The remaining
questions will be analyzed with chi square tests of variance. All of the data except for
questions 11 and 13 will be analyzed in the exact same fashion.
The two questions mentioned previously will require a recode of the data to
obtain the desired results. For example, all of the respondents that responded to question
11 with 70% or higher will be recoded and entered into the system as a 1 and the rest of
17

the responses will be recoded and entered into the system as a 2. The similar procedure
will be performed for question 13 except the data will be analyzed at the 80% level
instead of 70%. These two questions will be the main focus on determining whether or
not to accept the null hypothesis. As mentioned previously, a p-value of .05 will
exemplify strong significance to accept the null and a p-value of .1 or less will represent
moderate significance.
Assumptions
It is assumed that each respondent answered the survey questions truthfully.
Furthermore, we will assume that the sample population of 150+ accurately reflects a
larger population. Finally, it will be assumed that respondents generated via the social
network Facebook are similar to the respondents located in San Luis Obispo County.
Limitations
This study will obtain most of its responses from the San Luis Obispo and Bay
Area counties. These counties may not accurately reflect California and the United States.
Furthermore, this survey is limited to actual “beer drinkers” rather than testing how
raising consumer awareness affects the entire population. Finally, the study is limited to
individuals who are willing to participate in the survey research.
18

Chapter 4
DEVELOPMENT OF THE STUDY
Empirical Results for Canned Craft Beer Study (Overview of Total Population):
21-24 42%
25-28 7%
29-33 7%
34-38 3%
39-44 3%
45-50 4%
51-56 10%
57-64 14%
65+ 7%
Age Distribution
50%
55%
60%
65%
70%
75%
DomesticBeer
ImportedBeer
Craft Beer
Types of Beer Purchased
$0-$2.49 0%
$2.50-$4.99 1%
$5.00-$6.49 6%
$6.50-$7.99 23%
$8.00-$9.49 40%
$9.50-$10.99 23%
$11.00+ 5%
Price Range for Six Pack Purchases
-As expected, the age demographic of 21-24 had
the largest share of responses at 42%
-The rest of the data was fairly evenly represented
with the age range of 57-64 having the second
highest showing at 14%
- Middle aged respondents, 34-50, appear to be
the minority demographic (combined 10%)
- The largest percent of respondents
reported they had purchased domestic
beer in the past 3 months (71%)
- Craft beer was a close second at 68%,
and imported came in at 60%,
demonstrating a fairly constant
distribution of responses
- The most common purchased six pack
was in the price range of $8.00-$9.49 at
40%
- The price ranges directly below and
above the $8.00-$9.49 range had the
exact same results at 23% a piece
19
0%
10%
20%
30%
40%
50%
60%
70%
80%
Extremely/Very Appealing Somewhat/Not Very/Not atall Appealing
How Appealing are Craft Beers?
Can 27%
Bottle 73%
Percentage of Purchases at Retail Outlet
Can Bottle
Percentage of Purchases Consisting of Craft BeersPercentage Range Retail Outlet Bar/Restaurant
0%-19% 32% 23%
20%-39% 20% 15%
40%-59% 12% 14%
60%-79% 14% 23%
80%-100% 23% 26%
Total Amount of Beer Purchased/Month Maximum Response AverageMoney Spent in Typical Month $250 $35.26
12 oz Bottles/Cans Purchased in Typical Month 200 21.335
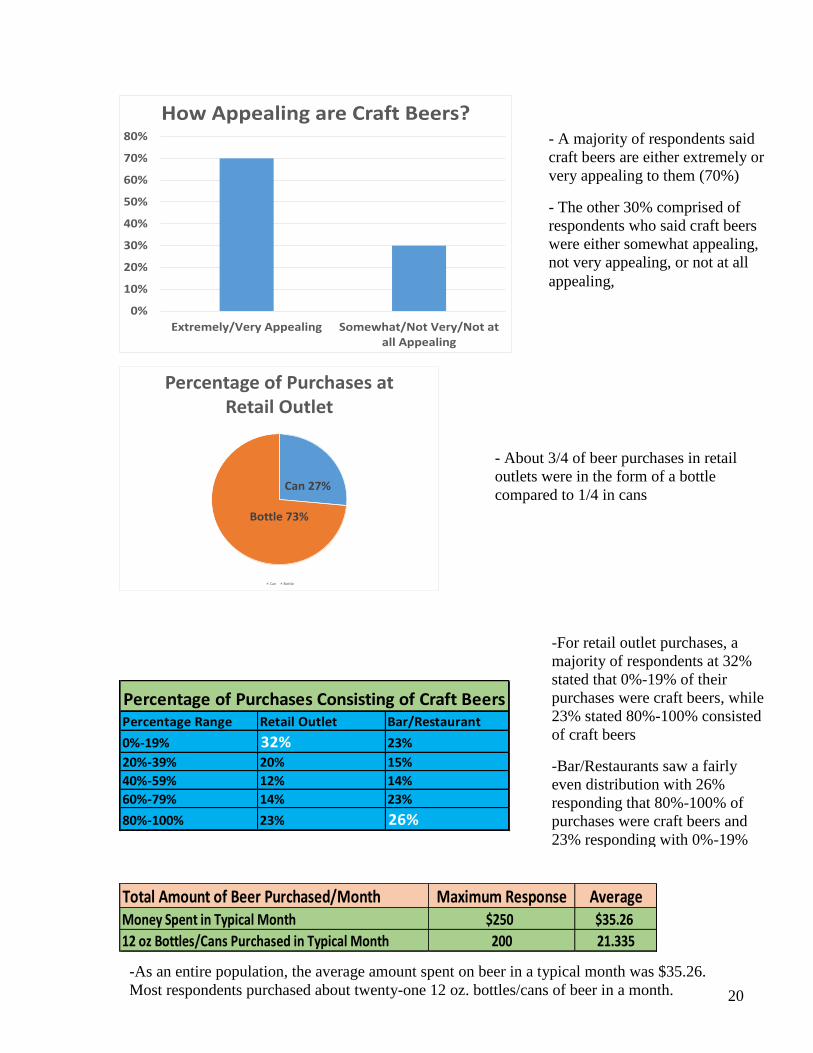
- About 3/4 of beer purchases in retail
outlets were in the form of a bottle
compared to 1/4 in cans
- A majority of respondents said
craft beers are either extremely or
very appealing to them (70%)
- The other 30% comprised of
respondents who said craft beers
were either somewhat appealing,
not very appealing, or not at all
appealing,
-For retail outlet purchases, a
majority of respondents at 32%
stated that 0%-19% of their
purchases were craft beers, while
23% stated 80%-100% consisted
of craft beers
-Bar/Restaurants saw a fairly
even distribution with 26%
responding that 80%-100% of
purchases were craft beers and
23% responding with 0%-19%
-As an entire population, the average amount spent on beer in a typical month was $35.26.
Most respondents purchased about twenty-one 12 oz. bottles/cans of beer in a month. 20

Feature Top Response PercentPrestigious Brand Somewhat Desirable 36%
Creative Label Somewhat Desirable 32%
Locally Produced Very Desirable 34%
Inexpensive Somewhat Desirable 36%
Recommended by Friends Very Desirable 51%
High Alcohol Content Somewhat Desirable 29%
On Sale Very Desirable 30%
Packaged in a Bottle Very Desirable 45%
Made by a Craft Brewer Very Desirable 32%
Environmentally Friendly Package Somewhat Desirable 28%
Top Desirability for Each Figure
Description Preference (Bottle/Can) Percent
Interesting Label Design Bottle 62%
Drinking Convenience Can 76%
More Environmentally Friendly Can 53%
Better Feel in Hand Bottle 88%
Embodies idea of "craft beer" Bottle 95%
Cheaper Product Can 84%
Better Taste Bottle 92%
Overall Appeal Bottle 87%
Preferred Form of Packaging Based on Perception
- The most desirable trait for any beer purchase is one recommended by friends. This
category most commonly received responses of “very desirable” at 51%
-The least desirable trait for purchasing beer is one with an environmentally friendly
package. The top response for this category was somewhat desirable at 28%.
-95% of respondents said that bottles embody the idea of a “craft beer” more
than cans
-Collectively, it appears that bottles are favored over cans based on the
descriptions
-Cans received a majority of responses on three out of the eight descriptions:
drinking convenience (76%), more environmentally friendly (53%), and
cheaper product (84%)
-It appears that consumers see cans as a cheaper and more convenient form of
drinking beer rather than something representing a premium craft beer product
21

Before After
Certain Will Buy (99 chances in 100) 5% 11%
Almost Sure Will Buy (90 chances in 100) 12% 18%
Very Probably Will Buy (80 chances in 100) 19% 30%
Level of Willingness to Purchase Craft Beers in Can (Change in Top 3)
Male 71%
Female 29%
Gender Distribution
unemployed/student 16%
under $10,000 9%
$10,000-$14,999 4%
$15,000-$19,999 2%
$20000-$24,999 0%
$25,000-$29,999 4%
$30,000-$34,999 3%
$35,000-$39,999 4%
$40,000-$49,999 1%
$50,000-$59,999 5%
$60,000-$74,999 7%
$75,000-$149,000 14%
$150,000 or more 30%
Income Before Taxes
-It appears that creating further consumer awareness about the beneficial aspects of
cans vs. bottles would increase the purchasing of craft beers in cans
-After reading the information provided, 59% of the respondents said they were
either “certain to buy,” “almost sure to buy,” or “very probable to buy.” This means
that 59% of the respondents were at least 80% sure they would be willing to
purchase craft beers in cans
-A strong majority of the respondents
were male (71%)
-The largest percentage of
respondents had a total annual
income before taxes of $150,000 or
more- 30%
-The next closest group were
individuals that were either
unemployed or students- 16%
22

Testing the Hypothesis:
“The millennial demographic (21-33) is more open to purchasing craft beers in cans than
other age groups. Creating consumer awareness amongst both millennials and non-
millennials highlighting the beneficial aspects of cans versus bottles will further enhance
their willingness to purchase.”
*In order to test the hypothesis, the data was recoded into the following groups:
millennials (21-33) and non-millennials (34+)
*Strength of correlation was determined as followed: P-value <.1 significant
P-value <.05 very significant
Question: Which of the following products have you purchased the past three months?
(Chi Square Variance Test)
Observations: Millennials purchased significantly more domestic beer over the past three
months and non-millenials purchased more imported beer. There was no statistically
significant correlation between the two age groups and craft beer purchases.
Question: On average, how much money do you spend on beer in a typical month? How
many 12 oz. bottles/cans of beer do you purchase in a typical month? (Independent
Sample T Test)
Observations: Millennials spend a significantly more amount of money on beer in a
typical month
Type of Beer Millennial Non-Millennial P-ValueDomestic 76.5% 62.3% 0.064
Imported 55.3% 70.5% 0.063
Craft 72.9% 63.9% 0.245
Millennials Non-Millennials P-ValueMoney Spent in Typical Month $35.26 $29.82 0.051
12 oz Bottles/Cans Purchased in Typical Month 21.19 17.64 0.209
23
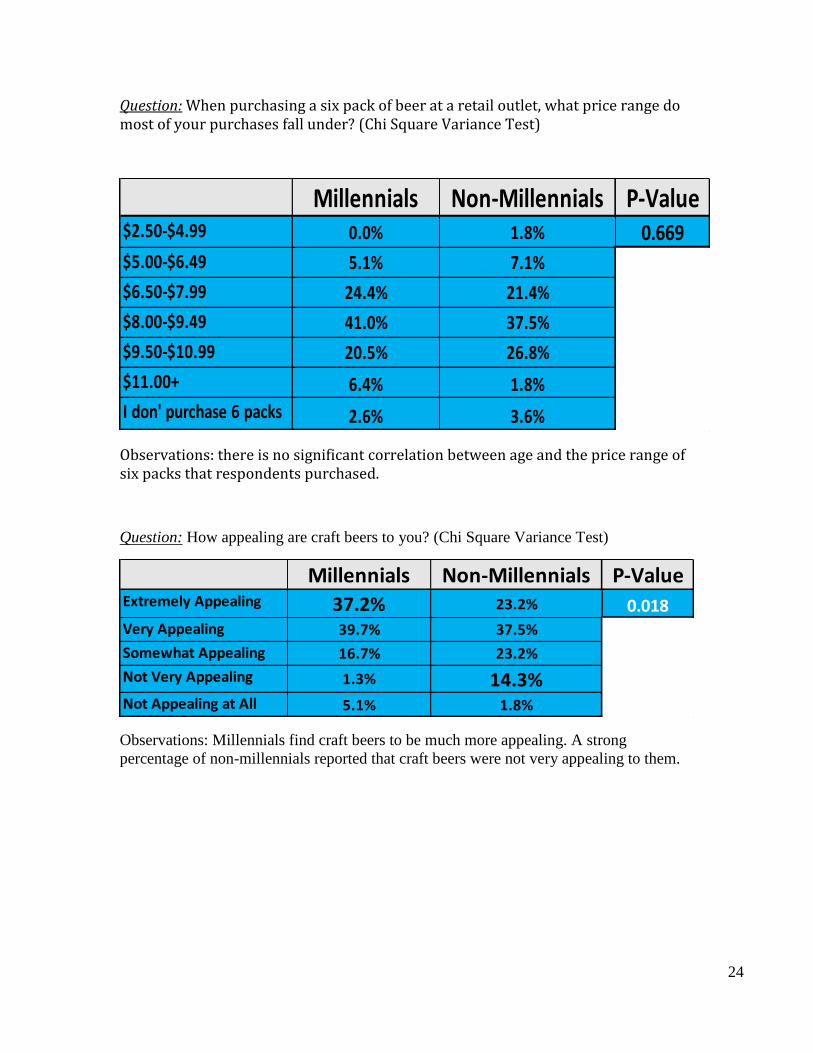
Question: When purchasing a six pack of beer at a retail outlet, what price range do most of your purchases fall under? (Chi Square Variance Test)
Observations: there is no significant correlation between age and the price range of six packs that respondents purchased.
Question: How appealing are craft beers to you? (Chi Square Variance Test)
Observations: Millennials find craft beers to be much more appealing. A strong
percentage of non-millennials reported that craft beers were not very appealing to them.
Millennials Non-Millennials P-Value$2.50-$4.99 0.0% 1.8% 0.669$5.00-$6.49 5.1% 7.1%
$6.50-$7.99 24.4% 21.4%
$8.00-$9.49 41.0% 37.5%
$9.50-$10.99 20.5% 26.8%
$11.00+ 6.4% 1.8%
I don' purchase 6 packs 2.6% 3.6%
Millennials Non-Millennials P-ValueExtremely Appealing 37.2% 23.2% 0.018Very Appealing 39.7% 37.5%
Somewhat Appealing 16.7% 23.2%
Not Very Appealing 1.3% 14.3%Not Appealing at All 5.1% 1.8%
24

Question: Out of all the beer purchases made in the past three months at a retail and
bar/restaurant, what percentage consisted of craft beers? (Chi Square Variance Test)
Observations: no significant correlation exists between one’s age and the percentage of
craft beer purchases at retail, bar, and restaurant establishments
Question: When purchasing beer at a retail outlet, what percentage of those purchases are
in a can or bottle? (Chi Square Variance Test)
Observations: Non-millennials purchase significantly more bottles compared to
millennials
Millennial
(retail)
Non-Millennial
(retail)
Millenial
(bar/restaurant)
Non-Millennial
(bar/restaurant)
0%-19% 32.0% 32.1% 22.4% 23.2%
20%-39% 18.7% 21.4% 14.5% 16.1%
40%-59% 16.0% 5.4% 15.8% 8.9%
60%-79% 12.0% 16.1% 26.3% 17.9%
80%-100% 21.3% 25.0% 21.1% 33.9%
P = .424 P = .370
Can Bottle
Millennial 29.2% 68.9%
Non-
Millennial 21.9% 78.4%
P-Value 0.118 0.048
25

Question: What is your desirability of each beer feature? (Chi Square Variance Test)
Observations: Although both millennials and non-millennials rated “recommended by
friends” as the most important feature, it got a significantly higher rating by millennials.
Millennials also rated “locally produced,” “on sale,” “creative label,” “inexpensive,” and
“high alcohol content” significantly higher than non-millennials.
Question: Sierra Nevada Brewing Company, Boston Beer, and New Belgium Brewing
Companies comprise a long list of craft breweries implementing cans to their packaging
lines. What is your level of willingness to purchase craft beers in cans? (Chi Square
Variance Test)
Millennial Non-Millennial P-ValueRecommended by Friends 4.12 3.73 0.026
Packaged in Bottle 3.49 3.73 0.202
Made by a Craft Brewer 3.7 3.43 0.191
Locally Produced 3.72 3.29 0.042
On Sale 3.68 3.07 0.003
Prestigious Brand 3.41 3.13 0.16
Creative Label 3.47 2.8 0.00
Inexpensive 3.47 2.56 0.00
High Alcohol Content 3.53 2.38 0.00
Environmentally Friendly Package 2.83 2.7 0.539
Level of Willingness Millennial Non-MillennialCertain Will Buy (99/100) 2.7% 7.1%
Almost Sure Will Buy (90/100) 17.3% 3.6%
Very Probably Will Buy (80/100) 17.3% 21.4%
Probably Will Buy (70/100) 14.7% 10.7%
Good Possibility (60/100) 16.0% 3.6%
Fairly Good Possibility (50/100) 4.0% 8.9%
Fair Possbility Will Buy (40/100) 4.0% 7.1%
Some Possibility (30/100) 6.7% 7.1%
Slight Possibility (20/100) 4.0% 3.6%
Very Slight Possibility (10/100) 10.7% 12.5%
No Chance You Will Buy (0/100) 2.7% 14.3%
P Value 0.033
26

Observations: The data shows that non-millennials had a higher percentage of responses
indicating they would “certainly buy.” However, millennials scored much higher in the
category of “almost sure will buy” at 17.3% compared to 3.6%. The next biggest variance
in percentage of responses fell under the “no chance you will buy.” 14.3% of non-
millennials said there was 0% chance they would purchase a craft beer in cans while only
2.7% of millennials provided this response.
*Although our data was technically “significant” with a p-value of .033, it is somewhat
difficult to fairly interpret the results. Therefore, another chi square test was run after
recoding the data into two subgroups (1: respondents answering with a 70% chance or
higher and 2: respondents answering 60% or lower)
Results:
Observations: Overall, millennials are more open to purchasing craft beers in cans.
However, the results are not strong enough to determine there is a significant difference
between the two age groups. When the test was done again at an 80% confidence level,
the results were even less significant with a p-value of .334
Question: Which form of packaging do you prefer for each of the following statements?
(Chi Square Variance Test)
Level of Willingness Millennial Non-MillennialCertain Will Buy (99/100)
Almost Sure Will Buy (90/100)
Very Probably Will Buy (80/100) 52.0% 42.9%
Probably Will Buy (70/100)
Good Possibility (60/100)
Fairly Good Possibility (50/100)
Fair Possbility Will Buy (40/100)
Some Possibility (30/100) 48.0% 57.1%
Slight Possibility (20/100)
Very Slight Possibility (10/100)
No Chance You Will Buy (0/100)
P Value 0.195
27

Observations: Both millennials and non-millennials ranked bottles considerably higher
than cans for the category of overall appeal. Two of the statements had statistically
significant results. Non-millennials rated cans higher for “drinking convenience” and
“cheaper product.” Overall, millennials and non-millennials voted very similarly on the
form of packaging they best felt fit the various statements.
Question: How does reading the facts comparing cans vs. bottles affect your level of
willingness to purchase canned craft beers? (Chi Square Variance Test)
Statement Millennial Non-Millennial P-ValueCan 41.4% 34.5%
Bottle 58.6% 65.5%
Can 70.4% 83.3%
Bottle 29.6% 16.7%
Can 55.7% 50.0%
Bottle 44.3% 50.0%
Can 9.9% 14.8%
Bottle 90.1% 85.2%
Can 4.3% 5.5%
Bottle 95.7% 94.5%
Can 80.0% 90.4%
Bottle 20.0% 9.6%
Can 5.7% 11.1%
Bottle 94.3% 88.9%
Can 11.4% 14.5%
Bottle 88.6% 85.5%
Cheaper Product
Better Taste
Overall Appeal
0.071
0.326
0.284
0.54
0.093
0.222
0.399
Interesting Label Design
Drinking Convenience
More Environmentally Friendly
Better Feel in Hand
Embodies Idea of Craft Beer
0.275
Level of Willingness Millennial Non-MillennialCertain Will Buy (99/100) 11.4% 10.7%
Almost Sure Will Buy (90/100) 21.4% 14.3%
Very Probably Will Buy (80/100) 32.9% 26.8%
Good Possibility (60/100) 14.3% 7.1%
Fairly Good Possibility (50/100) 5.7% 16.1%
Fair Possbility Will Buy (40/100) 2.9% 3.6%
Some Possibility (30/100) 5.7% 1.8%
Slight Possibility (20/100) 4.3% 1.8%
Very Slight Possibility (10/100) 1.4% 10.7%
No Chance You Will Buy (0/100) 0% 7.1%
P Value 0.04
28

Observations: A higher percentage of millennials stated they would “almost surely buy”
craft beers in cans. Looking at the “very slight possibility” and “no chance you will buy”
categories provides very interesting results as well. 17.1% of non-millennials responded
with one of these two compared to only 1.4% of the millennial population.
*Similar to question 11, the data was recoded to compare responses of 80% or higher
against the rest of the responses
Observations: When looking at the data with an 80% confidence level, millennials are
significantly more likely to purchase craft beers in cans at 65.7% compared to 34.4%.
Both levels of willingness to purchase increased after the respondents read the facts
comparing bottles and cans.
Question: Are you male or female? (Chi Square Variance Test)
Observations: Non-millennials were predominately male at 88.2%. The gender of
millennials was much more evenly distributed.
Level of Willingness Millennial Non-MillennialCertain Will Buy (99/100)
Almost Sure Will Buy (90/100)
Very Probably Will Buy (80/100)
Good Possibility (60/100)
Fairly Good Possibility (50/100)
Fair Possbility Will Buy (40/100)
Some Possibility (30/100) 34.3% 48.2%
Slight Possibility (20/100)
Very Slight Possibility (10/100)
No Chance You Will Buy (0/100)
P Value
65.7% 51.8%
0.081
Gender Millennial Non-Millenials
Male 58.0% 88.2%
Female 42.0% 11.8%
P Value 0.000
29

Question: What is your household income before taxes? (Chi Square Variance Test)
Observations: The highest percentage of millennials were either unemployed or students.
A strong majority of non-millennials at 64.8% reported a household income of $150,000
or more. Not a single non-millennial responded that they had a household income of
$34,999 or less.
Income Range Millennial Non-Millennialunemployed/student 28.2% 0%
under $10,000 15.5% 0%
$10,000-$14,999 7.0% 0%
$15,000-$19,999 4.2% 0%
$25,000-$29,999 7.0% 0%
$30,000-$34,999 5.6% 0%
$35,000-$39,999 5.6% 1.9%
$40,000-$49,999 1.4% 0%
$50,000-$59,999 8.5% 0%
$60,000-$74,999 5.6% 9.3%
$75,000-$149,000 7.0% 24.1%
$150,000 or more 4.2% 64.8%
P Value 0.000
30
Chapter 5
SUMMARY, CONCLUSIONS, AND RECCOMENDATIONS
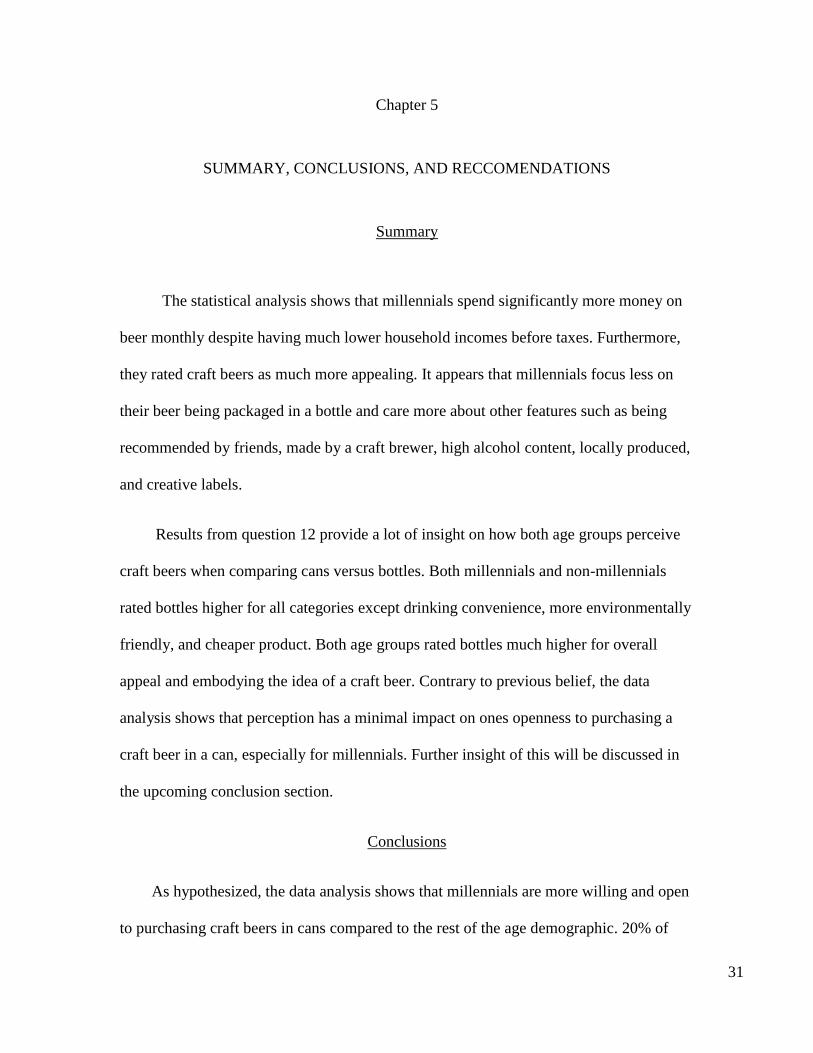
Summary
The statistical analysis shows that millennials spend significantly more money on
beer monthly despite having much lower household incomes before taxes. Furthermore,
they rated craft beers as much more appealing. It appears that millennials focus less on
their beer being packaged in a bottle and care more about other features such as being
recommended by friends, made by a craft brewer, high alcohol content, locally produced,
and creative labels.
Results from question 12 provide a lot of insight on how both age groups perceive
craft beers when comparing cans versus bottles. Both millennials and non-millennials
rated bottles higher for all categories except drinking convenience, more environmentally
friendly, and cheaper product. Both age groups rated bottles much higher for overall
appeal and embodying the idea of a craft beer. Contrary to previous belief, the data
analysis shows that perception has a minimal impact on ones openness to purchasing a
craft beer in a can, especially for millennials. Further insight of this will be discussed in
the upcoming conclusion section.
Conclusions
As hypothesized, the data analysis shows that millennials are more willing and open
to purchasing craft beers in cans compared to the rest of the age demographic. 20% of
31

millennials declared they were either certain or almost sure they would buy canned craft
beers compared to only 10% of non-millennials. Furthermore, a much higher percentage
of millenials declared there was no chance they would purchase canned craft beers.
The second part of the hypothesis stated that creating further consumer awareness
about the beneficial aspects of cans over bottles would increase both age groups
willingness to purchase canned craft beers. This was directly tested by question 13, which
asked respondents to read the facts about cans and indicate their new level of willingness
to purchase. Conclusions were based on the percentage change of responses that were
either “certain will buy,” “almost sure will buy,” “or very probably will buy.” After
reading the facts regarding cans, millennials answering with one of three responses
increased from 37.3% to 65.7%, about a 76% increase. Likewise, non-millennials
increased from 32.1% to 51.8%, a 61% increase. Therefore, we will fail to reject the
second part of the null hypothesis as well and conclude that creating further consumer
awareness about the beneficial aspects of canned craft beer versus bottles would further
increase the purchasing likelihood of both millennials and older age groups.
Recommendations
Based on the survey results, it appears that craft brewers should shift some of their
marketing approach towards the younger demographic (21-33). They should focus on the
concept that their canned beer is a high alcohol, convenient, and environmentally friendly
product at an affordable price. The consumer wants to be assured a canned beer can be
guaranteed all these qualities without having a compromise of taste and maintaining its
individuality.
32

Although craft brewers should clearly focus more of their attention on the
millennial age demographic, by no means should they abandon older demographic
consumers. The data demonstrates that effectively advertising the benefits of canned craft
beer versus bottles could positively skew one’s purchasing behavior. This concept applies
to all age groups. Personally, I think craft brewers would be best off if they were able to
effectively distinguish their canned beer as a more on-the-go and outdoor friendly
product than bottled beer.
33

References Cited
Adams, W. J. 2006. “Markets: beer in Germany and the United States.” The Journal of
Economic Perspectives, (20:1) pp. 189-205.
Allison, R. I., & Uhl, K. P. 1964. “Influence of beer brand identification on taste
perception.” Journal of Marketing Research, pp. 36-39.
Baginski, J. D., 2008. "On the Trail of Fine Ale: The Role of Factor Conditions in the Location of Craft Breweries in the United States." Master's Thesis, University of Tennessee. Brickman-Bhutta, C. 2009. “Not by the book: Facebook as sampling frame.” Retrieved
February.
Carroll, G. R., & Swaminathan, A. (2013). Why the Microbrewery Movement?
Organizational Dynamics of Resource Partitioning in the US Brewing
Industry1.American Journal of Sociology, (106:3) pp. 715-762.
Global Market Information Data Resource, Euromonitor (2012). “Beer in the US.”
Passport.
Kleban, J., & Nickerson, I. 2011. “The US Craft Brew Industry.” International Academy
for Case Studies (18:1) pp. 33.
Papazian, C. 2010. “Microbrewed Adventures: A Lupulin Filled Journey to the Heart
and Flavor of the World’s Great Craft Beers.” HarperCollins e-books.
Schmidt, W. C. 1997. “World-Wide Web survey research: Benefits, potential problems,
and solutions.” Behavior Research Methods, Instruments, & Computers, (29:2)
pp. 274-279.
Sincero, Sarah Mae 2012. “Types of Surveys.” Explorable. Sep. (http://explorable.co
m/types-of-survey).
Trochim, William M.K. 2006. “Types of Surveys.” Research Methods Knowledge Base.
Oct. (http://www.socialresearchmethods.net/kb/survtype.php).
34

Zhang, Y. 2000. “Using the Internet for survey research: A case study.” Journal of the
American. Society for Information Science, (51:1) pp. 57-68.
2013. “American Canned Craft Beer Statistics.” Canned Craft Beer Stats. (http:// www.craftcans.com/)
2013. "Craft Beer Market in the US 2012-2016." By Infiniti Research Ltd in United
States, North America. Infiniti Research, 1. (http://www.just-drinks.com/market-
research/craft-beer-market-in-the-us-2012-2016_id178746.aspx)
2013. “Craft brewing facts.” Brewers Association: A Passionate Voice for Craft Brewers. (http://www.brewersassociation.org/pages/business-tools/craft-brewing- statistics/facts).
35

Appendix A (Canned Craft Beer Survey)
1. Please select your age range
Under 21
a. 21-24
b. 25-28
c. 29-33
d. 34-38
e. 39-44
f. 45-50
g. 51-56
h. 57-64
i. 65+ years
2. Which of the following products have you purchased in the three
months?
Domestic beer
Imported beer
Craft beer
None of the above
3. On average, how much money do you spend on beer in a typical month?
_______
4. How many 12oz bottles/cans of beer do you purchase in a typical
month? _______
5. When purchasing a six-pack of beer at a retail outlet, what price range
do MOST of your purchases fall under?
a. $0-$2.49
b. $2.50-$4.99
c. $5.00-$6.49
d. $6.50-$7.99
e. $8.00-$9.49
f. $9.50-$10.99

g. $11.00+
h. I don't purchase 6 packs
6. How appealing are craft beers to you?
Extremely Appealing
Very Appealing
Somewhat Appealing
Not Very Appealing
Not Appealing at All
7. Out of all the beer purchases made in the past three months at a
RETAIL outlet, what percentage consisted of craft beers?
a. 0%-19%
b. 20%-39%
c. 40%-59%
d. 60%-79%
e. 80%-100%
8. Out of all the beer purchases made in the past three months at a BAR
OR RESTAURANT, what percentage consisted of craft beers?
a. 0%-19%
b. 20%-39%
c. 40%-59%
d. 60%-79%
e. 80%-100%
9. When purchasing beer at a retail outlet, what percentage of those
purchases are in a can or a bottle. (Please write a whole number from 0 to
100)
Can
_____
Bottle
_____
10. The following is a list of features people may look for when purchasing
beer. Please indicate the desirability of each feature:

Extremely
Desirable
Very
Desirable
Somewhat
Desirable
Slightly
Desirable
Not at All
Desirable
Prestigious Brand
Creative Label
Locally Produced
Inexpensive
Recommended by Friends
High Alcohol Content
On sale
Packaged in Bottle
Made by a Craft Brewer
Environmentally Friendly
Package
11. Sierra Nevada Brewing Company, Boston Beer (Sam Adams) and New
Belgium Brewing Companies comprise a long list of craft breweries
implementing cans to their packaging lines. Please indicate your
willingness to purchase craft beers in cans
a. certain will buy (99 chances in 100)
b. almost sure will buy (90 chances in 100)
c. very probably will buy (80 chances in 100)
d. probably will buy (70 chances in 100)
e. good possibility (60 chances in 100)
f. fairly good possibility (50 chances in 100)
g. fair possibility will buy (40 chances in 100)
h. some possibility (30 chances in 100)
i. slight possibility (20 chances in 100)
j. very slight possibility (10 chances in 100)
k. no chance you will buy (0 chances in 100)
12. Based on the illustrations of beers sold in cans and bottle, please decide which form of
packaging you prefer OVERALL on each of the statements. If unsure, base decision
solely on you perception from the images shown above. Please go back to the images to

refresh your memory if you are not certain.
Can Bottle
Interesting label design
Drinking convenience ex. concerts, beach,
hiking, etc.
More environmentally friendly package
Better feel in hand (according to experience)
Embodies idea of "craft beer"
Cheaper product
Better taste
Overall appeal

13. Based on the information provided above, please indicate your new
level of willingness to purchase craft beers in cans
certain will buy (99 chances in 100)
almost sure will buy (90 chances in 100)
very probably will buy (80 chances in 100)
good possibility (60 chances in 100)
fairly good possibility (50 chances in 100)
fair possibility will buy (40 chances in 100)
some possibility (30 chances in 100)
slight possibility (20 chances in 100)
very slight possibility (10 chances in 100)

no chance will buy (0 chances in 100)
14. Are you male or female?
Male
Female
15. Which of the following ranges describes your household income before
taxes?
unemployed/student
under $10,000
$10,000-$14,999
$15,000-$19,999
$20,000-$24,999
$25,000-$29,999
$30,000-$34,999
$35,000-$39,999
$40,000-$49,999
$50,000-$59,999
$60,000-$74,999
$75,000-$149,000
$150,000 or more


