
Sompo Holdings, Inc.
Summary of Consolidated Financial Results for the fiscal year ended March 31, 2017
[Under Japanese GAAP]
Company Name: Sompo Holdings, Inc.
Listed on: Tokyo Stock Exchange
Securities Code: 8630
URL: http://www.sompo-hd.com/
Representative: Kengo Sakurada, President & CEO
Scheduled date to hold general meeting of stockholders: June 26, 2017
Scheduled date to file Securities Report: June 29, 2017
Scheduled date to start payment of dividends: June 27, 2017
Supplementary information for financial statements: Yes
Schedule for investor meeting: Yes (intended for institutional investors and analysts)
Note) Amounts less than one million yen are rounded down.
1. Consolidated Financial Results for the fiscal year ended March 31, 2017 (April 1, 2016 to March 31, 2017)
(1) Consolidated Results of Operations Note) Percentages are changes from previous fiscal year.
Ordinary income Ordinary profitNet income attributable to
shareholders of the parent
millions of yen % millions of yen % millions of yen %
Note) Comprehensive income: million yen %
million yen %
Net income per shareDiluted net income
per shareReturn on equity
Ordinary profit
to total assets
Ordinary profit
to ordinary income
yen yen % % %
Reference) Investment gains and losses on the equity method: Fiscal year ended March 31, 2017 million yen
Fiscal year ended March 31, 2016 million yen
(2) Consolidated Financial Conditions
Total assets Net assets Equity ratioNet assets
per share
millions of yen millions of yen % yen
Reference) Equity capital: As of March 31, 2017 million yen
As of March 31, 2016 million yen
(3) Consolidated Cash Flows
Cash flows from
operating activities
Cash flows from
investing activities
Cash flows from
financing activities
Cash and cash equivalents
at the end of the period
millions of yen millions of yen millions of yen millions of yen
2.1 6.7
270
Fiscal year ended March 31,
2016394.21 393.66 9.2
4,583.07
7.1Fiscal year ended March 31,
2017419.15 418.71
As of March 31, 2016 10,186,746
3,419,530 5.0Fiscal year ended March 31,
2017
4.13,256,186
4.3
398
194.0
241,713 11.5
Fiscal year ended March 31, 2017
Fiscal year ended March 31, 2016
(0.8) 216,853
166,402
Fiscal year ended March 31,
2016159,581
226,949
(116,689)
-
-
9.7 2.2
1,802,975
1,642,854
Fiscal year ended March 31,
2016
362,920
266,432 (169,243) (56,838)
15.1
(526,668) 363,835
1,652,839
Fiscal year ended March 31,
2017
16.1 4,064.83
As of March 31, 2017 11,931,135 1,868,940
May 19, 2017
773,466
576,791
UNOFFICIAL TRANSLATION This document is an unofficial English translation of the Japanese original.

2. Dividends
Dividends per share
First
quarter-end
Second
quarter-end
Third
quarter-end
Fiscal
year-endAnnual
yen yen yen yen yen millions of yen % %
3. Forecasts of Consolidated Financial Results for the fiscal year ending March 31, 2018 (April 1, 2017 to March 31, 2018)
Note) Percentages are changes from previous fiscal year.
Ordinary profitNet income
attributable to shareholders of the parent
(Notes)
(1)
Increase: 5
(2) Changes in accounting policies, changes in accounting estimations, and retrospective restatements
①Changes in accounting policies due to revisions to accounting standards, etc.: Yes
②Changes in accounting policies due to reasons other than the above: None
③Changes in accounting estimations: None
④Retrospective restatements: None
(3) Number of shares outstanding (Common stock) :
①Total shares outstanding including treasury stock:
As of March 31, 2017 shares
As of March 31, 2016 shares
②Treasury stock:
As of March 31, 2017 shares
As of March 31, 2016 shares
③Average number of shares outstanding:
For the fiscal year ended March 31, 2017 shares
For the fiscal year ended March 31, 2016 shares
(Expression of implementation status of audit procedures)
(Notes for using forecasted information, etc.)
Note) Please refer to “3. (6) Changes in Accounting Policies, Changes in Accounting Estimations, and Retrospective
Restatements” on page 13 for details.
Fiscal year ending March 31,
2018 (Forecast)- 55.00 - 55.00 110.00
Fiscal year ended March 31,
201721.5 2.1
20.3 1.9
Total annual
dividends
Dividend
payout ratio
(Consolidated)
Dividends on
net assets
(Consolidated)
Fiscal year ended March 31,
2016- 40.00 -
396,995,036
404,804,925
For assumptions underlying the forecasts of financial results and notes for using the forecasts of financial results, please refer
to “1. (3) Outlook for the fiscal year ending March 31, 2018” on page 3.
Full year
415,352,294
415,352,294
21,953,718
11,189,780
This summary is not subject to audits.
Net income
per share
yen
465.17259,000
millions of yen millions of yen
The forecasts included in this document are based on the currently available information and certain assumptions that we
believe reasonable. Accordingly, the actual results, etc. may differ materially from those projected herein depending on various
factors.
Changes in significant subsidiaries during the fiscal year ended March 31, 2017 (changes in specified subsidiaries resulting
in changes in the scope of consolidation): Yes
23.6
32,332
35,459
40.00 80.00
%
-
183,000 10.0
%
- 40.00
(Company Name:Endurance Specialty Holdings Ltd., Endurance Specialty Insurance Ltd., Endurance U.S.
Holdings Corporation, Endurance Worldwide Holdings Limited and Endurance Worldwide Insurance Limited)
7.2
50.00 90.00

Contents – Appendices
1. Overview of Results of Operations ······························································································ 2
(1) Overview of Results of Operations for the fiscal year ended March 31, 2017 ········································ 2
(2) Overview of Financial Condition as of March 31, 2017 ····································································· 2
(3) Outlook for the fiscal year ending March 31, 2018 ·········································································· 3
2. Basic Approach to Selection of Accounting Standard ···································································· 3
3. Consolidated Financial Statements and Major Notes ····································································· 4
(1) Consolidated Balance Sheet ······································································································ 4
(2) Consolidated Statement of Income and Consolidated Statement of Comprehensive Income ···················· 6
(3) Consolidated Statement of Changes in Net Assets ·········································································· 9
(4) Consolidated Statement of Cash Flows ························································································ 11
(5) Notes on Going-Concern Assumption ·························································································· 13
(6) Changes in Accounting Policies, Changes in Accounting Estimations, and Retrospective Restatements ···· 13
(7) Additional Information ··············································································································· 13
(8) Notes to the Consolidated Financial Statements ············································································· 14
Segment information ··············································································································· 14
Securities ····························································································································· 22
Per share information ·············································································································· 24
Significant subsequent events ·································································································· 25
4. Other ······································································································································· 27
(1) Summary of Results of Operations (Consolidated) ·········································································· 27
(2) Premiums Written and Claims Paid by Business Lines (Consolidated) ················································ 28
Sompo Holdings, Inc.
1
1. Overview of Results of Operations
(1) Overview of Results of Operations for the fiscal year ended March 31, 2017
During the fiscal year ended March 31, 2017, the global economy continued to gradually recover as a whole. Emerging
countries such as China experienced a slowdown in the first half of the fiscal year, but started to trend upward in the
second half. The Japanese economy remained on a moderate recovery path as a whole, supported by signs of a rebound
in exports and production in the second half of the fiscal year, despite some signs of weakness in personal consumption
amid ongoing improvement in employment and income levels.
Under these circumstances, the consolidated financial results of operations of Sompo Holdings Group (“SOMPO
HOLDINGS”) for the fiscal year ended March 31, 2017 were as follows:
Ordinary income increased by 163.3 billion yen to 3,419.5 billion yen compared to the previous fiscal year, the
components of which were underwriting income of 3,050.5 billion yen, investment income of 232.8 billion yen and other
ordinary income of 136.1 billion yen. Meanwhile, ordinary expenses increased by 138.4 billion yen to 3,177.8 billion yen
compared to the previous fiscal year, the components of which were underwriting expenses of 2,515.1 billion yen,
investment expenses of 41.2 billion yen, operating, general and administrative expenses of 506.5 billion yen and other
ordinary expenses of 114.9 billion yen.
As a result of the foregoing, Sompo Holdings, Inc. (the “Company”) reported ordinary profit, calculated as ordinary
income minus ordinary expenses, of 241.7 billion yen, an increase of 24.8 billion yen from the previous fiscal year. The
Company posted net income attributable to shareholders of the parent, after extraordinary items, net of income taxes and
deferred income taxes and others, of 166.4 billion yen, an increase of 6.8 billion yen from the previous fiscal year.
Business results for each of the SOMPO HOLDINGS’ reporting segments were as follows:
(a) Domestic P&C insurance business
In the domestic P&C insurance business, net premiums written amounted to 2,212.2 billion yen, a decrease of 47.3
billion yen from the previous fiscal year, due to decreased net premiums written in fire and other lines of insurance. The
domestic P&C insurance business posted net income attributable to shareholders of the parent of 153.7 billion yen, an
increase of 21.2 billion yen from the previous fiscal year. This increase was due mainly to increases in underwriting
profit and gross investment margin from the previous fiscal year.
(b) Domestic life insurance business
In the domestic life insurance business, life insurance premiums written amounted to 317.3 billion yen, an increase of
23.6 billion yen from the previous fiscal year. The domestic life insurance business posted net income attributable to
shareholders of the parent of 7.6 billion yen, a decrease of 3.2 billion yen from the previous fiscal year.
(c) Nursing care & healthcare business
Ordinary income increased by 107.7 billion yen to 119.1 billion yen compared to the previous fiscal year, as the profits
and losses of a subsidiary that was newly included in the scope of consolidation in the previous fiscal year were
included from the beginning of the fiscal year. Net loss attributable to shareholders of the parent decreased by 5.9
billion yen from the previous fiscal year to a net loss of 6.8 billion yen compared to the previous fiscal year.
(d) Overseas insurance business
In the overseas insurance business, net premiums written amounted to 338.1 billion yen, an increase of 45.5 billion
yen from the previous fiscal year. The overseas insurance business posted net income attributable to shareholders of
the parent of 12.8 billion yen, a decrease of 3.2 billion yen from the previous fiscal year.
(2) Overview of Financial Condition as of March 31, 2017
Total assets as of March 31, 2017 amounted to 11,931.1 billion yen on a consolidated basis, an increase of 1,744.3 billion
yen from March 31, 2016, due mainly to the new consolidation of Endurance Specialty Holdings Ltd.
Cash flows for the fiscal year ended March 31, 2017 were as follows:
Sompo Holdings, Inc.
2

Cash flows from operating activities resulted in a net inflow of 362.9 billion yen, an increase of 96.4 billion yen from the
previous fiscal year, due mainly to a decrease in net claims paid.
Cash flows from investing activities resulted in a net outflow of 526.6 billion yen, a decrease of 357.4 billion yen from the
previous fiscal year, due mainly to payment for the acquisition of Endurance Specialty Holdings Ltd.
Cash flows from financing activities resulted in a net inflow of 363.8 billion yen, an increase of 420.6 billion yen from the
previous fiscal year, due mainly to an increase in payables under securities lending transactions and proceeds from
issuance of bonds.
As a result, cash and cash equivalents at the end of the period were 773.4 billion yen, an increase of 196.6 billion yen
from the end of the previous fiscal year.
(3) Outlook for the fiscal year ending March 31, 2018
For the fiscal year ending March 31, 2018, the Company is forecasting consolidated ordinary profit of 259.0 billion yen
and net income attributable to shareholders of the parent of 183.0 billion yen, based on the following assumptions:
・Assumptions for net premiums written are based on the Company’s own projections based on extrapolation from past
trends and other factors.
・The Company is forecasting 43.0 billion yen for net incurred losses (excluding household earthquake insurance) due to
domestic natural disasters that occur in the fiscal year ending March 31, 2018, taking into account past trends and
other factors.
・The Company assumes no major change in market interest rates, exchange rates and stock prices from their levels at
March 31, 2017.
The above forecasts were prepared based on information available as of the date of this release. Accordingly, actual
results may differ materially from projections depending on various factors.
2. Basic Approach to Selection of Accounting Standard
SOMPO HOLDINGS is considering the adoption of International Financial Reporting Standards (IFRS). As part of this
process, SOMPO HOLDINGS is implementing measures such as examining company guidelines and building
infrastructure.
SOMPO HOLDINGS plans to determine the timing of adoption based on the trends surrounding new accounting
standards for insurance contracts (IFRS 17) and other factors.
Sompo Holdings, Inc.
3
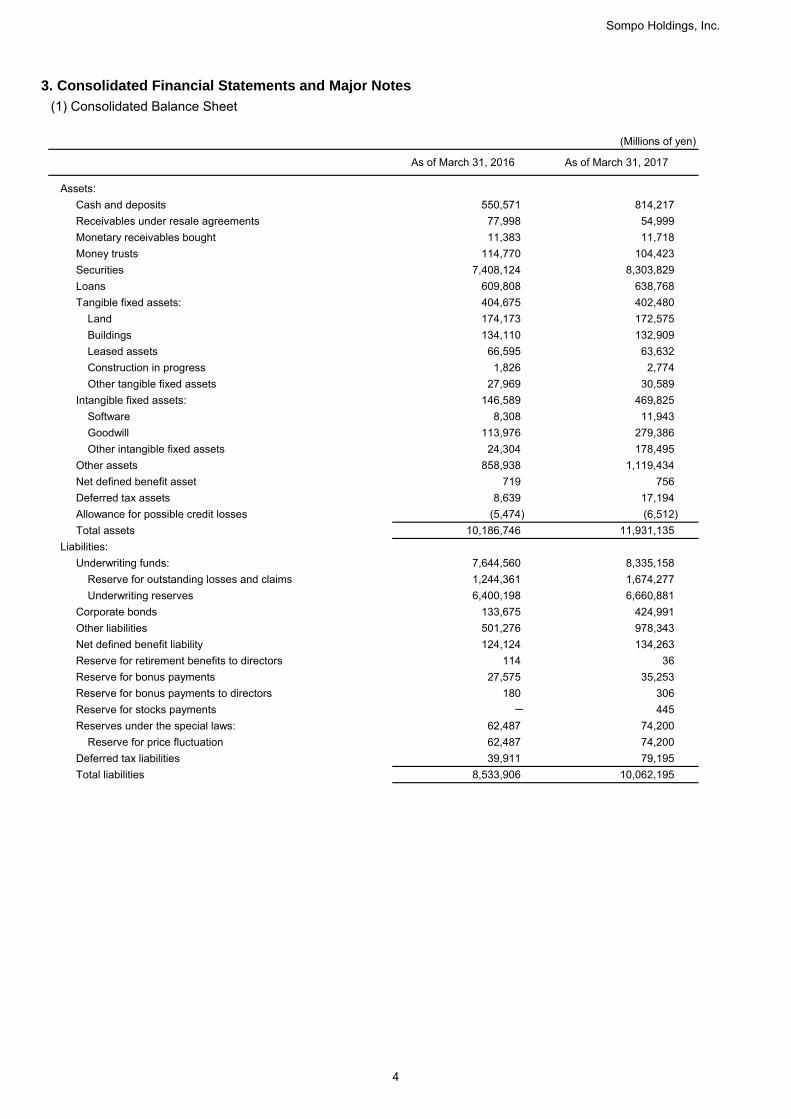
3. Consolidated Financial Statements and Major Notes
(1) Consolidated Balance Sheet
(Millions of yen)
As of March 31, 2016 As of March 31, 2017
Assets:
Cash and deposits 550,571 814,217
Receivables under resale agreements 77,998 54,999
Monetary receivables bought 11,383 11,718
Money trusts 114,770 104,423
Securities 7,408,124 8,303,829
Loans 609,808 638,768
Tangible fixed assets: 404,675 402,480
Land 174,173 172,575
Buildings 134,110 132,909
Leased assets 66,595 63,632
Construction in progress 1,826 2,774
Other tangible fixed assets 27,969 30,589
Intangible fixed assets: 146,589 469,825
Software 8,308 11,943
Goodwill 113,976 279,386
Other intangible fixed assets 24,304 178,495
Other assets 858,938 1,119,434
Net defined benefit asset 719 756
Deferred tax assets 8,639 17,194
Allowance for possible credit losses (5,474) (6,512)
Total assets 10,186,746 11,931,135
Liabilities:
Underwriting funds: 7,644,560 8,335,158
Reserve for outstanding losses and claims 1,244,361 1,674,277
Underwriting reserves 6,400,198 6,660,881
Corporate bonds 133,675 424,991
Other liabilities 501,276 978,343
Net defined benefit liability 124,124 134,263
Reserve for retirement benefits to directors 114 36
Reserve for bonus payments 27,575 35,253
Reserve for bonus payments to directors 180 306
Reserve for stocks payments - 445
Reserves under the special laws: 62,487 74,200
Reserve for price fluctuation 62,487 74,200
Deferred tax liabilities 39,911 79,195
Total liabilities 8,533,906 10,062,195
Sompo Holdings, Inc.
4

(Millions of yen)
As of March 31, 2016 As of March 31, 2017
Net assets:
Shareholders’ equity:
Common stock 100,045 100,045
Capital surplus 411,086 408,382
Retained earnings 364,888 501,561
Treasury stock (36,975) (71,459)
Total shareholders’ equity 839,045 938,529
Accumulated other comprehensive income:
Unrealized gains and losses on securities available
for sale825,912 863,455
Deferred gains and losses on hedges 10,510 8,003
Foreign currency translation adjustments (7,965) 22,663
Remeasurements of defined benefit plans (24,648) (29,676)
Total accumulated other comprehensive income 803,808 864,445
Stock acquisition rights 1,486 926
Non-controlling interests 8,498 65,038
Total net assets 1,652,839 1,868,940
Total liabilities and net assets 10,186,746 11,931,135
Sompo Holdings, Inc.
5

(2) Consolidated Statement of Income and Consolidated Statement of Comprehensive Income
Consolidated Statement of Income
(Millions of yen)
Fiscal year ended
March 31, 2016
Fiscal year ended
March 31, 2017
(April 1, 2015 to
March 31, 2016)
(April 1, 2016 to
March 31, 2017)
Ordinary income: 3,256,186 3,419,530
Underwriting income: 3,021,030 3,050,550
Net premiums written 2,552,193 2,550,336
Deposits of premiums by policyholders 120,312 131,617
Interest and dividend income on deposits of premiums, etc. 45,897 41,823
Life insurance premiums written 297,696 323,860
Reversal of reserve for outstanding losses and claims 1,599 -
Other underwriting income 3,330 2,911
Investment income: 203,257 232,846
Interest and dividend income 163,248 173,563
Investment gains on money trusts 5,838 2,534
Investment gains on trading securities 3,195 5,574
Gains on sales of securities 64,804 81,973
Gains on redemption of securities 373 256
Gains on derivatives 4,385 -
Investment gains on special account - 1,851
Other investment income 7,309 8,918
(45,897) (41,823)
Other ordinary income: 31,898 136,133
Investment gains on the equity method 270 398
Other ordinary income 31,628 135,734
Ordinary expenses: 3,039,332 3,177,817
Underwriting expenses: 2,526,649 2,515,138
Net claims paid 1,461,666 1,427,712
Loss adjustment expenses 134,363 136,599
Net commissions and brokerage fees 489,674 484,365
Maturity refunds to policyholders 244,766 226,431
Dividends to policyholders 79 87
Life insurance claims paid and other payments 80,216 82,779
Provision for reserve for outstanding losses and claims - 31,018
Provision for underwriting reserves 108,087 118,856
Other underwriting expenses 7,793 7,285
Investment expenses: 28,212 41,213
Investment losses on money trusts 123 198
Losses on sales of securities 961 14,560
Impairment losses on securities 19,799 3,257
Losses on redemption of securities 90 192
Losses on derivatives - 18,298
Investment losses on special account 822 -
Other investment expenses 6,414 4,705
Operating, general and administrative expenses 465,091 506,537
Other ordinary expenses: 19,379 114,927
Interest paid 5,707 9,657
Provision for allowance for possible credit losses 224 119
Losses on bad debt 24 120
Other ordinary expenses 13,422 105,029
Ordinary profit 216,853 241,713
Transfer of interest and dividend income on deposits of
premiums, etc.
Sompo Holdings, Inc.
6
(Millions of yen)
Fiscal year ended
March 31, 2016
Fiscal year ended
March 31, 2017
(April 1, 2015 to
March 31, 2016)
(April 1, 2016 to
March 31, 2017)
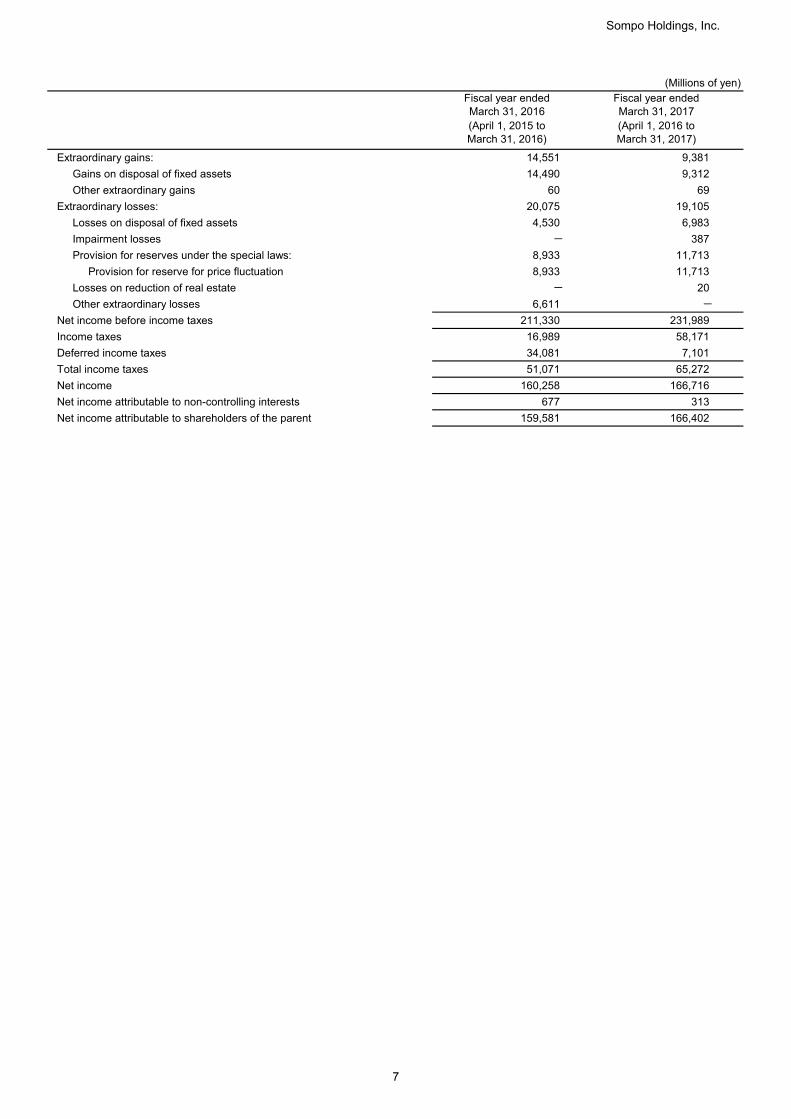
Extraordinary gains: 14,551 9,381
Gains on disposal of fixed assets 14,490 9,312
Other extraordinary gains 60 69
Extraordinary losses: 20,075 19,105
Losses on disposal of fixed assets 4,530 6,983
Impairment losses - 387
Provision for reserves under the special laws: 8,933 11,713
Provision for reserve for price fluctuation 8,933 11,713
Losses on reduction of real estate - 20
Other extraordinary losses 6,611 -
Net income before income taxes 211,330 231,989
Income taxes 16,989 58,171
Deferred income taxes 34,081 7,101
Total income taxes 51,071 65,272
Net income 160,258 166,716
Net income attributable to non-controlling interests 677 313
Net income attributable to shareholders of the parent 159,581 166,402
Sompo Holdings, Inc.
7

Consolidated Statement of Comprehensive Income
(Millions of yen)
Fiscal year ended Fiscal year ended
March 31, 2016 March 31, 2017
(April 1, 2015 to (April 1, 2016 to
March 31, 2016) March 31, 2017)
Net income 160,258 166,716
Other comprehensive income:
Unrealized gains and losses on securities available for sale (222,958) 37,559
Deferred gains and losses on hedges 2,425 (2,507)
Foreign currency translation adjustments (34,835) 30,176
Remeasurements of defined benefit plans (21,379) (5,026)
(200) 30
Total other comprehensive income (276,948) 60,232
Comprehensive income (116,689) 226,949
(Comprehensive income attributable to)
(116,059) 227,039
(630) (90)
Share of other comprehensive income of affiliates accounted for
under the equity method
Comprehensive income attributable to shareholders of the parent
Comprehensive income attributable to non-controlling interests
Sompo Holdings, Inc.
8

Fiscal year ended March 31, 2016 (April 1, 2015 to March 31, 2016)
(Millions of yen)
Common stock Capital surplusRetained
earningsTreasury stock
Total
shareholders’
equity
100,045 438,306 222,682 (19,067) 741,967
Cumulative effects of
changes in
accounting policies
(27,041) 15,624 (11,417)
100,045 411,265 238,306 (19,067) 730,550
Dividends (32,487) (32,487)
Net income
attributable to
shareholders of the
parent
159,581 159,581
Acquisition of
treasury stock(18,555) (18,555)
Disposal of treasury
stock(162) 647 485
Changes in the
scope of
consolidation
(511) (511)
Changes in interest
of the parent related
to transactions with
non-controlling
shareholders
(16) (16)
Net changes in items
other than
shareholders’ equity
- (179) 126,581 (17,907) 108,494
100,045 411,086 364,888 (36,975) 839,045
Unrealized gains
and losses on
securities
available for sale
Deferred gains
and losses on
hedges
Foreign currency
translation
adjustments
Remeasurements
of defined benefit
plans
Total
accumulated
other
comprehensive
income
1,048,718 8,085 26,046 (3,235) 1,079,614 1,550 6,720 1,829,852
Cumulative effects of
changes in
accounting policies
(139) (139) 1 (11,555)
1,048,718 8,085 25,906 (3,235) 1,079,474 1,550 6,721 1,818,297
Dividends (32,487)
Net income
attributable to
shareholders of the
parent
159,581
Acquisition of
treasury stock(18,555)
Disposal of treasury
stock485
Changes in the
scope of
consolidation
(511)
Changes in interest
of the parent related
to transactions with
non-controlling
shareholders
(16)
Net changes in items
other than
shareholders’ equity
(222,806) 2,425 (33,871) (21,413) (275,665) (63) 1,777 (273,951)
(222,806) 2,425 (33,871) (21,413) (275,665) (63) 1,777 (165,457)
825,912 10,510 (7,965) (24,648) 803,808 1,486 8,498 1,652,839
(3) Consolidated Statement of Changes in Net Assets
Balance at the
beginning of the period
Changes during the
period:
Total changes during
the period
Balance at the end of
the period
Stock acquisition
rights
Restated balance
Shareholders’ equity
Non-controlling
interestsTotal net assets
Balance at the
beginning of the period
Total changes during
the period
Balance at the end of
the period
Changes during the
period:
Accumulated other comprehensive income
Restated balance
Sompo Holdings, Inc.
9

Fiscal year ended March 31, 2017 (April 1, 2016 to March 31, 2017)
(Millions of yen)
Common stock Capital surplusRetained
earningsTreasury stock
Total
shareholders’
equity
100,045 411,086 364,888 (36,975) 839,045
Dividends (31,925) (31,925)
Net income
attributable to
shareholders of the
parent
166,402 166,402
Acquisition of
treasury stock(35,230) (35,230)
Disposal of treasury
stock(229) 745 516
Changes in the
scope of
consolidation
2,195 2,195
Changes in interest
of the parent related
to transactions with
non-controlling
shareholders
(2,474) (2,474)
Net changes in items
other than
shareholders’ equity
- (2,703) 136,672 (34,484) 99,484
100,045 408,382 501,561 (71,459) 938,529
Unrealized gains
and losses on
securities
available for sale
Deferred gains
and losses on
hedges
Foreign currency
translation
adjustments
Remeasurements
of defined benefit
plans
Total
accumulated
other
comprehensive
income
825,912 10,510 (7,965) (24,648) 803,808 1,486 8,498 1,652,839
Dividends (31,925)
Net income
attributable to
shareholders of the
parent
166,402
Acquisition of
treasury stock(35,230)
Disposal of treasury
stock516
Changes in the
scope of
consolidation
2,195
Changes in interest
of the parent related
to transactions with
non-controlling
shareholders
(2,474)
Net changes in items
other than
shareholders’ equity
37,542 (2,507) 30,629 (5,027) 60,636 (560) 56,539 116,615
37,542 (2,507) 30,629 (5,027) 60,636 (560) 56,539 216,100
863,455 8,003 22,663 (29,676) 864,445 926 65,038 1,868,940 Balance at the end of
the period
Balance at the
beginning of the period
Changes during the
period:
Total changes during
the period
Total changes during
the period
Balance at the end of
the period
Accumulated other comprehensive income
Changes during the
period:
Stock acquisition
rights
Non-controlling
interestsTotal net assets
Shareholders’ equity
Balance at the
beginning of the period
Sompo Holdings, Inc.
10

(4) Consolidated Statement of Cash Flows
(Millions of yen)
Fiscal year ended
March 31, 2016
Fiscal year ended
March 31, 2017
Cash flows from operating activities:
Net income before income taxes and non-controlling interests 211,330 231,989
Depreciation 20,780 25,603
Impairment losses - 387
Amortization of goodwill 4,462 8,907
Increase (decrease) in reserve for outstanding losses and claims 7,053 21,218
Increase (decrease) in underwriting reserves 103,966 114,436
Increase (decrease) in allowance for possible credit losses 69 88
Increase (decrease) in net defined benefit liability (2,766) 2,985
Increase (decrease) in reserve for retirement benefits to directors 5 (78)
Increase (decrease) in reserve for bonus payments 1,963 146
Increase (decrease) in reserve for bonus payments to directors (36) 125
Increase (decrease) in reserve for stocks payments - 445
Increase (decrease) in reserve for price fluctuation 8,933 11,713
Interest and dividend income (163,248) (173,563)
Losses (gains) on investment in securities (44,326) (64,217)
Interest expenses 5,707 9,657
Foreign exchange losses (gains) (9,747) (8,623)
Losses (gains) related to tangible fixed assets (9,960) (7,429)
Losses (gains) related to loans 9 1
Investment losses (gains) on the equity method (270) (398)
Decrease (increase) in other assets (other than investing and
financing activities)(21,815) (15,360)
Increase (decrease) in other liabilities (other than investing and
financing activities)5,182 20,947
Others 4,450 34,503
Subtotal 121,746 213,486
Interest and dividend received 167,291 175,913
Interest paid (4,988) (8,250)
Income taxes paid (17,616) (18,228)
Cash flows from operating activities 266,432 362,920
(April 1, 2016 to
March 31, 2017)
(April 1, 2015 to
March 31, 2016)
Sompo Holdings, Inc.
11

(Millions of yen)
Fiscal year ended
March 31, 2016
Fiscal year ended
March 31, 2017
(April 1, 2016 to
March 31, 2017)
(April 1, 2015 to
March 31, 2016)
Cash flows from investing activities:
Net decrease (increase) in deposits (7,626) (35,467)
Proceeds from sales and redemption of monetary receivables bought 2,866 3,410
Increase in money trusts (17,690) (16,737)
Decrease in money trusts 3,804 33,185
Purchase of securities (1,064,410) (1,345,927)
Proceeds from sales and redemption of securities 1,006,174 1,410,254
Loans made (172,186) (212,039)
Collection of loans 147,718 173,918
Others 1,009 44,975
Total of investment transactions (100,339) 55,573
Total of operating activities and investment transactions as above 166,092 418,494
Acquisition of tangible fixed assets (15,483) (15,786)
Proceeds from sales of tangible fixed assets 25,350 12,302
Acquisition of stocks of subsidiaries resulting in changes in the
scope of consolidation(61,808) (549,226)
Others (16,962) (29,531)
Cash flows from investing activities (169,243) (526,668)
Cash flows from financing activities:
Proceeds from issuance of corporate bonds - 200,000
Redemption of corporate bonds (2,293) (115)
Change in payables under securities lending transactions - 250,063
Proceeds from sales of treasury stock 64 25
Acquisition of treasury stock (18,555) (35,230)
Dividends paid (32,456) (31,885)
Dividends paid to non-controlling shareholders - (72)
Acquisition of stocks of subsidiaries that do not result in changes in
the scope of consolidation(48) (4,678)
Others (3,549) (14,271)
Cash flows from financing activities (56,838) 363,835
Effect of exchange rate changes on cash and cash equivalents (9,222) (5,679)
Increase (decrease) in cash and cash equivalents 31,128 194,408
Cash and cash equivalents at the beginning of the period 545,192 576,791
470 -
- 2,266
Cash and cash equivalents at the end of the period 576,791 773,466
Increase in cash and cash equivalents resulting from merger
Increase in cash and cash equivalents resulting from newly
consolidated subsidiaries
Sompo Holdings, Inc.
12
(5) Notes on Going-Concern Assumption
None.
(6) Changes in Accounting Policies, Changes in Accounting Estimations, and Retrospective Restatements
(Changes in accounting policies)
In accordance with the amendment in the Corporation Tax Act, the Company has adopted the “Practical Solution on
a change in depreciation method due to Tax Reform 2016” (Accounting Standards Board of Japan Practical Issue
Task Force No. 32, June 17, 2016) from the fiscal year ended March 31, 2017, and has changed the depreciation
method for structures and fixtures attached to buildings acquired on or after April 1, 2016, from the declining-balance
method to the straight-line method.
The effect of this change on the ordinary profit and net income before income taxes for the fiscal year ended March
31, 2017 was immaterial.
(7) Additional Information
(Application of the Implementation Guidance on Recoverability of Deferred Tax Assets)
Effective from the fiscal year ended March 31, 2017, the Company has applied the “Implementation Guidance on
Recoverability of Deferred Tax Assets” (Accounting Standards Board of Japan Guidance No. 26, March 28, 2016).
Sompo Holdings, Inc.
13
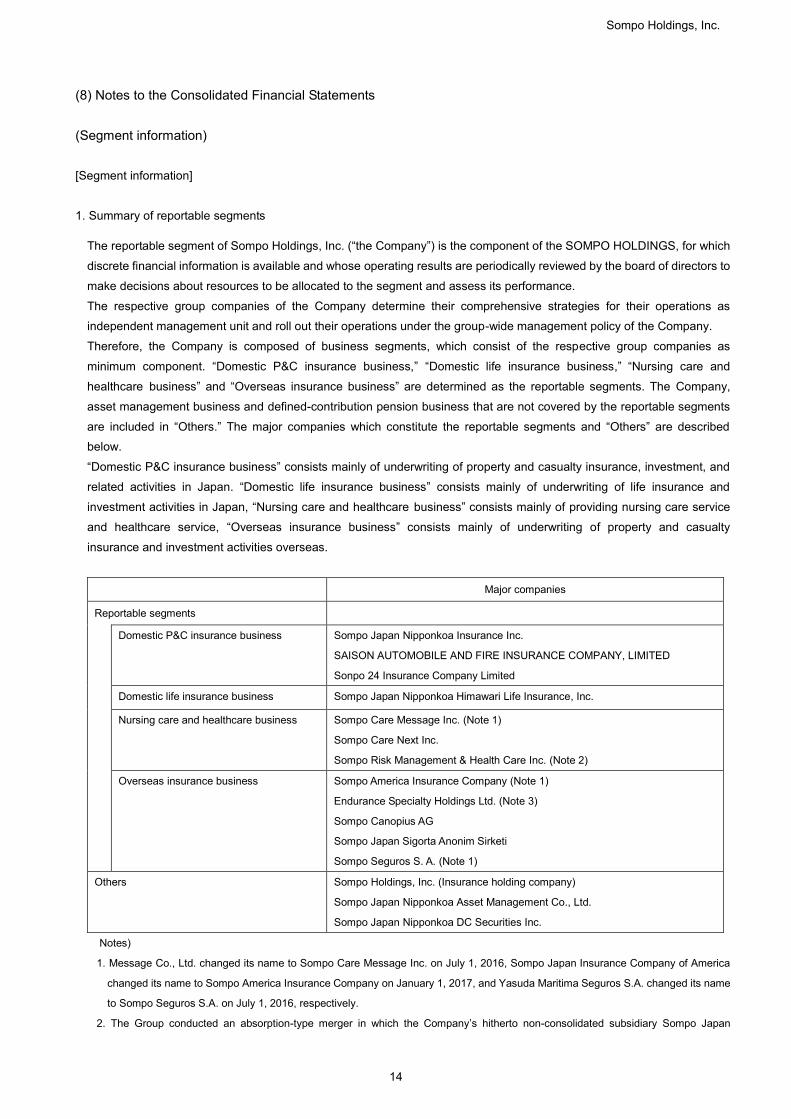
(8) Notes to the Consolidated Financial Statements
(Segment information)
[Segment information]
1. Summary of reportable segments
The reportable segment of Sompo Holdings, Inc. (“the Company”) is the component of the SOMPO HOLDINGS, for which
discrete financial information is available and whose operating results are periodically reviewed by the board of directors to
make decisions about resources to be allocated to the segment and assess its performance.
The respective group companies of the Company determine their comprehensive strategies for their operations as
independent management unit and roll out their operations under the group-wide management policy of the Company.
Therefore, the Company is composed of business segments, which consist of the respective group companies as
minimum component. “Domestic P&C insurance business,” “Domestic life insurance business,” “Nursing care and
healthcare business” and “Overseas insurance business” are determined as the reportable segments. The Company,
asset management business and defined-contribution pension business that are not covered by the reportable segments
are included in “Others.” The major companies which constitute the reportable segments and “Others” are described
below.
“Domestic P&C insurance business” consists mainly of underwriting of property and casualty insurance, investment, and
related activities in Japan. “Domestic life insurance business” consists mainly of underwriting of life insurance and
investment activities in Japan, “Nursing care and healthcare business” consists mainly of providing nursing care service
and healthcare service, “Overseas insurance business” consists mainly of underwriting of property and casualty
insurance and investment activities overseas.
Major companies
Reportable segments
Domestic P&C insurance business Sompo Japan Nipponkoa Insurance Inc.
SAISON AUTOMOBILE AND FIRE INSURANCE COMPANY, LIMITED
Sonpo 24 Insurance Company Limited
Domestic life insurance business Sompo Japan Nipponkoa Himawari Life Insurance, Inc.
Nursing care and healthcare business Sompo Care Message Inc. (Note 1)
Sompo Care Next Inc.
Sompo Risk Management & Health Care Inc. (Note 2)
Overseas insurance business Sompo America Insurance Company (Note 1)
Endurance Specialty Holdings Ltd. (Note 3)
Sompo Canopius AG
Sompo Japan Sigorta Anonim Sirketi
Sompo Seguros S. A. (Note 1)
Others Sompo Holdings, Inc. (Insurance holding company)
Sompo Japan Nipponkoa Asset Management Co., Ltd.
Sompo Japan Nipponkoa DC Securities Inc.
Notes)
1. Message Co., Ltd. changed its name to Sompo Care Message Inc. on July 1, 2016, Sompo Japan Insurance Company of America
changed its name to Sompo America Insurance Company on January 1, 2017, and Yasuda Maritima Seguros S.A. changed its name
to Sompo Seguros S.A. on July 1, 2016, respectively.
2. The Group conducted an absorption-type merger in which the Company’s hitherto non-consolidated subsidiary Sompo Japan
Sompo Holdings, Inc.
14
Nipponkoa Risk Management Inc. (renamed Sompo Risk Management & Health Care Inc. on April 1, 2016) was the surviving
company, while the Company’s hitherto consolidated subsidiary Healthcare Frontier Japan Inc. and the Company’s hitherto
non-consolidated subsidiary Sompo Japan Nipponkoa Healthcare Services Inc. were the absorbed companies. As a result, Sompo
Risk Management & Health Care Inc. is included in the scope of consolidation in the fiscal year ended March 31, 2017, due to an
increase in its materiality.
3. Endurance Specialty Holdings Ltd. and its 33 group companies are included in the scope of consolidation during the fiscal year ended
March 31, 2017 because they became consolidated subsidiaries through the acquisition of shares. Result of operations is not
included in the segment information for the fiscal year ended March 31, 2017.
(Changes in reportable segments)
As for the fiscal year ended March 31, 2017, reportable segments has been changed from three business lines, which include
“Domestic P&C insurance business,” “Domestic life insurance business” and “Overseas insurance business” to four business lines,
which include “Domestic P&C insurance business,” “Domestic life insurance business,” “Nursing care and healthcare business” and
“Overseas insurance business.” Regarding this change, “Nursing care and healthcare business” which is included in “Others” enters
into the nursing care business on a full scale and becomes an independent reportable segment, due to an increase in its materiality.
Segment information for the fiscal year ended March 31, 2016 is based on the business lines after the changes.
2. Calculation methods for the amount of sales, income or loss, assets and other items by each reportable segment
The accounting methods of reportable business segments are those used in the preparation of the consolidated financial
statements. Income or loss attributable to the reportable segments is the amounts based on net income attributable to
shareholders of the parent in the consolidated statement of income.
Income from internal transactions among segments is based on the price of transactions among third parties and others.
(Changes in the depreciation method)
As described in “(6) Changes in Accounting Policies, Changes in Accounting Estimations, and Retrospective Restatements,” the
Company has changed the depreciation method for structures and fixtures attached to buildings acquired on or after April 1, 2016
from the declining-balance method to the straight-line method.
The effect of this change on segment income and segment loss for the fiscal year ended March 31, 2017 was immaterial.
Sompo Holdings, Inc.
15

3. Information related to the amount of sales, income or loss, assets and other items by each reportable segment
Fiscal year ended March 31, 2016 (April 1, 2015 to March 31, 2016) (Millions of yen)
Reportable segments
Others (Note 2)
Total Adjustments
(Note 3)
Amount on the
consolidated financial
statements (Note 4)
Domestic P&C
insurance business
Domestic life
insurance business
Nursing care and
healthcare business
Overseas insurance business
Total
Sales (Note 1):
Sales from transactions with external customers 2,259,590 293,695 11,445 296,604 2,861,336 10,008 2,871,344 384,841 3,256,186
Sales from internal transactions or transfers among segments
- - - - - 6,792 6,792 (6,792) -
Total 2,259,590 293,695 11,445 296,604 2,861,336 16,800 2,878,137 378,049 3,256,186
Segment income (loss) 132,496 10,874 (887) 16,046 158,530 1,050 159,581 - 159,581
Segment assets 6,647,546 2,439,535 198,609 880,626 10,166,317 20,428 10,186,746 - 10,186,746
Other items:
Depreciation 16,757 472 1,081 2,365 20,677 103 20,780 - 20,780
Amortization of goodwill 121 609 375 3,356 4,462 - 4,462 - 4,462
Interest and dividend income 109,033 40,058 34 14,959 164,085 0 164,086 (838) 163,248
Interest paid 4,254 78 656 721 5,709 33 5,743 (36) 5,707
Investment gains (losses) on the equity method 65 - - 204 270 - 270 - 270
Extraordinary gains (Note 5) 13,963 - 200 327 14,490 60 14,551 - 14,551
Extraordinary losses (Note 6) 18,926 898 222 21 20,069 5 20,075 - 20,075
Income tax expenses 40,676 5,728 30 3,917 50,352 718 51,071 - 51,071
Investment in affiliates accounted for under the equity method
1,149 - - 1,335 2,484 - 2,484 - 2,484
Increase in tangible and intangible fixed assets 31,817 813 56,898 4,199 93,728 173 93,902 - 93,902
Notes)
1. Sales amounts represent the following:
Domestic P&C insurance business: Net premiums written
Domestic life insurance business: Life insurance premiums written
Overseas insurance business: Net premiums written and life insurance premiums written
Nursing care and healthcare business: Ordinary income
“Others” and amount on the consolidated financial statements: Ordinary income
2. “Others” is business segments which are not included in reportable segments. It includes the Company (insurance holding company),
asset management business and defined-contribution pension business.
3. Adjustments of sales are as follows.
Ordinary income related to domestic P&C insurance business, domestic life insurance
business and overseas insurance business excluding net premiums written and life
insurance premiums written: 384,841 million yen
Elimination of internal transactions among segments: (6,792) million yen
4. Segment income (loss) is adjusted to net income attributable to shareholders of the parent in the consolidated statement of income.
5. Extraordinary gains for domestic P&C insurance business include 13,963 million yen of gains on disposal of fixed assets.
6. Extraordinary losses for domestic P&C insurance business include 8,046 million yen of provision for reserve for price fluctuation, and
Sompo Holdings, Inc.
16

6,439 million yen of the special premium to be paid out in conjunction with Special Measures for Life Plan Support.
Sompo Holdings, Inc.
17

Fiscal year ended March 31, 2017 (April 1, 2016 to March 31, 2017) (Millions of yen)
Reportable segments
Others (Note 2)
Total Adjustments
(Note 3)
Amount on the
consolidated financial
statements (Note 4)
Domestic P&C
insurance business
Domestic life
insurance business
Nursing care and
healthcare business
Overseas insurance business
Total
Sales (Note 1):
Sales from transactions with external customers
2,212,230 317,311 116,492 344,655 2,990,689 9,892 3,000,582 418,948 3,419,530
Sales from internal transactions or transfers among segments
- - 2,663 - 2,663 8,665 11,328 (11,328) -
Total 2,212,230 317,311 119,155 344,655 2,993,352 18,558 3,011,910 407,619 3,419,530
Segment income (loss) 153,774 7,642 (6,847) 12,833 167,403 (1,000) 166,402 - 166,402
Segment assets 6,568,019 2,590,322 189,066 2,559,729 11,907,137 23,997 11,931,135 - 11,931,135
Other items:
Depreciation 15,936 471 5,583 3,467 25,460 142 25,603 - 25,603
Amortization of goodwill 154 609 4,807 3,336 8,907 - 8,907 - 8,907
Interest and dividend income 113,916 41,582 164 18,750 174,413 0 174,413 (850) 173,563
Interest paid 5,330 93 3,052 1,181 9,658 7 9,666 (8) 9,657
Investment gains (losses) on the equity method
177 - - 220 398 - 398 - 398
Extraordinary gains (Note 5) 9,257 0 0 53 9,312 69 9,381 - 9,381
Extraordinary losses (Note 6) 17,546 1,172 224 148 19,092 12 19,105 - 19,105
Impairment losses 197 - 178 - 375 11 387 - 387
Income tax expenses 55,082 3,426 1,386 4,655 64,550 722 65,272 - 65,272
Investment in affiliates accounted for under the equity method
1,324 - - 1,761 3,085 - 3,085 - 3,085
Increase in tangible and intangible fixed assets
47,389 498 2,813 132,315 183,017 324 183,342 - 183,342
Notes)
1. Sales amounts represent the following:
Domestic P&C insurance business: Net premiums written
Domestic life insurance business: Life insurance premiums written
Overseas insurance business: Net premiums written and life insurance premiums written
Nursing care and healthcare business: Ordinary income
“Others” and amount on the consolidated financial statements: Ordinary income
2. “Others” is business segments which are not included in reportable segments. It includes the Company (insurance holding company),
asset management business and defined-contribution pension business.
3. Adjustments of sales are as follows.
Ordinary income related to domestic P&C insurance business, domestic life insurance
business and overseas insurance business excluding net premiums written and life
insurance premiums written: 418,948 million yen
Elimination of internal transactions among segments: (11,328) million yen
4. Segment income (loss) is adjusted to net income attributable to shareholders of the parent in the consolidated statement of income.
5. Extraordinary gains for domestic P&C insurance business include 9,257 million yen of gains on disposal of fixed assets.
6. Extraordinary losses for domestic P&C insurance business include 10,542 million yen of provision for reserve for price fluctuation, and
6,807 million yen of losses on disposal of fixed assets.
Sompo Holdings, Inc.
18

[Related information]
Fiscal year ended March 31, 2016 (April 1, 2015 to March 31, 2016)
1. Information by products and services (Millions of yen)
Fire and
allied insurance
Marine insurance
Personal accident
insurance
Voluntary automobile insurance
Compulsory automobile
liability insurance
Others Total
Net premiums written 407,817 85,905 194,287 1,197,795 307,233 359,154 2,552,193
(Millions of yen)
Individual Insurance
Individual annuities
Group insurance
Group annuities Total
Life insurance premiums written 275,148 7,408 15,139 - 297,696
2. Information by geographic area
(1) Sales (Millions of yen)
Japan Overseas Total
2,464,473 396,863 2,861,336
Notes)
1. Sales represent amounts of net premiums written, life insurance premiums written and ordinary income of nursing care and
healthcare business.
2. Geographic area is classified into “Japan” or “Overseas” in line with the classification used for management purpose mainly
based on locations of customers.
(2) Tangible fixed assets
Geographic information is omitted because tangible fixed assets located in Japan constitute more than 90 percent of
tangible fixed assets in the consolidated balance sheet.
3. Information by major customers
None.
Sompo Holdings, Inc.
19

Fiscal year ended March 31, 2017 (April 1, 2016 to March 31, 2017)
1. Information by products and services (Millions of yen)
Fire and
allied insurance
Marine insurance
Personal accident
insurance
Voluntary automobile insurance
Compulsory automobile
liability insurance
Others Total
Net premiums written 373,558 79,335 194,152 1,245,666 295,884 361,739 2,550,336
(Millions of yen)
Individual Insurance
Individual annuities
Group insurance
Group annuities Total
Life insurance premiums written 299,931 6,935 16,994 - 323,860
2. Information by geographic area
(1) Sales (Millions of yen)
Japan Overseas Total
2,557,488 433,200 2,990,689
Notes)
1. Sales represent amounts of net premiums written, life insurance premiums written and ordinary income of nursing care and
healthcare business.
2. Geographic area is classified into “Japan” or “Overseas” in line with the classification used for management purpose mainly
based on locations of customers.
(2) Tangible fixed assets
Geographic information is omitted because tangible fixed assets located in Japan constitute more than 90 percent of
tangible fixed assets in the consolidated balance sheet.
3. Information by major customers
None.
Sompo Holdings, Inc.
20

[Information related to impairment losses on fixed assets by reportable segments]
Fiscal year ended March 31, 2016 (April 1, 2015 to March 31, 2016) None.
Fiscal year ended March 31, 2017 (April 1, 2016 to March 31, 2017) (Millions of yen)
Reportable segments
Others
Unallocated amounts
and eliminations
Total Domestic
P&C insurance business
Domestic life
insurance business
Nursing care and
healthcare business
Overseas insurance business
Total
Impairment losses 197
- 178 - 375 11 - 387
[Information related to amortization of goodwill and balance of goodwill by reportable segments]
Fiscal year ended March 31, 2016 (April 1, 2015 to March 31, 2016) (Millions of yen)
Reportable segments
Others
Unallocated amounts
and eliminations
Total Domestic
P&C insurance business
Domestic life
insurance business
Nursing care and
healthcare business
Overseas insurance business
Total
Amortization for the fiscal year ended March 31, 2016
121 609 375 3,356 4,462 - - 4,462
Balance as of March 31, 2016 349
3,045 55,213 55,367 113,976 - - 113,976
Fiscal year ended March 31, 2017 (April 1, 2016 to March 31, 2017)
(Millions of yen)
Reportable segments
Others
Unallocated amounts
and eliminations
Total Domestic
P&C insurance business
Domestic life
insurance business
Nursing care and
healthcare business
Overseas insurance business
Total
Amortization for the fiscal year ended March 31, 2017
154 609 4,807 3,336 8,907 - - 8,907
Balance as of March 31, 2017 389 2,436 50,405 226,154 279,386 - - 279,386
[Information related to gains on negative goodwill by reportable segments]
None.
Sompo Holdings, Inc.
21

1. Trading Securities
(Millions of yen)
As of March 31, 2016 As of March 31, 2017
Trading securities
Note)
2. Bonds held to maturity
(Millions of yen)
As of March 31, 2016 As of March 31, 2017
Unrealized
gains and
losses
Domestic bonds 278,155
Foreign securities 7
Subtotal 278,162
Domestic bonds (802)
Foreign securities (33)
Subtotal (836)
277,326
3. Policy reserve matching bonds
(Millions of yen)
Unrealized
gains and
losses
Domestic bonds 18,428
Domestic bonds (2,453)
Total 15,974
147,193
52,465
168,786
- 50,011
Securities whose
fair value exceeds
their carrying amount
Securities
whose fair value
does not exceed
their carrying amount
25,760 199,659 215,634
25,760
-
As of March 31, 2016 As of March 31, 2017
143,026 168,786
Carrying
amountFair value
Unrealized
gains and
losses
Carrying
amount
143,026
-
Securities whose
fair value exceeds
their carrying amount
Securities
whose fair value
does not exceed
their carrying amount
Total
602
-
2,933
Carrying
amount
1,219,943
1,220,545
Carrying amount
2,933
1,223,479
1,555,133
615
1,555,749
-
2,876
2,876
1,558,625
270,966 (3,078)
Carrying
amountFair value
630,798 2,501
Fair value
――
As of March 31, 2016
Unrealized gains and
losses recognized in
statement of income
Carrying amount
1,188,313 1,466,468
Unrealized
gains and
losses
Unrealized gains and
losses recognized in
statement of income
Certificate of deposit classified as cash and deposits and
commercial paper as monetary receivables bought in the
consolidated balance sheet are included above.
As of March 31, 2017
335,190
16,452
1,483,082
1,916
17,288
1,205,755
Fair value
165,622
1,883
335,145
14,56915,371
153
1,188,467
161
1,466,629
(57)
(Securities)
-
12
335,203
(57)
Sompo Holdings, Inc.
22
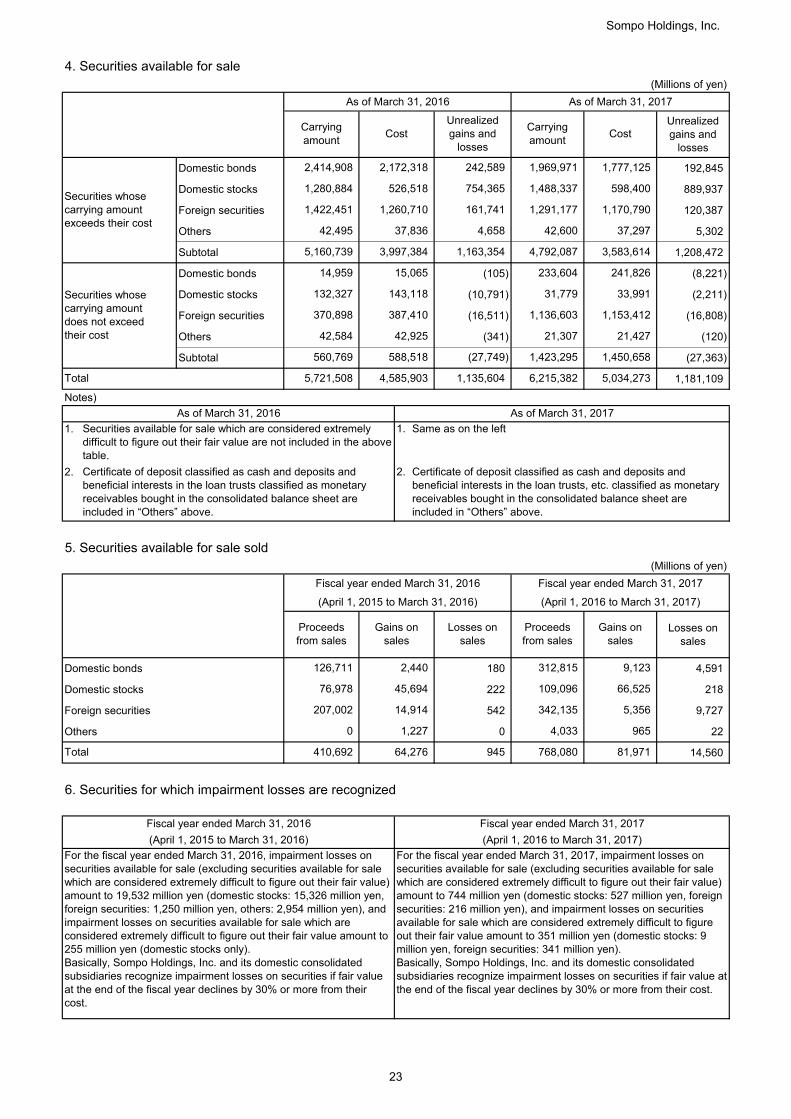
4. Securities available for sale
(Millions of yen)
As of March 31, 2016 As of March 31, 2017
Unrealized
gains and
losses
Domestic bonds 192,845
Domestic stocks 889,937
Foreign securities 120,387
Others 5,302
Subtotal 1,208,472
Domestic bonds (105) (8,221)
Domestic stocks (10,791) (2,211)
Foreign securities (16,511) (16,808)
Others (341) (120)
Subtotal (27,363)
1,181,109
Notes)
1. 1.
2. 2.
5. Securities available for sale sold
(Millions of yen)
Fiscal year ended March 31, 2016 Fiscal year ended March 31, 2017
(April 1, 2015 to March 31, 2016) (April 1, 2016 to March 31, 2017)
Losses on
sales
Domestic bonds 180 4,591
Domestic stocks 222 218
Foreign securities 542 9,727
Others 0 22
14,560
6. Securities for which impairment losses are recognized
Total
Securities whose
carrying amount
exceeds their cost
Securities whose
carrying amount
does not exceed
their cost
CostCarrying
amount
2,414,908
1,280,884
1,422,451
2,172,318
526,518
1,260,710
5,160,739
14,959
132,327
370,898
42,584
15,065
143,118
387,410
3,997,384
42,925
588,518
4,585,903
(27,749)
1,135,604
560,769
5,721,508
1,136,603
1,969,971
1,488,337
1,291,177
42,600
4,792,087
6,215,382
1,777,125
598,400
1,170,790
37,297
3,583,614
241,826
33,991
233,604
31,779
Proceeds
from sales
Gains on
sales
Losses on
sales
1,153,412
21,427
1,450,658
5,034,273
21,307
1,423,295
For the fiscal year ended March 31, 2016, impairment losses on
securities available for sale (excluding securities available for sale
which are considered extremely difficult to figure out their fair value)
amount to 19,532 million yen (domestic stocks: 15,326 million yen,
foreign securities: 1,250 million yen, others: 2,954 million yen), and
impairment losses on securities available for sale which are
considered extremely difficult to figure out their fair value amount to
255 million yen (domestic stocks only).
Basically, Sompo Holdings, Inc. and its domestic consolidated
subsidiaries recognize impairment losses on securities if fair value
at the end of the fiscal year declines by 30% or more from their
cost.
For the fiscal year ended March 31, 2017, impairment losses on
securities available for sale (excluding securities available for sale
which are considered extremely difficult to figure out their fair value)
amount to 744 million yen (domestic stocks: 527 million yen, foreign
securities: 216 million yen), and impairment losses on securities
available for sale which are considered extremely difficult to figure
out their fair value amount to 351 million yen (domestic stocks: 9
million yen, foreign securities: 341 million yen).
Basically, Sompo Holdings, Inc. and its domestic consolidated
subsidiaries recognize impairment losses on securities if fair value at
the end of the fiscal year declines by 30% or more from their cost.
Proceeds
from sales
Gains on
sales
0 1,227 4,033 965
(April 1, 2015 to March 31, 2016) (April 1, 2016 to March 31, 2017)
76,978
410,692 64,276 945 768,080
14,914 342,135 5,356
Fiscal year ended March 31, 2016 Fiscal year ended March 31, 2017
As of March 31, 2016 As of March 31, 2017
Securities available for sale which are considered extremely
difficult to figure out their fair value are not included in the above
table.
Certificate of deposit classified as cash and deposits and
beneficial interests in the loan trusts classified as monetary
receivables bought in the consolidated balance sheet are
included in “Others” above.
Same as on the left
Certificate of deposit classified as cash and deposits and
beneficial interests in the loan trusts, etc. classified as monetary
receivables bought in the consolidated balance sheet are
included in “Others” above.
Total
9,123
45,694 109,096
126,711 2,440 312,815
81,971
66,525
207,002
754,365
1,163,354
Carrying
amountCost
Unrealized
gains and
losses
42,495 37,836
242,589
161,741
4,658
Sompo Holdings, Inc.
23

(Per share information)
Fiscal year ended March 31, 2016 Fiscal year ended March 31, 2017
(April 1, 2015 to March 31, 2016) (April 1, 2016 to March 31, 2017)
Net assets per share 4,064.83 yen 4,583.07 yen
Net income per share 394.21 yen 419.15 yen
Diluted net income per share 393.66 yen 418.71 yen
Notes)
1. Calculation of net income per share and diluted net income per share is based on the following figures.
(Millions of yen)
Fiscal year ended March 31, 2016 Fiscal year ended March 31, 2017
(April 1, 2015 to March 31, 2016) (April 1, 2016 to March 31, 2017)
Net income per share
159,581 166,402
- -
159,581 166,402
404,804 thousand shares 396,995 thousand shares
Diluted net income per share
- -
Increase of common stocks: 572 thousand shares 419 thousand shares
Stock acquisition rights 572 thousand shares 419 thousand shares
2. Calculation of net assets per share is based on the following figures.
(Millions of yen)
As of March 31, 2016 As of March 31, 2017
Total net assets 1,652,839 1,868,940
9,985 65,964
Stock acquisition rights 1,486 926
Non-controlling interests 8,498 65,038
1,642,854 1,802,975
404,162 thousand shares 393,398 thousand shares
3.
Average number of common stocks
outstanding
Number of common stocks used for calculation of
net assets per share
Amount not attributable to common
stockholders
Net income attributable to shareholders of
the parent to common stocks
Net income attributable to shareholders of
the parent
Adjustment of net income attributable to
shareholders of the parent
Amount to be deducted from total net assets:
Net assets attributable to common stocks
In the calculation of net income per share and diluted net income per share, the Company shares outstanding in “Board Benefit Trust
(BBT)” which are recognized as treasury stock in shareholders’ equity are included in treasury stock deducted from the average
number of shares outstanding. In addition, in the calculation of net assets per share, such shares are included in treasury stock
deducted from the number of total shares outstanding.
For the fiscal year ended March 31, 2017, the average number of the treasury stock deducted above mentioned is 458 thousand. As of
March 31,2017, the number of the treasury stock deducted above mentioned is 612 thousand.
Sompo Holdings, Inc.
24
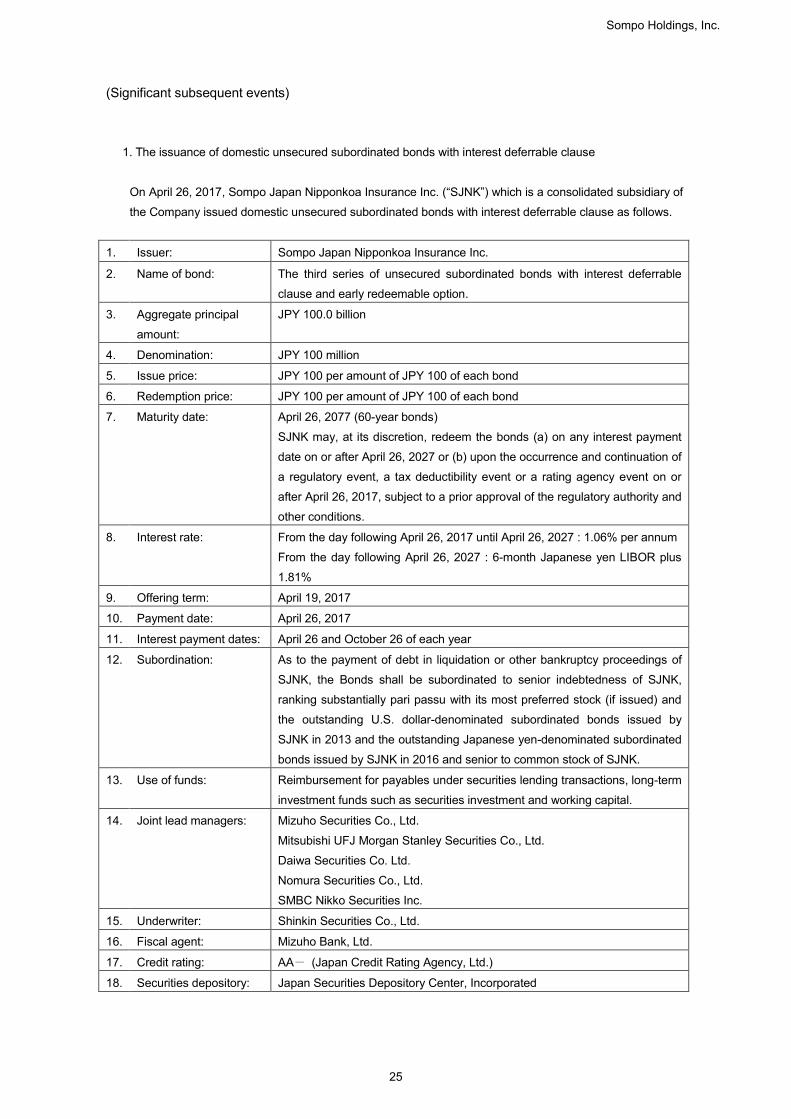
(Significant subsequent events)
1. The issuance of domestic unsecured subordinated bonds with interest deferrable clause
On April 26, 2017, Sompo Japan Nipponkoa Insurance Inc. (“SJNK”) which is a consolidated subsidiary of
the Company issued domestic unsecured subordinated bonds with interest deferrable clause as follows.
1. Issuer: Sompo Japan Nipponkoa Insurance Inc.
2. Name of bond: The third series of unsecured subordinated bonds with interest deferrable
clause and early redeemable option.
3. Aggregate principal
amount:
JPY 100.0 billion
4. Denomination: JPY 100 million
5. Issue price: JPY 100 per amount of JPY 100 of each bond
6. Redemption price: JPY 100 per amount of JPY 100 of each bond
7. Maturity date: April 26, 2077 (60-year bonds)
SJNK may, at its discretion, redeem the bonds (a) on any interest payment
date on or after April 26, 2027 or (b) upon the occurrence and continuation of
a regulatory event, a tax deductibility event or a rating agency event on or
after April 26, 2017, subject to a prior approval of the regulatory authority and
other conditions.
8. Interest rate: From the day following April 26, 2017 until April 26, 2027 : 1.06% per annum
From the day following April 26, 2027 : 6-month Japanese yen LIBOR plus
1.81%
9. Offering term: April 19, 2017
10. Payment date: April 26, 2017
11. Interest payment dates: April 26 and October 26 of each year
12. Subordination: As to the payment of debt in liquidation or other bankruptcy proceedings of
SJNK, the Bonds shall be subordinated to senior indebtedness of SJNK,
ranking substantially pari passu with its most preferred stock (if issued) and
the outstanding U.S. dollar-denominated subordinated bonds issued by
SJNK in 2013 and the outstanding Japanese yen-denominated subordinated
bonds issued by SJNK in 2016 and senior to common stock of SJNK.
13. Use of funds: Reimbursement for payables under securities lending transactions, long-term
investment funds such as securities investment and working capital.
14. Joint lead managers: Mizuho Securities Co., Ltd.
Mitsubishi UFJ Morgan Stanley Securities Co., Ltd.
Daiwa Securities Co. Ltd.
Nomura Securities Co., Ltd.
SMBC Nikko Securities Inc.
15. Underwriter: Shinkin Securities Co., Ltd.
16. Fiscal agent: Mizuho Bank, Ltd.
17. Credit rating: AA- (Japan Credit Rating Agency, Ltd.)
18. Securities depository: Japan Securities Depository Center, Incorporated
Sompo Holdings, Inc.
25
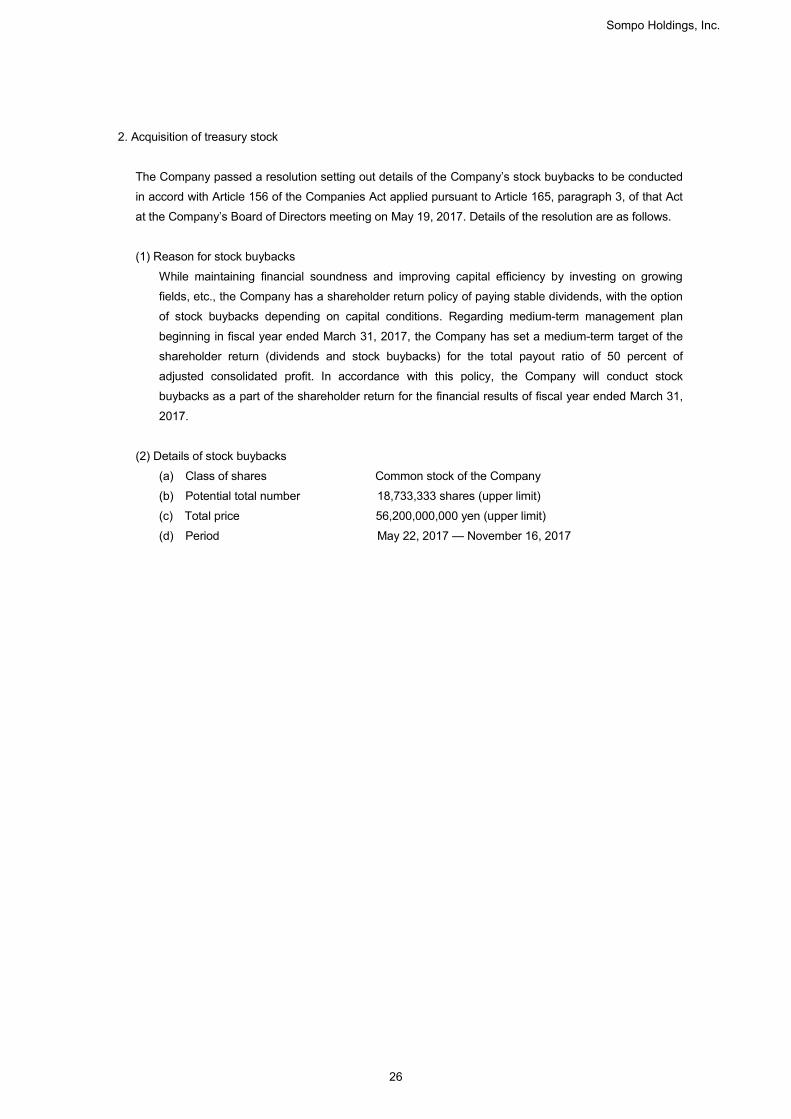
2. Acquisition of treasury stock
The Company passed a resolution setting out details of the Company’s stock buybacks to be conducted
in accord with Article 156 of the Companies Act applied pursuant to Article 165, paragraph 3, of that Act
at the Company’s Board of Directors meeting on May 19, 2017. Details of the resolution are as follows.
(1) Reason for stock buybacks
While maintaining financial soundness and improving capital efficiency by investing on growing
fields, etc., the Company has a shareholder return policy of paying stable dividends, with the option
of stock buybacks depending on capital conditions. Regarding medium-term management plan
beginning in fiscal year ended March 31, 2017, the Company has set a medium-term target of the
shareholder return (dividends and stock buybacks) for the total payout ratio of 50 percent of
adjusted consolidated profit. In accordance with this policy, the Company will conduct stock
buybacks as a part of the shareholder return for the financial results of fiscal year ended March 31,
2017.
(2) Details of stock buybacks
(a) Class of shares Common stock of the Company
(b) Potential total number 18,733,333 shares (upper limit)
(c) Total price 56,200,000,000 yen (upper limit)
(d) Period May 22, 2017 — November 16, 2017
Sompo Holdings, Inc.
26

4. Other
(1) Summary of Results of Operations (Consolidated)
(Millions of yen)
Increase Rate of
change
%
Ordinary income and expenses:
3,021,030 3,050,550 29,519 1.0
Net premiums written 2,552,193 2,550,336 (1,857) (0.1)
Deposits of premiums by policyholders 120,312 131,617 11,304 9.4
Life insurance premiums written 297,696 323,860 26,164 8.8
Reversal of reserve for outstanding losses and claims 1,599 - (1,599) (100.0)
Underwriting expenses: 2,526,649 2,515,138 (11,510) (0.5)
Net claims paid 1,461,666 1,427,712 (33,953) (2.3)
Loss adjustment expenses 134,363 136,599 2,236 1.7
Net commissions and brokerage fees 489,674 484,365 (5,308) (1.1)
Maturity refunds to policyholders 244,766 226,431 (18,335) (7.5)
Life insurance claims paid and other payments 80,216 82,779 2,562 3.2
Provision for reserve for outstanding losses and claims - 31,018 31,018 -
Provision for underwriting reserves 108,087 118,856 10,769 10.0
203,257 232,846 29,589 14.6
Interest and dividend income 163,248 173,563 10,315 6.3
Gains on sales of securities 64,804 81,973 17,168 26.5
28,212 41,213 13,001 46.1
Losses on sales of securities 961 14,560 13,599 1,414.2
Impairment losses on securities 19,799 3,257 (16,541) (83.5)
Operating, general and administrative expenses 465,091 506,537 41,446 8.9
Other ordinary income and expenses: 12,518 21,206 8,687 69.4
Investment gains on the equity method 270 398 128 47.4
Ordinary profit 216,853 241,713 24,859 11.5
Extraordinary gains and losses:
Extraordinary gains 14,551 9,381 (5,170) (35.5)
Extraordinary losses 20,075 19,105 (969) (4.8)
Extraordinary gains and losses (5,523) (9,724) (4,200) -
Net income before income taxes 211,330 231,989 20,659 9.8
Income taxes 16,989 58,171 41,181 242.4
Deferred income taxes 34,081 7,101 (26,980) (79.2)
Total income taxes 51,071 65,272 14,201 27.8
Net income 160,258 166,716 6,457 4.0
Net income attributable to non-controlling interests 677 313 (364) (53.7)
Net income attributable to shareholders of the parent 159,581 166,402 6,821 4.3
Underwriting income:
March 31, 2017
(April 1, 2016 to
Investment income:
Investment expenses:
March 31, 2016 (Decrease)
Fiscal year ended Fiscal year ended
March 31, 2016) March 31, 2017)
(April 1, 2015 to
Sompo Holdings, Inc.
27

(2) Premiums Written and Claims Paid by Business Lines (Consolidated)
Direct premiums written (including deposits of premiums by policyholders)
(Millions of yen)
Fiscal year ended March 31, 2016 Fiscal year ended March 31, 2017
(April 1, 2015 to March 31, 2016) (April 1, 2016 to March 31, 2017)
Business line Amount% of total
amount
Rate of
changeAmount
% of total
amount
Rate of
change
% % % %
Fire and allied insurance 495,770 17.6 2.2 478,351 16.7 (3.5)
Marine insurance 89,383 3.2 0.4 88,710 3.1 (0.8)
Personal accident insurance 285,927 10.2 (5.5) 298,883 10.4 4.5
Voluntary automobile insurance 1,199,227 42.7 1.8 1,251,748 43.6 4.4
Compulsory automobile liability insurance 316,107 11.3 (2.5) 318,407 11.1 0.7
Others 423,147 15.1 2.3 436,772 15.2 3.2
Total 2,809,564 100.0 0.6 2,872,874 100.0 2.3
Deposits of premiums by policyholders 120,312 4.3 (16.6) 131,617 4.6 9.4
Note) The above figures represent amounts after offsetting internal transactions among segments.
Net premiums written
(Millions of yen)
Fiscal year ended March 31, 2016 Fiscal year ended March 31, 2017
(April 1, 2015 to March 31, 2016) (April 1, 2016 to March 31, 2017)
Business line Amount% of total
amount
Rate of
changeAmount
% of total
amount
Rate of
change
% % % %
Fire and allied insurance 407,817 16.0 2.9 373,558 14.6 (8.4)
Marine insurance 85,905 3.4 3.4 79,335 3.1 (7.6)
Personal accident insurance 194,287 7.6 (0.5) 194,152 7.6 (0.1)
Voluntary automobile insurance 1,197,795 46.9 1.7 1,245,666 48.8 4.0
Compulsory automobile liability insurance 307,233 12.0 0.4 295,884 11.6 (3.7)
Others 359,154 14.1 2.8 361,739 14.2 0.7
Total 2,552,193 100.0 1.8 2,550,336 100.0 (0.1)
Note) The above figures represent amounts after offsetting internal transactions among segments.
Net claims paid
(Millions of yen)
Fiscal year ended March 31, 2016 Fiscal year ended March 31, 2017
(April 1, 2015 to March 31, 2016) (April 1, 2016 to March 31, 2017)
Business line Amount% of total
amount
Rate of
changeAmount
% of total
amount
Rate of
change
% % % %
Fire and allied insurance 251,172 17.2 (7.6) 229,211 16.1 (8.7)
Marine insurance 48,401 3.3 3.3 41,321 2.9 (14.6)
Personal accident insurance 105,649 7.2 (9.5) 99,533 7.0 (5.8)
Voluntary automobile insurance 639,232 43.7 (4.8) 644,783 45.2 0.9
Compulsory automobile liability insurance 226,799 15.5 0.2 224,462 15.7 (1.0)
Others 190,410 13.0 (3.8) 188,400 13.2 (1.1)
Total 1,461,666 100.0 (4.5) 1,427,712 100.0 (2.3)
Note) The above figures represent amounts after offsetting internal transactions among segments.
Sompo Holdings, Inc.
28


