consolidated financial results for the fiscal … · consolidated financial results for the fiscal...
TRANSCRIPT

1
CONSOLIDATED FINANCIAL RESULTS FOR THE FISCAL YEAR ENDED MARCH 31, 2014 (J -GAAP)
May 15, 2014
Name of listed company: Toyo Suisan Kaisha, Ltd. Stock exchange listing: Tokyo Securities code: 2875 (URL: http://www.maruchan.co.jp/) Representative: Kazuo Obata, Representative Director and President Contact: Hiroshige Tsubaki, General Manager of Accounting Department Schedule date of general meeting of shareholders: June 27, 2014 Scheduled date of the filing of securities report: June 27, 2014 Scheduled date of start of dividend payments: June 30, 2014 Preparation of results presentation materials: Yes Holding of results briefing meeting: Yes (For analysts)
(Amounts less than one million yen have been omitted.) 1. Consolidated Operating Results (from April 1, 2013 to March 31, 2014) FY2013 ended
Mar. 31, 2013 FY2014 ended Mar. 31, 2014 FY2014 / FY2013
(Millions of yen) (Percentage change) (1) Consolidated Operating Results:
Net sales 344,527 372,231 8.0% Operating income 29,623 30,595 3.3% Ordinary income 31,997 32,243 0.8% Net income 17,280 22,723 31.5% Net income per share (Yen) 169.15 222.46 Fully diluted net income per share (Yen) — — Ratio of net income to shareholders’ equity 9.2% 10.8% Ratio of ordinary income to total assets 12.2% 11.0% Ratio of operating income to net sales 8.6% 8.2%
Note: Total comprehensive income FY2014 ended March 2014: ¥29,726 million (10.8%) FY2013 ended March 2013: ¥26,819 million (59.9%)
Reference: Equity in net income of affiliated companies FY2014 ended March 2014: ¥34 million FY2013 ended March 2013: ¥17 million
As of Mar. 31, 2013 As of Mar.
31, 2014
(Millions of yen) (2) Consolidated Financial Position:
Total assets 274,889 308,787 Net assets 209,172 236,936 Shareholders’ equity ratio 72.3% 72.4% Net assets per share (Yen) 1,944.91 2,188.89
Reference: Shareholders’ equity As of Mar. 31, 2014: ¥223,564 million As of Mar. 31, 2013: ¥198,684 million
FY2013 ended Mar. 31, 2013 FY2014 ended
Mar. 31, 2014
(Millions of yen) (3) Consolidated Cash Flows:
Cash flows from operating activities 33,367 29,377 Cash flows from investment activities (19,958) (28,521) Cash flows from financing activities (4,565) (6,238) Cash and cash equivalents at end of year 51,341 47,420
2. Dividends Full Year Dividends (Yen) (Millions of yen)
Record Date
1st quar ter-
end
2nd quar ter-
end
3rd quar ter-
end
Year-end
For the year
Total dividend payments (Full-year )
Payout ratio (Consolidated)
Dividend on equity
(Consolidated) FY2013 — 20.00 — 30.00 50.00 5,110 29.6% 2.7% FY2014 — 25.00 — 25.00 50.00 5,109 22.5% 2.4% FY2015 (Forecast) — 25.00 — 25.00 50.00 24.9%

2
3. Consolidated Results Forecasts for FY2015 (from April 1, 2014 to March 31, 2015) Half year 1Q-2Q FY2015 /
1Q-2Q FY2014 Full year FY2015 / FY2014
(Millions of yen) (Percentage change) (Millions of yen) (Percentage change) Net sales 187,000 6.1% 388,000 4.2% Operating income 13,500 -2.8% 31,000 1.3% Ordinary income 14,300 -1.6% 32,500 0.8% Net income 9,500 -19.6% 20,500 -9.8% Net income per share (Yen) 93.01 200.71
* Notes (1) Changes in significant subsidiaries during the fiscal year (Changes in specified subsidiaries during the fiscal year that
accompanied changes in the scope of consolidation): None (2) Changes in accounting policies or estimates and retrospective restatement
1) Changes in accounting policies due to revisions of accounting standards, etc.: Yes 2) Changes in accounting policies other than item 1) above: None 3) Changes in accounting estimates: None 4) Retrospective restatement: None
(3) Number of shares issued (common stock)
(Unit: share) 1) Number of shares issued at end of period
(including treasury stock) Mar. 31, 2014 110,881,044 Mar. 31, 2013 110,881,044
2) Number of shares of treasury stock at end of period Mar. 31, 2014 8,744,689 Mar. 31, 2013 8,724,975
3) Average number of shares at end of period Mar. 31, 2014 102,144,027 Mar. 31, 2013 102,160,602
(Reference) Summary of Non-Consolidated Operating Results 1. Non-Consolidated Operating Results (from Apr il 1, 2013 to March 31, 2014) FY2013 ended
Mar. 31, 2013 FY2014 ended Mar. 31, 2014 FY2014 / FY2013
(Millions of yen) (Percentage change) (1) Non-consolidated Operating Results:
Net sales 231,569 241,704 4.4% Operating income 12,739 12,775 0.3% Ordinary income 23,536 18,490 -21.4% Net income 16,459 13,699 -16.8% Net income per share (Yen) 161.04 134.06 Fully diluted net income per share (Yen) — —
As of Mar.
31, 2013 As of Mar. 31, 2014
(Millions of yen) (2) Non-consolidated Financial Position:
Total assets 197,315 212,867 Net assets 122,435 131,461 Shareholders’ equity ratio 62.1% 61.8% Net assets per share (Yen) 1,197.97 1,286.53
Reference: Shareholders’ equity As of Mar. 31, 2014: ¥131,461 million As of Mar. 31, 2013: ¥122,435 million
* Presentation of implementation status for auditing procedures
The auditing procedure based on the Financial Instruments and Exchange Act does not apply to this document, and the auditing procedure based on the Financial Instruments and Exchange Act had not been completed as of the release of this document.
* Explanation related to the appropriate use of these results forecasts and other items warranting special mention
Statements in this document, including the results forecasts, etc., are based on the information available as of the date of the release of this document and the preconditions that Toyo Suisan Kaisha, Ltd. (the “Company”) deemed to be reasonable; they are not meant to be a commitment by the Company, and a variety of factors in the future may cause actual results to differ materially from these forecasts. Please refer to Section: “1. Analysis of Consolidated Operating Results and Financial Position” on page 4 of the attachments for the preconditions for the results forecasts and exercise caution in the use of these results forecasts.

3
Index of Attachments
1. Analysis of Consolidated Operating Results and Financial Position ········································ 4
(1) Analysis of the consolidated operating results ··········································································· 4
(2) Analysis of financial position ···································································································· 5
(3) Basic policy concerning profit distribution, dividends of this term and next term ······················· 6
(4) Business risks, etc. ···················································································································· 7
2. Situation of the Corporate Group ································································································ 9
3. Managerial Policy······················································································································· 11
(1) Basic corporate management policy·························································································· 11
(2) Managerial indicators as our goals ···························································································· 11
(3) Mid/long-term management strategy of the company, and issues to be attended························· 11
4. Consolidated Financial Statements···························································································· 12
(1) Consolidated balance sheets······································································································ 12
(2) Consolidated statements of income and comprehensive income················································· 14
Consolidated statements of income··························································································· 14
Consolidated statements of comprehensive income··································································· 16
(3) Consolidated statements of changes in net assets······································································· 17
(4) Consolidated statements of cash flows ······················································································ 19
Segment information, etc.········································································································· 21

4
1. Analysis of Consolidated Operating Results and Financial Position (1) Analysis of the consolidated operating results (Operating Results for the Current Term)
During the consolidated fiscal year ended March 31, 2014, economic conditions in Japan have gradually recovered as a result of the correction of the strong yen and the effects of various policies. However, there still remained downside risks, such as the slowdown of overseas economies and a slump in demand following the last-minute demand ahead of the rise of the consumption tax rate.
Under these circumstances, the Toyo Suisan Group has remained committed to its mission “to contribute to society through foods” and “to provide safe and secure foods and services to customers” under the corporate slogan of “Smiles for All.” The Group continued to implement cost reductions and promoted aggressive sales activities in its efforts to face an increasingly competitive sales environment.
As a result, net sales were ¥372,231 million (+8.0% year on year), operating income was ¥30,595 million (+3.3% year on year), ordinary income was ¥32,243 million (+0.8% year on year), and net income was ¥22,723 million (+31.5% year on year) for the term under review.
The operating results by segment are as follows.
(Seafood Segment)
In the Seafood Segment, sales conditions continued to be severe due to the rise in the cost of ingredients owing to the weak yen and poor fish hauls of major marine products, as well as poor hauls of low-priced fish such as salmon/trout, squid, mackerel, and saury, despite relatively robust performances of high-priced fish such as tuna and lobster. Under such conditions, we focused on new development and aggressive sales to mass merchandisers and convenience stores, among others, of value-added products mainly using our signature products such as salmon/trout, roe, and tuna. This resulted in segment sales of ¥33,455 million (+3.4% year on year). However, the segment loss was ¥160 million (a segment profit of ¥49 million in the previous fiscal year), due to the failure to pass on the increased cost of ingredients such as salmon/trout, shrimp, and southern hemisphere fish in to product prices, as well the failure to cover the rise in depreciation following sluggish performances in foreshore operations.
(Overseas Instant Noodles Segment) In the Overseas Instant Noodles Segment, segment sales were ¥75,422 million (+6.8% year on year). This
was the result of continued strengthening of partnerships with major mass merchandisers; firmer sales in terms of volume, especially in Central and South America through aggressive sales activities for major products and the new product categories of yakisoba noodles and bowl noodles, and the impact of the weaker yen compared with the previous fiscal year. Segment profit was ¥13,127 million (-0.3% year on year) due to an increase in sales promotion expenses as a result of factors such as entering new categories, despite the effect of the weaker yen. Maruchan Texas, Inc. commenced operations in March.
(Domestic Instant Noodles Segment) In the Domestic Instant Noodles Segment, sales of cup noodles were robust as a result of aggressive sales
activities for the Japanese style noodle series such as Akai Kitsune Udon and Midori no Tanuki Tempura Soba, our core products. Sales of Menzukuri non-fried cup noodles showed strong growth due to a renewal of the product and campaigns aimed at consumers. Total sales of cup noodle products remained strong owing to an aggressive launch of new products such as yakisoba noodles and wontons, as well as the stimulation of new demand through Otona no Kodawari and Hanauta, among others, which target the elderly and women. Total sales of bag noodles continued to be robust due to the launch of Maruchan Seimen Udon and Maruchan Seimen Curry Udon, as well as the carrying out of promotional activities, among others. As a result, segment sales were ¥124,780 million (+6.7% year on year) and segment profit was ¥12,142 million (+1.0% year on year).
(Frozen and Refrigerated Foods Segment) In the Frozen and Refrigerated Foods Segment, among fresh noodles, we made efforts to expand sales of the
three-meal package of Maruchan Yakisoba, a core product, by reviewing the manufacturing process, changing the package design and reinforcing campaigns. In addition, the launch of seasonal items incorporating seasonal flavors such as the three-meal packages of Ebi Shioaji Yakisoba and Fuyu no Cream Spaghetti contributed to robust sales of fresh noodles. Furthermore, total sales of fresh noodles exceeded last year’s level due to continued growth of the Renji demo Oishii series, a Japanese style noodle product for microwave cookers. Among frozen foods, sales of commercial frozen noodles, a core product, were robust due to the expanding numbers of new customers in lunch services at offices, and food service industries and deli channels. As a

5
result, segment sales were ¥63,950 million (+3.0% year on year). Segment profit was ¥3,344 million (-6.2% year on year) due to exchange rate fluctuations and the impact of the sharp rise in cost of ingredients.
(Processed Foods Segment) In the Processed Foods Segment, sales of rice products increased on the back of expanded sales of existing
items. Sales of freeze-dried products were strong mainly in the five-meal packages of core products. Sales volumes of Japanese fish loaf and sausage increased but sales dropped due to a reduction in wholesale prices. Sales of seasonings and dried bonito flakes dropped owing in part to a sluggish market. As a result, segment sales were ¥18,455 million (+4.0% year on year) and segment profit was ¥206 million (a segment loss of ¥85 million in the previous fiscal year).
(Cold-Storage Segment) In the Cold-Storage Segment, sales were ¥15,259 million (+2.3% year on year) as a result of robust volumes
of frozen foods in particular, although the storage volume of imported ingredients was low due to various effects, including the weaker yen. Despite the burden of higher power costs caused by a rise in electricity prices, segment profit was ¥1,224 million (+6.8% year on year) as we carried out a review of storage fees as well as energy-saving efforts.
(Other Business Segment) The Other Business Segment consists of mainly the packed lunch/deli food business. Segment sales were
¥40,934 million (+37.7% year on year), while segment profit was ¥1,303 million (-4.6% year on year).
(Prospects of the Next Term) Regarding the prospects for the next term (Fiscal Year Ending March 2015), the economy faces downside
risks such as a slump in demand following the last-minute demand ahead of the rise in the consumption tax rate and a slowdown of overseas economies, despite a gradual recovery and expectations of this trend continuing.
In the food industry, although the tendency toward recovery in personal consumption can be foreseen, the consumer consciousness in terms of protecting livelihood and preferences for low-priced products continues, and market situations are still tough. Moreover, the demand for social responsibility on the part of companies, such as food safety and assurance, is ever increasing. The Group is further implementing vigorous business activities that strengthen sales promotions by region and product, and we aim at achieving the same degree of ordinary income as the previous term. In addition, even on the cost side, in order to address more severe competition in sales, the Company will concentrate on thorough cost reductions by restructuring the distribution system and the manufacturing division.
From the above, therefore, it is expected that the net sales for the full fiscal year will be ¥388,000 million, the operating income will be ¥31,000 million, the ordinary income will be ¥32,500 million, and the net income of the term will be ¥20,500 million. The Japanese yen to U.S. dollar currency exchange rate is forecasted to be ¥102.00.
(2) Analysis of financial position
(Analysis of the situation of assets, liabilities, net assets, and cash flow) i. The situation of assets, liabilities, and net assets
The total assets of the Group are ¥308,787 million (+12.3% year on year), an increase of ¥33,897 million compared with the previous consolidated fiscal year. The situation of assets, liabilities, net assets in the current consolidated fiscal year is as follows. (Current assets)
Current assets are ¥164,904 million (+10.4% year on year), an increase of ¥15,543 million compared with the previous consolidated fiscal year. The main contributing factor is the increase in cash on hand and at banks, notes and accounts receivable-trade, and securities.
(Fixed assets) Fixed assets are ¥143,882 million (+14.6% year on year), an increase of ¥18,354 million compared with the previous consolidated fiscal year. The main contributing factor is the increase in buildings and structures, land, and leased assets.
(Current liabilities) Current liabilities are ¥50,669 million (+7.4% year on year), an increase of ¥3,502 million compared with the previous consolidated fiscal year. The main contributing factor is the increase in notes and accounts payable-trade and accrued expenses.
(Long-term liabilities) Long-term liabilities are ¥21,181 million (+14.2% year on year), an increase of ¥2,630 million compared
6
with the previous consolidated fiscal year. The main contributing factor is the increase in lease obligations and deferred income tax liabilities, despite a decrease in net defined benefit liability (in the previous consolidated fiscal year these were slated as reserves for retirement benefits for employees).
(Net assets) Net assets are ¥236,936 million (+13.3% year on year), an increase of ¥27,764 million compared with the previous consolidated fiscal year. The main contributing factors are the increase in retained earnings and foreign currency translation adjustment.
ii. The situation of the cash flows
The balance of cash and cash equivalents (hereafter, referred to as the Capital) is ¥47,420 million, a decrease of ¥3,920 million compared with the previous consolidated fiscal year. The situations of each type of cash flow in the current consolidated fiscal year are as follows. (Cash flow from operating activities)
The Capital obtained as a result of business operating activities is ¥29,377 million, a decrease of ¥3,990 million compared with the previous consolidated fiscal year. The main contributing factors are the decrease in net defined benefit liability and the increase in notes and accounts receivable-trade and inventories, despite an increase in income before income taxes and minority interests.
(Cash flows from investing activities) The Capital used as a result of investment activities is ¥28,521 million, an increase of ¥8,563 million compared with the previous consolidated fiscal year. The main contributing factors are the increase in payments for the acquisitions of securities and property, plant, and equipment, despite the increase in proceeds from maturities of time deposits.
(Cash flows from financing activities) The Capital used as a result of financial activities is ¥6,238 million, an increase of ¥1,672 million compared with the previous consolidated fiscal year. The main contributing factor is the increase in payment of dividends.
(Reference) Variation of cash flow Indicators
Fiscal year ended March, 2013 Fiscal year ended March, 2014 Capital Adequacy Ratio (%) 72.3 72.4 Capital Adequacy Ratio based on current market value (%) 107.3 113.9
Cash Flow/Interest-Bearing Debt Ratio (annual) 0.0 0.0
Interest Coverage Ratio (times) 6,421.7 7,085.7 (Notes) 1. The calculating formula of each index is as follows.
Capital adequacy ratio: Equity capital/Total assets Capital adequacy ratio based on current market value: Total market capitalization (Year-end closing stock price × Number of year-end outstanding shares issued)/Total assets Cash flow/Interest bearing debt ratio: Interest bearing debt (corporate bonds, short term loans or long term debt)/Cash flow Interest coverage ratio: Cash flow/Interest payment (interest expenses)
2. Each indicator is calculated by the financial numerical values on a consolidated basis. 3. Total market capitalization is calculated by the Year-end closing stock price × Number of shares issued at
end of term (after deducting the treasury stock). 4. Cash flow uses the “Cash flow from operating activities” of the consolidated cash flow statement. 5. Interest bearing debt includes all liabilities that pay the interest of liabilities as recorded on the
consolidated balance sheet. Moreover, the interest payment uses the “Interest expenses paid” of the consolidated cash flow statement.
(3) Basic policy concerning profit distribution, dividends of this term and next term
Besides aiming at improving the earnings, strengthening the management foundation, and increasing the corporate value, our company recognizes the enhancement of the profit return to investors as one of the important matters with the management. Concerning the dividends to our investors, our basic policy is to distribute a stable dividend, which reflects our business performance in the term.

7
Under this policy, the end of the term dividend at the current term is planned to be a distribution of an ordinary dividend of 25 yen per share. The next dividends are planned to be 25 yen at midterm and 25 yen at the end of term. We are aiming at continuously maintaining a steady dividend, and securing a stable profit for the long term going forward. Furthermore, the execution of the quarterly dividend will be examined in the future.
In responding to factors such as rapid technological advancements and changes in customer needs, we will use retained earnings to enhance the business structure, technology and product development and so on, and aim to improve corporate value.
(4) Business risks, etc.
The risks and the variation factors that may influence the management performance, financial health, and the like of the Group, and other important matters for consideration are as follows:
i. Economic situation The Group specializes in the food manufacturing sales business that centers on processed food. The
occurrence of various food-related problems such as murrain and pesticide residue, therefore, could decrease the import volume, raise the purchasing price, and depress personal consumption. Net sales and the like may then suffer due to those influences. In order to allay consumer fears over product safety, the Group has obtained the ISO certification and vigorously promoted the construction of a product information management system, and we aim at further strengthening the system of management, such as for raw materials. However, there is the potential for influence of various natural or artificial problems.
Moreover, the situation of sales competition in the entire food industry is more severe than ever, due to continuous fluctuation of product unit prices. In order to respond to such severe competition in sales, the Group strives to progress with the restructuring of the system of production and distribution, and we seek further cost reduction and vigorous business operations. However, the depressed consumer sentiment—induced by the continued deflationary economy and the stagnation of incremental income and the like—may have an impact on consumer buying behavior.
ii. Fluctuation of exchange rates The Group holds consolidated subsidiary companies in North America, and Maruchan, Inc. is an especially
important consolidated subsidiary company which secures more than 10% of the consolidated net sales. Moreover, in the Seafood Segment, we have overseas consolidated subsidiary companies and dealings in both imports and exports.
As such, in order to hedge the risk of exchange rate fluctuation in import and export transactions, we incorporate forward exchange contracts and the like, so that the influence of the exchange fluctuations is kept to the minimum. Nevertheless, when the exchange rate changes rapidly beyond our forecast, the performance and the financial health of the Group may be affected.
Also, in order to make the consolidated financial statements, the Group converts into yen currency according to the spot exchange rate as of accounting date. The change to the exchange rate assumed at the beginning of the term, therefore, influences the performance and the financial health of the Group.
iii. Market circumstances The Group has been centering our business in areas such as the Domestic Instant Noodles Segment, where
hundreds of kinds of new products are sold annually in the entire industry, particularly in the area of instant noodles. As the product life cycle is very short, the Group focuses on product development that caters to consumer needs and the increasing awareness of health among consumers as well.
If the Group cannot adequately predict the change in the industry and the consumer needs, or if we fail to develop attractive new products accepted by the consumer, our future growth and profits may suffer decline.
iv. Sales price In areas such as the Domestic Instant Noodles Segment of the Group, a change in the final retail price may
affect the wholesale price of the Group. Moreover, the severity of the competition in sales in securing market share in each field is intensifying. The sales promotion expenses for discount rebates, bargain sale expenses, and the like increase, and these all are factors that suppress earnings. If the market share changes greatly because of some tie-ups among the existing competitors, the earnings of the Group may be affected.
As for the Seafood Segment business of the Group, the market prices change as a result of factors such as the haul of fish, and this, in turn, influences the sales price. As a result, the earnings of the Group may be affected. Finally, some raw materials in our domestic instant noodle business (rice, wheat flour, etc.) are also similarly susceptible to the influence of market price changes due to poor harvests. This influences the cost of manufacturing, and the earnings of the Group may be affected.

8
v. Product accident The Group work enthusiastically to achieve safe food processing with obtainment of ISO certifications,
creation of a product information management system, traceability management, and the like. Nevertheless, there may be various product accidents such as spoiled raw materials, the presence of agricultural chemicals, contamination by foreign matter during the manufacturing process, allergen problems, and the generating of mold due to the rupturing of packaging at the distribution level. The Group is enhancing the equipment to prevent these product accidents before they occur, of course, and we aim to enhance the system of management. But there is still some potential for product accidents to occur. As such, we carry product liability compensation insurance, and the like.
In extreme cases when a large-scale product accident causing product liability compensation occurs by chance, significant costs such as for recalls and the like may be incurred, and the image of the Group may be gravely affected. In that case, net sales would suffer, and the performance as well as the financial health of the Group would be affected.
vi. Contract manufacturing of products overseas Part of the products in our Seafood Segment, and our Frozen and Refrigerated Foods Segment of the
Group is manufactured in companies consigned overseas, and then imported. In those cases, these consigned manufacturing companies may have different legal standards concerning food hygiene and the like, in their respective countries. From a different consideration in terms of food hygiene, they may not be up to the corresponding legal standards in Japan. Also, product accidents may occur due to the use of drugs such as agricultural chemicals that do not conform to the Japanese legal standards on food hygiene. Also, to prevent such accidents, the Group attempts to provide and reinforce the education standards in Japan, thorough guidance, supervision on the spot, product inspections, etc.
If a product that didn’t meet the legal standards of Japan concerning food hygiene and the like were produced, significant costs such as for recalls and product disposal would occur, and the image of the Group would be gravely affected. In that case, net sales would suffer; the performance and the financial health of the Group would be affected.
vii. Influence of weather and natural disasters The net sales of some products sold by the Group are susceptible to the influence of the weather, such as
intense heat or cold summers. Moreover, some production facilities in the manufacturing locations may be susceptible to natural disasters such as large-scale earthquakes and typhoons. The use of infrastructure there such as decreased power supply during a disaster may be affected or limited. A decrease in net sales would accompany the decreased manufacturing capacity because of the resulting interrupted operations. The increase in the costs of restoring equipment and the like would also affect the performance and the financial health of the Group.
viii. Information system The Group has been incorporating an appropriate structure of system management. We are advancing with
thorough computer anti-virus and information management. Nevertheless, there is still some chance that trouble may occur in the information system, due to the invasion of an unexpected virus, unlawful computer access to the information system, trouble in operations, and the like. These cases would interfere with our customer correspondence, generate some costs accordingly, and affect the performance and the financial health of the Group.
ix. Public regulations In each business activity, the Group has to comply with all the related regulatory controls and restrictions
such as food hygiene, food standards, trade, monopoly prohibition, patents, consumers, taxes, the environment, and recycling. If we cannot observe these restrictions by contingency, our business activity would be restricted, and the performance of the Group would then be affected.

9
2. Situation of the Corporate Group The Toyo Suisan Group (our Company and affiliated companies) consists of our Company, 22 consolidated
subsidiary companies, 1 related company under the equity method definition, 5 non-consolidated subsidiary companies, and 3 connected companies.
Shimaya Co., Ltd., which was a connected company during the previous consolidated year, has been included in the scope of consolidation through additional acquisition of its shares during the current consolidated fiscal year.
The organization of the main activities managed in the Group and the position of each affiliated company related to each business are as follows: (1) Seafood Segment
This segment procures, processes, and sells Seafood in Japan and abroad. In Japan, our Company and 7 consolidated subsidiary companies (Shinto Corporation, etc.), 1 non-
consolidated subsidiary company (Yaizu Shinto Co., Ltd.), and 2 connected companies (Shimodatousui Corp., etc.) are engaged in procurement, processing, and sales in Japan.
Overseas, 1 consolidated subsidiary company in the United States (Pac-Maru, Inc.) procures and sells, while 2 non-consolidated subsidiary companies in China (Hainan Dongyang Shuichan Co., Ltd., etc.) procure, process, and sell.
(2) Overseas Instant Noodles Segment
This segment mainly manufactures and sells instant noodles (cup-style and bag noodles) in North America, mainly the United States and Mexico.
1 consolidated subsidiary company (Maruchan, Inc.) manufactures and sells, while 2 consolidated subsidiary companies (Maruchan Virginia, Inc., etc.) manufacturers and 2 consolidated subsidiary companies (Maruchan de Mexico, S.A. de C.V., etc.) sell.
(3) Domestic Instant Noodles Segment
This segment manufactures and sells instant noodles (cup-style and bag noodles, wontons) in Japan. The Company manufactures and sells, while 6 domestic consolidated subsidiary companies (Shuetsu Co.,
Ltd., etc.) manufacture. (4) Frozen and Refrigerated Foods Segment
This segment manufactures and sells frozen and refrigerated foods (steamed yakisoba, fresh ramen noodles, boiled udon noodles, frozen noodles, foodstuff for restaurant business) in Japan.
The Company and 1 consolidated subsidiary company (Yutaka Foods Corporation) manufacture and sell, while 1 consolidated subsidiary company (Kofu Toyo Co., Ltd.) manufactures and 1 connected company (Shimodatousui Corp.) sells.
(5) Processed Foods Segment
This segment mainly manufactures and sells processed food (aseptically packaged cooked rice, retort rice, soups, instant bouillon/dried bonito flakes, paste foods, etc.) in Japan.
In Japan, the Company, 2 consolidated subsidiary companies (Yutaka Foods Corporation, etc.), 1 related company under the equity method definition (Semba Tohka Industries Co., Ltd.), and 2 connected company (Shimodatousui Corp., etc.) manufacture and sell, while 2 consolidated subsidiary companies (Fukushima Foods Co., Ltd.) manufacture.
Overseas, 1 non-consolidated subsidiary company in China (Qingdao Foods Corp.) manufactures and sells. (6) Cold-Storage Segment
In this segment, the Company and 6 consolidated subsidiary companies (Saihoku Toyo Kaisha, Ltd., etc.) are engaged in storage and freezing of commodities entrusted mainly by customers in Japan.
(7) Other Business Segment
This segment is mainly engaged in the packed lunch/deli food business. This segment consists of the Company, 6 consolidated subsidiary companies (Fresh Diner Corporation, etc.),
1 non-consolidated subsidiary company (Towa Estate Co., Ltd.) and 1 connected company (Irago Institute Co., Ltd.).

10
[Organizational chart] The organization of the above-mentioned corporate group is shown in the figure as follows.
(Notes) 1. Seafood products are purchased or sold between group companies.
2. Warehouses belonging to the Cold-Storage Segment manage the commodities including seafood products of group companies.
3. Yutaka Foods Corporation, a consolidated subsidiary company, is listed on the second section of the markets on the Tokyo Stock Exchange and the Nagoya Stock Exchange.
4. Semba Tohka Industries Co. Ltd. under the equity method definition is listed on JASDAQ (standard) of the Tokyo Stock Exchange.
5. Maruchan Texas, Inc., a consolidated subsidiary, commenced manufacturing in March 2014.
(Domestic) Domestic customers
Sales Sales Sales Sales Sales Sales Sales Entrustment of warehousing
Sales, etc.
Sales, etc.
Toyo Suisan Kaisha, Ltd. (the Company) Seafood Segment Domestic Instant
Noodles Segment Frozen and Refrigerated
Foods Segment Processed Foods Segment Cold-Storage Segment Other Business Segment
Import Procurement
Procurement Sales Procurement Procurement Procurement Entrustment of
warehousing
Hachinohe Toyo Co., Ltd. Miyagi Toyo Kaisha, Ltd. Shinto Corporation Yutaka Foods Corporation Choshi Toyo Kaisha, Ltd. Yaizu Shinto Co., Ltd. Shimodatousui Corp.
Tokyo Commercial Co., Ltd. Higashimaru International Corporation
Imari Toyo Co., Ltd.
Hachinohe Toyo Co., Ltd. Kofu Toyo Co., Ltd. Fukushima Foods Co., Ltd. Shuetsu Co., Ltd. Imari Toyo Co., Ltd. Yutaka Foods Corporation
Yutaka Foods Corporation Shimodatousui Corp. Kofu Toyo Co., Ltd.
Fukushima Foods Co., Ltd. Imari Toyo Co., Ltd.
Hachinohe Toyo Co., Ltd. Yutaka Foods Corporation Shimodatousui Corp. Semba Tohka Industries Co., Ltd.* Higashimaru International Corporation
Hachinohe Toyo Co., Ltd. Miyagi Toyo Kaisha, Ltd. Imari Toyo Co., Ltd. Saihoku Toyo Kaisha, Ltd. Shonan Toyo Kaisha, Ltd. Suruga Toyo Kaisha, Ltd.
Shuetsu Co., Ltd. Mitsuwa Daily Co., Ltd. Fukushima Foods Co., Ltd. Fresh Diner Corporation Yutaka Foods Corporation Shimaya Co., Ltd.
(Overseas)
Pac-Maru, Inc. Hainan Dongyang Shuichan Co., Ltd. Zhanjian Dongyang Shuichan, Ltd.
Overseas Instant Noodles Segment Maruchan Virginia, Inc. Maruchan Texas, Inc. Maruchan, Inc. Maruchan de Mexico, S.A. de C.V. Sanmaru de Mexico, S.A. de C.V.
(Processed Foods Segment) Qingdao Foods Corp.
Sales Export Sales
Sales Sales
Overseas Customers
Unmarked: Consolidated subsidiary company *: Related company under the equity method definition : Non-consolidated subsidiary company : Connected company
Towa Estate Co., Ltd. Irago Institute Co., Ltd.
Procurement
11
3. Managerial Policy (1) Basic corporate management policy
Under the principle of customer first, we pursue our corporate philosophy of “contributing to the joyful and satisfying lives of our customers by offering better products and services.” We deliver “safe, delicious products” and “guaranteed services” to our customers. With the support of our customers, we aim at being a trusted corporate group. As such, we target growth with profits and raised corporate value, which are recognized to be positively linked to the benefits of all stakeholders, such as society, stockholders, and employees.
(2) Managerial indicators as our goals
In order to establish a solid financial foundation, the Group regards the increase of consolidated ordinary income as the top priority. We thoroughly emphasize and value enhanced productivity and cost reduction by business reform, development of high-value-added products, and cash flow management.
(3) Mid/long-term management strategy of the company, and issues to be attended
As for future prospects, the economy faces downside risks such as a slowdown of overseas economies, despite a gradual recovery and expectations of this trend continuing. Under such circumstances, the Group aims at securing earnings going forward and improving managerial efficiency. We will work resolutely on the following issues:
i. Securing of a competitive edge in products In order to propose better products corresponding to the changes in customer needs, we will focus on
vigorous research and development, and guarantee the safety of products. ii. Securing of sales
In each business field, we cater to customer needs, and strengthen sales promotions according to the region and the product. We vigorously pursue our business activities.
iii. Reductions in costs We will continue unification and reorganization of the production bases. Besides reconstructing an
efficient production and distribution system, we aim at reducing costs by thorough improvements in various business operations.
iv. Strengthening of the financial structure By reducing interest bearing debt, working on careful selection of investments and loans as well as
reduction of inventory, we aim at strengthening the financial structure. v. Facilitating accelerated and efficient management
By advancing information sharing in the entire group, we aim at accelerating managerial judgment and improving managerial efficiency.
vi. Valuing of employee education From the viewpoint that the success of a company depends on human resources, we value our employee
education, aim to clarify authority and responsibility, and cultivate talented people who can endure structural change.
vii. Establishment of corporate ethics We aim to further enhance the activities of the Board of Directors for the achievement of transparency in
management, and to pursue compliance, as we strive to establish corporate ethics.

12
4. Consolidated Financial Statements (1) Consolidated balance sheets
(Millions of yen)
As of end FY2013 (March 31, 2013)
As of end FY2014 (March 31, 2014)
Assets Current assets
Cash on hand and at banks 50,496 54,082 Notes and accounts receivable-trade 45,948 48,989 Securities 27,501 34,200 Merchandise and finished goods 15,355 17,121 Work in process 223 286 Raw materials and supplies 4,596 5,679 Deferred income tax assets 1,737 1,822 Other 4,010 3,225 Less: Allowance for doubtful accounts (507) (501)
Total current assets 149,361 164,904
Fixed assets Property, plant and equipment
Buildings and structures 112,564 126,840 Accumulated depreciation and accumulated impairment losses
(68,839) (74,324)
Buildings and structures, net 43,724 52,516 Machinery, equipment and vehicles 90,391 100,727
Accumulated depreciation and accumulated impairment losses
(65,902) (74,165)
Machinery, equipment and vehicles, net 24,489 26,561
Land 28,995 32,090 Leased assets 654 4,641
Accumulated depreciation and accumulated impairment losses
(343) (657)
Leased assets, net 311 3,983
Construction in progress 3,633 2,989 Other 4,634 5,280
Accumulated depreciation and accumulated impairment losses
(3,525) (4,242)
Other, net 1,108 1,037
Total property, plant and equipment 102,262 119,179
Intangible assets Software 1,839 1,912 Other 510 495
Total intangible assets 2,349 2,408 Investments and other assets
Investments in securities 18,385 20,114 Deferred income tax assets 1,818 1,352 Net defined benefit asset — 82 Other 711 744
Total investments and other assets 20,915 22,293 Total fixed assets 125,527 143,882
Total assets 274,889 308,787

13
(Millions of yen)
As of end FY2013 (March 31, 2013)
As of end FY2014 (March 31, 2014)
Liabilities
Current liabilities Notes and accounts payable-trade 21,711 24,331
Short-term loans 212 201 Current portion of long-term debt — 85
Lease obligations 118 237 Accrued expenses 17,705 19,378
Income taxes payable 4,108 2,875 Deferred income tax liabilities 3 5
Allowance for bonus to officers 198 175 Allowance for fixed assets removal costs 171 —
Other 2,936 3,380
Total current liabilities 47,167 50,669
Long-term liabilities Long-term loans — 30
Lease obligations 208 3,916 Deferred income tax liabilities 1,177 3,652
Reserve for retirement benefits for employees 16,232 — Reserve for officer retirement benefits for officers 140 271
Net defined benefit liability — 12,649 Negative goodwill 225 75
Asset retirement obligations 309 315 Other 257 270
Total long-term liabilities 18,550 21,181
Total liabilities 65,717 71,851
Net assets
Shareholders’ equity Common stock 18,969 18,969
Capital surplus 22,516 22,516 Retained earnings 171,246 189,404
Treasury stock at cost (8,145) (8,207)
Total shareholders’ equity 204,586 222,683
Accumulated other comprehensive income Net unrealized gain (loss) on investments in securities, net of taxes
2,185 3,281
Net unrealized gains (losses) on hedging derivatives, net of taxes
32 11
Adjustment on foreign currency translation (8,120) (2,800)
Remeasurements of defined benefit plans — 390
Total accumulated other comprehensive income (5,902) 881
Minority interests in consolidated subsidiaries 10,487 13,371
Total net assets 209,172 236,936
Total liabilities and net assets 274,889 308,787

14
(2) Consolidated statements of income and comprehensive income (Consolidated statements of income)
(Millions of yen)
FY2013
(from April 1, 2012 to March 31, 2013)
FY2014
(from April 1, 2013 to March 31, 2014)
Net sales 344,527 372,231
Cost of sales 214,908 230,221
Gross profit 129,619 142,010
Selling, general and administrative expenses Transportation and warehousing expenses 22,276 24,178
Advertising expenses 4,142 4,457 Promotion expenses 54,693 62,398
Salaries 5,473 6,062 Bonuses 2,163 2,235
Retirement benefit expenses 1,269 1,133 Provision of allowance for bonus to officers 198 173
Provision of reserve for retirement benefits for officers 38 52 Depreciation and amortization 683 792
Research and development expenses 1,199 1,082 Other 7,857 8,847
Total selling, general and administrative expenses 99,995 111,414
Operating income 29,623 30,595
Non-operating income
Interest income 285 267 Dividends income 367 334
Equity in gain under the equity method 17 34 Exchange gain 771 131
Amortization of negative goodwill 150 150 Rent income 411 411
Miscellaneous income 642 626
Total non-operating income 2,646 1,956
Non-operating expenses Interest expenses 5 4
Cost of rent income 94 102 Compensation expenses 14 86
Miscellaneous loss 158 115
Total non-operating expenses 271 308
Ordinary income 31,997 32,243

15
(Millions of yen)
FY2013
(from April 1, 2012 to March 31, 2013)
FY2014
(from April 1, 2013 to March 31, 2014)
Extraordinary income
Gain on sales of fixed assets 15 1,919 Subsidy received 70 1,699
Gain on negative goodwill — 641 Compensation income 42 —
Other 4 123
Total extraordinary income 133 4,383
Extraordinary loss Loss on sales or disposal of fixed assets, net 758 124
Write-down of investment in securities 514 10 Impairment losses on fixed assets 1,705 177
Provision of allowance for fixed assets removal costs 171 — Other 42 10
Total extraordinary losses 3,193 323
Income before income taxes and minority interests 28,937 36,304
Income taxes-current 12,204 10,781
Income taxes-deferred (1,033) 2,242
Total income taxes 11,171 13,024
Income before minority interests 17,766 23,279
Minority interests in subsidiaries 486 556
Net income 17,280 22,723

16
(Consolidated statements of comprehensive income) (Millions of yen)
FY2013
(from April 1, 2012 to March 31, 2013)
FY2014
(from April 1, 2013 to March 31, 2014)
Income before minority interests 17,766 23,279
Other comprehensive income Net unrealized gain (loss) on investments in securities, net of taxes
1,886 1,116
Net unrealized gain (loss) on hedging derivatives, net of taxes (226) (21)
Adjustment on foreign currency translation 7,357 5,319 Share of other comprehensive income of associates accounted for using equity method
35 30
Total other comprehensive income 9,053 6,446
Comprehensive income 26,819 29,726
Comprehensive income attributable to
Comprehensive income attributable to owners of the parent 26,274 29,117 Comprehensive income attributable to minority interests 545 608
17
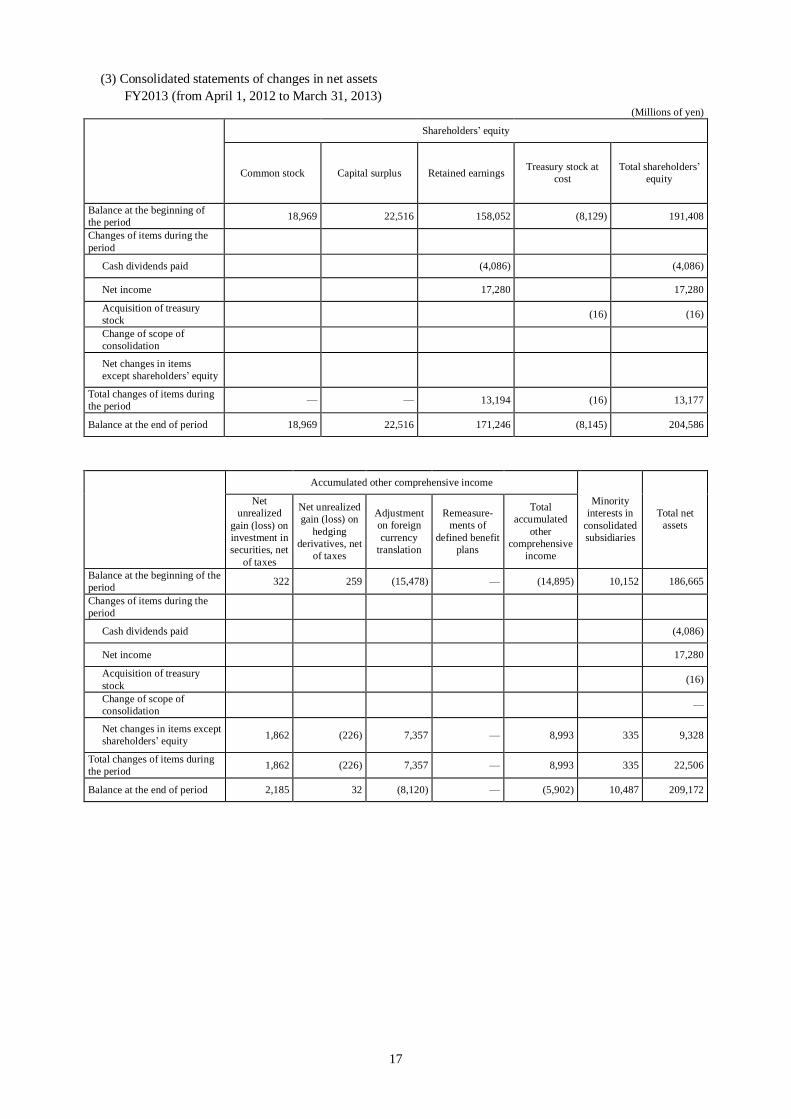
(3) Consolidated statements of changes in net assets FY2013 (from April 1, 2012 to March 31, 2013)
(Millions of yen)
Shareholders’ equity
Common stock Capital surplus Retained earnings Treasury stock at cost
Total shareholders’ equity
Balance at the beginning of the period 18,969 22,516 158,052 (8,129) 191,408
Changes of items during the period
Cash dividends paid (4,086) (4,086)
Net income 17,280 17,280
Acquisition of treasury stock (16) (16)
Change of scope of consolidation
Net changes in items except shareholders’ equity
Total changes of items during the period — — 13,194 (16) 13,177
Balance at the end of period 18,969 22,516 171,246 (8,145) 204,586
Accumulated other comprehensive income
Net unrealized
gain (loss) on investment in securities, net
of taxes
Net unrealized gain (loss) on
hedging derivatives, net
of taxes
Adjustment on foreign currency
translation
Remeasure-ments of
defined benefit plans
Total accumulated
other comprehensive
income
Minority interests in
consolidated subsidiaries
Total net assets
Balance at the beginning of the period 322 259 (15,478) — (14,895) 10,152 186,665
Changes of items during the period
Cash dividends paid (4,086)
Net income 17,280
Acquisition of treasury stock (16)
Change of scope of consolidation —
Net changes in items except shareholders’ equity 1,862 (226) 7,357 — 8,993 335 9,328
Total changes of items during the period 1,862 (226) 7,357 — 8,993 335 22,506
Balance at the end of period 2,185 32 (8,120) — (5,902) 10,487 209,172
18
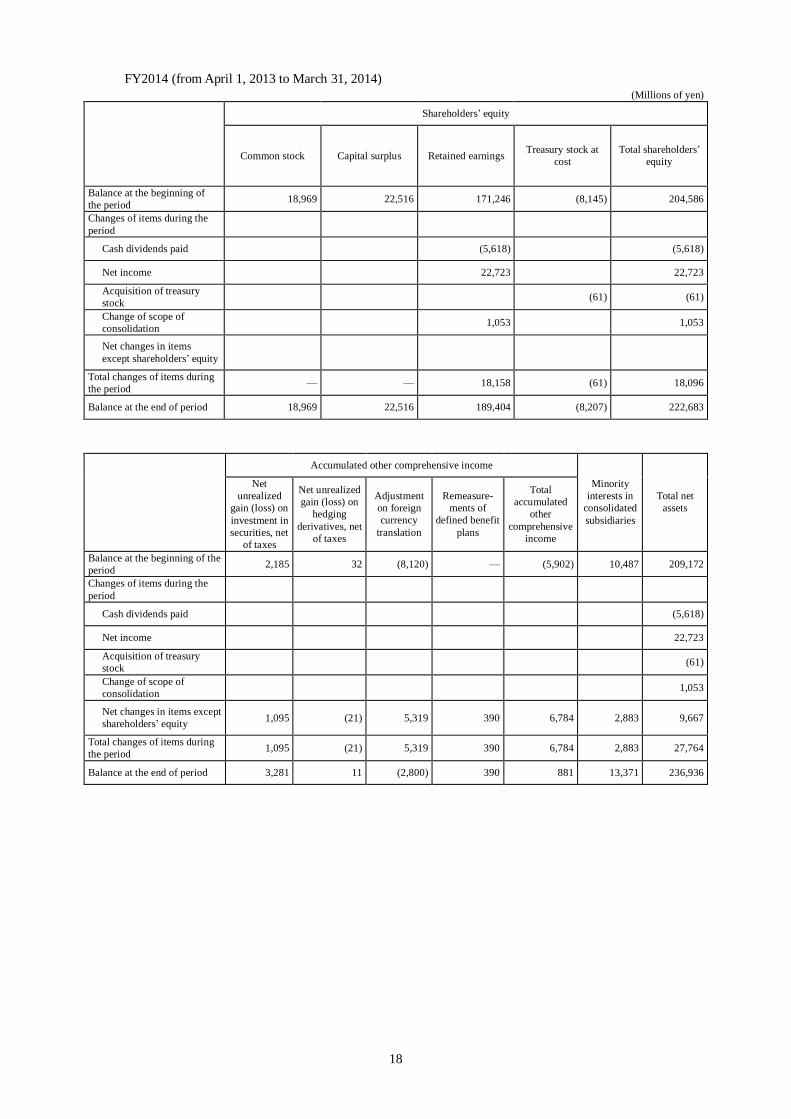
FY2014 (from April 1, 2013 to March 31, 2014) (Millions of yen)
Shareholders’ equity
Common stock Capital surplus Retained earnings Treasury stock at cost
Total shareholders’ equity
Balance at the beginning of the period 18,969 22,516 171,246 (8,145) 204,586
Changes of items during the period
Cash dividends paid (5,618) (5,618)
Net income 22,723 22,723
Acquisition of treasury stock (61) (61)
Change of scope of consolidation 1,053 1,053
Net changes in items except shareholders’ equity
Total changes of items during the period — — 18,158 (61) 18,096
Balance at the end of period 18,969 22,516 189,404 (8,207) 222,683
Accumulated other comprehensive income
Net unrealized
gain (loss) on investment in securities, net
of taxes
Net unrealized gain (loss) on
hedging derivatives, net
of taxes
Adjustment on foreign currency
translation
Remeasure-ments of
defined benefit plans
Total accumulated
other comprehensive
income
Minority interests in
consolidated subsidiaries
Total net assets
Balance at the beginning of the period 2,185 32 (8,120) — (5,902) 10,487 209,172
Changes of items during the period
Cash dividends paid (5,618)
Net income 22,723
Acquisition of treasury stock (61)
Change of scope of consolidation 1,053
Net changes in items except shareholders’ equity 1,095 (21) 5,319 390 6,784 2,883 9,667
Total changes of items during the period 1,095 (21) 5,319 390 6,784 2,883 27,764
Balance at the end of period 3,281 11 (2,800) 390 881 13,371 236,936

19
(4) Consolidated statements of cash flows (Millions of yen)
FY2013
(from April 1, 2012 to March 31, 2013)
FY2014
(from April 1, 2013 to March 31, 2014)
Cash flows from operating activities Income before income taxes and minority interests 28,937 36,304 Depreciation and amortization 10,945 10,615 Impairment losses on fixed assets 1,705 177 Amortization of negative goodwill (150) (150) Gain on negative goodwill — (641) Equity in loss (gain) under the equity method (17) (34) Write-down (up) of investments in securities 514 10 Increase (Decrease) in reserve for retirement benefits for employees
605 —
Increase (Decrease) in reserve for retirement benefits for officers 10 37 Increase (Decrease) in allowance for bonus to officers 42 (23) Increase (Decrease) in allowance for doubtful accounts (4) (22) Increase (Decrease) in net defined benefit liability — (3,106) Interest and dividends income (653) (601) Interest expenses 5 4 Currency exchange loss (gain) (771) (131) Loss (Gain) on sales or disposal of property, plant and equipment, net
914 (1,794)
Decrease (Increase) in notes and accounts receivable-trade 3,108 (556) Decrease (Increase) in inventories 1,085 (1,749) Increase (Decrease) in notes and accounts payable-trade (544) 1,225 Increase (Decrease)in accrued expenses 383 598 Other, net (388) 913
Sub total 45,728 41,076
Interest and dividends income received 660 583 Interest expenses paid (5) (4) Income taxes paid (13,016) (12,278)
Net cash provided by operating activities 33,367 29,377
Cash flows from investing activities Payment for time deposits (22,536) (24,515) Proceeds from maturities of time deposits 19,656 29,698 Purchase of securities — (69,198) Proceeds from sales and redemption of securities — 52,500 Payment for purchase of property, plant and equipment (15,503) (19,891) Proceeds from sales of property, plant and equipment 66 2,648 Payment for purchase of intangible assets (865) (676) Purchase of investments in securities (1,179) (28) Proceeds from sales of investments in securities 37 35 Proceeds from purchase of shares of subsidiaries resulting in change in scope of consolidation
— 810
Payment for loans receivable (2,062) (2,081) Collection of loans receivable 2,276 2,187 Other, net 153 (10)
Net cash used in investing activities (19,958) (28,521)

20
(Millions of yen)
FY2013
(from April 1, 2012 to March 31, 2013)
FY2014
(from April 1, 2013 to March 31, 2014)
Cash flows from financing activities
Proceeds from short-term loans 1,310 929 Repayment of short-term loans (1,430) (940)
Repayment of long-term debt (12) (149) Cash dividends paid (4,086) (5,615)
Cash dividends paid to minority shareholders (209) (221) Other, net (138) (242)
Net cash used in financing activities (4,565) (6,238)
Effect of exchange rate changes on cash and cash equivalents 3,094 1,462
Net increase (decrease) in cash and cash equivalents 11,938 (3,920)
Cash and cash equivalents at beginning of year 39,402 51,341
Cash and cash equivalents at end of year 51,341 47,420
21
(Segment information, etc.) Segment information
1. Summary of reporting segments Reporting segments are classified as those that are part of the Company for which separate financial data can be
obtained and which are subject to regular examination so that the Board of Directors can evaluate earnings and determine how to allocate business resources.
The Toyo Suisan Group has established business headquarters based on the type of products and services, with each business headquarters creating a comprehensive strategy and engaging in business activities relating to the products it handles. The overseas instant noodles business is a unit established independently by overseas subsidiaries. The business unit creates a comprehensive strategy and engages in various business activities relating to the products it handles.
The Toyo Suisan Group thus consists of segments characterized by product and region based on business headquarters and overseas subsidiaries. The Group has six reporting segments, namely, the Seafood Segment, Overseas Instant Noodles Segment, Domestic Instant Noodles Segment, Frozen and Refrigerated Foods Segment, Processed Foods Segment, and Cold-Storage Segment.
The Seafood Segment procures, processes, and sells Seafood. The Overseas Instant Noodles Segment manufactures and sells instant noodles overseas. The Domestic Instant Noodles Segment manufactures and sells instant noodles in Japan. The Frozen and Refrigerated Foods Segment manufactures and sells frozen and chilled foods. The Processed Foods Segment manufactures and sells processed foods (excluding instant noodles, frozen and chilled foods). The Cold-Storage Segment freezes and stores food in cold warehouses. 2. Information relating to calculation of net sales, income, assets and other items by each reporting segment
The accounting method applied to segment accounting is about the same as that stated in the “Significant Matters on the Basis of Preparation of Consolidated Financial Statements.” Income of reporting segments is calculated based on operating income.
Intersegment sales and transfer is calculated based on current market price.

22
3. Information relating to net sales, income, assets and other items by each reporting segment Previous fiscal year (From April 1, 2012 to March 31, 2013)
(Millions of yen)
Reporting segment
Seafood Segment
Overseas Instant
Noodles Segment
Domestic Instant
Noodles Segment
Frozen and Refrigerated
Foods Segment
Processed Foods
Segment
Cold-Storage Segment
Total
Other (Note 1) Total
Adjust-ments
(Note 2)
Amount reported on
consoli-dated
financial statements (Note 3)
Net sales
Net sales to outside customers
32,361 70,650 116,974 62,069 17,746 14,918 314,721 29,726 344,448 79 344,527
Internal net sales or transfer between segments
736 — 19 — 0 923 1,679 563 2,242 (2,242) —
Total 33,098 70,650 116,994 62,069 17,746 15,841 316,401 30,289 346,690 (2,163) 344,527
Segment profit (loss) 49 13,162 12,022 3,567 (85) 1,146 29,862 1,366 31,228 (1,605) 29,623
Segment assets 19,427 60,814 55,196 23,757 10,421 27,350 196,968 12,395 209,364 65,525 274,889
Other items
Depreciation and amortization
248 921 4,251 1,825 584 1,859 9,691 853 10,544 400 10,945
Increases in property, plant and equipment and intangible assets
2,391 4,642 5,677 1,183 760 1,710 16,364 828 17,193 349 17,542
(Notes) 1. The Other Business Segment is one which is not among the reporting segments and refers to a business which is mainly involved in the packed lunch/deli food business and the real estate leasing business.
2. The breakdown of Adjustments is given below: (1) The adjustment of ¥79 million in net sales was reported due to differing elimination methods used
by the reporting segments and the consolidated financial statements. (2) The -¥1,605 million in segment profit adjustments include companywide expenses of -¥940 million
which have not been allocated to each reporting segment, a -¥22 million adjustment to inventories, and other adjustments of -¥642 million. Companywide expenses refer mainly to general administrative expenses which do not belong to any reporting segment. Other adjustments are mainly currency translation adjustments which occur upon calculating eliminations with overseas subsidiaries when reporting earnings.
(3) The adjustment of ¥65,525 million in segment assets includes companywide assets of ¥64,766 million which have not been allocated to each reporting segment and other adjustments of ¥758 million. Companywide assets refer mainly to long-term investment funds (investments in securities) at the parent company and assets in the administrative department. Other adjustments are calculated mainly by the equity method.
(4) The ¥400 million in depreciation and amortization adjustments include companywide expenses of ¥263 million which have not been allocated to each reporting segment, and other adjustments of ¥136 million. Companywide expenses refer mainly to general administrative expenses which do not belong to any reporting segment. Other adjustments are mainly depreciation of idle properties which are accounts for as non-operating expenses.
(5) The ¥349 million in adjustments of increases in property, plant and equipment and intangible assets refer to companywide assets which have not been allocated to each reporting segment.
3. Segment profit is adjusted at the operating income level on the consolidated financial statements.

23
Fiscal year under review (From April 1, 2013 to March 31, 2014)
(Millions of yen)
Reporting segment
Seafood Segment
Overseas Instant
Noodles Segment
Domestic Instant
Noodles Segment
Frozen and Refrigerated
Foods Segment
Processed Foods
Segment
Cold-Storage Segment
Total
Other (Note 1) Total
Adjust-ments
(Note 2)
Amount reported on
consoli-dated
financial statements (Note 3)
Net sales
Net sales to outside customers
33,455 75,422 124,780 63,950 18,455 15,259 331,324 40,934 372,259 (27) 372,231
Internal net sales or transfer between segments
775 — 19 — 0 895 1,690 516 2,206 (2,206) —
Total 34,230 75,422 124,799 63,950 18,455 16,155 333,014 41,451 374,465 (2,234) 372,231
Segment profit (loss) (160) 13,127 12,142 3,344 206 1,224 29,883 1,303 31,186 (591) 30,595
Segment assets 21,090 73,227 54,384 22,494 10,472 31,446 213,117 20,633 233,750 75,036 308,787
Other items
Depreciation and amortization
457 1,032 4,041 1,605 305 1,856 9,298 931 10,229 386 10,615
Increases in property, plant and equipment and intangible assets
590 12,703 1,153 917 488 6,263 22,116 2,220 24,337 284 24,622
(Notes) 1. The Other Business Segment is one which is not among the reporting segments and refers to a business which is mainly involved in the packed lunch/deli food business.
2. The breakdown of Adjustments is given below: (1) The adjustment of -¥27 million in net sales was reported due to differing elimination methods used
by the reporting segments and the consolidated financial statements. (2) The -¥591 million in segment profit adjustments include companywide expenses of -¥839 million
which have not been allocated to each reporting segment, a ¥17 million adjustment to inventories, and other adjustments of ¥230 million. Companywide expenses refer mainly to general administrative expenses which do not belong to any reporting segment. Other adjustments are mainly currency translation adjustments which occur upon calculating eliminations with overseas subsidiaries when reporting earnings.
(3) The adjustment of ¥75,036 million in segment assets includes companywide assets of ¥74,344 million which have not been allocated to each reporting segment and other adjustments of ¥692 million. Companywide assets refer mainly to long-term investment funds (investments in securities) at the parent company and assets in the administrative department. Other adjustments are calculated mainly by the equity method.
(4) The ¥386 million in depreciation and amortization adjustments include companywide expenses of ¥320 million which have not been allocated to each reporting segment, and other adjustments of ¥65 million. Companywide expenses refer mainly to general administrative expenses which do not belong to any reporting segment. Other adjustments are mainly depreciation of idle properties which are accounts for as non-operating expenses.
(5) The ¥284 million in adjustments of increases in property, plant and equipment and intangible assets refer to companywide assets which have not been allocated to each reporting segment.
3. Segment profit is adjusted at the operating income level on the consolidated financial statements.

24
Related information
Previous fiscal year (From April 1, 2012 to March 31, 2013)
1. Information by products or services Information by products or services is omitted because the details are disclosed on “Segment information.”
2. Information by region
(1) Net sales (Millions of yen)
Japan The Americas Other regions Total
273,719 70,650 157 344,527 (Notes) 1. Net sales are calculated by regions or countries where customers have operations. 2. Main country or region that belongs to each category
The Americas - USA, United Mexican States Other regions - People’s Republic of China, Taiwan, Republic of Korea
(2) Property, plant and equipment (Millions of yen)
Japan The Americas Total
89,194 13,067 102,262
3. Information by major customers (Millions of yen)
Customer’s name Net sales Related segments
MITSUI & CO., LTD. 89,493 Domestic Instant Noodles Segment, etc.
Fiscal year under review (From April 1, 2013 to March 31, 2014)
1. Information by products or services Information by products or services is omitted because the details are disclosed on “Segment information.”
2. Information by region
(1) Net sales (Millions of yen)
Japan The Americas Other regions Total
296,335 75,424 471 372,231 (Notes) 1. Net sales are calculated by regions or countries where customers have operations. 2. Main country or region that belongs to each category
The Americas - USA, United Mexican States Other regions - People’s Republic of China, Taiwan, Republic of Korea
(2) Property, plant and equipment (Millions of yen)
Japan The Americas Total
93,669 25,510 119,179
3. Information by major customers (Millions of yen)
Customer’s name Net sales Related segments
MITSUI & CO., LTD. 95,631 Domestic Instant Noodles Segment, etc.

25
Information relating to impairment losses on fixed assets by each reporting segment Previous fiscal year (From April 1, 2012 to March 31, 2013)
(Millions of yen)
Reporting segment
Seafood
Segment
Overseas
Instant
Noodles
Segment
Domestic
Instant
Noodles
Segment
Frozen and
Refrigerated
Foods
Segment
Processed
Foods
Segment
Cold-
Storage
Segment
Other Elimination
or corporate Total
Impairment losses on fixed assets
— — — 69 1,262 374 — — 1,705
Fiscal year under review (From April 1, 2013 to March 31, 2014)
(Millions of yen)
Reporting segment
Seafood
Segment
Overseas
Instant
Noodles
Segment
Domestic
Instant
Noodles
Segment
Frozen and
Refrigerated
Foods
Segment
Processed
Foods
Segment
Cold-
Storage
Segment
Other Elimination
or corporate Total
Impairment losses on fixed assets
— — — 38 138 0 — — 177
Information relating to amortized/unamortized balance of goodwill/negative goodwill by each reporting segment Previous fiscal year (From April 1, 2012 to March 31, 2013) (Negative goodwill)
(Millions of yen)
Reporting segment
Seafood
Segment
Overseas
Instant
Noodles
Segment
Domestic
Instant
Noodles
Segment
Frozen and
Refrigerated
Foods
Segment
Processed
Foods
Segment
Cold-
Storage
Segment
Other
Elimination
or corporate
(Note)
Total
Amortized — — — — — — — 150 150
Balance — — — — — — — 225 225
(Note) The amounts stated in elimination or corporate are companywide expenses, and do not belong to any reporting segment.

26
Fiscal year under review (From April 1, 2013 to March 31, 2014) (Negative goodwill)
(Millions of yen)
Reporting segment
Seafood
Segment
Overseas
Instant
Noodles
Segment
Domestic
Instant
Noodles
Segment
Frozen and
Refrigerated
Foods
Segment
Processed
Foods
Segment
Cold-
Storage
Segment
Other
Elimination
or corporate
(Note)
Total
Amortized — — — — — — — 150 150
Balance — — — — — — — 75 75
(Note) The amounts stated in elimination or corporate are companywide expenses, and do not belong to any reporting segment.
Information relating to gain on negative goodwill by each reporting segment Previous fiscal year (From April 1, 2012 to March 31, 2013)
Not applicable.
Fiscal year under review (From April 1, 2013 to March 31, 2014) Statement omitted due to small quantitative significance.