
Technical Paper No. 370
Subsistence Harvests and Uses of Wild Resources in
Chistochina, Alaska, 2009
By
Malla Kukkonen
and
Garrett Zimpelman
November 2012
Alaska Department of Fish and Game Division of Subsistence
Final Report to the Wrangell-St. Elias National Park and Preserve, National Park Service to fulfill obligations
under agreements H8W0706001 and J8W07090002. This study was funded by the National Park Service and
conducted under a cooperative agreement with the National Park Service through the Pacific Northwest
Cooperative Ecosystems Studies Unit.

Symbols and Abbreviations
The following symbols and abbreviations, and others approved for the Système International d'Unités (SI), are used
without definition in the reports by the Division of Subsistence. All others, including deviations from definitions
listed below, are noted in the text at first mention, as well as in the titles or footnotes of tables, and in figure or figure
captions.
Weights and measures (metric)
centimeter cm
deciliter dL
gram g
hectare ha
kilogram kg
kilometer km
liter L
meter m
milliliter mL
millimeter mm
Weights and measures (English)
cubic feet per second ft3/s
foot ft
gallon gal
inch in
mile mi
nautical mile nmi
ounce oz
pound lb
quart qt
yard yd
Time and temperature
day d
degrees Celsius °C
degrees Fahrenheit °F
degrees kelvin K
hour h
minute min
second s
Physics and chemistry
all atomic symbols
alternating current AC
ampere A
calorie cal
direct current DC
hertz Hz
horsepower hp
hydrogen ion activity (negative log of) pH
parts per million ppm
parts per thousand ppt, ‰
volts V
watts W
General
Alaska Administrative Code AAC
all commonly-accepted
abbreviations e.g.,
Mr., Mrs.,
AM, PM, etc.
all commonly-accepted
professional titles e.g., Dr., Ph.D.,
R.N., etc.
at @
compass directions:
east E
north N
south S
west W
copyright
corporate suffixes:
Company Co.
Corporation Corp.
Incorporated Inc.
Limited Ltd.
District of Columbia D.C.
et alii (and others) et al.
et cetera (and so forth) etc.
exempli gratia (for example) e.g.
Federal Information Code FIC
id est (that is) i.e.
latitude or longitude lat. or long.
monetary symbols (U.S.) $, ¢
months (tables and figures) first three letters (Jan,...,Dec)
registered trademark
trademark
United States (adjective) U.S.
United States of America (noun) USA
U.S.C. United States Code
U.S. state two-letter abbreviations
(e.g., AK, WA)
Measures (fisheries)
fork length FL
mideye-to-fork MEF
mideye-to-tail-fork METF
standard length SL
total length TL
Mathematics, statistics
all standard mathematical signs, symbols and abbreviations
alternate hypothesis HA
base of natural logarithm e
catch per unit effort CPUE
coefficient of variation CV
common test statistics (F, t, 2, etc.)
confidence interval CI
correlation coefficient (multiple) R
correlation coefficient (simple) r
covariance cov
degree (angular ) °
degrees of freedom df
expected value E
greater than >
greater than or equal to
harvest per unit effort HPUE
less than <
less than or equal to
logarithm (natural) ln
logarithm (base 10) log
logarithm (specify base) log2, etc.
minute (angular) '
not significant NS
null hypothesis HO
percent %
probability P
probability of a type I error (rejection of the null hypothesis when true)
probability of a type II error (acceptance of the null hypothesis when false)
second (angular) "
standard deviation SD
standard error SE
variance
population Var
sample var

TECHNICAL PAPER NO. 370
SUBSISTENCE HARVESTS AND USES OF WILD RESOURCES IN
CHISTOCHINA, ALASKA, 2009
by
Malla Kukkonen
Alaska Department of Fish and Game, Division of Subsistence, Anchorage
and
Garrett Zimpelman
Alaska Department of Fish and Game, Division of Subsistence, Anchorage
Alaska Department of Fish and Game
Division of Subsistence
333 Raspberry Road, Anchorage, AK 99518
November 2012
Final Report to the Wrangell-St. Elias National Park and Preserve, National Park Service to fulfill obligations
under agreements H8W0706001 and J8W07090002. This study was funded by the National Park Service and
conducted under a cooperative agreement with the National Park Service through the Pacific Northwest
Cooperative Ecosystems Studies Unit.
The Division of Subsistence Technical Paper series was established in 1979 and represents the most complete
collection of information about customary and traditional uses of fish and wildlife resources in Alaska. The papers
cover all regions of the state. Some papers were written in response to specific fish and game management issues.
Others provide detailed, basic information on the subsistence uses of particular communities which pertain to a large
number of scientific and policy questions.
Technical Paper series reports are available through the Alaska Resources Library and Information Services
(ARLIS), the Alaska State Library and on the Internet: http://www.adfg.alaska.gov/sf/publications/. This publication
has undergone editorial and professional review.
Malla Kukkonen and Garrett Zimpelman
Alaska Department of Fish and Game, Division of Subsistence,
333 Raspberry Road, Anchorage, AK 99518, USA
This document should be cited as:
Kukkonen, M. and G. Zimpelman. 2012. Subsistence harvests and uses of wild resources in Chistochina, Alaska,
2009. Alaska Department of Fish and Game, Division of Subsistence Technical Paper No. 370,
Anchorage.
The Alaska Department of Fish and Game (ADF&G) administers all programs and activities free from
discrimination based on race, color, national origin, age, sex, religion, marital status, pregnancy, parenthood, or
disability. The department administers all programs and activities in compliance with Title VI of the Civil Rights
Act of 1964, Section 504 of the Rehabilitation Act of 1973, Title II of the Americans with Disabilities Act (ADA) of
1990, the Age Discrimination Act of 1975, and Title IX of the Education Amendments of 1972.
If you believe you have been discriminated against in any program, activity, or facility please write:
ADF&G ADA Coordinator, P.O. Box 115526, Juneau, AK, 99811-5526
U.S. Fish and Wildlife Service, 4040 N. Fairfax Drive, MS 2042, Arlington, VA, 22203
Office of Equal Opportunity, U.S. Department of the Interior, 1849 C Street NW, MS 5230, Washington DC 20240
The department’s ADA Coordinator can be reached via phone at the following numbers:
(VOICE) 907-465-6077, (Statewide Telecommunication Device for the Deaf) 1-800-478-3648, (Juneau TDD)
907-465-3646, or (FAX) 907-465-6078
For information on alternative formats and questions on this publication, please contact:
Division of Subsistence, ADF&G http://www.adfg.alaska.gov/index.cfm?adfg=contacts.anchorage.
i
TABLE OF CONTENTS Page
LIST OF TABLES........................................................................................................................................................iii
LIST OF FIGURES ......................................................................................................................................................iii
LIST OF APPENDICES .............................................................................................................................................. iv
ABSTRACT .................................................................................................................................................................. 1
PROJECT BACKGROUND ......................................................................................................................................... 2
Final Report Organization......................................................................................................................................... 2
STUDY OBJECTIVES ................................................................................................................................................. 3
RESEARCH METHODS .............................................................................................................................................. 7
Ethical Principles for the Conduct of Research ............................................................................................................. 7 Project Planning and Approvals .................................................................................................................................... 7
Systematic Household Surveys ................................................................................................................................. 8
Mapping of Locations of Subsistence Hunting, Fishing, and Gathering, 2009 ........................................................ 9
Population Estimates and Other Demographic Information ................................................................................... 10
Community Review Meeting .................................................................................................................................. 10
DATA ANALYSIS AND REVIEW ........................................................................................................................... 10
Survey Data Entry and Analysis .................................................................................................................................. 10 Map Data Entry and Analysis ................................................................................................................................. 12
COMMUNITY BACKGROUND ............................................................................................................................... 13
The Ahtna and the Copper River Basin ....................................................................................................................... 13 The Community of Chistochina ................................................................................................................................... 16
DEMOGRAPHY, CASH EMPLOYMENT, AND MONETARY INCOME ............................................................. 16
Demography ................................................................................................................................................................ 16 Cash Employment Characteristics and Monetary Income ........................................................................................... 20
LEVELS OF PARTICIPATION IN THE HARVESTS AND USES OF WILD RESOURCES ................................ 23
Resource Harvest and Use Patterns ............................................................................................................................. 25 Species Used and Seasonal Round .............................................................................................................................. 26 Harvest Quantities ....................................................................................................................................................... 33
SHARING AND RECEIVING WILD RESOURCES ................................................................................................ 37
USE AND HARVEST CHARACTERISTICS BY RESOURCE CATEGORY ......................................................... 37
Salmon ......................................................................................................................................................................... 37 Nonsalmon Fish ........................................................................................................................................................... 40 Large Land Mammals .................................................................................................................................................. 50 Small Land Mammals .................................................................................................................................................. 51 Birds ............................................................................................................................................................................ 52 Marine Invertebrates .................................................................................................................................................... 52

ii
Vegetation.................................................................................................................................................................... 52
COMPARING HARVESTS AND USES IN 2009 WITH PREVIOUS YEARS........................................................ 58
CURRENT AND HISTORICAL HARVEST AREAS ............................................................................................... 66
LOCAL CONCERNS REGARDING RESOURCES ................................................................................................. 67
Fish .............................................................................................................................................................................. 67 Large Land Mammals .................................................................................................................................................. 67 Small Land Mammals .................................................................................................................................................. 67 Migratory Waterfowl and Upland Game Birds ........................................................................................................... 67 Vegetation.................................................................................................................................................................... 68
SUMMARY ................................................................................................................................................................ 68
SUBSISTENCE HARVEST PATTERNS AND TRENDS ........................................................................................ 69
Overview of Findings for Chistochina, 2009 ............................................................................................................... 69
CONCLUSION ........................................................................................................................................................... 70
ACKNOWLEDGMENTS ........................................................................................................................................... 71
REFERENCES CITED ............................................................................................................................................... 72
APPENDICES ............................................................................................................................................................. 73

iii
LIST OF TABLES Table Page 1-1. Population of Chistochina, 2000, 2009, and 2010. .......................................................................................... 4 1-2. Resources used in Chistochina, 2009. ............................................................................................................. 6 1-3. Project staff, Chistochina. ............................................................................................................................... 8 1-4. Sample achievement, Chistochina, 2009. ........................................................................................................ 9 2-1. Demographic and sample characteristics, Chistochina, 2009. ....................................................................... 17 2-2. Population profile, Chistochina, 2009. .......................................................................................................... 18 2-3. Birthplaces of household heads, Chistochina, 2009. ..................................................................................... 20 2-4. Employment by industry, Chistochina, 2009. ............................................................................................... 21 2-5. Employment characteristics, Chistochina, 2009. ........................................................................................... 22 2-6. Participation in subsistence harvesting and processing activities, Chistochina, 2009. .................................. 23 2-7. Resource harvest and use characteristics, Chistochina, 2009. ....................................................................... 26 2-8. Estimated harvests and uses of fish, game and plant resources, Chistochina, 2009. ..................................... 28 2-9. Top 10 resources harvested and used, Chistochina, 2009. ............................................................................ 33 2-10. Use of firewood for heating, Chistochina, 2009. ........................................................................................... 33 2-11. Estimated percentages of salmon harvested by gear type, resource and total harvest, Chistochina, 2009. ... 39 2-12. Estimated percentages of nonsalmon fish harvested by gear type, resource, and total harvest,
Chistochina, 2009. ......................................................................................................................................... 43 2-13. Estimated large land mammal harvest by month and sex, Chistochina, 2009. .............................................. 50 2-14. Change in household use of resources compared to recent years, Chistochina, 2009. .................................. 60 2-15. Total estimated community harvests, pounds usable weight, Chistochina, 1982, 1987, 2009. ..................... 61 3-1. Selected study findings for Chistochina, 2009. ............................................................................................. 69
LIST OF FIGURES Figure Page 1-1. Map of the study area. ..................................................................................................................................... 5 2-1. Population profile, Chistochina, 2009. .......................................................................................................... 19 2-2. Individual levels of participation in subsistence harvesting and processing activities, Chistochina,
2009. .............................................................................................................................................................. 25 2-3. Chistochina composition of wild resource harvests, pounds usable weight, 2009. ....................................... 34 2-4. Chistochina composition of small game/furbearer and bird harvests, pounds usable weight, 2009. ............. 35 2-5. Chistochina composition of nonsalmon fish harvest, pounds usable weight, 2009. ...................................... 36 2-6. Chistochina composition of salmon harvest, pounds usable weight, 2009. ................................................... 38 2-7. Sockeye salmon harvest locations, Chistochina, 2009. ................................................................................. 41 2-8. Chinook salmon harvest locations, Chistochina, 2009. ................................................................................. 42 2-9. Lake trout harvest locations, Chistochina, 2009. ........................................................................................... 46 2-10. Arctic grayling harvest locations, Chistochina, 2009 .................................................................................... 47 2-11. Burbot harvest locations, Chistochina, 2009. ................................................................................................ 48 2-12. Whitefish and rainbow trout harvest locations, Chistochina, 2009. .............................................................. 49 2-13. Moose harvest number comparison by data source, Chistochina, 2009. ....................................................... 51 2-14. Moose search areas, Chistochina, 2009. ........................................................................................................ 53 2-15. Caribou search areas, Chistochina, 2009. ...................................................................................................... 54 2-16. Small land mammals search areas, Chistochina, 2009. ................................................................................. 55 2-17. Migratory waterfowl and upland game birds harvest areas, Chistochina, 2009. ........................................... 56 2-18. Plants and berries harvesting areas, Chistochina, 2009. ................................................................................ 57 2-19. Household use of resources compared to recent years, Chistochina, 2009. .................................................. 59 2-20. Per capita harvests in pounds edible weight, time comparison, Chistochina, 1982, 1987, and 2009. ........... 62 2-21. Categorical harvests as percentages of the total harvest in pounds edible weight, time comparison,
Chistochina, 1982, 1987, and 2009. .............................................................................................................. 62 2-22. Comparison of harvest and uses of wild resources, Chistochina, 1982, 1987, 2009. .................................... 65

iv
LIST OF APPENDICES Appendix Page A. Chistochina survey form. .............................................................................................................................. 74 B. Conversion factors. ........................................................................................................................................ 98 C. Additional harvest use area maps. ............................................................................................................... 103 D. Summary of study findings. ........................................................................................................................ 108

1
ABSTRACT
This report presents information about subsistence uses of fish, wildlife, and plant resources in Chistochina, which is
located in Southcentral Alaska. The previous baseline harvest assessment studies in Chistochina took place in 1982
and 1987. The Alaska Department of Fish and Game Division of Subsistence conducted this project in collaboration
with Wrangell-St. Elias National Park and Preserve as part of a multiyear study to update subsistence harvest
information for communities in the Copper River Basin. Information on uses of wild resources was collected
through systematic household surveys, which also included a mapping component. Surveys were conducted with the
informed consent of the community and households. Also as a part of the informed consent process, researchers
presented preliminary project findings to the community for review. In total, 27 households were interviewed, which
represented 82% of year-round resident households. The project documented the continuing importance of
subsistence hunting, fishing, and gathering to the residents of Chistochina. In 2009, every Chistochina household
used wild resources and 96% households participated in subsistence harvest activities.
Key words: Harvest survey, subsistence uses, subsistence fishing, subsistence hunting, Chistochina, Ahtna,
Athabascan, Wrangell-St. Elias National Park and Preserve.
2
CHAPTER 1: INTRODUCTION
PROJECT BACKGROUND
This report provides updated information about the uses of the fish, wildlife, and plant resources by the
residents of Chistochina, which is a community located in the upper Copper River Basin in Southcentral
Alaska (Figure 1-1). This is the third harvest assessment survey conducted by the Alaska Department of
Fish and Game (ADF&G) Division of Subsistence in Chistochina. Previous studies were conducted in
1982 (Stratton and Georgette 1984) and 1987 (McMillan and Cuccarese 1988). In addition, a harvest
mapping study was conducted in 20 communities in the Copper River Basin area between 1983 and 1984
(Stratton and Georgette 1985).
The National Park Service (NPS), through Alaska Regional Natural Resources Project Funds, provided
financial assistance to ADF&G to conduct this study. This study was funded through a cooperative
agreement with the Wrangell-St. Elias National Park and Preserve (WRST) and the Alaska Department of
Fish and Game. The Division of Subsistence conducted this project in collaboration with Wrangell-St.
Elias National Park and Preserve. This report presents information from research that was conducted in
2010 for the 2009 study year. As a whole, when complete, this study will have broad applicability in
resource management and land use planning, and will provide updated baseline information about
demographics, economics, and subsistence activities in this area of Alaska. Figure 1-1 portrays the study
area and participating communities, including communities scheduled to be surveyed in future years. In
2011, research was conducted in Copper Center, Mentasta, Mentasta Pass, and Slana for the 2010 study
year. Project year 3 will include the communities of Chitina, Kenny Lake, Gakona, and McCarthy.
Research in these communities will be conducted in 2013 for the 2012 study year.
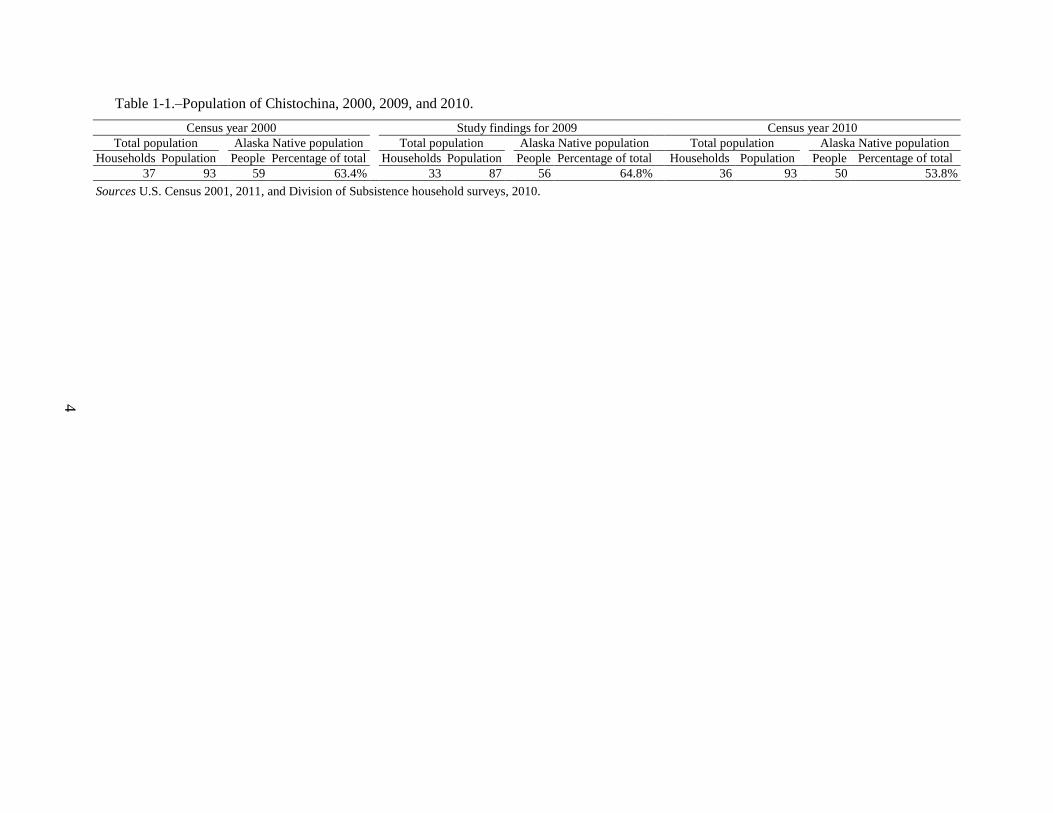
Table 1-1 reports the population of Chistochina in 2000, 2009, and 2010 based on the 2000 and 2010 U.S.
Census estimates and findings of this project. Population estimates are fairly similar and reflect a
relatively stable population. The residents of Chistochina rely on subsistence hunting, fishing, and
gathering for nutrition and to support their way of life. The residents use a variety of resources, including
salmon and other fishes, large land mammals (caribou, and moose), small land mammals (small game and
furbearers)1, birds, and wild plants (ADF&G Community Subsistence Information System [CSIS
2];
Stratton and Georgette 1984; McMillan and Cuccarese 1988). Table 1-2 presents a list, including the
Linnaean taxonomic names, of resources used in Chistochina.
Final Report Organization
ADF&G researchers prepared this final report. Similar to other reports generated from a multiphase study,
this report summarizes the results of systematic household surveys, mapping interviews, and community
meetings. The first chapter of the report introduces the project and provides the background for the study.
Chapter two presents the study findings and compares them to previous research by ADF&G in
Chistochina. The third and final chapter discusses the study findings and conclusions.
1. The category of small land mammals includes both small game, which are typically eaten, and furbearers which are typically
harvested only for their fur.
2. ADF&G CSIS: http://www.adfg.alaska.gov/sb/CSIS/. Hereinafter cited as CSIS.

3
ADF&G provided a draft report to the National Park Service, the Cheesh`na Tribal Council, Ahtna
Incorporated, and ADF&G area biologists for their review and comment. After receipt of comments, the
report was finalized. ADF&G mailed a short (4-page) summary of the study findings to every household
in Chistochina (Appendix D).
STUDY OBJECTIVES
This study had the following objectives:
1. Design a survey instrument to collect updated baseline information about subsistence hunting,
fishing, gathering, and other topics in a way that is compatible with information collected in
previous rounds of household interviews.
2. Train local residents in administration of the systematic household survey.
3. Conduct household surveys to record the following types of information:
a. Demographic information.
b. Involvement in use, harvest, and sharing of fishes, wildlife, and wild plants in 2009.
c. Estimates of amount of resources harvested in 2009.
d. Information about employment and cash income in 2009.
e. Assess changes in subsistence harvest and use patterns.
f. Location of hunting and harvests of subsistence resources in 2009.
4. Collaboratively review and interpret study findings with the study community.
5. Produce a final report.
6. Communicate study findings to the community and the public.
4
Table 1-1.–Population of Chistochina, 2000, 2009, and 2010.
Census year 2000 Study findings for 2009 Census year 2010
Total population
Alaska Native population
Total population
Alaska Native population Total population
Alaska Native population
Households Population People Percentage of total
Households Population People Percentage of total Households Population People Percentage of total
37 93
59 63.4% 33 87
56 64.8% 36 93 50 53.8%
Sources U.S. Census 2001, 2011, and Division of Subsistence household surveys, 2010.

5
Figure 1-1.–Map of the study area.

6
Table 1-2.–Resources used in Chistochina, 2009.
Common name(s)a Linnaean taxonomic name
Fish
Chum salmon
Oncorhynchus keta
Coho salmon
Oncorhynchus kisutch
Chinook salmon
Oncorhynchus tshawytscha
Pink salmon
Oncorhynchus gorbuscha
Sockeye salmon
Oncorhynchus nerka
Landlocked salmon
Oncorhynchus nerka
Unknown salmon
Oncorhynchus spp.
Pacific cod (gray)
Gadus macrocephalus
Lingcod
Ophiodon elongatus
Pacific halibut
Hippoglossus stenolepis
Rockfish
Sebastes spp.
Burbot
Lota lota
Dolly Varden
Salvelinus malma
Lake trout
Salvelinus namaycush
Arctic grayling
Thymallus arcticus
Northern pike
Esox lucius
Rainbow trout
Oncorhynchus mykiss
Round whitefish
Prosopium cylindraceum
Unknown whitefish
Various spp.
Land mammals
Caribou
Rangifer tarandus
Moose
Alces alces
Beaver
Castor canadensis
Coyote
Canis latrans
Red fox–cross phase
Vulpes vulpes
Red fox–red phase
Vulpes vulpes
Snowshoe hare
Lepis americanus
River (land) otter
Lontra canadensis
Lynx
Lynx canadensis
Marten
Martes americana
Mink
Mustela vison
Porcupine
Erethizon dorsatum
Weasel
Mustela nivalis
Gray wolf
Canis lupus
Wolverine
Gulo gulo
Birds and eggs
Migratory birds, ducks
Canvasback
Clangula hyemalis
Goldeneyes
Bucephala spp.
Mallard
Anas platyrhynchos
Northern pintail
Anas acuta
Black scoter
Melanitta nigra
Migratory birds, geese
Snow goose
Chen caerulescens
-continued-

7
Table 1-2.–Page 2 of 2.
Common name(s)a Linnaean taxonomic name
Birds and eggs, continued
Upland game birds
Spruce grouse
Dendragapus canadensis
Ptarmigan
Lagopus spp.
Marine invertebrates
Pacific razor clam
Siliqua patula
King crab
Paralithodes spp.; Lithodes spp.
Vegetation
Berries
Blueberry
Vaccinium spp.
Low bush cranberry
Vaccinium vitis idaea
High bush cranberry
Viburnum edule
Crowberry
Empetrum nigrum
Raspberry
Rubus idaeus
Salmonberry
Rubus chamaemorus
Other wild berries
Various spp.
Other plants
Hudson’s Bay tea
Ledum palustre
Wild rose hips
Rosa acicularis
Other wild greens
Various spp.
Mushrooms Various spp.
Fireweed
Epilobium angustifolium
Wood
Various spp.
Roots
Roots
Various spp.
Source ADF&G Division of Subsistence household surveys, 2010.
a. This table lists species harvested, used, or both harvested and used by residents of the study community,
but that may not be specifically discussed in this report.
RESEARCH METHODS
ETHICAL PRINCIPLES FOR THE CONDUCT OF RESEARCH
The study is guided by the research principles adopted by the Alaska Federation of Natives in 1993 and
the Interagency Arctic Research Policy Committee on June 28, 1990 (see Miraglia 1998). These
principles stress community approval of research designs, informed consent, anonymity of study
participants, community review of draft study findings, and the provision of study findings to each study
community upon completion of the research.
PROJECT PLANNING AND APPROVALS
After approval of the task agreement, project staff from ADF&G and WRST met in November 2009 to
refine project objectives, methods, schedules, and responsibilities. To meet the information needs of the
participating organizations and to coordinate research, several questions related to NPS management
needs were added to the Division of Subsistence standard household harvest survey instrument. Also,
spatial harvest and search area data would be collected using the Division’s standard method of collecting
subsistence map data by recording on a paper map the locations where members of participating
households hunted, fished, and gathered wild resources during the 2009 study year. WRST in turn would
coordinate with Cheesh`na Tribal Council (CTC), the federally recognized tribal government in
Chistochina, and provide personnel to assist ADF&G in fieldwork. WRST geographic information system

8
(GIS) staff would also digitize the collected mapping data and produce the harvest and use maps for the
report. ADF&G would send one researcher, Jory Stariwat, to Chistochina to conduct the research by
working with the community.
In February 2010, NPS staff met with the CTC and their staff to discuss the project, and CTC passed a
motion supporting the project. Later in February NPS and CTC held a community meeting to present the
project to the community. NPS also worked with CTC to identify a local research assistant (LRA) to work
with ADF&G. The LRA was paid directly by ADF&G. Fieldwork in Chistochina took place in February–
March 2010.
Table 1-3 lists all project staff. The list includes those individuals involved in project management, field
research, data entry, data analysis, map production, and report writing.
Table 1-3.–Project staff, Chistochina.
Task Name Organization
Project design and management Bill Simeone ADF&G Division of Subsistence
Barbara Cellarius WRST National Park and Preserve
Data management lead David Koster ADF&G Division of Subsistence
Field research lead Jory Stariwat ADF&G Division of Subsistence
Programmer Garrett Zimpelman ADF&G Division of Subsistence
Survey design Davin Holen ADF&G Division of Subsistence
Editorial review lead Lisa Ka’aihue ADF&G Division of Subsistence
Data entry Jennifer Bond ADF&G Division of Subsistence
Cartography Joshua Scott WRST National Park and Preserve
Jason Sprung WRST National Park and Preserve
Davin Holen ADF&G Division of Subsistence
Bronwyn Jones ADF&G Division of Subsistence
Field research staff Jory Stariwat ADF&G Division of Subsistence
Barbara Cellarius WRST National Park and Preserve
Robbin La Vine ADF&G Division of Subsistence
Benjamin Balivet ADF&G Division of Subsistence
Donna Boston Cheesh’na Tribal Council
Systematic Household Surveys
The primary method for collecting subsistence harvest and use information for this project was a
systematic household survey. A key goal was to structure the survey instrument so as to collect
demographic, resource harvest and use, and economic data that were compatible with information
collected in previous rounds of household surveys in the study community. Following discussion by e-
mail and telephone with WRST, ADF&G finalized the Chistochina survey instrument in January 2010.
Appendix A is an example of the survey instrument used in this project. Barbara Cellarius in turn took the
lead in obtaining approval for the survey from the Office of Management and Budget (OMB).
Stariwat traveled to Chistochina in February 2010, where he was later joined by Barbara Cellarius for part
of the trip. They conducted the mapping portion of the interview sessions while Donna Boston, the LRA,
explained and administered the survey to local residents. She also arranged the interviews.
The study goal was to interview one representative from each year-round household in Chistochina.
Similar to the Division of Subsistence’s previous baseline studies, the Chistochina study area for this
study was consistent with U.S. Census Bureau’s census designated place (CDP) definition for
Chistochina. Researchers were able to interview a total of 27 Chistochina households. They received no
response from 4 households currently residing in the community, and 2 households declined to be

9
interviewed. Thus the sample achievement for Chistochina was 82% (Table 1-4). Participation in the
survey was voluntary and all responses are confidential at both the individual and household levels.
Table 1-4.–Sample achievement, Chistochina, 2009.
Initial estimate of households 35
New households 2
Moved or nonresident householdsa 4
Revised estimate of households 33
Interview goal 33
Households interviewed 27
Households failed to contact 4
Households declined to be interviewed 2
Total households attempted to interview 29
Refusal rate 6.9%
Final estimate of permanent households 33.0
Percentage of total households interviewed 81.8%
Interview weighting factorb 1.2
Sampled population 71.0
Estimated population 86.8
Source ADF&G Division of Subsistence household surveys, 2010.
a. Nonresident households had not lived in the community for at
least 3 months during the study year.
b. The multiplier used to determine the estimated harvest values
(e.g., reported harvests x weighting factor = estimated harvests
for the community).
Mapping of Locations of Subsistence Hunting, Fishing, and Gathering, 2009
In addition to harvest and use information collected on the survey form, researchers asked respondents to
indicate the locations of their hunting, fishing, and gathering activities during the 2009 study year.
Specifically, interviewers asked the respondents to mark on maps the locations of each harvest, species
harvested, the amount harvested, and the month of harvest. To capture and analyze the data, ADF&G and
WRST staff applied the mapping method standard to all ADF&G subsistence harvest update projects.
Points were used for harvest locations, and polygons (circled areas) were used for search areas. Lines
were used to indicate trap lines. However, due to anonymity, these lines are buffered in the small land
mammal and furbearer harvest area map published in this report.
These data update findings from a mapping study conducted by Stratton and Georgette (1985), which was
accomplished through individual interviews with over 200 local hunters and fishers in 20 communities in
the Copper River Basin area between 1983 and 1984. The qualitative interviews collected information
about resource harvest areas used and effort between 1964 and 1984. The 113 maps produced by the 1985
mapping study are available from the ADF&G Division of Habitat in the 1986 Southcentral Regional
Habitat Guide.3 The discussion and conclusion section of this report includes as much temporal
comparison as possible of harvest and effort from Stratton’s and Georgette’s earlier research to the data
gathered during this project.
3. Digital copies of the Alaska Habitat Management Guides narrative documents and color atlases published in 1985–1986 can
be accessed at http://www.arlis.org/docs/vol1/C/AHMG/index.html.

10
The maps used for this project were produced by Davin Holen from the Division of Subsistence using
ArcGIS 10 software4 on 11″ x 17″ paper. They consisted of 3 sets of paper maps: 1 set of grayscale high
resolution U. S. Geological Survey (USGS) topographic maps at 1:100,000, one set of similar grayscale
maps set at 1:500,000, and one set of similar high resolution color maps set at 1:250,000. There were 2
different maps in each set: one for fishing (water based) activities, and one for hunting, trapping, and
plant gathering (land based) activities. During each mapping session, researchers recorded the
household’s identification number, the date of the mapping interview, and the interviewer’s initials on
each map.
Participation in the mapping component of the survey was voluntary and was conducted by ADF&G and
WRST researchers at the same time as the survey. All responses are confidential at the household level
and only a community summary map for the various species searched and harvested is included in this
report.
Population Estimates and Other Demographic Information
As noted previously, a goal of the research was to collect demographic information about all year-round
households of Chistochina. Because not all households were interviewed, a population estimate was
calculated by multiplying the average household size of interviewed households by the total number of
year-round households, as identified by Division of Subsistence researchers in consultation with
community officials and other knowledgeable respondents (Table 1-1).
Community Review Meeting
ADF&G and WRST staff presented preliminary survey findings at a meeting in Chistochina on
November 17, 2011. This meeting was organized in collaboration with the Cheesh’na Tribal Council and
community leadership. Five community members attended the review meeting, as did Robbin La Vine
and Ben Balivet of ADF&G, and Barbara Cellarius of WRST.
DATA ANALYSIS AND REVIEW
SURVEY DATA ENTRY AND ANALYSIS
All data were coded for data entry by Division of Subsistence staff in Anchorage. Responses were coded
following standardized conventions used by the Division to facilitate data entry. The Division’s
information management staff set up standard Microsoft SQL Server database structures that included
rules, constraints, and referential integrity to ensure that data were entered completely and accurately.
Data entry screens were produced using Microsoft Access 2010. Daily incremental backups of the
database occurred, and transaction logs were backed up hourly. Full backups of the database occurred
twice weekly. This ensured that no more than one hour of data entry would be lost in the unlikely event of
a catastrophic failure. All survey data were entered twice and each set compared in order to minimize data
entry errors.
Once data were entered and validated, information was processed with the use of Statistical Package for
the Social Sciences (SPSS) software, version 19. Initial processing included the performance of
standardized logic checks of the data. Logic checks are often needed in complex data sets where rules,
constraints, and referential integrity do not capture all of the possible inconsistencies that may appear.
Harvest data collected in their respective units (numbers of individuals, gallons, buckets, etc.) were
converted to pounds usable weight using standard conversion factors (Appendix B).
4. Product names are given because they are established standards for the State of Alaska or for scientific completeness: they do
not constitute product endorsement.

11
ADF&G staff also used SPSS for analyzing the survey information. Analysis included review of raw data
frequencies, cross tabulations, table generation, estimation of population parameters, and calculation of
confidence intervals for the estimates.
Harvest estimates and responses to all questions were calculated based upon the application of weighted
means (Cochran 1977). These calculations are standard methods for extrapolating sampled data. As an
example, the formula for harvest expansion is
(1)
where:
(mean harvest per returned survey) (2)
and Hi = the total harvest (numbers of resource or pounds) for the community I,
hi = the total harvest reported in returned surveys,
ni = the number of returned surveys, and
Si = the number of households in a community.
As an interim step, the standard deviation (SD), or variance (V) (which is the SD squared), was also
calculated with the raw unexpanded data. The standard error (SE), or SD, of the mean was also calculated
for the community.
The 95% confidence limit (CL) is used to express the relative precision of the estimate; that is to say that
if the population were repeatedly, randomly sampled and the estimated harvests and confidence limits
were calculated for each sample, researchers are confident that 95% of the calculated confidence intervals
would overlap (enclose, bound, etc.) the true harvest value of the population (McDonald 2009:112–117).
Once the standard error was calculated, the CL was determined by multiplying the SE by a constant that
reflected the level of significance desired, based on a normal distribution. The constant for 95%
confidence limits is 1.96. Though there are numerous ways to express the formula below, it contains the
components of an SD, V, and SE.
( )
⁄
√ √
(3)
where:
s = sample standard deviation,
n = sample size,
N = population size, and
⁄ = student’s t statistic for alpha level (α=.95) with n–1 degrees of freedom.
The value reported for the 95% confidence limit is the percentage of the estimate that may be added to,
and subtracted from, the estimate in order to get the maximum and minimum values of the confidence
interval for the given estimate. If the estimated harvest weight is known, the limits are applied to the
estimated harvest weight. If the harvest weight is not known, then the limits are applied to the harvest
amount (i.e., the estimated number of units of a given resources that were harvested). Small CL
percentages indicate that an estimate is likely to be very close to the actual mean of the sample. Larger
percentages mean that estimates could be further away from the mean of the sample.
The corrected, final data from the household survey will be added to the CSIS. This publicly accessible
database, available through the ADF&G website, includes community-level study findings.
12
Map Data Entry and Analysis
ADF&G information management staff checked maps for consistency with data recorded on the survey
forms. They also removed extraneous marks from the maps to ensure the digitizing process would occur
with minimal error. The map design included tick marks, similar to registration marks, used to pinpoint
geographical features and thus provide accuracy during the digitizing process. Each map could then be
aligned by the WRST GIS staff, who digitized the polygons, points, and lines that researchers had drawn
by hand on the paper maps during the interviews. The final wild resource harvest area maps included in
this report were produced by ADF&G Division of Subsistence staff.

13
CHAPTER 2: STUDY FINDINGS
COMMUNITY BACKGROUND
The Ahtna and the Copper River Basin
The Copper River Basin, located in Southcentral Alaska, is surrounded by 4 mountain ranges and
traversed by the 286 mile-long Copper River, a large glacial river that originates from the Copper Glacier
located in the northeast side of Mount Wrangell in the Wrangell-St. Elias National Park and Preserve
(Kammerer 1990). Ecologically the Copper River Basin is a transitional zone between maritime and
continental ecosystems, extending from the eastern edges of Prince William Sound in the Gulf of Alaska
to the continental inlands of Southcentral Alaska (Holen 2010:7). The Copper River, whose drainage
covers over 24,000 square miles, is world famous for its prized salmon runs, which include Chinook,
sockeye, and coho salmon.
The Copper River Basin is the traditional territory of Athabascan-speaking Alaska Natives known as the
Ahtna. The Ahtna are believed to have inhabited the area for at least one thousand years, with their
territory comprising 23,000 square miles throughout the Copper River valley floor, upper portions of the
Susitna River drainage, and the surrounding mountains. Geographically the Ahtna of the Copper River
Basin are divided into 3 groups—the Upper, Lower, and Western Ahtna. Distinguishable also by their
differing dialects, the Ahtna can be divided into 4 dialectical groups—Upper Ahtna, Central Ahtna,
Lower Ahtna, and Western Ahtna. The Ahtna are additionally further identified through belonging to 8
regional autonomous bands with specified geographic territories for subsistence (de Laguna and
McClellan 1981:641–643; Simeone and Kari n.d. [2004]:5–6; Holen 2010:7, 12–13, 15).
Following the geographic division, the 3 Ahtna groups had differing subsistence harvest patterns: the
Lower Ahtna were more focused on salmon in their diet while the Upper and Western Ahtna harvested
more land mammals and nonsalmon fish. Despite the geographically rough boundaries separating the
different Ahtna groups, they interacted with their neighbors through shared hunting grounds and trading
for subsistence resources. Records also show territorial conflicts as well as social engagements (de
Laguna and McClellan 1981; Holen 2010:12–13). In the late nineteenth century, the most important
Ahtna item in the interband trading networks was copper. It was collected in an area nearly exclusively
controlled by the Lower Ahtna and used, for example, in knives, arrowheads, and jewelry (Stratton and
Georgette 1984:18–19).
The sustained, seasonal-round based life of the Ahtna people and their environment was first disrupted
with the arrival of Russian explorers looking for furs in the late eighteenth century. With the exception of
the 1819 establishment and 1848 closure of a small trading post in Taral, in the Lower Ahtna territory, the
Ahtna persistently resisted Russian incursions into their territory (de Laguna and McClellan 1981:643;
Reckord 1983b:13–18; Holen 2010:20). Nevertheless, some trading took place between the 2 groups and
new items, such as guns and iron implements, were introduced to the Copper River Basin area (Stratton
and Georgette 1984:20).
Until the late nineteenth century, a majority of the Ahtna lived in winter villages along the Copper River
and its tributaries, while the Western Ahtna led a more seminomadic lifestyle. Population figures
collected in 1818 by the Russian American Company recorded 567 people living in the Copper River
Basin (de Laguna and McClellan 1981:644–648; Holen 2010:14). Between 1836 and 1839, a smallpox
epidemic killed almost half of the Ahtna in the area, diminishing the population to only 300 people. The
total Ahtna population reached a low of 297 people in 1910. It is notable that until the 1960s, the Ahtna

14
population was never reported to be much higher than 500 people (de Laguna and McClellan 1981:643–
644; Holen 2010:14).
The Yukon River gold rush of 1898 and the 1899 Euro-American “purchase” of access to the copper
source in the Lower Ahtna lands through a simple trading action drastically altered life in the Copper
River valley (Holen 2010:26). Intensive settling of prospectors, miners, business entrepreneurs, and
government personnel brought the development of roads, new trading posts, mines, and schools.
Consequently, the development of new transportation routes on the old Ahtna trails in the Copper River
Basin led to the biggest changes in the area’s settlement patterns, as well as an economy that mixed cash
and subsistence activities for the first time (de Laguna and McClellan 1981:643; Reckord 1983b:59–68;
Stratton and Georgette 1984:20).
From 1899 to 1902, the U.S. Army constructed a telegraph line between the communities of Valdez in
Prince William Sound and Eagle along the Yukon River. By 1904, a longer trail connected Valdez and
Fairbanks (de Laguna and McClellan 1981:643–644; Stratton and Georgette 1984:21). With these trails,
access to the whole Copper River Basin was opened, and roadhouses sprang up at about a day’s journey
apart when traveling on foot. Many of the modern day communities in the Copper River Basin continue
to exist in these same locations. Over time, these trails were improved for wagon travel, and later on for
motorized vehicles, which continue to take people into the area on paved highways (Stratton and
Georgette 1984:21).
The construction of the Copper River and Northwestern Railway between Cordova and the Kennicott
copper mines on the south side of the Wrangell Mountains began in 1908 and was completed in 1911.
The new mode of transportation brought hundreds of people into the Chitina River valley. Several
communities in the area boomed and many Ahtna families, who had been living in traditional villages and
camps until then, were eventually attracted to these new centers of commerce by the availability of
imported technology, other trade goods, and temporary wage employment opportunities (Reckord
1983b:59–68; Stratton and Georgette 1984:21; Fall and Stratton 1984:9–10). The exposure of the Ahtna
to the Euro-American culture expanded rapidly as many activities such as medicine, education, and law
enforcement, previously performed by the Ahtna themselves were taken over by the newcomers. During
the mining period, the Ahtna continued to trade furs and sell leather products to the newcomers; however,
they also got involved in the new “frontier economy” and worked, for example, as guides and laborers
earning cash for their services (Reckord 1983b:59–68; Stratton and Georgette 1984:22).
The mining frenzy in the Copper River Basin diminished by 1920. Resident populations declined, but
dependency on fish and game resources increased (Stratton and Georgette 1984:22). Trapping continued
to be the major economic activity for the Ahtna through the 1920s, until fur prices fell significantly in
1929 with the beginning of the Great Depression (Reckord 1983b:68–70; Holen 2010:28). The beginning
of the Second World War prompted a new wave of development in the area, including the building of the
Glenn Highway, the Alaska Highway, and other transportation routes and new airfields, particularly for
military use. The completion of the highway system made travel to and from Anchorage easier, and with
the improved communications as well as wage employment opportunities, more Euro-Americans began to
arrive in the Copper River Basin again (Reckord 1983b:71–72; Stratton and Georgette 1984:23).
The 1950s brought increased pressure by government agents on Alaska Native families to send their
children to school. As a result, communities along the road system saw an influx of Alaska Native family
settlement. These moves disrupted the seasonal movements associated with trapping and other
subsistence activities, and many Alaska Native families had to stop furbearer trapping as they moved into
larger communities with schools (Reckord 1983b:73–74; Stratton and Georgette 1984:23). Alaska
Statehood in 1959 brought yet another new dimension to the Copper River Basin economy and
development. The State of Alaska assumed management of large segments of the newly titled lands and
waters and provided new employment opportunities for Copper River Basin residents. After statehood,

15
the state and federal government provided more than one-third of the employment opportunities for area
residents (Stratton and Georgette 1984:23; Holen 2010:28).
The discovery of oil in Prudhoe Bay in the late 1960s was the catalyst of a series of developments that
continues to affect the lives of all Alaska residents. The formation of the Alaska Federation of Natives in
1966 to halt state land selection for oil development and lobby for a final settlement of land title to Alaska
Native lands led to the Alaska Native Claims Settlement Act (ANCSA) in 1971. In addition to monetary
compensation, the settlement gave fee simple title to 40 million acres to be administered by 220 village
and 13 regional for-profit Native corporations. Under ANCSA, Ahtna Inc. is the Native regional
corporation for shareholders of Ahtna descent (Holen 2010:29). The corporation has 15 operating
subsidiaries, which are involved in a number of activities, including construction services, government
contracting, and oil and gas pipeline maintenance. The regional corporation headquarters are located in
Glennallen, and the current number of shareholders is over 1,600.5 In addition, several independent, not-
for-profit sociopolitical organizations work in the area to support the health and well-being of the Ahtna
people. These include Copper River Native Association (CRNA) and the Mount Sanford Tribal
Consortium (MSTC) to mention a few by name (Holen 2010:29). In addition most communities in the
area have a tribal council and a health clinic, which provide essential services for community residents.
The oil boom of the 1970s led to yet another boom period in the economy of the Copper River Basin. The
construction of the Trans Alaska Pipeline between 1974 and 1977 brought new wage employment
opportunities and more newcomers to the region. This economic growth spurt, like so many before it, was
temporary. However, some employment opportunities in the maintenance of the pipeline and the right-of-
way remained, which encouraged a number of the newcomers to stay (Reckord 1983b:73–74; Stratton
and Georgette 1984:24). Wage employment opportunities have also come about in the service sector, with
local businesses proving services to tourists and to hunters and fishers who travel every year to the region
to enjoy its prized natural resources and vast scenery.
The Alaska National Interest Lands Conservation Act (ANILCA) of 1980 designated over 100 million
acres in Alaska as national parks, preserves, monuments, and wildlife refuges. The Ahtna were affected
by the creation of the Wrangell-St. Elias National Park and Preserve (WRST), which is located on the
eastern shore of the Copper River and encompasses 13.2 million acres of land. It is the largest national
park in the United States but also an area where the Ahtna of the Copper River basin traditionally hunted
and fished for various wild resources.6 There are 23 resident zone communities, including Chistochina, in
the WRST area, and under current federal regulations, qualified local rural residents may subsistence
hunt, fish, and trap in both the national park and the preserve. In addition, sport fishing under state
regulations is allowed in both the park and the preserve. Sport hunting and trapping under state
regulations, however, are not allowed in the national park, only in the preserve. The use of airplanes for
subsistence activities is allowed in the preserve but not in the national park. The use of off-road vehicles,
snowmachines, and motorboats for subsistence uses is permitted in both the park and preserve.7
Regardless of the seasonal influx of tourists, hunters, and fishers into the Copper River Basin during late
spring, summer and early fall months, the population of the region remains relatively stable. During the
years between 1938 and 1970, the Ahtna population did not grow over 500 people. Currently, there are
around 3,000 people living in the Copper River Basin, of whom approximately 650 are of Ahtna descent
(Holen 2010:14). The Ahtna today predominantly reside in communities along the road system. Chitina
and Copper Center are the home of mainly Lower Ahtna populations, and Gulkana, Gakona, Chistochina,
and Mentasta are the centers of modern Upper and Central Ahtna populations. The Western Ahtna have
5. Ahtna, Incorporated: www.ahtna-inc.com. (Accessed January 13, 2012.)
6. NPS.gov, Wrangell-St. Elias National Park and Preserve: http://www.nps.gov/wrst/index.htm. (Accessed May 3, 2012.)
7. NPS.gov, Wrangell-St. Elias National Park and Preserve: http://www.nps.gov/wrst/parkmgmt/subsistence-access.htm.
(Accessed February 24, 2012.)

16
resided in Cantwell since they moved down the Denali Highway in the 1930s to be in the vicinity of the
railroad that provided employment and supplies (Holen 2010:30–31).
The Community of Chistochina
Like many other communities in the Copper River Basin, the original village site of Chistochina, located
on a bluff near the Copper River, was most likely an old Ahtna fish camp. Similar to many Copper River
Basin communities, modern Chistochina however owes its beginning to the construction of the Valdez–
Eagle trail and the establishment of a telegraph station at the site of Chistochina in 1902. A roadhouse
subsequently followed. An Ahtna family settled permanently at the village site in the 1940s and they were
later joined by friends and family. After the construction of area highways in the 1960s, a new village was
relocated near the Glenn Highway, as well as a lodge and a school (Reckord 1983a:131–133; Stratton and
Georgette 1984:142).
Today, the village of Chistochina is located at Mile 32.7 on the Tok Cutoff of the Glenn Highway, about
42 miles northeast of Glennallen. The community is surrounded by several waterways, including the
Copper and Chistochina rivers, and Sinona and Boulder creeks.8 The community has a school, a trading
post, a health clinic, a bed and breakfast, and houses the office of the Mount Sanford Tribal Consortium,
which provides a variety of services for the residents of Chistochina and Mentasta. A central meeting
point in the community is the Chistochina Community Hall, which is actively used for various
community meetings and other events. The economy of the area continues to be highly subsistence based,
with seasonal cash employment opportunities consisting mostly of firefighting, highway maintenance,
and construction. With substantial reliance on subsistence, modern Chistochina continues to be a
traditional Athabascan community in the Copper River Basin. As discussed earlier, Chistochina is an
unincorporated community, and in this report, the study area for Chistochina is consistent with the U.S
Census Bureau’s CDP definition for Chistochina.
DEMOGRAPHY, CASH EMPLOYMENT, AND MONETARY INCOME
DEMOGRAPHY
According to the federal census, Chistochina had 93 residents in 2000 and 2010 (U. S. Census Bureau
2001; U. S. Census Bureau 2011; Table 1-1). The household survey conducted for this study in 2009
found an estimated population of 87 residents, of which 65% (56 residents) were Alaska Native (Table 1-
1). Prior to the study, the Division of Subsistence researchers in consultation with community officials
and other knowledgeable community residents, made an initial estimate of 35 year-round households in
Chistochina. While conducting the household surveys, researchers found 2 new households and 4
additional households that were not eligible to participate in the survey (the households had moved or
were considered to be nonresident). After adding the new households to the initial year-round household
estimate, and then subtracting the ineligible households, researchers revised the estimated number of
year-round households to 33 in 2009 (Table 1-1). Of these, 27 households (82%) were interviewed (Table
2-1). For the community overall, the calculated mean number of years of residency in Chistochina was 25
years, and the maximum 78 years (Table 2-1). For household heads specifically, the mean length of
residency was approximately 31 years and the maximum 78 years. The largest age cohort for males was
45–49 years of age, and for females it was 40–44 years of age (Table 2-2 and Figure 2-1). Other age
categories were fairly evenly distributed, with the exception of age cohorts between 0–4 years of age, 20–
8. Alaska Community Database Community Information Summaries (CIS):
http://commerce.alaska.gov/dca/commdb/CIS.cfm?Comm_Boro_Name=Chistochina. (Accessed January 26, 2012.)

17
24 years of age, and 80–84 years of age, where the study only found female residents. It is also notable
that young adults (20–24) were not as well represented in the sample.
Table 2-1.–Demographic and sample characteristics, Chistochina, 2009.
Characteristics Chistochina
Sampled households
27
Eligible households
33
Percentage sampled
81.8%
Household size
Mean
2.6
Minimum
1.0
Maximum
8.0
Age
Mean
40.2
Minimuma
2.0
Maximum
84.0
Median
43.0
Sex
Estimated male
Number
40.3
Percentage
46.5%
Estimated female
Number
46.4
Percentage
53.5%
Alaska Native
Estimated householdsb
Number
25.7
Percentage
77.8%
Estimated population
Number
56.2
Percentage
64.8%
Length of residency
Total population
Mean
25.2
Minimuma
0.0
Maximum
78.0
Heads of household
Mean
30.8
Minimuma
2.0
Maximum
78.0
Source ADF&G Division of Subsistence household surveys,
2010.
a. A minimum age of 0 (zero) is used for infants that
are less than 1 year of age.
b. The estimated number of households in which at
least one head of household is Alaska Native.

18
Table 2-2.–Population profile, Chistochina, 2009.
Age
Male
Female
Total
Number Percentage
Cumulative
percentage Number Percentage
Cumulative
percentage Number Percentage
Cumulative
percentage
0–4 0.0 0.0% 0.0%
1.2 2.6% 2.6%
1.2 1.4% 1.4%
5–9 4.9 12.1% 12.1%
4.9 10.5% 13.2%
9.8 11.3% 12.7%
10–14 4.9 12.1% 24.2%
3.7 7.9% 21.1%
8.6 9.9% 22.5%
15–19 1.2 3.0% 27.3%
2.4 5.3% 26.3%
3.7 4.2% 26.8%
20–24 0.0 0.0% 27.3%
2.4 5.3% 31.6%
2.4 2.8% 29.6%
25–29 1.2 3.0% 30.3%
2.4 5.3% 36.8%
3.7 4.2% 33.8%
30–34 2.4 6.1% 36.4%
2.4 5.3% 42.1%
4.9 5.6% 39.4%
35–39 2.4 6.1% 42.4%
1.2 2.6% 44.7%
3.7 4.2% 43.7%
40–44 4.9 12.1% 54.5%
6.1 13.2% 57.9%
11.0 12.7% 56.3%
45–49 6.1 15.2% 69.7%
3.7 7.9% 65.8%
9.8 11.3% 67.6%
50–54 1.2 3.0% 72.7%
2.4 5.3% 71.1%
3.7 4.2% 71.8%
55–59 1.2 3.0% 75.8%
1.2 2.6% 73.7%
2.4 2.8% 74.6%
60–64 3.7 9.1% 84.8%
1.2 2.6% 76.3%
4.9 5.6% 80.3%
65–69 3.7 9.1% 93.9%
3.7 7.9% 84.2%
7.3 8.5% 88.7%
70–74 1.2 3.0% 97.0%
1.2 2.6% 86.8%
2.4 2.8% 91.5%
75–79 1.2 3.0% 100.0%
3.7 7.9% 94.7%
4.9 5.6% 97.2%
80–84 0.0 0.0% 100.0%
2.4 5.3% 100.0%
2.4 2.8% 100.0%
85–89 0.0 0.0% 100.0%
0.0 0.0% 100.0%
0.0 0.0% 100.0%
90–94 0.0 0.0% 100.0%
0.0 0.0% 100.0%
0.0 0.0% 100.0%
95–99 0.0 0.0% 100.0%
0.0 0.0% 100.0%
0.0 0.0% 100.0%
100–104 0.0 0.0% 100.0%
0.0 0.0% 100.0%
0.0 0.0% 100.0%
Missing 0.0 0.0% 100.0%
0.0 0.0% 100.0%
0.0 0.0% 100.0%
Total 40.3 100.0% 100.0%
46.4 100.0% 100.0%
86.8 100.0% 100.0%
Source ADF&G Division of Subsistence household surveys, 2010.

19
Figure 2-1.–Population profile, Chistochina, 2009.
Of the Chistochina household heads interviewed, approximately 54% were born in Alaska. Most
(approximately 20%) of the Alaska-born household heads were born in Chistochina, followed by Chisana,
Anchorage, and Northway Village (Table 2-3). When summed up, a substantial portion (approximately
41%) of the Chistochina household heads were born in the other communities and areas within or
adjacent to Wrangell-St. Elias National Park and Preserve.9 In comparison, approximately 44% of the
household heads were born in locations outside the state of Alaska, and approximately 2% were foreign
born.
9. The communities are Batzulnetas, Chisana, Chistochina, Gulkana, Mentasta Lake, Nabesna River, Northway Village, and Tok.
8.0 6.0 4.0 2.0 0.0 2.0 4.0 6.0 8.0
Female
Male
Missing
100–104
95–99
90–94
85–89
80–84
75–79
70–74
65–69
60–64
55–59
50–54
45–49
40–44
35–39
30–34
25–29
20–24
15–19
10–14
5–9
0–4

20
Table 2-3.–Birthplaces of household heads, Chistochina, 2009.
Birthplace Percentage
Anchorage 4.3%
Batzulnetas 2.2%
Chisana 6.5%
Chistochina 19.6%
Gulkana 2.2%
Koyukuk 2.2%
Mentasta Lake 2.2%
Nabesna River 2.2%
Northway Village 4.3%
Palmer 2.2%
Tanana 2.2%
Tok 2.2%
Yes Bay 2.2%
Other U.S. 43.5%
Foreign 2.2%
Source ADF&G Division of Subsistence household surveys, 2010.
Note “birthplace” means the residence of the parents of the individual
when the individual was born.
CASH EMPLOYMENT CHARACTERISTICS AND MONETARY INCOME
Like in many rural Alaska villages, most cash employment in Chistochina is seasonal; in 2009, 56% of
employed adults worked year-round (Table 2-5). In 2009, most (55%) of the jobs in Chistochina were
with local and tribal governments. Other important employment sectors during the study year were
services, at 21%, and construction, at 11% (Table 2-4). Due to insufficient income data collection, this
study does not provide income information in percentages by individual industry.

21
Table 2-4.–Employment by industry, Chistochina, 2009.
Industry Jobs Households Individuals
Estimated total number 38 18 32
State government total 2.6% 5.6% 3.1%
Handlers, equipment cleaners, helpers, and laborers 2.6% 5.6% 3.1%
Local and tribal governments total 55.3% 72.2% 59.4%
Executive, administrative, managerial 10.5% 22.2% 12.5%
Teachers, librarians, and counselors 2.6% 5.6% 3.1%
Health diagnosing and treating practitioners 2.6% 5.6% 3.1%
Registered nurses, pharmacists, dietitians, therapists, and physician’s assistants 2.6% 5.6% 3.1%
Health technologists, and technicians 2.6% 5.6% 3.1%
Administrative support occupations, including clerical 7.9% 16.7% 9.4%
Service occupations 10.5% 11.1% 6.3%
Construction and extractive occupations 7.9% 16.7% 9.4%
Handlers, equipment cleaners, helpers, and laborers 7.9% 11.1% 9.4%
Construction total 10.5% 22.2% 12.5%
Mechanics and repairers 2.6% 5.6% 3.1%
Handlers, equipment cleaners, helpers, and laborers 7.9% 16.7% 9.4%
Transportation, communication, and utilities total 2.6% 5.6% 3.1%
Construction and extractive occupations 2.6% 5.6% 3.1%
Retail trade total 5.3% 11.1% 6.3%
Technologists and technicians, except health 2.6% 5.6% 3.1%
Marketing and sales occupations 2.6% 5.6% 3.1%
Finance, insurance, and real estate total 2.6% 5.6% 3.1%
Executive, administrative, managerial 2.6% 5.6% 3.1%
Services total 21.1% 22.2% 21.9%
Executive, administrative, managerial 7.9% 11.1% 9.4%
Writers, artists, entertainers, and athletes 2.6% 5.6% 3.1%
Technologists and technicians, except health 2.6% 5.6% 3.1%
Handlers, equipment cleaners, helpers, and laborers 2.6% 5.6% 3.1%
Miscellaneous occupations 5.3% 5.6% 6.3%
Source ADF&G Division of Subsistence household surveys, 2010.
The study found 67 adults over the age of 16 in Chistochina in 2009, and the calculated average length of
employment for all Chistochina adults was approximately 24 weeks or 6 months (Table 2-5). Of the 67
adults in Chistochina, the study found 39 employed. For the employed adults, the mean length of
employment was more, approximately 10 months. On the household level, 67% (or 22 of the 33
households) were employed at some point during the study year. For all 33 households in the community,
the average number of jobs during the study year was about 1. The corresponding number for the 22
employed households was approximately 2 (Table 2-5). Most jobs were located in Chistochina but some
respondents commuted to Glennallen, Gulkana, and Slana for employment. A few respondents were
employed outside the Copper River Basin area.
It is noteworthy that Chistochina residents had an unusual seasonal employment opportunity in 2009
because a mineral exploration company offered nearby seasonal employment for community members
from the summer well into the fall. This employment opportunity has since diminished.

22
Table 2-5.–Employment characteristics, Chistochina, 2009.
Characteristic Chistochina
All adults
Number
67
Mean weeks employed
23.6
Employed adults
Number
39
Percentage
58.2%
Jobs
Number
46
Mean
1.2
Minimum
1
Maximum
3
Months employed
Mean
9.7
Minimum
2
Maximum
12
Percentage employed year-round
56.3%
Mean weeks employed
41.9
Households
Number
33
Employed
Number
22
Percentage
66.7%
Jobs per employed household
Mean
2.1
Minimum
1
Maximum
5
Employed adults
Mean
Employed households
1.8
All households
1.2
Minimum
1
Maximum
3
Source ADF&G Division of Subsistence household surveys, 2010.

23
LEVELS OF PARTICIPATION IN THE HARVESTS AND USES OF WILD RESOURCES
Table 2-6 and Figure 2-2 report the estimated levels of individual participation in the harvest and
processing of wild resources by all Chistochina residents in 2009. Approximately 93% of residents
attempted to harvest resources in 2009. With reference to specific resource categories, 85% of all
residents gathered plants and berries, 49% fished, 30% hunted for birds, and 45% hunted for large land
mammals. Fewer (39%) residents were involved in small land mammal hunting or trapping. In
comparison, 86% of all Chistochina residents processed some resources in 2009. Most residents (70%)
participated in processing plants and berries, followed by 63% of the population participating in fish
processing. A little less (62%) participated in large land mammal processing, and 31% participated in
processing birds.
The study also asked about participation in building fish wheels, sewing skins or cloth and cooking wild
foods. A small number (9%) of Chistochina residents said they had participated in building fish wheels,
but more (35%) had been involved in sewing skins or cloth. In comparison, nearly all (96%) residents had
cooked wild foods (Table 2-6).
Table 2-6.–Participation in subsistence harvesting and processing activities, Chistochina, 2009.
Total number of people 86.8
Birds
Hunt
Number 25.7
Percentage 29.6%
Process
Number 26.9
Percentage 31.0%
Fish
Fish
Number 42.8
Percentage 49.3%
Process
Number 55.0
Percentage 63.4%
Large land mammals
Hunt
Number 39.1
Percentage 45.1%
Process
Number 53.8
Percentage 62.0%
Small land mammals
Hunt or trap
Number 34.2
Percentage 39.4%
Process
Number 31.8
Percentage 36.6%
-continued-

24
Table 2-6.–Page 2 of 2.
Plants
Gather
Number 73.3
Percentage 84.5%
Process
Number 61.1
Percentage 70.4%
Any resource
Attempt to harvest
Number 80.7
Percentage 93.0%
Process
Number 74.6
Percentage 85.9%
Building fish wheels
Number 7.3
Percentage 8.5%
Sewing skins or cloth
Number 30.6
Percentage 35.2%
Cooking wild foods
Number 83.1
Percentage 95.8%
Source ADF&G Division of Subsistence household surveys,
2010.

25
Figure 2-2.–Individual levels of participation in subsistence harvesting and processing activities,
Chistochina, 2009.
RESOURCE HARVEST AND USE PATTERNS
Table 2-7 summarizes resource harvest and use characteristics for Chistochina in 2009, at the household
level. All households used wild resources in 2009, while 96% attempted to harvest a resource and 93%
harvested a resource. The average total harvest was an estimated 522 lb usable weight per household, or
199 lb per capita. On average, households attempted to harvest 10 kinds of resources, harvested 9 kinds of
resources and used an average of 11 kinds of resources. The maximum number of resources used by any
household was 34. In addition, households gave away an average of 3 kinds of resources and received 5
resources. A little over one-half (56%) of the households reported sharing resources with other
households. In comparison, 85% reported receiving a resource, which indicates that wild resources were
shared widely in the community.
29.6%
49.3%
45.1% 39.4%
84.5%
93.0%
31.0%
63.4% 62.0%
36.6%
70.4%
85.9%
0%
10%
20%
30%
40%
50%
60%
70%
80%
90%
100%
Birds Fish Large land
mammals
Small land
mammals
Plants Any resource
Hunt or
fish or
trap or
gather
Process

26
Table 2-7.–Resource harvest and use characteristics, Chistochina, 2009.
Characteristic Chistochina
Mean number of resources used per household 11.2
Minimum 1
Maximum 34
95% confidence limit (±) 12.1%
Median 10
Mean number of resources attempted to harvest per household 9.9
Minimum 0
Maximum 34
95% confidence limit (±) 13.2%
Median 8
Mean number of resources harvested per household 8.5
Minimum 0
Maximum 32
95% confidence limit (±) 14.4%
Median 7
Mean number of resources received per household 4.5
Minimum 0
Maximum 29
95% confidence limit (±) 22.0%
Median 3
Mean number of resources given away per household 3.1
Minimum 0
Maximum 15
95% confidence limit (±) 22.7%
Median 1
Household harvest, pounds
Minimum 0.0
Maximum 1,899.0
Mean 522.1
Median 484.2
Total harvest weight, pounds 17,228.9
Community per capita harvest, pounds 198.5
Percentage using any resource 100%
Percentage attempting to harvest any resource 96%
Percentage harvesting any resource 93%
Percentage receiving any resource 85%
Percentage giving away any resource 56%
Number of households in sample 27
Number of resources available 104
Source ADF&G Division of Subsistence household surveys, 2010.
SPECIES USED AND SEASONAL ROUND
Residents of Chistochina harvest a wide variety of species throughout the year and they often target
specific species during certain seasons of the year, following a cyclical harvest pattern. Chistochina
residents are highly mobile, traveling around the Copper River Basin to harvest resources. Residents use
motorized vehicles, such as airplanes, highway vehicles, snowmachines, and four-wheelers, to reach their
hunting, fishing and gathering areas.
Table 2-8 summarizes the estimated harvest and uses of fish, game, and plant resources. Table 2-9 lists
the top 10 resources harvested, in terms of pounds per capita, and the 10 most used resources by

27
Chistochina households during the study year 2009. Residents of Chistochina harvested an estimated total
of 17,229 lb, or 199 lb per capita of wild resources (Table 2-8). Sockeye salmon, Chinook salmon, and
moose were the top 3 most harvested resources in pounds per capita. In comparison, the top 3 most used
resources in Chistochina households were blueberries, wood, and sockeye salmon (Table 2-9).
The discussion about various wild resources used starts with salmon as it composed the highest
percentage of the total harvest in 2009. During the study year, 85% of the households in Chistochina used
salmon and 52% harvested salmon, most of which was sockeye (Table 2-8). A large percentage of
Chistochina households (85%) used a fish species and a substantial percentage (59%) reported receiving
fish, especially salmon, during the study year (Table 2-8). Most of the salmon were caught with fish
wheels, which are set along the Copper River in proximity to the community. The fish wheels are often
also shared by community members.
Chinook and sockeye salmon are usually the first to arrive in June, and both species continue their runs up
the Copper River into July. Coho salmon, which are present in the Copper River but not as far as
Chistochina, begin to arrive in the Chitina area in late-July, mid-August and continue to run through
September. Some Chistochina residents fish for salmon species such as coho salmon with fish wheels and
rod and reel in other communities along the Copper River or in locations outside the watershed. During
the summer months, many residents also engage in rod and reel fishing in the various lakes around
Chistochina, especially for nonsalmon fish, such as lake trout and burbot. In the winter months, residents
commonly ice fished for other nonsalmon fish, such as Arctic grayling at Copper and Tanada lakes.
Large land mammal hunting is a traditional and popular fall activity that often stretches into the winter.
Most of the hunting takes place using highway vehicles or four-wheelers. Respondents reported that in
2009 there were few moose or caribou nearby, and despite 67% of households attempting to harvest large
land mammals, only 15% were successful. Fewer households (48%) participated in small land mammal
harvesting in 2009, but 44% were successful. Most small land mammal hunting or trapping took place
during the winter, and in numbers of animals taken, the species most harvested were snowshoe hares,
martens, beavers, and lynx (Table 2-8).
Migratory birds travel through the area in fall and spring, stopping to rest along the Copper River. During
the study year, 19% of the households used migratory birds and 11% harvested them. Upland game birds,
such as grouse and ptarmigan, were harvested by Chistochina residents along the Chistochina River and
Boulder Creek throughout the year. During the study year, 59% of the Chistochina households used
upland game birds and 52% reported successful hunting (Table 2-8). Harvesting vegetation, particularly
berries in the summer, is an important activity for Chistochina residents. During the study year, 81% of
households reported harvesting, and 85% reported using berries. Another commonly used vegetation
resource is firewood, which is used for heating homes. During the study year, 67% of households
harvested firewood and 74% used firewood (Table 2-8). In terms of monetary resources, Chistochina
households spent an average of $3,482 on home heating during the study year 2009 (Table 2-10).

28
Table 2-8.–Estimated harvests and uses of fish, game and plant resources, Chistochina, 2009.
Resource
Percentage of households
Harvest weight, poundsa
Harvest amountb
95%
confidence
limit (±)
harvest Use Attempt Harvest Receive Give Total
Mean
household
Per
capita Total Unit
Mean
household
All resources
100.0% 96.3% 92.6% 85.2% 55.6%
17,228.9 522.1 198.5
100.5
18.4
Fish
85.2% 66.7% 66.7% 59.3% 33.3%
12,766.3 386.9 147.1
ind 72.2
22.0
Salmon
85.2% 55.6% 51.9% 55.6% 25.9%
11,370.9 344.6 131.0
1,511.9
45.8
24.2
Chum salmon
0.0% 0.0% 0.0% 0.0% 0.0%
0.0 0.0 0.0
0.0 ind 0.0
0.0
Coho salmon
33.3% 11.1% 7.4% 25.9% 3.7%
321.2 9.7 3.7
36.7 ind 1.1
62.1
Chinook salmon
59.3% 44.4% 40.7% 29.6% 14.8%
2,925.6 88.7 33.7
149.1 ind 4.5
43.8
Pink salmon
0.0% 0.0% 0.0% 0.0% 0.0%
0.0 0.0 0.0
0.0 ind 0.0
0.0
Sockeye salmon
70.4% 51.9% 48.1% 40.7% 22.2%
8,118.0 246.0 93.5
1,320.0 ind 40.0
25.9
Landlocked salmon
3.7% 3.7% 3.7% 0.0% 3.7%
6.1 0.2 0.1
6.1 ind 0.2
87.6
Unknown salmon
7.4% 0.0% 0.0% 7.4% 0.0%
0.0 0.0 0.0
0.0 ind 0.0
0.0
Nonsalmon fish
66.7% 59.3% 55.6% 40.7% 22.2%
1,395.4 42.3 16.1
26.4
36.9
Herring
0.0% 0.0% 0.0% 0.0% 0.0%
0.0 0.0 0.0
0.0 gal 0.0
0.0
Herring roe
0.0% 0.0% 0.0% 0.0% 0.0%
0.0 0.0 0.0
0.0 gal 0.0
0.0
Herring sac roe
0.0% 0.0% 0.0% 0.0% 0.0%
0.0 0.0 0.0
0.0 gal 0.0
0.0
Herring spawn on kelp
0.0% 0.0% 0.0% 0.0% 0.0%
0.0 0.0 0.0
0.0 gal 0.0
0.0
Smelt
0.0% 0.0% 0.0% 0.0% 0.0%
0.0 0.0 0.0
0.0 gal 0.0
0.0
Cod
7.4% 7.4% 7.4% 3.7% 0.0%
14.7 0.4 0.2
3.7 ind 0.1
64.3
Pacific cod (gray)
7.4% 7.4% 7.4% 3.7% 0.0%
14.7 0.4 0.2
3.7 ind 0.1
64.3
Pacific tomcod
0.0% 0.0% 0.0% 0.0% 0.0%
0.0 0.0 0.0
0.0 ind 0.0
0.0
Flounders
0.0% 0.0% 0.0% 0.0% 0.0%
0.0 0.0 0.0
0.0 ind 0.0
0.0
Starry flounder
0.0% 0.0% 0.0% 0.0% 0.0%
0.0 0.0 0.0
0.0 ind 0.0
0.0
Greenlings
7.4% 0.0% 0.0% 7.4% 3.7%
0.0 0.0 0.0
0.0 ind 0.0
0.0
Lingcod
7.4% 0.0% 0.0% 7.4% 3.7%
0.0 0.0 0.0
0.0 ind 0.0
0.0
Halibut
29.6% 7.4% 7.4% 25.9% 7.4%
207.9 6.3 2.4
207.9 lb 6.3
61.2
Arctic lamprey
0.0% 0.0% 0.0% 0.0% 0.0%
0.0 0.0 0.0
0.0 ind 0.0
0.0
Rockfish
7.4% 3.7% 3.7% 7.4% 3.7%
9.8 0.3 0.1
2.4 ind 0.1
87.6
Sculpin
0.0% 0.0% 0.0% 0.0% 0.0%
0.0 0.0 0.0
0.0 ind 0.0
0.0
Burbot
37.0% 29.6% 29.6% 14.8% 11.1%
340.3 10.3 3.9
141.8 ind 4.3
54.4
Char
40.7% 37.0% 33.3% 14.8% 18.5%
288.9 8.8 3.3
168.7 ind 5.1
39.4
Dolly Varden
11.1% 14.8% 11.1% 7.4% 7.4%
39.6 1.2 0.5
44.0 ind 1.3
62.4
Lake trout
40.7% 33.3% 33.3% 14.8% 18.5%
249.3 7.6 2.9
124.7 ind 3.8
37.3
-continued-

29
Table 2-8.–Page 2 of 5.
Resource
Percentage of households
Harvest weight, poundsa
Harvest amountb
95%
confidence
limit (±)
harvest Use Attempt Harvest Receive Give Total
Mean
household
Per
capita Total Unit
Mean
household
Fish, continued
Arctic grayling
40.7% 44.4% 40.7% 11.1% 11.1%
79.6 2.4 0.9
113.7 ind 3.4
27.2
Northern Pike
14.8% 14.8% 14.8% 7.4% 7.4%
294.3 8.9 3.4
105.1 ind 3.2
55.5
Longnose sucker
0.0% 0.0% 0.0% 0.0% 0.0%
0.0 0.0 0.0
0.0 ind 0.0
0.0
Trout
14.8% 11.1% 7.4% 14.8% 3.7%
18.8 0.6 0.2
13.4 ind 0.4
79.8
Cutthroat trout
0.0% 0.0% 0.0% 0.0% 0.0%
0.0 0.0 0.0
0.0 ind 0.0
0.0
Rainbow trout
11.1% 11.1% 7.4% 11.1% 3.7%
18.8 0.6 0.2
13.4 ind 0.4
79.8
Unknown trout
3.7% 0.0% 0.0% 3.7% 0.0%
0.0 0.0 0.0
0.0 ind 0.0
0.0
Whitefishes
29.6% 14.8% 14.8% 25.9% 7.4%
141.2 4.3 1.6
113.7 ind 3.4
56.6
Broad whitefish
0.0% 0.0% 0.0% 0.0% 0.0%
0.0 0.0 0.0
0.0 ind 0.0
0.0
Cisco
0.0% 0.0% 0.0% 0.0% 0.0%
0.0 0.0 0.0
0.0 ind 0.0
0.0
Least cisco
0.0% 0.0% 0.0% 0.0% 0.0%
0.0 0.0 0.0
0.0 ind 0.0
0.0
Humpback whitefish
0.0% 0.0% 0.0% 0.0% 0.0%
0.0 0.0 0.0
0.0 ind 0.0
0.0
Round whitefish
11.1% 7.4% 7.4% 7.4% 3.7%
77.0 2.3 0.9
77.0 ind 2.3
76.9
Unknown whitefish
18.5% 7.4% 7.4% 18.5% 3.7%
64.2 1.9 0.7
36.7 ind 1.1
89.3
Land mammals
85.2% 81.5% 48.1% 59.3% 44.4%
3,469.3 105.1 40.0
14.5
27.9
Large land mammals
74.1% 66.7% 14.8% 59.3% 33.3%
2,200.0 66.7 25.4
0.1
41.2
Bison
0.0% 0.0% 0.0% 0.0% 0.0%
0.0 0.0 0.0
0.0 ind 0.0
0.0
Black bear
0.0% 3.7% 0.0% 0.0% 0.0%
0.0 0.0 0.0
0.0 ind 0.0
0.0
Brown bear
0.0% 7.4% 0.0% 0.0% 0.0%
0.0 0.0 0.0
0.0 ind 0.0
0.0
Caribou
11.1% 14.8% 0.0% 11.1% 3.7%
0.0 0.0 0.0
0.0 ind 0.0
0.0
Deer
0.0% 0.0% 0.0% 0.0% 0.0%
0.0 0.0 0.0
0.0 ind 0.0
0.0
Goat
0.0% 0.0% 0.0% 0.0% 0.0%
0.0 0.0 0.0
0.0 ind 0.0
0.0
Moose
70.4% 63.0% 14.8% 55.6% 33.3%
2,200.0 66.7 25.4
4.9 ind 0.1
41.2
Dall sheep
0.0% 7.4% 0.0% 0.0% 0.0%
0.0 0.0 0.0
0.0 ind 0.0
0.0
Small land mammals
48.1% 48.1% 44.4% 11.1% 25.9%
1,269.3 38.5 14.6
14.4
35.6
Beaver
18.5% 14.8% 14.8% 3.7% 7.4%
495.0 15.0 5.7
33.0 ind 1.0
50.2
Coyote
7.4% 7.4% 7.4% 0.0% 0.0%
0.0 0.0 0.0
13.4 ind 0.4
72.9
Fox
14.8% 11.1% 11.1% 3.7% 0.0%
0.0 0.0 0.0
19.6 ind 0.6
57.1
Red fox
14.8% 11.1% 11.1% 3.7% 0.0%
0.0 0.0 0.0
19.6 ind 0.6
57.1
Red fox–cross phase
7.4% 3.7% 3.7% 3.7% 0.0%
0.0 0.0 0.0
2.4 ind 0.1
87.6
Red fox–red phase
11.1% 11.1% 11.1% 0.0% 0.0%
0.0 0.0 0.0
17.1 ind 0.5
56.6
-continued-

30
Table 2-8.–Page 3 of 5.
Resource
Percentage of households
Harvest weight, poundsa
Harvest amountb
95%
confidence
limit (±)
harvest Use Attempt Harvest Receive Give Total
Mean
household
Per
capita Total Unit
Mean
household
Land mammals, continued
Hare
33.3% 29.6% 29.6% 7.4% 14.8%
559.8 17.0 6.5
279.9 ind 8.5
57.5
Snowshoe hare
33.3% 29.6% 29.6% 7.4% 14.8%
559.8 17.0 6.5
279.9 ind 8.5
57.5
River (land) otter
3.7% 3.7% 3.7% 0.0% 0.0%
0.0 0.0 0.0
1.2 ind 0.0
87.6
Lynx
11.1% 11.1% 11.1% 0.0% 0.0%
132.0 4.0 1.5
33.0 ind 1.0
64.0
Marmot
0.0% 0.0% 0.0% 0.0% 0.0%
0.0 0.0 0.0
0.0 ind 0.0
0.0
Marten
14.8% 11.1% 11.1% 3.7% 0.0%
0.0 0.0 0.0
57.1 ind 1.7
63.1
Mink
7.4% 3.7% 3.7% 3.7% 0.0%
0.0 0.0 0.0
1.2 ind 0.0
87.6
Muskrat
0.0% 0.0% 0.0% 0.0% 0.0%
0.0 0.0 0.0
0.0 ind 0.0
0.0
Porcupine
33.3% 33.3% 29.6% 7.4% 3.7%
82.5 2.5 1.0
18.3 ind 0.6
34.0
Squirrel
0.0% 0.0% 0.0% 0.0% 0.0%
0.0 0.0 0.0
0.0 ind 0.0
0.0
Red (tree) squirrel
0.0% 0.0% 0.0% 0.0% 0.0%
0.0 0.0 0.0
0.0 ind 0.0
0.0
Weasel
3.7% 0.0% 0.0% 3.7% 0.0%
0.0 0.0 0.0
0.0 ind 0.0
0.0
Wolf
7.4% 3.7% 3.7% 3.7% 0.0%
0.0 0.0 0.0
14.7 ind 0.4
87.6
Wolverine
3.7% 3.7% 3.7% 0.0% 0.0%
0.0 0.0 0.0
2.4 ind 0.1
87.6
Birds and eggs
59.3% 55.6% 51.9% 11.1% 14.8%
96.9 2.9 1.1
3.4
29.8
Migratory birds
18.5% 14.8% 11.1% 7.4% 11.1%
37.2 1.1 0.4
0.6
48.6
Ducks
14.8% 11.1% 7.4% 7.4% 3.7%
13.9 0.4 0.2
14.7 ind 0.4
75.9
Canvasback
3.7% 3.7% 3.7% 0.0% 0.0%
2.7 0.1 0.0
2.4 ind 0.1
87.6
Eider
0.0% 0.0% 0.0% 0.0% 0.0%
0.0 0.0 0.0
0.0 ind 0.0
0.0
Spectacled eider
0.0% 0.0% 0.0% 0.0% 0.0%
0.0 0.0 0.0
0.0 ind 0.0
0.0
Goldeneye
3.7% 3.7% 3.7% 0.0% 0.0%
2.0 0.1 0.0
2.4 ind 0.1
87.6
Mallard
3.7% 7.4% 3.7% 0.0% 0.0%
7.3 0.2 0.1
7.3 ind 0.2
87.6
Northern pintail
3.7% 7.4% 3.7% 0.0% 0.0%
2.0 0.1 0.0
2.4 ind 0.1
87.6
Scoter
7.4% 0.0% 0.0% 7.4% 3.7%
0.0 0.0 0.0
0.0 ind 0.0
0.0
Black scoter
7.4% 0.0% 0.0% 7.4% 3.7%
0.0 0.0 0.0
0.0 ind 0.0
0.0
Teal
0.0% 0.0% 0.0% 0.0% 0.0%
0.0 0.0 0.0
0.0 ind 0.0
0.0
Green-winged teal
0.0% 0.0% 0.0% 0.0% 0.0%
0.0 0.0 0.0
0.0 ind 0.0
0.0
Unknown ducks
0.0% 0.0% 0.0% 0.0% 0.0%
0.0 0.0 0.0
0.0 ind 0.0
0.0
Geese
7.4% 7.4% 7.4% 0.0% 7.4%
23.2 0.7 0.3
6.1 ind 0.2
60.9
Brant
0.0% 0.0% 0.0% 0.0% 0.0%
0.0 0.0 0.0
0.0 ind 0.0
0.0
Canada geese
0.0% 0.0% 0.0% 0.0% 0.0%
0.0 0.0 0.0
0.0 ind 0.0
0.0
-continued-

31
Table 2-8.–Page 4 of 5.
Resource
Percentage of households
Harvest weight, poundsa
Harvest amountb
95%
confidence
limit (±)
harvest Use Attempt Harvest Receive Give Total
Mean
household
Per
capita Total Unit
Mean
household
Birds and eggs, continued
Cacklers
0.0% 0.0% 0.0% 0.0% 0.0%
0.0 0.0 0.0
0.0 ind 0.0
0.0
Lesser Canada geese
(taverner/parvipes)
0.0% 0.0% 0.0% 0.0% 0.0%
0.0 0.0 0.0
0.0 ind 0.0
0.0
Unknown Canada geese
0.0% 0.0% 0.0% 0.0% 0.0%
0.0 0.0 0.0
0.0 ind 0.0
0.0
Emperor geese
0.0% 0.0% 0.0% 0.0% 0.0%
0.0 0.0 0.0
0.0 ind 0.0
0.0
Snow geese
3.7% 3.7% 3.7% 0.0% 3.7%
11.0 0.3 0.1
3.7 ind 0.1
87.6
White-fronted geese
0.0% 0.0% 0.0% 0.0% 0.0%
0.0 0.0 0.0
0.0 ind 0.0
0.0
Unknown geese
3.7% 3.7% 3.7% 0.0% 3.7%
12.2 0.4 0.1
2.4 ind 0.1
87.6
Swan
0.0% 0.0% 0.0% 0.0% 0.0%
0.0 0.0 0.0
0.0 ind 0.0
0.0
Tundra swan (whistling)
0.0% 0.0% 0.0% 0.0% 0.0%
0.0 0.0 0.0
0.0 ind 0.0
0.0
Crane
0.0% 0.0% 0.0% 0.0% 0.0%
0.0 0.0 0.0
0.0 ind 0.0
0.0
Sandhill crane
0.0% 0.0% 0.0% 0.0% 0.0%
0.0 0.0 0.0
0.0 ind 0.0
0.0
Other birds
59.3% 55.6% 51.9% 11.1% 14.8%
59.8 1.8 0.7
92.7 ind 2.8
25.7
Upland game birds
59.3% 55.6% 51.9% 11.1% 14.8%
59.8 1.8 0.7
92.7 ind 2.8
25.7
Grouse
59.3% 55.6% 51.9% 11.1% 14.8%
47.1 1.4 0.5
67.3 ind 2.0
23.2
Spruce grouse
59.3% 55.6% 51.9% 11.1% 14.8%
47.1 1.4 0.5
67.3 ind 2.0
23.2
Ptarmigan
18.5% 18.5% 18.5% 3.7% 3.7%
12.7 0.4 0.1
25.4 ind 0.8
41.7
Bird eggs
0.0% 0.0% 0.0% 0.0% 0.0%
0.0 0.0 0.0
0.0 ind 0.0
0.0
Duck eggs
0.0% 0.0% 0.0% 0.0% 0.0%
0.0 0.0 0.0
0.0 ind 0.0
0.0
Geese eggs
0.0% 0.0% 0.0% 0.0% 0.0%
0.0 0.0 0.0
0.0 ind 0.0
0.0
Seabird and loon eggs
0.0% 0.0% 0.0% 0.0% 0.0%
0.0 0.0 0.0
0.0 ind 0.0
0.0
Gull eggs
0.0% 0.0% 0.0% 0.0% 0.0%
0.0 0.0 0.0
0.0 gal 0.0
0.0
Unknown eggs
0.0% 0.0% 0.0% 0.0% 0.0%
0.0 0.0 0.0
0.0 gal 0.0
0.0
Marine invertebrates
11.1% 3.7% 3.7% 7.4% 0.0%
36.7 1.1 0.4
0.4
87.6
Clams
7.4% 3.7% 3.7% 3.7% 0.0%
36.7 1.1 0.4
12.2 lb 0.4
87.6
Freshwater clams
0.0% 0.0% 0.0% 0.0% 0.0%
0.0 0.0 0.0
0.0 lb 0.0
0.0
Razor clams
7.4% 3.7% 3.7% 3.7% 0.0%
36.7 1.1 0.4
12.2 lb 0.4
87.6
Crabs
3.7% 0.0% 0.0% 3.7% 0.0%
0.0 0.0 0.0
0.0
0.0
Dungeness crab
0.0% 0.0% 0.0% 0.0% 0.0%
0.0 0.0 0.0
0.0 ind 0.0
0.0
King crab
3.7% 0.0% 0.0% 3.7% 0.0%
0.0 0.0 0.0
0.0 gal 0.0
0.0
Tanner crab
0.0% 0.0% 0.0% 0.0% 0.0%
0.0 0.0 0.0
0.0 gal 0.0
0.0
-continued-

32
Table 2-8.–Page 5 of 5.
Resource
Percentage of households
Harvest weight, poundsa
Harvest amountb
95%
confidence
limit (±)
harvest Use Attempt Harvest Receive Give Total
Mean
household
Per
capita Total Unit
Mean
household
Marine invertebrates, continued
Octopus
0.0% 0.0% 0.0% 0.0% 0.0%
0.0 0.0 0.0
0.0 gal 0.0
0.0
Shrimp
0.0% 0.0% 0.0% 0.0% 0.0%
0.0 0.0 0.0
0.0 gal 0.0
0.0
Squid
0.0% 0.0% 0.0% 0.0% 0.0%
0.0 0.0 0.0
0.0 gal 0.0
0.0
Vegetation
96.3% 96.3% 92.6% 29.6% 29.6%
859.7 26.1 9.9
10.0
15.8
Berries
85.2% 85.2% 81.5% 18.5% 29.6%
803.6 24.4 9.3
200.9 gal 6.1
14.2
Blueberry
77.8% 81.5% 74.1% 18.5% 22.2%
303.1 9.2 3.5
75.8 gal 2.3
14.9
Lowbush cranberry
66.7% 70.4% 66.7% 11.1% 29.6%
175.2 5.3 2.0
43.8 gal 1.3
16.2
Highbush cranberry
40.7% 40.7% 40.7% 7.4% 14.8%
93.9 2.8 1.1
23.5 gal 0.7
24.3
Crowberry
3.7% 3.7% 3.7% 0.0% 0.0%
4.9 0.1 0.1
1.2 gal 0.0
87.6
Raspberry
29.6% 37.0% 29.6% 7.4% 7.4%
177.7 5.4 2.0
44.4 gal 1.3
36.1
Salmonberry
3.7% 3.7% 3.7% 3.7% 3.7%
9.8 0.3 0.1
2.4 gal 0.1
87.6
Other wild berry
3.7% 7.4% 3.7% 0.0% 0.0%
39.1 1.2 0.5
9.8 gal 0.3
87.6
Plants/greens/mushrooms
22.2% 22.2% 22.2% 3.7% 3.7%
56.1 1.7 0.6
19.0 gal 0.6
64.1
Hudson’s Bay tea
7.4% 7.4% 7.4% 3.7% 3.7%
0.8 0.0 0.0
0.8 gal 0.0
71.6
Wild rose hips
11.1% 11.1% 11.1% 0.0% 0.0%
49.6 1.5 0.6
12.4 gal 0.4
70.6
Other wild greens
3.7% 3.7% 3.7% 0.0% 0.0%
1.2 0.0 0.0
1.2 gal 0.0
87.6
Unknown mushrooms
14.8% 18.5% 14.8% 3.7% 3.7%
4.3 0.1 0.0
4.3 gal 0.1
56.3
Fireweed
3.7% 3.7% 3.7% 0.0% 0.0%
0.3 0.0 0.0
0.3 gal 0.0
87.6
Wood
74.1% 66.7% 66.7% 14.8% 7.4%
0.0 0.0 0.0
109.4 cord 3.3
17.0
Roots 3.7% 3.7% 3.7% 0.0% 0.0% 0.0 0.0 0.0 1.2 qrt 0.0 87.6
Source ADF&G Division of Subsistence household surveys, 2010.
a. Resources that have a value greater than zero for the percentage of households harvesting, but that give a total harvest weight equal to zero are not
typically eaten and therefore no conversion has been made from the amount harvested to edible weight. For example, 67% of households harvested wood but a
value of zero is given for the total harvest weight.
b. Summary rows that include incompatible units of measure have been left blank.
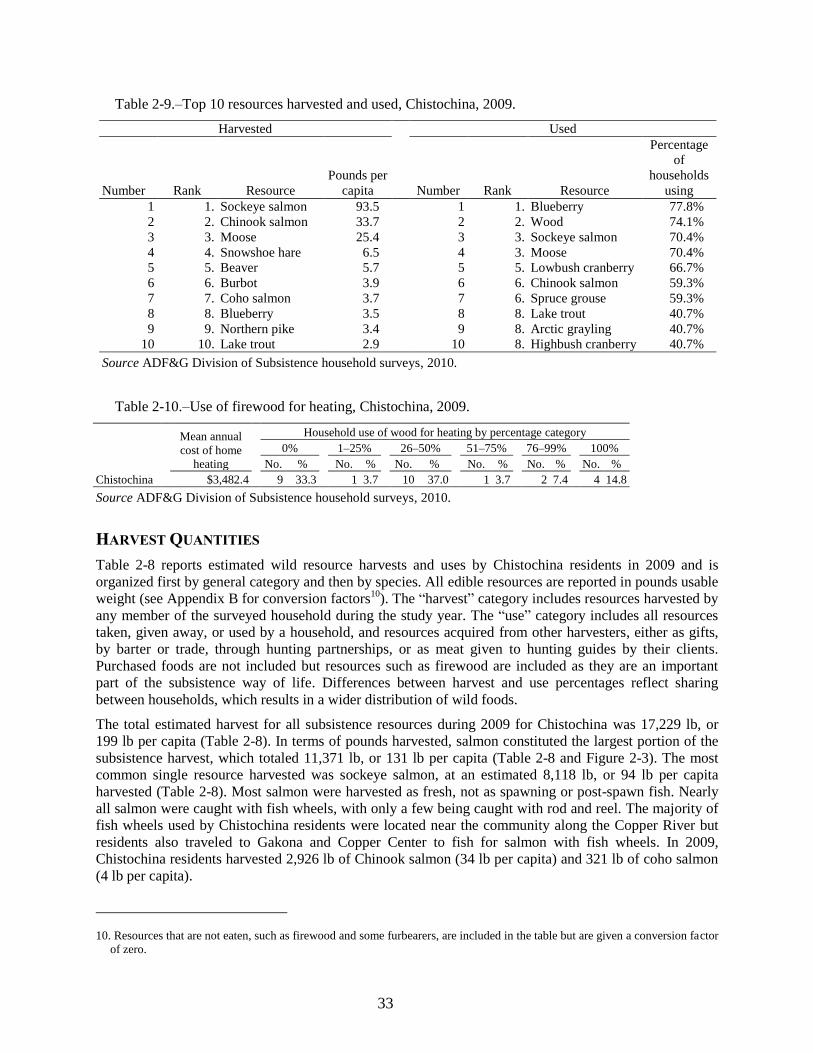
33
Table 2-9.–Top 10 resources harvested and used, Chistochina, 2009.
Harvested
Used
Number Rank Resource
Pounds per
capita Number Rank Resource
Percentage
of
households
using
1 1. Sockeye salmon 93.5
1 1. Blueberry 77.8%
2 2. Chinook salmon 33.7
2 2. Wood 74.1%
3 3. Moose 25.4
3 3. Sockeye salmon 70.4%
4 4. Snowshoe hare 6.5
4 3. Moose 70.4%
5 5. Beaver 5.7
5 5. Lowbush cranberry 66.7%
6 6. Burbot 3.9
6 6. Chinook salmon 59.3%
7 7. Coho salmon 3.7
7 6. Spruce grouse 59.3%
8 8. Blueberry 3.5
8 8. Lake trout 40.7%
9 9. Northern pike 3.4
9 8. Arctic grayling 40.7%
10 10. Lake trout 2.9 10 8. Highbush cranberry 40.7%
Source ADF&G Division of Subsistence household surveys, 2010.
Table 2-10.–Use of firewood for heating, Chistochina, 2009.
Chistochina
Mean annual
cost of home
heating
Household use of wood for heating by percentage category
0%
1–25%
26–50%
51–75%
76–99%
100%
No. %
No. %
No. %
No. %
No. %
No. %
$3,482.4 9 33.3 1 3.7 10 37.0 1 3.7 2 7.4 4 14.8
Source ADF&G Division of Subsistence household surveys, 2010.
HARVEST QUANTITIES
Table 2-8 reports estimated wild resource harvests and uses by Chistochina residents in 2009 and is
organized first by general category and then by species. All edible resources are reported in pounds usable
weight (see Appendix B for conversion factors10
). The “harvest” category includes resources harvested by
any member of the surveyed household during the study year. The “use” category includes all resources
taken, given away, or used by a household, and resources acquired from other harvesters, either as gifts,
by barter or trade, through hunting partnerships, or as meat given to hunting guides by their clients.
Purchased foods are not included but resources such as firewood are included as they are an important
part of the subsistence way of life. Differences between harvest and use percentages reflect sharing
between households, which results in a wider distribution of wild foods.
The total estimated harvest for all subsistence resources during 2009 for Chistochina was 17,229 lb, or
199 lb per capita (Table 2-8). In terms of pounds harvested, salmon constituted the largest portion of the
subsistence harvest, which totaled 11,371 lb, or 131 lb per capita (Table 2-8 and Figure 2-3). The most
common single resource harvested was sockeye salmon, at an estimated 8,118 lb, or 94 lb per capita
harvested (Table 2-8). Most salmon were harvested as fresh, not as spawning or post-spawn fish. Nearly
all salmon were caught with fish wheels, with only a few being caught with rod and reel. The majority of
fish wheels used by Chistochina residents were located near the community along the Copper River but
residents also traveled to Gakona and Copper Center to fish for salmon with fish wheels. In 2009,
Chistochina residents harvested 2,926 lb of Chinook salmon (34 lb per capita) and 321 lb of coho salmon
(4 lb per capita).
10. Resources that are not eaten, such as firewood and some furbearers, are included in the table but are given a conversion factor
of zero.

34
Land mammals (Table 2-8 and Figure 2-3) were the other major sources of wild foods for Chistochina
residents in 2009, with an estimated 3,469 total lb harvested, or 40 lb per capita. In terms of total pounds
harvested, large land mammals made up 13%, and small land mammals 7% of the total pounds harvested
(Figure 2-3). The total harvest of large land mammals was 2,200 lb, or 25 lb per capita, while the total
harvest of small land mammals for food consumption was 1,269 lb, or 15 lb per capita (Table 2-8). It is
noteworthy that moose was the only large land mammal species successfully harvested by Chistochina
residents in 2009; all harvest efforts for caribou, sheep, and bears were unsuccessful. The study also
found that while 70% of Chistochina households reported to have used moose during 2009, only 15%
were successful in harvesting the species. This indicates that the resource was widely shared in the
community. In terms of pounds per capita harvested, moose ranked third on the list of top 10 resources
harvested, and fourth on the top 10 list of percentage of Chistochina households using resources (Table 2-
9).
In 2009 nearly one-half (48%) of Chistochina households said they had used small land mammals, and a
little bit less (44%) successfully harvested some (Table 2-8). In terms of total pounds harvested,
snowshoe hares made up the largest portion totaling at 560 lb (or 7 lb per capita harvested) followed by
beavers (495 lb, or 6 lb per capita harvested) (Table 2-8 and Figure 2-4). It is also noteworthy that 33% of
Chistochina households used porcupines and 30% were successful in harvesting them regardless of the
total pounds harvested being substantially less than snowshoe hares or beavers.
Figure 2-3.–Chistochina composition of wild resource harvests, pounds usable weight, 2009.
Salmon
66%
Nonsalmon fish
8%
Large land
mammals
13%
Small land
mammals
7%
Birds and eggs
1%
Marine
invertebrates
<1%
Vegetation
5%
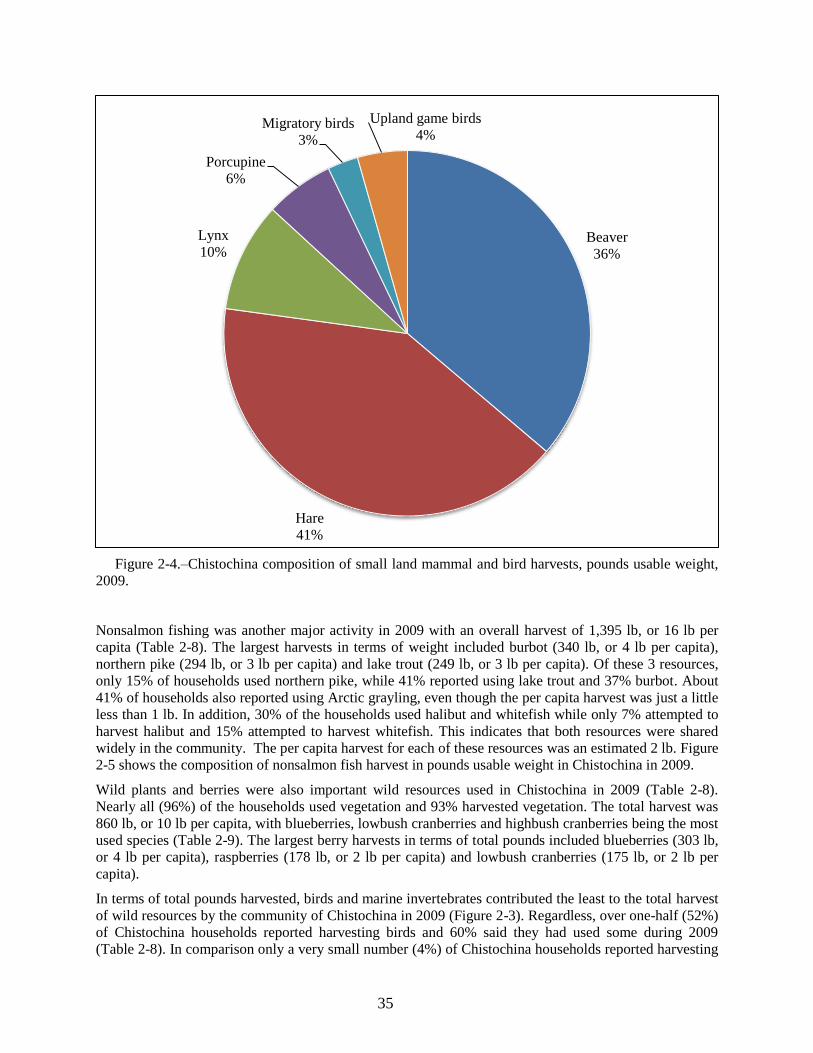
35
Figure 2-4.–Chistochina composition of small land mammal and bird harvests, pounds usable weight,
2009.
Nonsalmon fishing was another major activity in 2009 with an overall harvest of 1,395 lb, or 16 lb per
capita (Table 2-8). The largest harvests in terms of weight included burbot (340 lb, or 4 lb per capita),
northern pike (294 lb, or 3 lb per capita) and lake trout (249 lb, or 3 lb per capita). Of these 3 resources,
only 15% of households used northern pike, while 41% reported using lake trout and 37% burbot. About
41% of households also reported using Arctic grayling, even though the per capita harvest was just a little
less than 1 lb. In addition, 30% of the households used halibut and whitefish while only 7% attempted to
harvest halibut and 15% attempted to harvest whitefish. This indicates that both resources were shared
widely in the community. The per capita harvest for each of these resources was an estimated 2 lb. Figure
2-5 shows the composition of nonsalmon fish harvest in pounds usable weight in Chistochina in 2009.
Wild plants and berries were also important wild resources used in Chistochina in 2009 (Table 2-8).
Nearly all (96%) of the households used vegetation and 93% harvested vegetation. The total harvest was
860 lb, or 10 lb per capita, with blueberries, lowbush cranberries and highbush cranberries being the most
used species (Table 2-9). The largest berry harvests in terms of total pounds included blueberries (303 lb,
or 4 lb per capita), raspberries (178 lb, or 2 lb per capita) and lowbush cranberries (175 lb, or 2 lb per
capita).
In terms of total pounds harvested, birds and marine invertebrates contributed the least to the total harvest
of wild resources by the community of Chistochina in 2009 (Figure 2-3). Regardless, over one-half (52%)
of Chistochina households reported harvesting birds and 60% said they had used some during 2009
(Table 2-8). In comparison only a very small number (4%) of Chistochina households reported harvesting
Beaver
36%
Hare
41%
Lynx
10%
Porcupine
6%
Migratory birds
3%
Upland game birds
4%
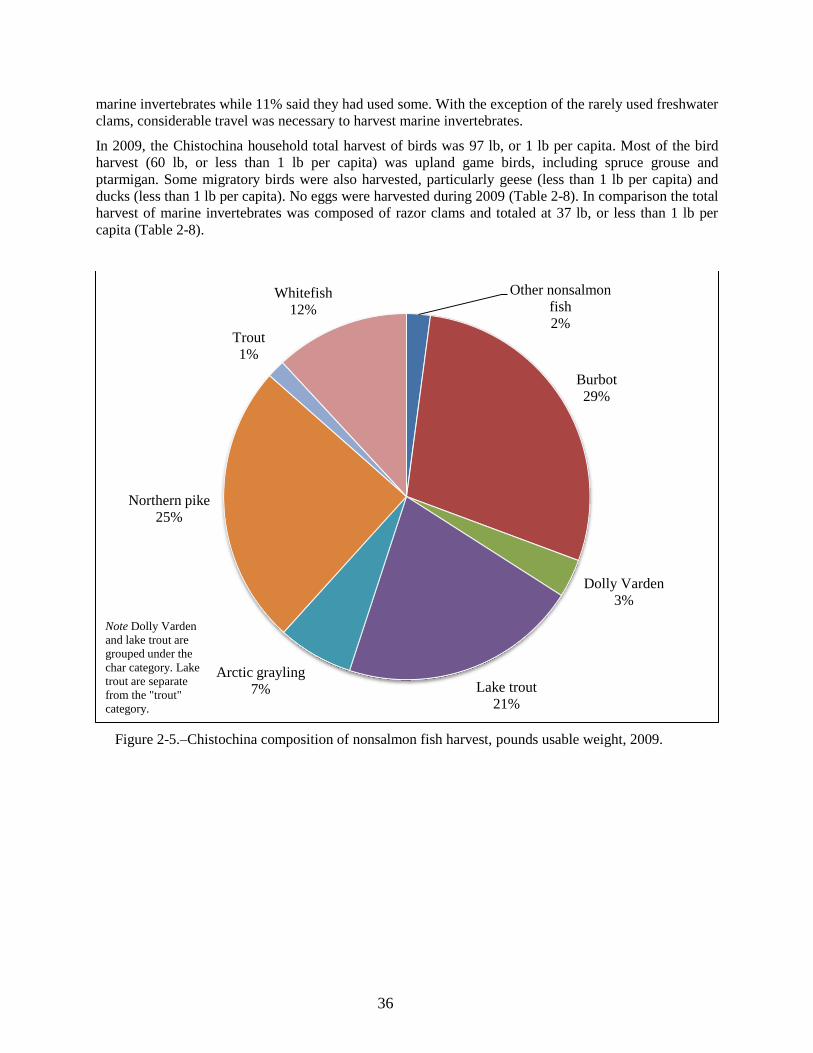
36
marine invertebrates while 11% said they had used some. With the exception of the rarely used freshwater
clams, considerable travel was necessary to harvest marine invertebrates.
In 2009, the Chistochina household total harvest of birds was 97 lb, or 1 lb per capita. Most of the bird
harvest (60 lb, or less than 1 lb per capita) was upland game birds, including spruce grouse and
ptarmigan. Some migratory birds were also harvested, particularly geese (less than 1 lb per capita) and
ducks (less than 1 lb per capita). No eggs were harvested during 2009 (Table 2-8). In comparison the total
harvest of marine invertebrates was composed of razor clams and totaled at 37 lb, or less than 1 lb per
capita (Table 2-8).
Figure 2-5.–Chistochina composition of nonsalmon fish harvest, pounds usable weight, 2009.
Other nonsalmon
fish
2%
Burbot
29%
Dolly Varden
3%
Lake trout
21%
Arctic grayling
7%
Northern pike
25%
Trout
1%
Whitefish
12%
Note Dolly Varden
and lake trout are
grouped under the
char category. Lake
trout are separate
from the "trout"
category.

37
SHARING AND RECEIVING WILD RESOURCES
In Chistochina in 2009, the maximum number of resources used by a household was 34, and the average
number of resources harvested per household was 9 resources (Table 2-7). Estimates of sharing indicated
that 85% of households received wild resources from other households and 56% of households gave some
resources away. Households received an average of 5 resources and gave away an average of 3 resources
(Table 2-7). Vegetation was the most used resource category and overall resources in the category were
among the most commonly shared with 30% of households giving away and 30% of households receiving
some vegetation resources (Table 2-8).
Fish and land mammals were the 2 resource categories from which most (59%) Chistochina households
reported receiving some resources. In comparison, 44% of Chistochina households reported giving away
some land mammal resources while 33% reported giving away some fish resources (Table 2-8). This
indicates that land mammals were the most shared resource category in Chistochina during the study year
2009. At the species level, moose was the most widely shared land mammal species with 56% of
households receiving and 33% giving away moose (Table 2-8). One explanation for the large use
percentage of moose is that the community had an agreement with local hunting guides who provided
meat to residents. It should also be noted that community members attempted to harvest a potlatch
moose.11
With regards to nonsalmon fish species, it is noteworthy that 26% of Chistochina households reported
receiving both halibut and whitefish, while only 7% reported giving away either species. With only 7% of
Chistochina households reporting halibut harvest, and 15% reporting whitefish harvest, it is likely that at
least some of these resources were received from outside the community (Table 2-8). In addition to
already mentioned resource categories, estimates of sharing suggest that Chistochina residents shared
some migratory and upland game birds within the community but also with households in other
communities. In comparison, it is likely that some Chistochina residents received marine invertebrates
from outside the community (Table 2-8).
USE AND HARVEST CHARACTERISTICS BY RESOURCE CATEGORY
SALMON
For Chistochina residents, salmon comprised 66% of the wild resource harvest in pounds in 2009 (Figure
2-3). Most (8,118 lb or 71%) of this harvest was sockeye salmon (Figure 2-6, Table 2-8). Chinook salmon
made up 26% (2,926 lb) of the salmon harvest, coho salmon 3% (321 lb), and landlocked salmon, less
than 1%. The landlocked salmon harvested by Chistochina residents in 2009 were sockeye salmon, which
are present in Copper Lake.
During the study year, Chistochina residents harvested most (93% of the total harvest) of their salmon
with fish wheels. Only about 7% of the salmon harvest was caught with rod and reel (Table 2-11). The
respondents noted that the community has a history of sharing fish wheels, and that some of the fish
wheels continue to be shared. The respondents also commented that the joint use of a fish wheel is a way
of sharing even though the study did not specifically ask about that kind of sharing.
11. According to Haynes and Simeone (2007:74–77), potlatches are an Athabascan tradition to memorialize certain life changing
transitions as well as to meditate certain conflicts with a ritual distribution of gifts. Nowadays these gifts can, for example, be
money, beaded items such as mittens, blankets, or rifles. A potlatch may take place after a life changing event such as a young
person’s first successful harvest of food or to honor and memorialize the death of an individual. One of the primary
obligations of the hosts of the potlatch is to provide food for the guests and families will harvest and prepare wild resources
especially for the potlatch. Potlatches were once considered as primarily social events in some anthropological literature, but
in the more recent research they are described to have spiritual or religious overtones as well.

38
In 2009, Chinook and sockeye salmon arrived in the Copper River around Chistochina in early June and
Chistochina residents continued to fish for both species through the summer. Most of the coho salmon
was harvested with rod and reel, and because no household reported fishing for coho salmon in other
communities along the Copper River, it is likely that the fishing took place outside the watershed. Several
respondents commented that they had been seeing less salmon in the Copper River in the past few years,
and that the quality of the fish was deteriorating. Some respondents pointed out that the salmon seemed
smaller, less oily, and appeared to have mushier flesh than before. Based on the respondents’ comments
on the survey, it seems that Chistochina respondents were nevertheless able to harvest what they needed
for subsistence salmon in 2009.
Figure 2-6.–Chistochina composition of salmon harvest, pounds usable weight, 2009.
Coho salmon
3%
Chinook salmon
26%
Sockeye salmon
71%
Landlocked salmon
<1%

39
Table 2-11.–Estimated percentages of salmon harvested by gear type, resource and total harvest, Chistochina, 2009.
Resource
Percentage
base
Removed from
commercial catch
Subsistence methods
Rod and reel
Any method Dip net
Fish wheel
Other
subsistence gear
Any subsistence
gear
Number Pounds Number Pounds Number Pounds Number Pounds Number Pounds Number Pounds Number Pounds
Salmon Gear type
0.0% 0.0%
0.0% 0.0%
100.0% 100.0%
0.0% 0.0%
100.0% 100.0%
100.0% 100.0%
100.0% 100.0%
Resource
0.0% 0.0%
0.0% 0.0%
93.4% 93.4%
0.0% 0.0%
93.4% 93.4%
6.6% 6.6%
100.0% 100.0%
Total
0.0% 0.0%
0.0% 0.0%
93.4% 93.4%
0.0% 0.0%
93.4% 93.4%
6.6% 6.6%
100.0% 100.0%
Chum
salmon Gear type
0.0% 0.0%
0.0% 0.0%
0.0% 0.0%
0.0% 0.0%
0.0% 0.0%
0.0% 0.0%
0.0% 0.0%
Resource
0.0% 0.0%
0.0% 0.0%
0.0% 0.0%
0.0% 0.0%
0.0% 0.0%
0.0% 0.0%
0.0% 0.0%
Total
0.0% 0.0%
0.0% 0.0%
0.0% 0.0%
0.0% 0.0%
0.0% 0.0%
0.0% 0.0%
0.0% 0.0%
Coho
salmon Gear type
0.0% 0.0%
0.0% 0.0%
0.0% 0.0%
0.0% 0.0%
0.0% 0.0%
36.6% 42.6%
2.4% 2.8%
Resource
0.0% 0.0%
0.0% 0.0%
0.0% 0.0%
0.0% 0.0%
0.0% 0.0%
100.0% 100.0%
100.0% 100.0%
Total
0.0% 0.0%
0.0% 0.0%
0.0% 0.0%
0.0% 0.0%
0.0% 0.0%
2.4% 2.8%
2.4% 2.8%
Chinook
salmon Gear type
0.0% 0.0%
0.0% 0.0%
9.7% 25.3%
0.0% 0.0%
9.7% 25.3%
12.2% 31.8%
9.9% 25.7%
Resource
0.0% 0.0%
0.0% 0.0%
91.8% 91.8%
0.0% 0.0%
91.8% 91.8%
8.2% 8.2%
100.0% 100.0%
Total
0.0% 0.0%
0.0% 0.0%
9.1% 23.6%
0.0% 0.0%
9.1% 23.6%
0.8% 2.1%
9.9% 25.7%
Pink salmon Gear type
0.0% 0.0%
0.0% 0.0%
0.0% 0.0%
0.0% 0.0%
0.0% 0.0%
0.0% 0.0%
0.0% 0.0%
Resource
0.0% 0.0%
0.0% 0.0%
0.0% 0.0%
0.0% 0.0%
0.0% 0.0%
0.0% 0.0%
0.0% 0.0%
Total
0.0% 0.0%
0.0% 0.0%
0.0% 0.0%
0.0% 0.0%
0.0% 0.0%
0.0% 0.0%
0.0% 0.0%
Sockeye
salmon Gear type
0.0% 0.0%
0.0% 0.0%
90.3% 73.8%
0.0% 0.0%
90.3% 73.8%
45.1% 36.9%
87.3% 71.4%
Resource
0.0% 0.0%
0.0% 0.0%
96.6% 96.6%
0.0% 0.0%
96.6% 96.6%
3.4% 3.4%
100.0% 100.0%
Total
0.0% 0.0%
0.0% 0.0%
84.3% 68.9%
0.0% 0.0%
84.3% 68.9%
3.0% 2.4%
87.3% 71.4%
Landlocked
salmon Gear type
0.0% 0.0%
0.0% 0.0%
0.0% 0.0%
0.0% 0.0%
0.0% 0.0%
6.1% 0.8%
0.4% 0.1%
Resource
0.0% 0.0%
0.0% 0.0%
0.0% 0.0%
0.0% 0.0%
0.0% 0.0%
100.0% 100.0%
100.0% 100.0%
Total
0.0% 0.0%
0.0% 0.0%
0.0% 0.0%
0.0% 0.0%
0.0% 0.0%
0.4% 0.1%
0.4% 0.1%
Unknown
salmon Gear type
0.0% 0.0%
0.0% 0.0%
0.0% 0.0%
0.0% 0.0%
0.0% 0.0%
0.0% 0.0%
0.0% 0.0%
Resource
0.0% 0.0%
0.0% 0.0%
0.0% 0.0%
0.0% 0.0%
0.0% 0.0%
0.0% 0.0%
0.0% 0.0%
Total
0.0% 0.0%
0.0% 0.0%
0.0% 0.0%
0.0% 0.0%
0.0% 0.0%
0.0% 0.0%
0.0% 0.0%
Source ADF&G Division of Subsistence household surveys, 2010.
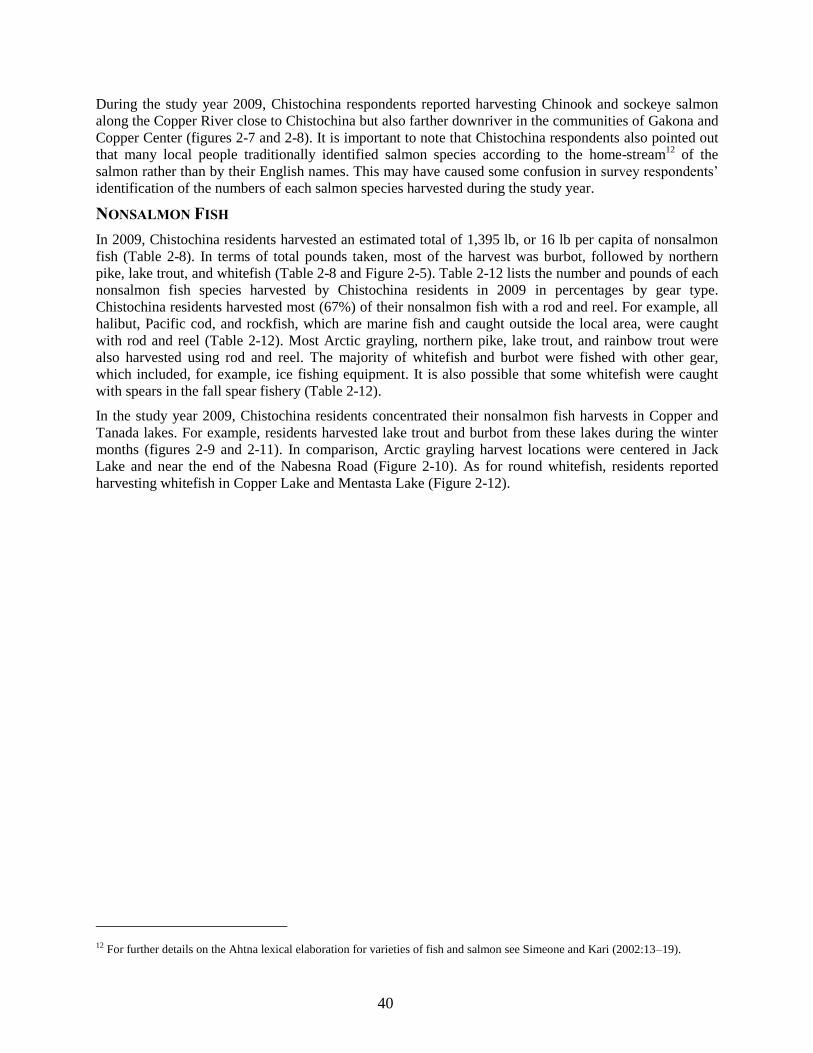
40
During the study year 2009, Chistochina respondents reported harvesting Chinook and sockeye salmon
along the Copper River close to Chistochina but also farther downriver in the communities of Gakona and
Copper Center (figures 2-7 and 2-8). It is important to note that Chistochina respondents also pointed out
that many local people traditionally identified salmon species according to the home-stream12
of the
salmon rather than by their English names. This may have caused some confusion in survey respondents’
identification of the numbers of each salmon species harvested during the study year.
NONSALMON FISH
In 2009, Chistochina residents harvested an estimated total of 1,395 lb, or 16 lb per capita of nonsalmon
fish (Table 2-8). In terms of total pounds taken, most of the harvest was burbot, followed by northern
pike, lake trout, and whitefish (Table 2-8 and Figure 2-5). Table 2-12 lists the number and pounds of each
nonsalmon fish species harvested by Chistochina residents in 2009 in percentages by gear type.
Chistochina residents harvested most (67%) of their nonsalmon fish with a rod and reel. For example, all
halibut, Pacific cod, and rockfish, which are marine fish and caught outside the local area, were caught
with rod and reel (Table 2-12). Most Arctic grayling, northern pike, lake trout, and rainbow trout were
also harvested using rod and reel. The majority of whitefish and burbot were fished with other gear,
which included, for example, ice fishing equipment. It is also possible that some whitefish were caught
with spears in the fall spear fishery (Table 2-12).
In the study year 2009, Chistochina residents concentrated their nonsalmon fish harvests in Copper and
Tanada lakes. For example, residents harvested lake trout and burbot from these lakes during the winter
months (figures 2-9 and 2-11). In comparison, Arctic grayling harvest locations were centered in Jack
Lake and near the end of the Nabesna Road (Figure 2-10). As for round whitefish, residents reported
harvesting whitefish in Copper Lake and Mentasta Lake (Figure 2-12).
12 For further details on the Ahtna lexical elaboration for varieties of fish and salmon see Simeone and Kari (2002:13–19).
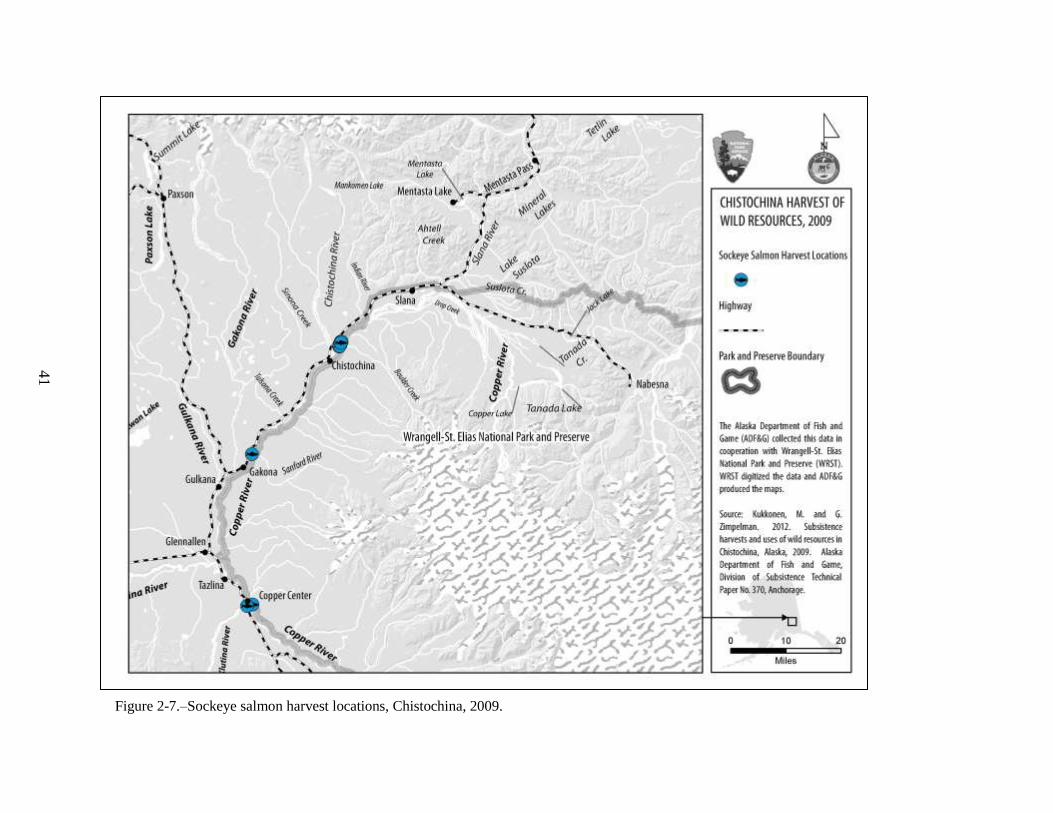
41
Figure 2-7.–Sockeye salmon harvest locations, Chistochina, 2009.

42
Figure 2-8.–Chinook salmon harvest locations, Chistochina, 2009.

43
Table 2-12.–Estimated percentages of nonsalmon fish harvested by gear type, resource, and total harvest, Chistochina, 2009.
Resource
Percentage
base
Removed from
commercial catch
Subsistence methods
Rod and reel
Any method Gillnet or seine
Other
Subsistence gear,
any method
Number Pounds Number Pounds Number Pounds Number Pounds Number Pounds Number Pounds
Nonsalmon fish Gear type
0.0% 0.0%
100.0% 100.0%
100.0% 100.0%
100.0% 100.0%
100.0% 100.0%
100.0% 100.0%
Resource
0.0% 0.0%
1.5% 1.5%
31.9% 31.9%
33.4% 33.4%
66.6% 66.6%
100.0% 100.0%
Total
0.0% 0.0%
1.5% 1.5%
31.9% 31.9%
33.4% 33.4%
66.6% 66.6%
100.0% 100.0%
Herring Gear type
0.0% 0.0%
0.0% 0.0%
0.0% 0.0%
0.0% 0.0%
0.0% 0.0%
0.0% 0.0%
Resource
0.0% 0.0%
0.0% 0.0%
0.0% 0.0%
0.0% 0.0%
0.0% 0.0%
0.0% 0.0%
Total
0.0% 0.0%
0.0% 0.0%
0.0% 0.0%
0.0% 0.0%
0.0% 0.0%
0.0% 0.0%
Herring sac roe Gear type
0.0% 0.0%
0.0% 0.0%
0.0% 0.0%
0.0% 0.0%
0.0% 0.0%
0.0% 0.0%
Resource
0.0% 0.0%
0.0% 0.0%
0.0% 0.0%
0.0% 0.0%
0.0% 0.0%
0.0% 0.0%
Total
0.0% 0.0%
0.0% 0.0%
0.0% 0.0%
0.0% 0.0%
0.0% 0.0%
0.0% 0.0%
Herring spawn on
kelp
Gear type
0.0% 0.0%
0.0% 0.0%
0.0% 0.0%
0.0% 0.0%
0.0% 0.0%
0.0% 0.0%
Resource
0.0% 0.0%
0.0% 0.0%
0.0% 0.0%
0.0% 0.0%
0.0% 0.0%
0.0% 0.0%
Total
0.0% 0.0%
0.0% 0.0%
0.0% 0.0%
0.0% 0.0%
0.0% 0.0%
0.0% 0.0%
Smelt Gear type
0.0% 0.0%
0.0% 0.0%
0.0% 0.0%
0.0% 0.0%
0.0% 0.0%
0.0% 0.0%
Resource
0.0% 0.0%
0.0% 0.0%
0.0% 0.0%
0.0% 0.0%
0.0% 0.0%
0.0% 0.0%
Total
0.0% 0.0%
0.0% 0.0%
0.0% 0.0%
0.0% 0.0%
0.0% 0.0%
0.0% 0.0%
Pacific cod (gray) Gear type
0.0% 0.0%
0.0% 0.0%
0.0% 0.0%
0.0% 0.0%
0.6% 1.6%
0.4% 1.1%
Resource
0.0% 0.0%
0.0% 0.0%
0.0% 0.0%
0.0% 0.0%
100.0% 100.0%
100.0% 100.0%
Total
0.0% 0.0%
0.0% 0.0%
0.0% 0.0%
0.0% 0.0%
0.4% 1.1%
0.4% 1.1%
Pacific tomcod Gear type
0.0% 0.0%
0.0% 0.0%
0.0% 0.0%
0.0% 0.0%
0.0% 0.0%
0.0% 0.0%
Resource
0.0% 0.0%
0.0% 0.0%
0.0% 0.0%
0.0% 0.0%
0.0% 0.0%
0.0% 0.0%
Total
0.0% 0.0%
0.0% 0.0%
0.0% 0.0%
0.0% 0.0%
0.0% 0.0%
0.0% 0.0%
Starry flounder Gear type
0.0% 0.0%
0.0% 0.0%
0.0% 0.0%
0.0% 0.0%
0.0% 0.0%
0.0% 0.0%
Resource
0.0% 0.0%
0.0% 0.0%
0.0% 0.0%
0.0% 0.0%
0.0% 0.0%
0.0% 0.0%
Total
0.0% 0.0%
0.0% 0.0%
0.0% 0.0%
0.0% 0.0%
0.0% 0.0%
0.0% 0.0%
Lingcod Gear type
0.0% 0.0%
0.0% 0.0%
0.0% 0.0%
0.0% 0.0%
0.0% 0.0%
0.0% 0.0%
Resource
0.0% 0.0%
0.0% 0.0%
0.0% 0.0%
0.0% 0.0%
0.0% 0.0%
0.0% 0.0%
Total
0.0% 0.0%
0.0% 0.0%
0.0% 0.0%
0.0% 0.0%
0.0% 0.0%
0.0% 0.0%
-continued-

44
Table 2-12.–Page 2 of 3.
Resource
Percentage
base
Removed from
commercial catch
Subsistence methods
Rod and reel
Any method Gillnet or seine
Other
Subsistence gear,
any method
Number Pounds Number Pounds Number Pounds Number Pounds Number Pounds Number Pounds
Halibut Gear type
0.0% 0.0%
0.0% 0.0%
0.0% 0.0%
0.0% 0.0%
35.9% 22.4%
23.9% 14.9%
Resource
0.0% 0.0%
0.0% 0.0%
0.0% 0.0%
0.0% 0.0%
100.0% 100.0%
100.0% 100.0%
Total
0.0% 0.0%
0.0% 0.0%
0.0% 0.0%
0.0% 0.0%
23.9% 14.9%
23.9% 14.9%
Arctic lamprey Gear type
0.0% 0.0%
0.0% 0.0%
0.0% 0.0%
0.0% 0.0%
0.0% 0.0%
0.0% 0.0%
Resource
0.0% 0.0%
0.0% 0.0%
0.0% 0.0%
0.0% 0.0%
0.0% 0.0%
0.0% 0.0%
Total
0.0% 0.0%
0.0% 0.0%
0.0% 0.0%
0.0% 0.0%
0.0% 0.0%
0.0% 0.0%
Rockfish Gear type
0.0% 0.0%
0.0% 0.0%
0.0% 0.0%
0.0% 0.0%
0.4% 1.1%
0.3% 0.7%
Resource
0.0% 0.0%
0.0% 0.0%
0.0% 0.0%
0.0% 0.0%
100.0% 100.0%
100.0% 100.0%
Total
0.0% 0.0%
0.0% 0.0%
0.0% 0.0%
0.0% 0.0%
0.3% 0.7%
0.3% 0.7%
Sculpin Gear type
0.0% 0.0%
0.0% 0.0%
0.0% 0.0%
0.0% 0.0%
0.0% 0.0%
0.0% 0.0%
Resource
0.0% 0.0%
0.0% 0.0%
0.0% 0.0%
0.0% 0.0%
0.0% 0.0%
0.0% 0.0%
Total
0.0% 0.0%
0.0% 0.0%
0.0% 0.0%
0.0% 0.0%
0.0% 0.0%
0.0% 0.0%
Burbot Gear type
0.0% 0.0%
9.1% 13.6%
38.3% 57.4%
37.0% 55.3%
5.9% 8.8%
16.3% 24.4%
Resource
0.0% 0.0%
0.9% 0.9%
75.0% 75.0%
75.9% 75.9%
24.1% 24.1%
100.0% 100.0%
Total
0.0% 0.0%
0.1% 0.2%
12.2% 18.3%
12.4% 18.5%
3.9% 5.9%
16.3% 24.4%
Dolly Varden Gear type
0.0% 0.0%
18.2% 10.2%
0.0% 0.0%
0.8% 0.5%
7.2% 4.0%
5.1% 2.8%
Resource
0.0% 0.0%
5.6% 5.6%
0.0% 0.0%
5.6% 5.6%
94.4% 94.4%
100.0% 100.0%
Total
0.0% 0.0%
0.3% 0.2%
0.0% 0.0%
0.3% 0.2%
4.8% 2.7%
5.1% 2.8%
Lake trout Gear type
0.0% 0.0%
9.1% 11.3%
20.7% 25.8%
20.2% 25.2%
11.4% 14.2%
14.3% 17.9%
Resource
0.0% 0.0%
1.0% 1.0%
46.1% 46.1%
47.1% 47.1%
52.9% 52.9%
100.0% 100.0%
Total
0.0% 0.0%
0.1% 0.2%
6.6% 8.2%
6.7% 8.4%
7.6% 9.5%
14.3% 17.9%
Arctic grayling Gear type
0.0% 0.0%
45.5% 19.8%
0.0% 0.0%
2.1% 0.9%
18.6% 8.1%
13.1% 5.7%
Resource
0.0% 0.0%
5.4% 5.4%
0.0% 0.0%
5.4% 5.4%
94.6% 94.6%
100.0% 100.0%
Total
0.0% 0.0%
0.7% 0.3%
0.0% 0.0%
0.7% 0.3%
12.4% 5.4%
13.1% 5.7%
Northern pike Gear type
0.0% 0.0%
9.1% 15.9%
0.0% 0.0%
0.4% 0.7%
17.9% 31.3%
12.1% 21.1%
Resource
0.0% 0.0%
1.2% 1.2%
0.0% 0.0%
1.2% 1.2%
98.8% 98.8%
100.0% 100.0%
Total
0.0% 0.0%
0.1% 0.2%
0.0% 0.0%
0.1% 0.2%
11.9% 20.8%
12.1% 21.1%
-continued-
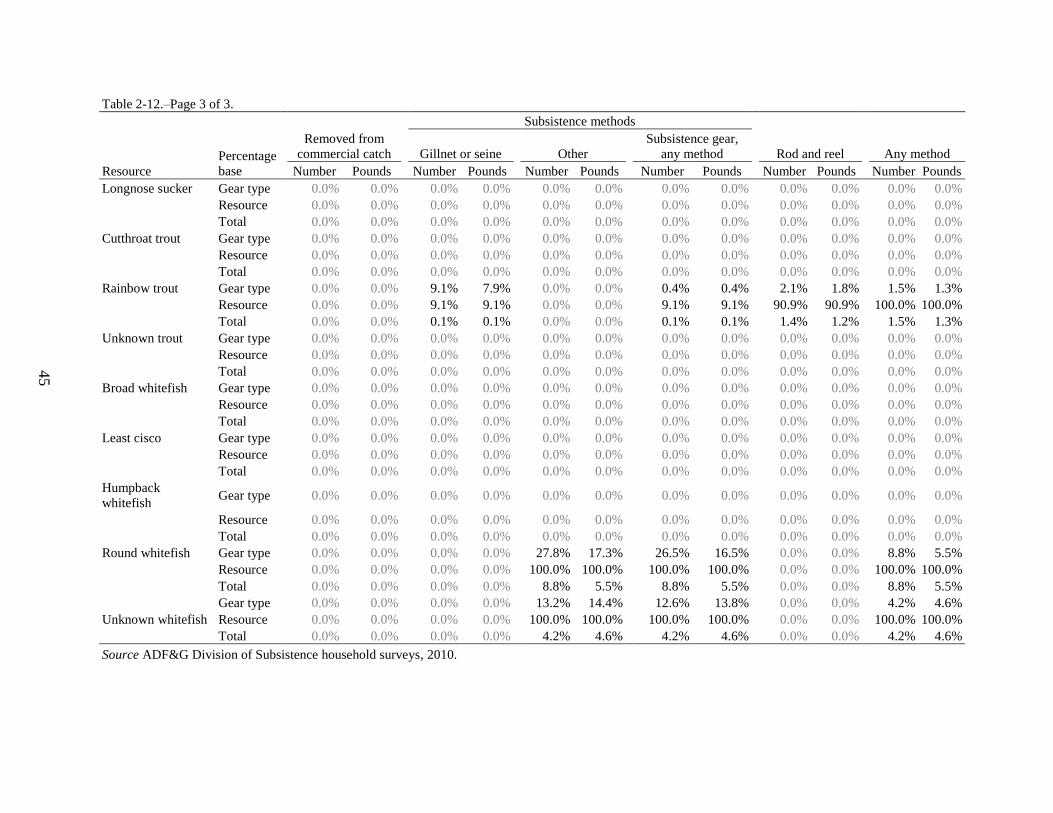
45
Table 2-12.–Page 3 of 3.
Resource
Percentage
base
Removed from
commercial catch
Subsistence methods
Rod and reel
Any method Gillnet or seine
Other
Subsistence gear,
any method
Number Pounds Number Pounds Number Pounds Number Pounds Number Pounds Number Pounds
Longnose sucker Gear type
0.0% 0.0%
0.0% 0.0%
0.0% 0.0%
0.0% 0.0%
0.0% 0.0%
0.0% 0.0%
Resource
0.0% 0.0%
0.0% 0.0%
0.0% 0.0%
0.0% 0.0%
0.0% 0.0%
0.0% 0.0%
Total
0.0% 0.0%
0.0% 0.0%
0.0% 0.0%
0.0% 0.0%
0.0% 0.0%
0.0% 0.0%
Cutthroat trout Gear type
0.0% 0.0%
0.0% 0.0%
0.0% 0.0%
0.0% 0.0%
0.0% 0.0%
0.0% 0.0%
Resource
0.0% 0.0%
0.0% 0.0%
0.0% 0.0%
0.0% 0.0%
0.0% 0.0%
0.0% 0.0%
Total
0.0% 0.0%
0.0% 0.0%
0.0% 0.0%
0.0% 0.0%
0.0% 0.0%
0.0% 0.0%
Rainbow trout Gear type
0.0% 0.0%
9.1% 7.9%
0.0% 0.0%
0.4% 0.4%
2.1% 1.8%
1.5% 1.3%
Resource
0.0% 0.0%
9.1% 9.1%
0.0% 0.0%
9.1% 9.1%
90.9% 90.9%
100.0% 100.0%
Total
0.0% 0.0%
0.1% 0.1%
0.0% 0.0%
0.1% 0.1%
1.4% 1.2%
1.5% 1.3%
Unknown trout Gear type
0.0% 0.0%
0.0% 0.0%
0.0% 0.0%
0.0% 0.0%
0.0% 0.0%
0.0% 0.0%
Resource
0.0% 0.0%
0.0% 0.0%
0.0% 0.0%
0.0% 0.0%
0.0% 0.0%
0.0% 0.0%
Total
0.0% 0.0%
0.0% 0.0%
0.0% 0.0%
0.0% 0.0%
0.0% 0.0%
0.0% 0.0%
Broad whitefish Gear type
0.0% 0.0%
0.0% 0.0%
0.0% 0.0%
0.0% 0.0%
0.0% 0.0%
0.0% 0.0%
Resource
0.0% 0.0%
0.0% 0.0%
0.0% 0.0%
0.0% 0.0%
0.0% 0.0%
0.0% 0.0%
Total
0.0% 0.0%
0.0% 0.0%
0.0% 0.0%
0.0% 0.0%
0.0% 0.0%
0.0% 0.0%
Least cisco Gear type
0.0% 0.0%
0.0% 0.0%
0.0% 0.0%
0.0% 0.0%
0.0% 0.0%
0.0% 0.0%
Resource
0.0% 0.0%
0.0% 0.0%
0.0% 0.0%
0.0% 0.0%
0.0% 0.0%
0.0% 0.0%
Total
0.0% 0.0%
0.0% 0.0%
0.0% 0.0%
0.0% 0.0%
0.0% 0.0%
0.0% 0.0%
Humpback
whitefish Gear type
0.0% 0.0%
0.0% 0.0%
0.0% 0.0%
0.0% 0.0%
0.0% 0.0%
0.0% 0.0%
Resource
0.0% 0.0%
0.0% 0.0%
0.0% 0.0%
0.0% 0.0%
0.0% 0.0%
0.0% 0.0%
Total
0.0% 0.0%
0.0% 0.0%
0.0% 0.0%
0.0% 0.0%
0.0% 0.0%
0.0% 0.0%
Round whitefish Gear type
0.0% 0.0%
0.0% 0.0%
27.8% 17.3%
26.5% 16.5%
0.0% 0.0%
8.8% 5.5%
Resource
0.0% 0.0%
0.0% 0.0%
100.0% 100.0%
100.0% 100.0%
0.0% 0.0%
100.0% 100.0%
Total
0.0% 0.0%
0.0% 0.0%
8.8% 5.5%
8.8% 5.5%
0.0% 0.0%
8.8% 5.5%
Unknown whitefish
Gear type
0.0% 0.0%
0.0% 0.0%
13.2% 14.4%
12.6% 13.8%
0.0% 0.0%
4.2% 4.6%
Resource
0.0% 0.0%
0.0% 0.0%
100.0% 100.0%
100.0% 100.0%
0.0% 0.0%
100.0% 100.0%
Total 0.0% 0.0%
0.0% 0.0%
4.2% 4.6%
4.2% 4.6%
0.0% 0.0%
4.2% 4.6%
Source ADF&G Division of Subsistence household surveys, 2010.

46
Figure 2-9.–Lake trout harvest locations, Chistochina, 2009.

47
Figure 2-10.–Arctic grayling harvest locations, Chistochina, 2009.

48
Figure 2-11.–Burbot harvest locations, Chistochina, 2009.

49
Figure 2-12.–Whitefish and rainbow trout harvest locations, Chistochina, 2009.

50
LARGE LAND MAMMALS
In 2009, large land mammals, specifically moose, made up 13% of the total Chistochina harvest by
weight (Figure 2-3). A large percentage (63%) of households attempted to harvest moose, but only 15%
were successful (Table 2-8). Nevertheless, 70% of households used moose during the study year (Table 2-
8). In terms of pounds harvested in 2009, moose ranks third on the list of top 10 resources harvested
(Table 2-9). Respondents reported considerable effort invested in hunting moose but that most had
stopped trying after depleting their financial resources. Some Chistochina respondents commented that
warm fall weather had made moose inactive and kept them far from the community in 2009. According to
the study, all successful moose hunting took place in September 2009 (Table 2-13). As Figure 2-13
shows, the estimated number of moose harvested by Chistochina residents produced by this study
corresponds closely with the Chistochina residents’ reported moose harvest numbers available from the
Division of Wildlife Conservation moose harvest permit database for the study year 2009.
Table 2-13.–Estimated large land mammal harvest by month and sex, Chistochina, 2009.
Harvest
month
Black bears
Caribou
Moose
Male Female Unknown Male Female Unknown Male Female Unknown
January
0.0 0.0 0.0
0.0 0.0 0.0
0.0 0.0 0.0
February
0.0 0.0 0.0
0.0 0.0 0.0
0.0 0.0 0.0
March
0.0 0.0 0.0
0.0 0.0 0.0
0.0 0.0 0.0
April
0.0 0.0 0.0
0.0 0.0 0.0
0.0 0.0 0.0
May
0.0 0.0 0.0
0.0 0.0 0.0
0.0 0.0 0.0
June
0.0 0.0 0.0
0.0 0.0 0.0
0.0 0.0 0.0
July
0.0 0.0 0.0
0.0 0.0 0.0
0.0 0.0 0.0
August
0.0 0.0 0.0
0.0 0.0 0.0
0.0 0.0 0.0
September
0.0 0.0 0.0
0.0 0.0 0.0
4.9 0.0 0.0
October
0.0 0.0 0.0
0.0 0.0 0.0
0.0 0.0 0.0
November
0.0 0.0 0.0
0.0 0.0 0.0
0.0 0.0 0.0
December
0.0 0.0 0.0
0.0 0.0 0.0
0.0 0.0 0.0
Unknown
month
0.0 0.0 0.0
0.0 0.0 0.0
0.0 0.0 0.0
Total harvest 0.0 0.0 0.0 0.0 0.0 0.0 4.9 0.0 0.0
Source ADF&G Division of Subsistence household surveys, 2010.
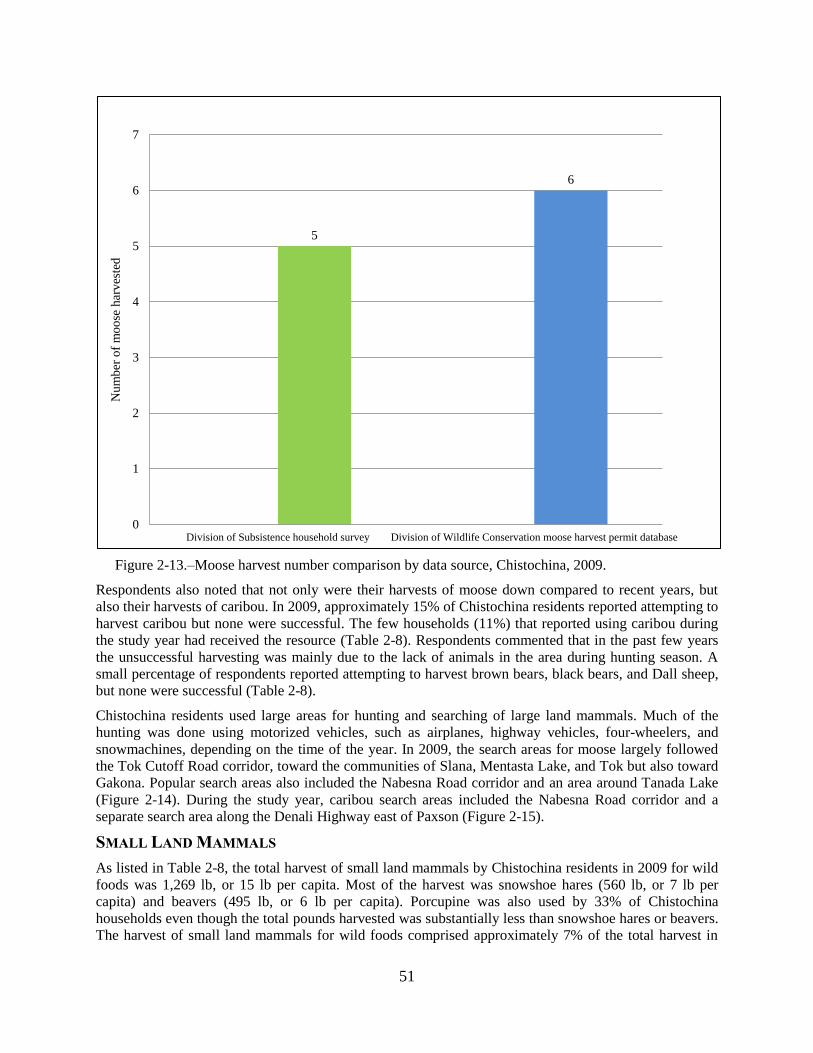
51
Figure 2-13.–Moose harvest number comparison by data source, Chistochina, 2009.
Respondents also noted that not only were their harvests of moose down compared to recent years, but
also their harvests of caribou. In 2009, approximately 15% of Chistochina residents reported attempting to
harvest caribou but none were successful. The few households (11%) that reported using caribou during
the study year had received the resource (Table 2-8). Respondents commented that in the past few years
the unsuccessful harvesting was mainly due to the lack of animals in the area during hunting season. A
small percentage of respondents reported attempting to harvest brown bears, black bears, and Dall sheep,
but none were successful (Table 2-8).
Chistochina residents used large areas for hunting and searching of large land mammals. Much of the
hunting was done using motorized vehicles, such as airplanes, highway vehicles, four-wheelers, and
snowmachines, depending on the time of the year. In 2009, the search areas for moose largely followed
the Tok Cutoff Road corridor, toward the communities of Slana, Mentasta Lake, and Tok but also toward
Gakona. Popular search areas also included the Nabesna Road corridor and an area around Tanada Lake
(Figure 2-14). During the study year, caribou search areas included the Nabesna Road corridor and a
separate search area along the Denali Highway east of Paxson (Figure 2-15).
SMALL LAND MAMMALS
As listed in Table 2-8, the total harvest of small land mammals by Chistochina residents in 2009 for wild
foods was 1,269 lb, or 15 lb per capita. Most of the harvest was snowshoe hares (560 lb, or 7 lb per
capita) and beavers (495 lb, or 6 lb per capita). Porcupine was also used by 33% of Chistochina
households even though the total pounds harvested was substantially less than snowshoe hares or beavers.
The harvest of small land mammals for wild foods comprised approximately 7% of the total harvest in
5
6
0
1
2
3
4
5
6
7
Division of Subsistence household survey Division of Wildlife Conservation moose harvest permit database
Nu
mb
er o
f m
oo
se h
arv
este
d

52
2009 (Figure 2-3). The harvest and search areas for small land mammals in 2009 included a large area
northwest of Chistochina (partly along the Gakona River and Sinona Creek), and several smaller areas
northeast of Chistochina along the Tok Cutoff Road corridor toward Slana, as well as along the Nabesna
Road corridor (Figure 2-16). In addition, there was one smaller search area in between Tanada and
Copper lakes.
BIRDS
In 2009, Chistochina residents harvested migratory waterfowl close to the community and toward the end
of the Nabesna Road. Upland game birds were harvested along the Chistochina River and Boulder Creek,
as well as along the Nabesna Road closer to Slana (Figure 2-17). No gathering of bird eggs took place
during the study year. The total harvest of birds was an estimated 97 lb, or 1 lb per capita (Table 2-8). The
total harvest of upland game birds was 60 lb, or less than 1 lb per capita. All of the migratory bird harvest
was geese and ducks, such as mallards, and the total harvest was estimated at 37 lb, or less than 1 lb per
capita (Table 2-8).
MARINE INVERTEBRATES
The harvest of marine invertebrates by Chistochina residents in 2009 was very small, at a total of 37 lb, or
less than 1 lb per capita (Figure 2-3, Table 2-8). Most of the marine invertebrates used during the study
year were razor clams. Only 4% of households reported trying to harvest marine invertebrates while 7%
reported receiving them (Table 2-8). Chistochina residents must travel considerable distances to harvest
most marine invertebrates and it is likely that a few Chistochina households received some of the marine
invertebrates from other communities.
VEGETATION
The most used category of subsistence resources in Chistochina during the study year 2009 was
vegetation, with 93% of the households harvesting, and 96% using a resource in this category (Table 2-8).
Most wild plants were harvested close to the community of Chistochina (Figure 2-18). In comparison, the
harvest and search areas for berries ranged greatly—from the vicinity of Chistochina, all the way to Slana
along the highway and farther along the Nabesna Road corridor (Figure 2-17). According to Chistochina
respondents, people often pick berries as they search for moose and caribou. In 2009, Chistochina
residents harvested 860 lb, or 10 lb per capita of vegetation, consisting mostly of berries (Table 2-8). The
harvest of blueberries placed eighth in terms of pounds per capita harvested in 2009 and ranked first in
terms of percentage of households using the resource (Table 2-9). Residents of Chistochina harvested 804
lb of berries, or 9 lb per capita, and 56 lb of other plants, or less than 1 lb per capita (Table 2-8). Most of
the other plants harvested were wild rose hips, which are commonly used to make jam. The study also
asked respondents about their use of firewood and 67% of households reported harvesting firewood and
74% using firewood (Table 2-8). According to the study, 9 Chistochina households did not use any wood
for heating, 10 households said they used 26–50% of wood for heating, and 4 households relied entirely
on wood for heating (Table 2-10).
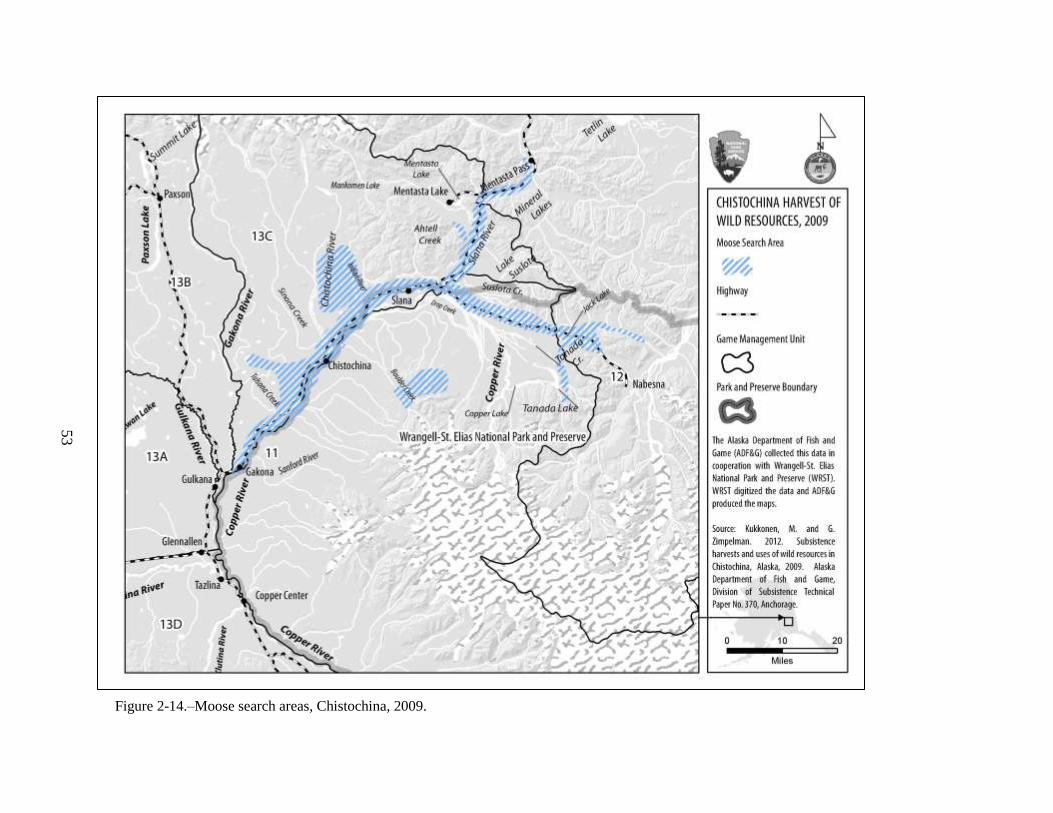
53
Figure 2-14.–Moose search areas, Chistochina, 2009.
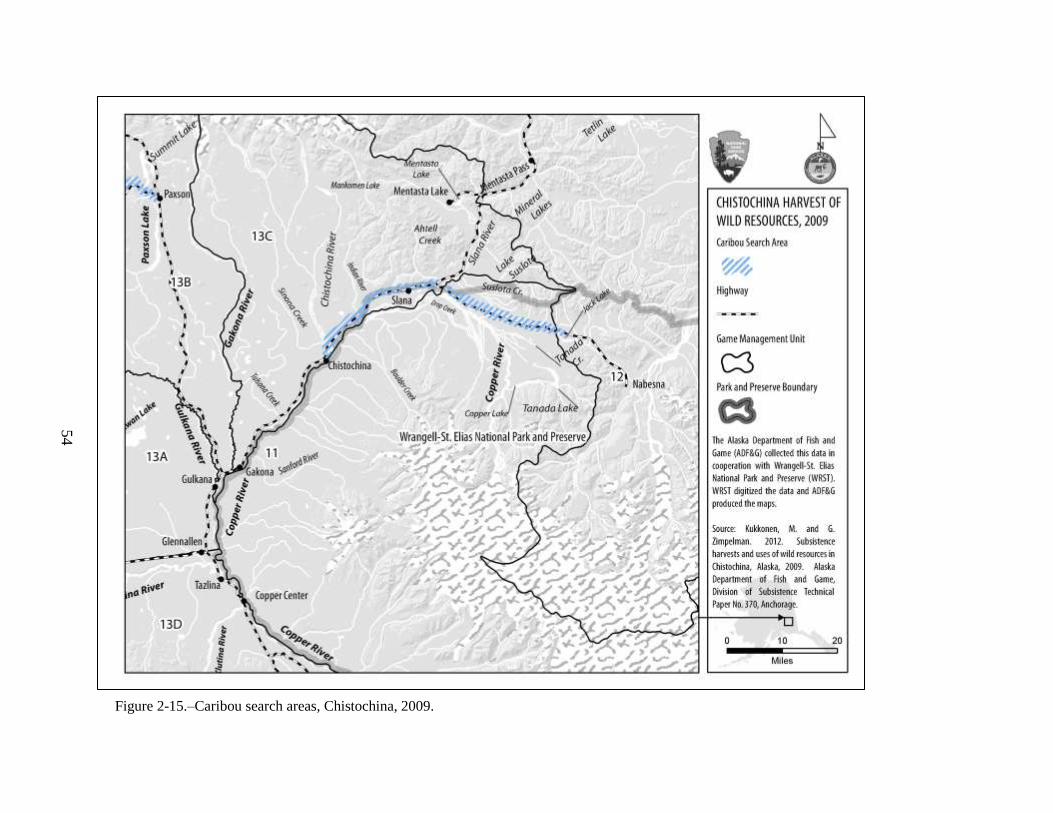
54
Figure 2-15.–Caribou search areas, Chistochina, 2009.

55
Figure 2-16.–Small land mammals search areas, Chistochina, 2009.

56
Figure 2-17.–Migratory waterfowl and upland game bird harvest areas, Chistochina, 2009.

57
Figure 2-18.–Plant and berry harvesting areas, Chistochina, 2009.

58
COMPARING HARVESTS AND USES IN 2009 WITH PREVIOUS YEARS
The majority of Chistochina respondents said that their harvests and uses of wild resources in 2009 were
about the same or less as in the recent past (the last 5 years). Figure 2-19 portrays respondents’
assessments for each major resource category. For example, of the households that answered the question
about their uses of wild resources in 2009 in comparison to the previous 5 years, about 44% of
households reported that their use of large land mammals was less in 2009 than in previous years.
Overall, a larger percentage of Chistochina households reported to have used either about the same or less
of wild resources in 2009. The only resource categories that more than 5% of Chistochina respondents
reported to have used more in 2009 than previous years were plants, berries, and greens (26%); small land
mammals (15%); salmon (11%) and large land mammals (7%). In comparison, 44% of Chistochina
households reported to have used less large land mammals, 41% less salmon, and 30% less nonsalmon
fish (Figure 2-18). Plants, greens, and berries was the only resource category where the percentage of
households reporting to have used less or alternatively more of the resource was the same at 26% (Figure
2-19).
Table 2-14 lists the reasons Chistochina respondents gave for changes in harvests and uses by resource
category. This was an open-ended question, and respondents could provide more than one reason for
changes. Project staff grouped the responses into categories, such as competition for resources,
regulations hindering or helping residents to harvest resources, sharing of harvests, effects of weather on
animals and subsistence activities, changes in the animal populations, personal reasons such as work and
health, and other outside effects on residents’ opportunities to engage in subsistence activities.
Of the surveyed households that answered the question in the 2009 survey, the availability of animals and
less sharing were the reasons most cited for less uses of wild resources overall (Table 2-14). Personal
reasons were cited as the main reasons for less use of all resources, but particularly for nonsalmon fish,
large and small land mammals, migratory waterfowl, and marine invertebrates. Work interference was
given as a reason for less use of migratory waterfowl, small land mammals, and nonsalmon fish.
Competition over resources was only mentioned as a reason for less use of upland game birds and large
land mammals. Regulations, in comparison, were cited as a reason for less use of nonsalmon fish, large
land mammals, and migratory waterfowl. It is worth noting that none of the respondents answering this
question cited fuel–equipment cost as the major reason for less use of wild resources in 2009 (Table 2-
14). A reason for this could be the unusual seasonal employment opportunity that community members
had in 2009 with a mineral exploration company operating in the area.

59
Figure 2-19.–Household use of resources compared to recent years, Chistochina, 2009.
41%
30%
44%
11%
15%
19%
26%
37%
41%
37%
26%
11%
41%
7%
48%
11%
7%
15%
26%
0% 20% 40% 60% 80% 100%
Salmon
Nonsalmon
Large land mammals
Small land mammals
Migratory waterfowl
Other birds
Marine invertebrates
Plants, greens, and berries
Households used LESS
in 2009
Households used about
the SAME in 2009
Households used
MORE in 2009
Note Percentages in this figure are based on the total number of households in the community. Unlabeled percentages are less than 5%.

60
Table 2-14.–Change in household use of resources compared to recent years, Chistochina, 2009.
Resource category
Valid
responsesa
Households
reporting
less useb
Fewer
animals
available
Poor
Weather
Work
interfered Competition Regulations
Less
sharing
Other
personal
reasons
Fuel–
Equipment
too expensive
No. % No. % No. % No. % No. % No. % No. % No. %
Salmon 27 11
5 45% 0 0% 1 9% 1 9% 1 9% 4 36% 0 0% 0 0%
Nonsalmon 24 11
8 73% 1 9% 0 0% 0 0% 0 0% 2 18% 0 0% 0 0%
Large land mammals 20 8
2 25% 0 0% 2 25% 0 0% 1 13% 3 38% 1 13% 0 0%
Small land mammals 24 12
1 8% 0 0% 2 17% 1 8% 2 17% 6 50% 0 0% 0 0%
Migratory waterfowl 14 3
1 33% 0 0% 1 33% 0 0% 0 0% 2 67% 0 0% 0 0%
Other birds 8 4
0 0% 0 0% 2 50% 0 0% 1 25% 3 75% 0 0% 0 0%
Marine invertebrates 17 5
2 40% 0 0% 1 20% 1 20% 0 0% 1 20% 0 0% 0 0%
Plants, greens, and berries 4 1 0 0% 0 0% 0 0% 0 0% 0 0% 1 100% 0 0% 0 0%
All resources 27 7
6 86% 0 0% 0 0% 0 0% 0 0% 1 14% 0 0% 0 0%
Source ADF&G Division of Subsistence household surveys, 2010
a. Valid responses include only households that used the resource and responded to the question about use.
b. Percentages in this table are based on the number of households reporting less use, not the number of valid responses.
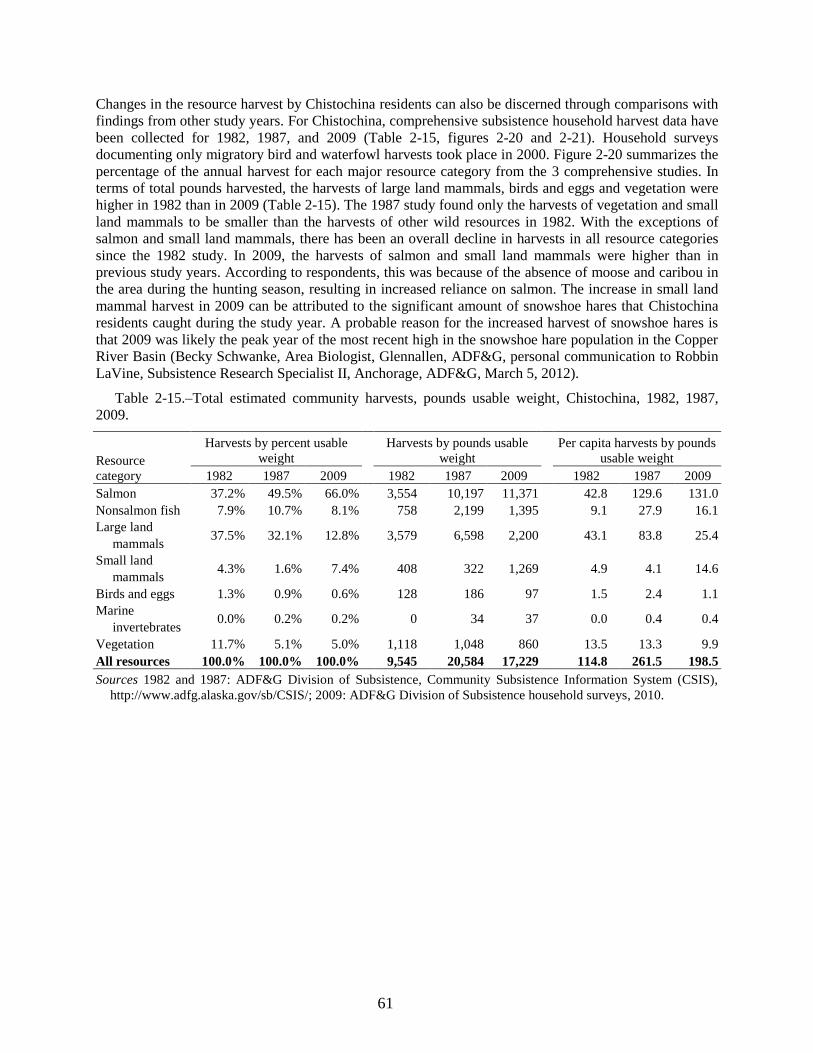
61
Changes in the resource harvest by Chistochina residents can also be discerned through comparisons with
findings from other study years. For Chistochina, comprehensive subsistence household harvest data have
been collected for 1982, 1987, and 2009 (Table 2-15, figures 2-20 and 2-21). Household surveys
documenting only migratory bird and waterfowl harvests took place in 2000. Figure 2-20 summarizes the
percentage of the annual harvest for each major resource category from the 3 comprehensive studies. In
terms of total pounds harvested, the harvests of large land mammals, birds and eggs and vegetation were
higher in 1982 than in 2009 (Table 2-15). The 1987 study found only the harvests of vegetation and small
land mammals to be smaller than the harvests of other wild resources in 1982. With the exceptions of
salmon and small land mammals, there has been an overall decline in harvests in all resource categories
since the 1982 study. In 2009, the harvests of salmon and small land mammals were higher than in
previous study years. According to respondents, this was because of the absence of moose and caribou in
the area during the hunting season, resulting in increased reliance on salmon. The increase in small land
mammal harvest in 2009 can be attributed to the significant amount of snowshoe hares that Chistochina
residents caught during the study year. A probable reason for the increased harvest of snowshoe hares is
that 2009 was likely the peak year of the most recent high in the snowshoe hare population in the Copper
River Basin (Becky Schwanke, Area Biologist, Glennallen, ADF&G, personal communication to Robbin
LaVine, Subsistence Research Specialist II, Anchorage, ADF&G, March 5, 2012).
Table 2-15.–Total estimated community harvests, pounds usable weight, Chistochina, 1982, 1987,
2009.
Resource
category
Harvests by percent usable
weight
Harvests by pounds usable
weight
Per capita harvests by pounds
usable weight
1982 1987 2009 1982 1987 2009
1982 1987 2009
Salmon 37.2% 49.5% 66.0%
3,554 10,197 11,371
42.8 129.6 131.0
Nonsalmon fish 7.9% 10.7% 8.1%
758 2,199 1,395
9.1 27.9 16.1
Large land
mammals 37.5% 32.1% 12.8%
3,579 6,598 2,200
43.1 83.8 25.4
Small land
mammals 4.3% 1.6% 7.4%
408 322 1,269
4.9 4.1 14.6
Birds and eggs 1.3% 0.9% 0.6%
128 186 97
1.5 2.4 1.1
Marine
invertebrates 0.0% 0.2% 0.2%
0 34 37
0.0 0.4 0.4
Vegetation 11.7% 5.1% 5.0%
1,118 1,048 860
13.5 13.3 9.9
All resources 100.0% 100.0% 100.0% 9,545 20,584 17,229 114.8 261.5 198.5
Sources 1982 and 1987: ADF&G Division of Subsistence, Community Subsistence Information System (CSIS),
http://www.adfg.alaska.gov/sb/CSIS/; 2009: ADF&G Division of Subsistence household surveys, 2010.

62
Figure 2-20.–Time comparison of per capita harvests in pounds edible weight, Chistochina, 1982,
1987, and 2009.
Figure 2-21.–Time comparison of categorical harvests as percentages of the total harvest in pounds
edible weight, Chistochina, 1982, 1987, and 2009.
0.4
1.1
0.4
0
50
100
150
200
250
300
1982
1987
2009
0.9
%
0.2
%
0.6
%
0.2
%
0%
10%
20%
30%
40%
50%
60%
70%
80%
90%
100%
Salmon Nonsalmon
fish
Large land
mammals
Small land
mammals
Birds and
eggs
Marine
invertebrates
Vegetation
1982
1987
2009
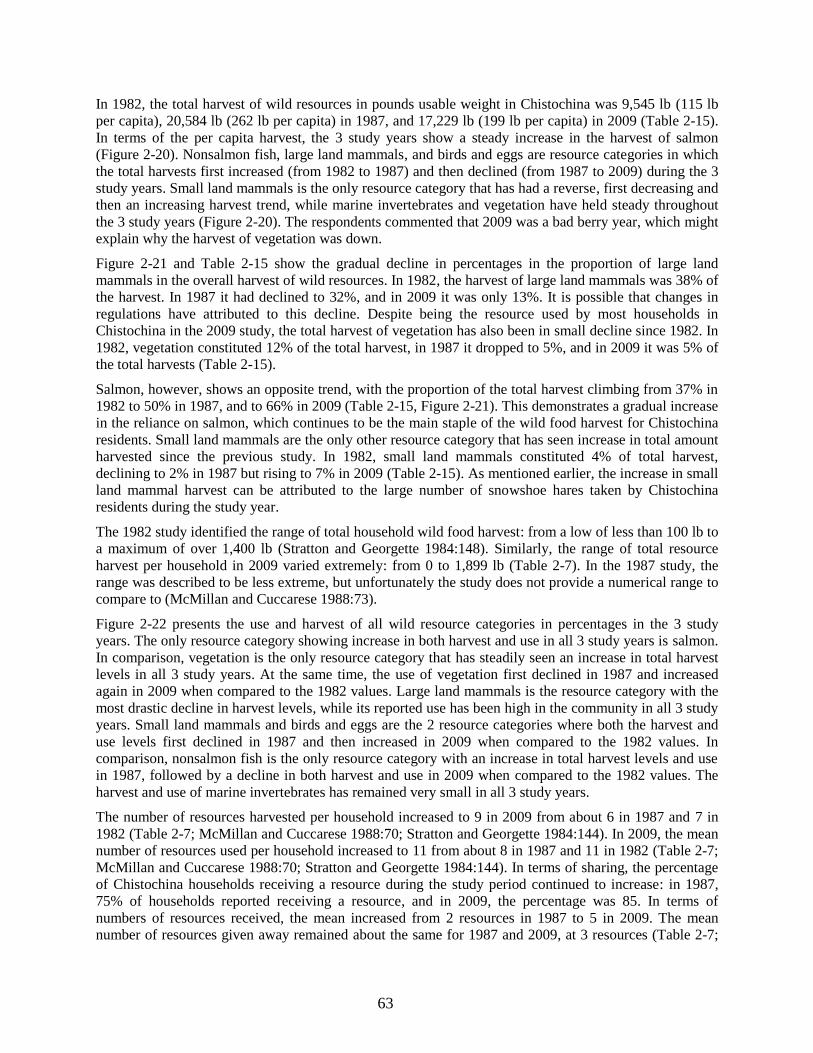
63
In 1982, the total harvest of wild resources in pounds usable weight in Chistochina was 9,545 lb (115 lb
per capita), 20,584 lb (262 lb per capita) in 1987, and 17,229 lb (199 lb per capita) in 2009 (Table 2-15).
In terms of the per capita harvest, the 3 study years show a steady increase in the harvest of salmon
(Figure 2-20). Nonsalmon fish, large land mammals, and birds and eggs are resource categories in which
the total harvests first increased (from 1982 to 1987) and then declined (from 1987 to 2009) during the 3
study years. Small land mammals is the only resource category that has had a reverse, first decreasing and
then an increasing harvest trend, while marine invertebrates and vegetation have held steady throughout
the 3 study years (Figure 2-20). The respondents commented that 2009 was a bad berry year, which might
explain why the harvest of vegetation was down.
Figure 2-21 and Table 2-15 show the gradual decline in percentages in the proportion of large land
mammals in the overall harvest of wild resources. In 1982, the harvest of large land mammals was 38% of
the harvest. In 1987 it had declined to 32%, and in 2009 it was only 13%. It is possible that changes in
regulations have attributed to this decline. Despite being the resource used by most households in
Chistochina in the 2009 study, the total harvest of vegetation has also been in small decline since 1982. In
1982, vegetation constituted 12% of the total harvest, in 1987 it dropped to 5%, and in 2009 it was 5% of
the total harvests (Table 2-15).
Salmon, however, shows an opposite trend, with the proportion of the total harvest climbing from 37% in
1982 to 50% in 1987, and to 66% in 2009 (Table 2-15, Figure 2-21). This demonstrates a gradual increase
in the reliance on salmon, which continues to be the main staple of the wild food harvest for Chistochina
residents. Small land mammals are the only other resource category that has seen increase in total amount
harvested since the previous study. In 1982, small land mammals constituted 4% of total harvest,
declining to 2% in 1987 but rising to 7% in 2009 (Table 2-15). As mentioned earlier, the increase in small
land mammal harvest can be attributed to the large number of snowshoe hares taken by Chistochina
residents during the study year.
The 1982 study identified the range of total household wild food harvest: from a low of less than 100 lb to
a maximum of over 1,400 lb (Stratton and Georgette 1984:148). Similarly, the range of total resource
harvest per household in 2009 varied extremely: from 0 to 1,899 lb (Table 2-7). In the 1987 study, the
range was described to be less extreme, but unfortunately the study does not provide a numerical range to
compare to (McMillan and Cuccarese 1988:73).
Figure 2-22 presents the use and harvest of all wild resource categories in percentages in the 3 study
years. The only resource category showing increase in both harvest and use in all 3 study years is salmon.
In comparison, vegetation is the only resource category that has steadily seen an increase in total harvest
levels in all 3 study years. At the same time, the use of vegetation first declined in 1987 and increased
again in 2009 when compared to the 1982 values. Large land mammals is the resource category with the
most drastic decline in harvest levels, while its reported use has been high in the community in all 3 study
years. Small land mammals and birds and eggs are the 2 resource categories where both the harvest and
use levels first declined in 1987 and then increased in 2009 when compared to the 1982 values. In
comparison, nonsalmon fish is the only resource category with an increase in total harvest levels and use
in 1987, followed by a decline in both harvest and use in 2009 when compared to the 1982 values. The
harvest and use of marine invertebrates has remained very small in all 3 study years.
The number of resources harvested per household increased to 9 in 2009 from about 6 in 1987 and 7 in
1982 (Table 2-7; McMillan and Cuccarese 1988:70; Stratton and Georgette 1984:144). In 2009, the mean
number of resources used per household increased to 11 from about 8 in 1987 and 11 in 1982 (Table 2-7;
McMillan and Cuccarese 1988:70; Stratton and Georgette 1984:144). In terms of sharing, the percentage
of Chistochina households receiving a resource during the study period continued to increase: in 1987,
75% of households reported receiving a resource, and in 2009, the percentage was 85. In terms of
numbers of resources received, the mean increased from 2 resources in 1987 to 5 in 2009. The mean
number of resources given away remained about the same for 1987 and 2009, at 3 resources (Table 2-7;

64
McMillan and Cuccarese 1988:70). Unfortunately, the numbers or percentages for sharing are not
available for the 1982 study year.
Salmon continued to be among the most shared resources when comparing the 1987 and 2009 studies—
56% of Chistochina households received salmon in 2009 (Table 2-8) and 50% received salmon in 1987
(McMillan and Cuccarese 1987:74). In the 2009 study 59% of households reported receiving land
mammals while the corresponding number in the 1987 study was 39%. According to the 2009 study, 56%
of Chistochina households received moose but only 11% received caribou (Table 2-8). In 1987, the
corresponding numbers were more evenly distributed with 25% receiving moose and 21% receiving
caribou (McMillan and Cuccarese 1987:74).
While the number of households receiving moose and caribou has increased, so has the number of
households attempting to harvest moose—in 1987, one-half (50%) of Chistochina households attempted
to harvest moose and in 2009, 63% attempted to harvest moose. However, the number of successful
moose hunters has gone down, from 29% in 1987 to 15% in 2009. Comparing these numbers indicates
that while more Chistochina residents invest their time and financial resources in harvesting moose, fewer
residents are successful. Regardless, the few successful hunters are sharing their moose with a larger
number of people. With regard to this study, it needs to be added that Chistochina respondents
commented that in 2009, moose were scarce near Chistochina and were seen only in small numbers.
Another reason for the low moose harvest numbers could be that most Chistochina residents did not
participate in the 2009 community subsistence harvest administered by Ahtna Inc.13
The reason given by
residents for not participating was that only a portion of Game Management Unit (GMU) 12 was open for
hunting.
The decline in numbers of households attempting to harvest, and successfully harvesting a large land
mammal species is even more significant with caribou—54% of Chistochina households reported
attempting to harvest caribou, and 36% harvested caribou in 1987 (McMillan and Cuccarese 1987:74). In
2009, only 15% of households attempted to harvest caribou, but none were successful (Table 2-8). This
decline in caribou harvest could be linked to changes in regulations. Since the early 1990s caribou
hunting in GMUs 11 and 12 has been limited, or entirely closed, due to population concerns with the
Mentasta and Chisana herds. Chistochina respondents also commented that caribou, which are a
traditional resource for them, typically do not appear in the area until after the season has closed.
13. According to regulations, ADF&G may issue community-based subsistence harvest permits for big game species where the
Alaska Board of Game (BOG) has established a community harvest hunt area. The BOG established the Gulkana, Cantwell,
Chistochina, Gakona, Mentasta, Tazlina, Chitina, and Kluti-Kaah (Copper Center) Community Subsistence Harvest Area for
moose and caribou in 2009. The Community Subsistence Harvest (CSH) permit program allows communities or groups of 25
or more people to apply annually for a CSH permit in an established Community Subsistence Harvest Area. The community
or group may choose to apply for only a moose or a caribou harvest permit, or they may apply for both. The communities or
groups may select individual hunters from their group’s members to hunt wild resources on behalf of the community or group
(ADF&G 2011:1).
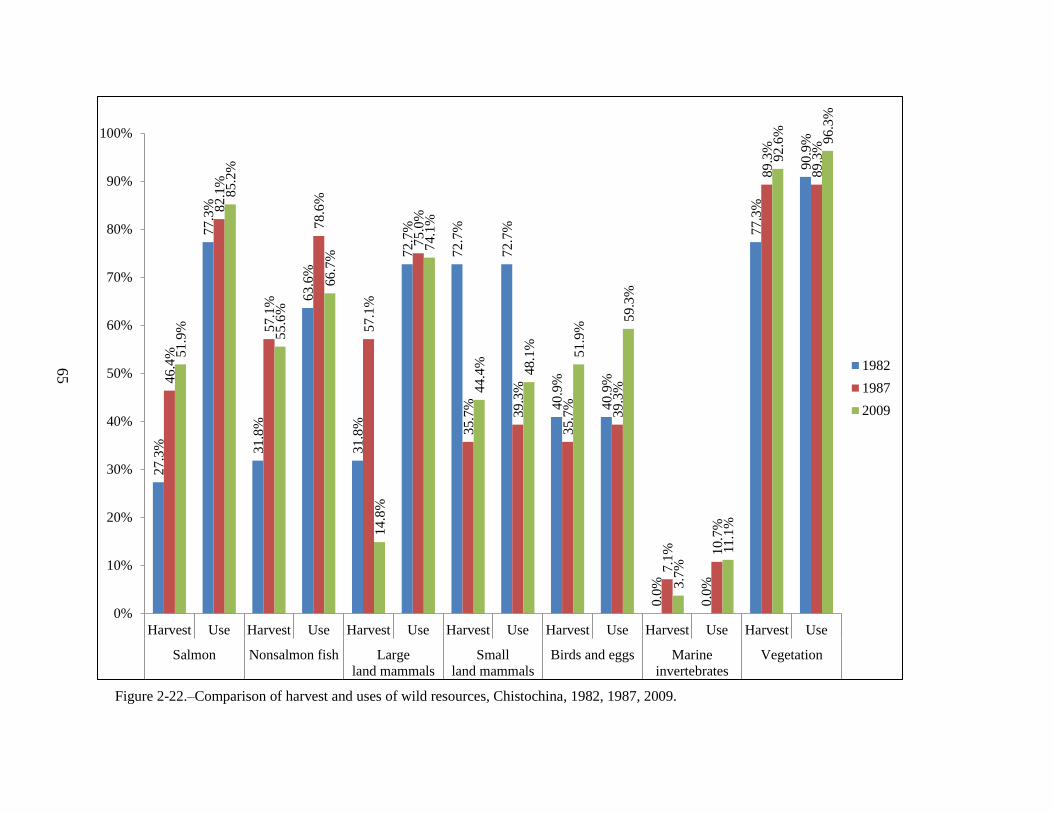
65
Figure 2-22.–Comparison of harvest and uses of wild resources, Chistochina, 1982, 1987, 2009.
27.3
%
77
.3%
31
.8%
63
.6%
31
.8%
72
.7%
72
.7%
72
.7%
40
.9%
40
.9%
0.0
%
0.0
%
77
.3%
90
.9%
46
.4%
82
.1%
57
.1%
78
.6%
57
.1%
75
.0%
35
.7%
39
.3%
35
.7%
39
.3%
7.1
% 10
.7%
89
.3%
89
.3%
51
.9%
85
.2%
55
.6%
66
.7%
14
.8%
74
.1%
44
.4%
48
.1%
51
.9%
59
.3%
3.7
%
11
.1%
92
.6%
96.3
%
0%
10%
20%
30%
40%
50%
60%
70%
80%
90%
100%
Harvest Use Harvest Use Harvest Use Harvest Use Harvest Use Harvest Use Harvest Use
Salmon Nonsalmon fish Large
land mammals
Small
land mammals
Birds and eggs Marine
invertebrates
Vegetation
1982
1987
2009

66
CURRENT AND HISTORICAL HARVEST AREAS
Stratton and Georgette (1985) mapped the community resource use areas in the Copper River Basin area
between 1983 and 1984. The maps produced for their report depict areas used between 1964 and 1984 for
hunting, fishing, trapping, and gathering in 20 communities, including Chistochina. A total of 113 maps
at the 1:250,000 scale are available at the Department of Fish and Game offices as part of the 1986
Southcentral Regional Habitat Management Guide.
The map collection in the 1986 Southcentral Regional Habitat Management Guide contains 4 historical
harvest and use area maps for Chistochina. With the exception of upland game birds, the maps include the
harvest and use areas for all the resource categories also mapped in the 2009 study. Changes in the
resource harvest and use areas by Chistochina residents can be discerned through limited comparisons of
the 1986 maps, which depict harvest and use areas for 20 years, and the maps produced from this survey,
which only reflect harvest and use areas for the study year 2009.
To a large extent, the harvest and use areas have remained the same in 2009 but there are a few distinct
changes in the areas (see Appendix C for additional harvest and use area maps). The most striking
difference is that the historical maps show more activity for moose, caribou, sheep, and furbearer
harvesting on the south side of Chistochina and around the Boulder Creek area. The 2009 study found
Chistochina residents’ moose and caribou harvest and use areas concentrated along the Tok Cutoff Road
corridor and the Nabesna Road corridor. The only more remote area for caribou harvest was east of
Paxson along the Denali Highway, and there was only one distinctly remote moose harvest and use area
around Boulder Creek southeast of Chistochina in the 2009 maps. In comparison, the historical maps
showed several remote harvest areas for both moose and caribou.
Compared to the historical maps, significantly less used areas, particularly for sheep and caribou harvest,
in the 2009 study were the areas around Nabesna and along the Nabesna River, Jacksina Creek, Copper
Lake, and Tanada Peak. Instead, the 2009 study showed more focused search and harvest effort on the
nearest areas along the Nabesna Road. As discussed earlier, a reason for the more roads focused caribou
search and hunting areas is that hunting opportunities in Game Management Units 11 and 12 have been
limited or entirely closed due to resource conservation concerns since the early 1990s. During the study
year 2009, GMU 11 was closed for caribou hunting under both state and federal regulations, and only a
limited portion of GMU 12 was open for caribou hunting under both state and federal regulations. It is
possible that the 2009 caribou search and use areas reflect the more limited hunting opportunities in most
of GMU 12 during the study year. Regardless, it is evident that for Chistochina residents the Nabesna
Road corridor continues to be an important harvest and search area for a variety of wild resources.
The historical maps show very few salmon fishing areas along the Copper River, and all of them are
around the communities of Chistochina or Slana. This could be because historically much of the salmon
harvest was done either with a community fish wheel or a shared fish wheel. The 2009 study found
Chistochina residents using a community fish wheel in Chistochina, but several respondents also traveled
downriver to Gakona and Copper Center for salmon fishing. In comparison, nonsalmon fish harvest areas
are more widely spread in the historical maps: there are several nonsalmon fish harvest areas southwest
and northeast from Chistochina in the small water bodies along the Tok Cutoff Road corridor. In the 2009
maps, nonsalmon fishing is highly concentrated to Copper and Tanada lakes.
The 2009 study found vegetation harvest and use areas to be large. According to Chistochina respondents,
this is because people harvest berries while they search and hunt for large land mammals. In the historical
maps, vegetation use areas instead appeared as small pockets near Chistochina and along the Nabesna
Road corridor. There were some vegetation use farther away along the Chistochina River, and a few use
sites appeared all the way around Unknown Lake and Eagle Creek. It is possible that historically
Chistochina hunters used these more distant areas for berry picking while hunting as well. The presence
of several smaller pockets, instead of large areas, however implies that at least some of the smaller pocket
areas were specifically used for harvesting vegetation.
67
LOCAL CONCERNS REGARDING RESOURCES
Following is a summary of local observations of wild resource populations and trends that were recorded
during the surveys. Some households did not present any additional information during the survey
interviews, so not all households are represented in the summary. In addition, respondents expressed their
concerns about wild resources in the community review meeting. These concerns have been included in
the summary.
FISH
Salmon and nonsalmon fish comprised the majority of the wild foods harvested by Chistochina residents
in 2009. Several households said that the salmon runs have been declining in recent years, and that the run
in 2009 was poor. Respondents also said that the salmon they harvested were increasingly skinny and less
oily. Some commented that for the past few years the flesh of the salmon had been mushier than before.
Only a few respondents expressed any thoughts on the reasons for the declining salmon runs; a few
respondents blamed high water levels in the Copper River and salmon passing through the area before the
fishing season opened for the smaller salmon runs. In the community review meeting, a few participants
commented on having knowledge of people stealing fish from fish wheels. Others pointed out their
concern regarding seagulls that have been eating fish from the wheels. For Chistochina respondents, the
harvest of nonsalmon fish did not seem to have similar problems, since only one respondent said that
2009 had been a bad year for nonsalmon fishing. Fishing regulations and the rising costs of all fishing
activities were, however, pointed out by several households as reasons for smaller harvest amounts.
LARGE LAND MAMMALS
In 2009, the entire harvest of large land mammals by Chistochina residents was comprised of moose, and
only a few Chistochina respondents were successful at harvesting them. The few successful households
commented that the moose they had harvested had very little fat. Several households said that large game
animals had become scarce in the area and that the regulations, particularly for caribou hunting, were “out
of sync” with the natural seasons. Other respondents pointed out that there was increased competition for
large game as hunters from outside the area come to hunt in the Copper River Basin. Multiple households
said that regulations limit their moose hunting severely. One household pointed out that the weather in
August was too warm for moose hunting, especially for processing the meat; the first 3 weeks of
September would be ideal instead. In the community review meeting, a participant also blamed the warm
fall weather, at least in part, for the low moose harvest numbers. The rising price of gas was mentioned as
a challenge for harvesting. One participant noted that when the economy is good, more people go out
hunting large land mammals. Another participant explained that during the last few open seasons caribou
rarely showed up at the right spot during hunting seasons. This was assumed to help explain relatively
low harvest numbers of caribou compared to previous years. Another participant expressed an opinion
that there is an intragroup conflict between different types of subsistence harvesters because some
harvesters have higher income and do not need to hunt for food.
SMALL LAND MAMMALS
The hunting of small land mammals, particularly for snowshoe hares, was a popular and successful
activity for Chistochina respondents in 2009. Of the total pounds of land mammals harvested, snowshoe
hares made up the second largest portion in 2009. The respondents’ comments on the availability of small
land mammals in the area were mixed: some said there had been less in the area and some said more. One
respondent noted that the soft snow made it difficult to check and maintain trap lines.
MIGRATORY WATERFOWL AND UPLAND GAME BIRDS
Chistochina residents harvested very few migratory birds in 2009. One household mentioned that they did
not hunt for migratory waterfowl because of confusing regulations. The hunting of upland game birds,
68
however, was a more popular activity, and a few households said there were more birds around in 2009.
In comparison, some said they had seen fewer birds.
VEGETATION
Chistochina residents continued to harvest a substantial amount of vegetation in 2009, berries in
particular. The overall consensus among surveyed households was that berries were hard to find in 2009
and that overall it had been a bad berry year. Only a few households mentioned harvesting less of any
specific kind of berry, but a few mentioned they would have liked to get more. In contrast, several
households commented that wood had been more difficult to find in the area. The problem of more
restricted access to traditional wood harvesting areas due to changes in land ownership status was brought
up as a reason for the challenging wood harvest. Access maps were mentioned as a desired tool for the
residents to better track changing land access issues.
SUMMARY
The household survey findings demonstrated that residents of Chistochina harvested a wide variety of
wild resources in 2009. Residents invested a great deal of time and effort in harvesting fish, land
mammals, birds, and wild plants. Per capita harvests in 2009 were lower than in 1987 but higher than in
1982. When compared to the 1987 study, there seem to be continuing trends of increasing salmon, and
small land mammal harvest, and declining large land mammal harvest. Nonsalmon fish and birds and
eggs show a decline in harvest levels as well. When comparing to the 1982 study, large land mammals
and vegetation are the only 2 resource categories with a decline in total harvest. At the same time, salmon
is the only resource category that has seen continuous increase in harvest and use since the 1982 study.
The use of large land mammals, marine invertebrates, and vegetation has remained about the same in
Chistochina in all 3 studies. Other resource categories have seen more fluctuation in use since the 1982
study. Chistochina respondents pointed out that some fishing and hunting regulations are do not coincide
with natural seasons, which made hunting for caribou, for example, very challenging. At the same time,
more sharing, especially of moose, was taking place in the community. Shifts and changes in wild
resource harvest and use areas have taken place since the 1980s as more hunting focused on the Tok
Cutoff Road corridor and the Nabesna Road corridor. The rising price of gas continues to be a challenge
to all subsistence activities.
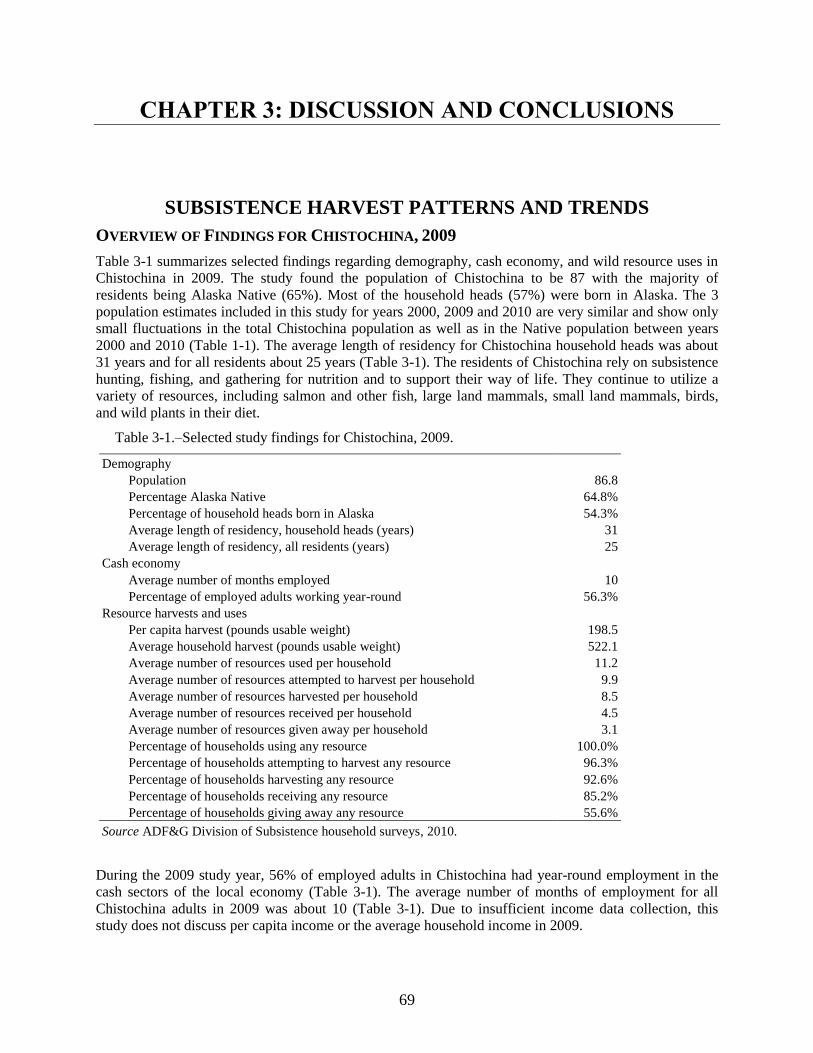
69
CHAPTER 3: DISCUSSION AND CONCLUSIONS
SUBSISTENCE HARVEST PATTERNS AND TRENDS
OVERVIEW OF FINDINGS FOR CHISTOCHINA, 2009
Table 3-1 summarizes selected findings regarding demography, cash economy, and wild resource uses in
Chistochina in 2009. The study found the population of Chistochina to be 87 with the majority of
residents being Alaska Native (65%). Most of the household heads (57%) were born in Alaska. The 3
population estimates included in this study for years 2000, 2009 and 2010 are very similar and show only
small fluctuations in the total Chistochina population as well as in the Native population between years
2000 and 2010 (Table 1-1). The average length of residency for Chistochina household heads was about
31 years and for all residents about 25 years (Table 3-1). The residents of Chistochina rely on subsistence
hunting, fishing, and gathering for nutrition and to support their way of life. They continue to utilize a
variety of resources, including salmon and other fish, large land mammals, small land mammals, birds,
and wild plants in their diet.
Table 3-1.–Selected study findings for Chistochina, 2009.
Demography
Population 86.8
Percentage Alaska Native 64.8%
Percentage of household heads born in Alaska 54.3%
Average length of residency, household heads (years) 31
Average length of residency, all residents (years) 25
Cash economy
Average number of months employed 10
Percentage of employed adults working year-round 56.3%
Resource harvests and uses
Per capita harvest (pounds usable weight) 198.5
Average household harvest (pounds usable weight) 522.1
Average number of resources used per household 11.2
Average number of resources attempted to harvest per household 9.9
Average number of resources harvested per household 8.5
Average number of resources received per household 4.5
Average number of resources given away per household 3.1
Percentage of households using any resource 100.0%
Percentage of households attempting to harvest any resource 96.3%
Percentage of households harvesting any resource 92.6%
Percentage of households receiving any resource 85.2%
Percentage of households giving away any resource 55.6%
Source ADF&G Division of Subsistence household surveys, 2010.
During the 2009 study year, 56% of employed adults in Chistochina had year-round employment in the
cash sectors of the local economy (Table 3-1). The average number of months of employment for all
Chistochina adults in 2009 was about 10 (Table 3-1). Due to insufficient income data collection, this
study does not discuss per capita income or the average household income in 2009.

70
In terms of pounds useable weight, the subsistence harvest estimates for Chistochina in 2009 were lower
than in 1987 but higher than in 1982. The 2009 estimated per capita harvest was 199 lb and the average
harvest at the household level was 522 lb (Table 3-1). The calculated average household in Chistochina is
small: an average of 3 residents per household. Therefore, the harvest amount of wild foods is substantial,
especially considering that the average American family purchases about 218 lb of meat, fish, and poultry
per person per year.14
In comparison to other communities in Alaska, Wolfe and Fall (2012) estimated
that the 2010 average rural resident wild resource harvest in Alaska was 316 lb per person, and the
average harvest in rural Southcentral Alaska communities was 180 lb per person. During the study year
2009, Chistochina residents harvested notably less than the 2010 calculated rural resident average per
capita but more than the estimated per capita average for rural Southcentral areas. The rural location of
the community, availability of most wild resources relatively close to the community, and traditional
subsistence lifestyle are likely explanations for the continuing reliance on wild foods.
Harvests in Chistochina were also diverse: on average households harvested a total of 9 different kinds of
resources and used an average of 11 different resources (Table 3-1). In terms of total pounds harvested,
the 2 most important resource categories for Chistochina residents continued to be salmon and land
mammals (Figure 2-3). Nonsalmon fish were also important and the harvesting of nonsalmon fish is an
important summer, fall, and winter activity for residents, who either fish with rod and reel or go ice
fishing. Berries and plants continue to be important as well, and made up 5% of the total harvest in terms
of pounds usable weight in 2009 (Figure 2-3). As noted earlier, households also gave away or shared an
average of 3 different resources with other households, while receiving an average of 5 different resources
(Table 3-1). All Chistochina households used wild resources during the study year, with 93% of
individuals participating in harvesting any resource, and 86% of individuals participating in processing
resources (Table 2-6).
CONCLUSION
This study documented the continuing importance of subsistence hunting, fishing, and gathering to the
residents of Chistochina. In the 2009 data year, 96% of households in Chistochina participated in
subsistence activities and all used wild resources. Subsistence harvests were moderate yet diverse in 2009,
and contributed a considerable portion of the community’s food supply. Sockeye salmon, moose,
nonsalmon fish, small land mammals, and wild plants were the primary subsistence foods as measured in
usable pounds, but many households also used both migratory and upland birds. Also the harvest and use
of firewood was extensive in the community during the study year. In addition to their own harvests, most
households also received subsistence resources through extensive sharing networks.
Results of the household survey suggest a long-term trend toward lower subsistence harvests of large land
mammals. According to the respondents, this is due to decreased resource abundance and the timing of
hunting seasons, not because of decreased hunting effort. Harvests of moose and caribou by households
of Chistochina were generally lower in 2009 than in recent years, as well as compared to the 1980s
(Stratton and Georgette 1982; McMillan and Cuccarese 1987). Reasons local households cited for these
changes included reduced resource abundance, including changes in the location of moose and caribou,
less sharing, work interference, competition, and regulations. Causes of changes in subsistence harvests
and uses are complex and require additional research in collaboration with communities. Although
harvests of large land mammals have changed over time, most households in Chistochina related that their
overall harvest and reliance on wild resources has remained constant over time.
Given the importance of subsistence resources and observations of changing harvest and use patterns, it is
not surprising that residents of Chistochina expressed concerns about their future opportunities to hunt,
14. U.S Census Bureau, Statistical Abstract of the United States: 2012.
http://www.census.gov/compendia/statab/cats/health_nutrition/food_consumption_and_nutrition.html. (Accessed March 2,
2012.)

71
fish, and gather wild resources in a manner consistent with their traditions and at levels that meet their
harvest goals. Subsistence uses of healthy fish and wildlife populations meaningfully link people to their
past, are vital to the present health of the community, and encourage optimism about the future. In
addition, providing opportunities for subsistence hunting and fishing is a mandate of state and federal law.
Community residents expressed a desire to continue subsistence activities, not only for themselves, but
also for their children and future generations. The intent of this report to provide information that will
help the community work toward their goal of sustaining their way of life.
ACKNOWLEDGMENTS
The Division of Subsistence staff would like to thank the community of Chistochina and local research
assistant Donna Boston for their assistance in conducting this harvest assessment survey. Division staff
also thanks Barbara Cellarius and staff at Wrangell-St. Elias National Park and Preserve for their
partnership and guidance. In addition, the division staff would like to extend their gratitude to
independent reviewers, Gloria Stickwan of Ahtna Inc., Mark Sommerville from ADF&G Division of
Sport Fish, and Becky Schwanke from ADF&G Division of Wildlife Conservation. Finally, the authors
would like to express their thanks to a few staff members in particular; Jim Fall for his assistance and
expertise in the project, and our editorial staff, especially Lisa Ka’aihue, for their efforts in preparing this
report for publication.

72
REFERENCES CITED
ADF&G. 2011. Copper Basin Moose: Community Subsistence Harvest Permit Program 2012–2013. Alaska
Department of Fish and Game.
http://www.adfg.alaska.gov/static/license/huntlicense/pdfs/csh_moose_2012_2013.pdf
Cochran, W. G. 1977. Sampling techniques. 3rd edition. John Wiley & Sons, New York.
de Laguna, F., and C. McClellan. 1981. Ahtna. Pages 641-663 in W. C. Sturtevant, editor. Handbook of the North
American Indians, volume 6: Subarctic. Smithsonian Institution, Washington, D.C.
Fall, J. A., and L. Stratton 1984. The harvest and use of Copper River salmon: a background report. Alaska
Department of Fish and Game Division of Subsistence, Technical Paper No. 96, Anchorage.
http://www.subsistence.adfg.state.ak.us/techpap/tp096.pdf
Haynes, T. L., and W. E. Simeone 2007. Upper Tanana ethnographic overview and assessment, Wrangell St. Elias
National Park and Preserve. Alaska Department of Fish and Game Division of Subsistence Technical Paper No.
325, Juneau. http://www.subsistence.adfg.state.ak.us/techpap/tp325.pdf
Holen, D. 2010. Dip nets, fish wheels, and motor homes: the Atna', traditional ecological knowledge, and the
political ecology of the Copper River fishery, Alaska. Lambert Academic Publishing Saarbrücken.
Kammerer, J. C. 1990. Water fact sheet: largest rivers in the United States U.S. Geological Survey, Department of
the Interior, Open File Report 87-242, http://pubs.usgs.gov/of/1987/ofr87-242/pdf/ofr87242.pdf
McDonald, J. H. 2009. Handbook of biological statistics, Second Edition. Sparky House Publishing, Baltimore,
MD.
McMillan, P. O., and S. V. Cuccarese 1988. Alaska over-the-horizon backscatter radar system: characteristics of
contemporary subsistence use patterns in the Copper River Basin and Upper Tanana Area. Volume I: synthesis.
Draft report. Prepared for Hart Crowser, Inc. Arctic Environmental Information and Data Center, University of
Alaska Anchorage in cooperation with the Alaska Department of Fish and Game and U. S. National Park
Service, Anchorage.
Miraglia, R. 1998. Traditional ecological knowledge handbook: A training manual and reference guide for
designing, conducting, and participating in research projects using Traditional ecological knowledge. Prepared
as part of Exxon Valdez Oil Spill Trustee Council Restoration Project 97052B. Alaska Department of Fish and
Game, Division of Subsistence, Anchorage.
Reckord, H. 1983a. That's the way we live: Subsistence in the Wrangell-St. Elias National Park and Preserve
University of Alaska Anthropology and Historic Preservation, Alaska Cooperative Park Studies Unit Occasional
Paper No. 34, Fairbanks.
Reckord, H. 1983b. Where raven stood: cultural resources of the Ahtna region Occasional paper no. 25,
Anthropology and Historic Preservation of the Alaska Cooperative Park Studies Unit, University of Alaska,
Fairbanks.
Simeone, W. E., and J. Kari n.d. [2004]. The harvest and use of non-salmon fish species in the Copper River Basin,
Alaska. Alaska Department of Fish and Game Division of Subsistence Technical Paper No. 292, Juneau.
http://www.subsistence.adfg.state.ak.us/techpap/tp292.pdf
Stratton, L., and S. Georgette 1984. Use of fish and game by communities in the Copper River Basin, Alaska: a
report on a 1983 household survey. Alaska Department of Fish and Game Division of Subsistence, Technical
Paper No. 107, Anchorage. http://www.subsistence.adfg.state.ak.us/techpap/tp107.pdf
Stratton, L., and S. Georgette 1985. Copper Basin resource use map index and methodology Alaska Department of
Fish and Game Division of Subsistence, Technical Paper No. 124, Anchorage
http://www.subsistence.adfg.state.ak.us/techpap/tp124.pdf
U. S. Census Bureau. 2001. Profiles of general demographic characteristics, Alaska: 2000. U.S. Department of
Commerce Washington, D. C.
U. S. Census Bureau. 2011. 2010 Census. U.S. Census Bureau, Washington, D.C.
http://factfinder2.census.gov/faces/nav/jsf/pages/index.xhtml
Wolfe, R. J., and J. A. Fall. 2012. Subsistence in Alaska: A year 2010 update. Alaska Department of Fish and
Game, Division of Subsistence, Anchorage.

73
APPENDIX A: CHISTOCHINA SURVEY FORM
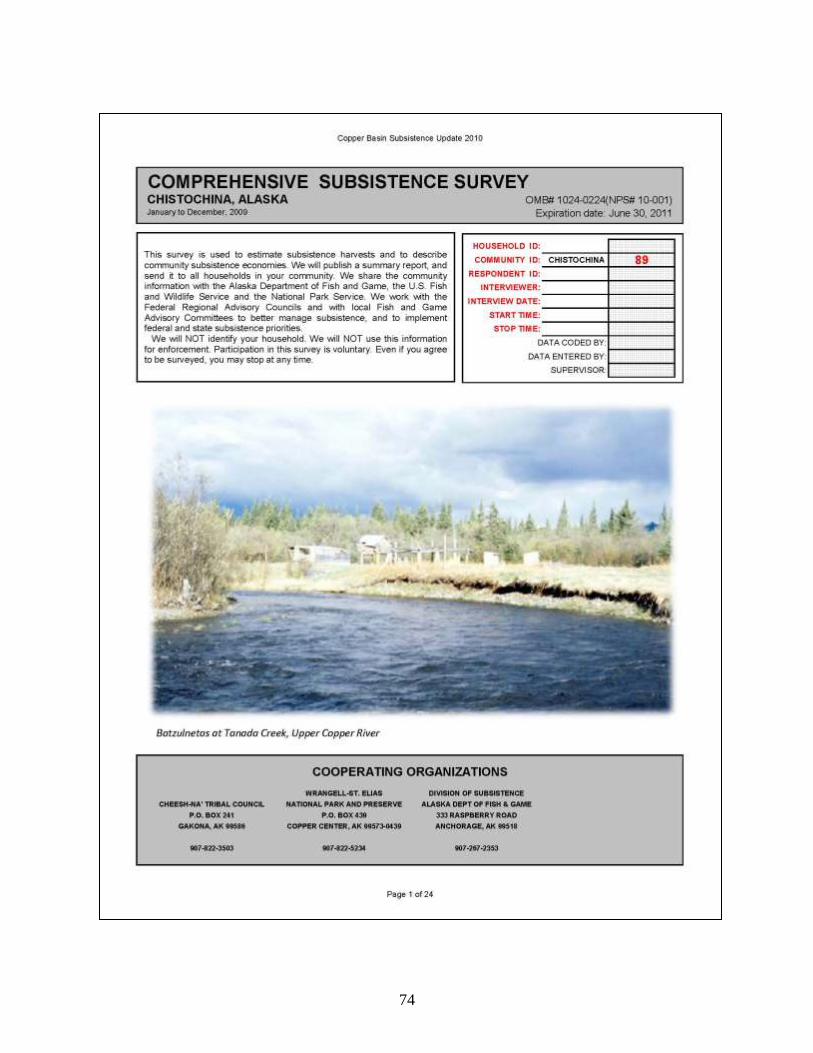
74
Appendix A.–Chistochina survey form.

75

76

77
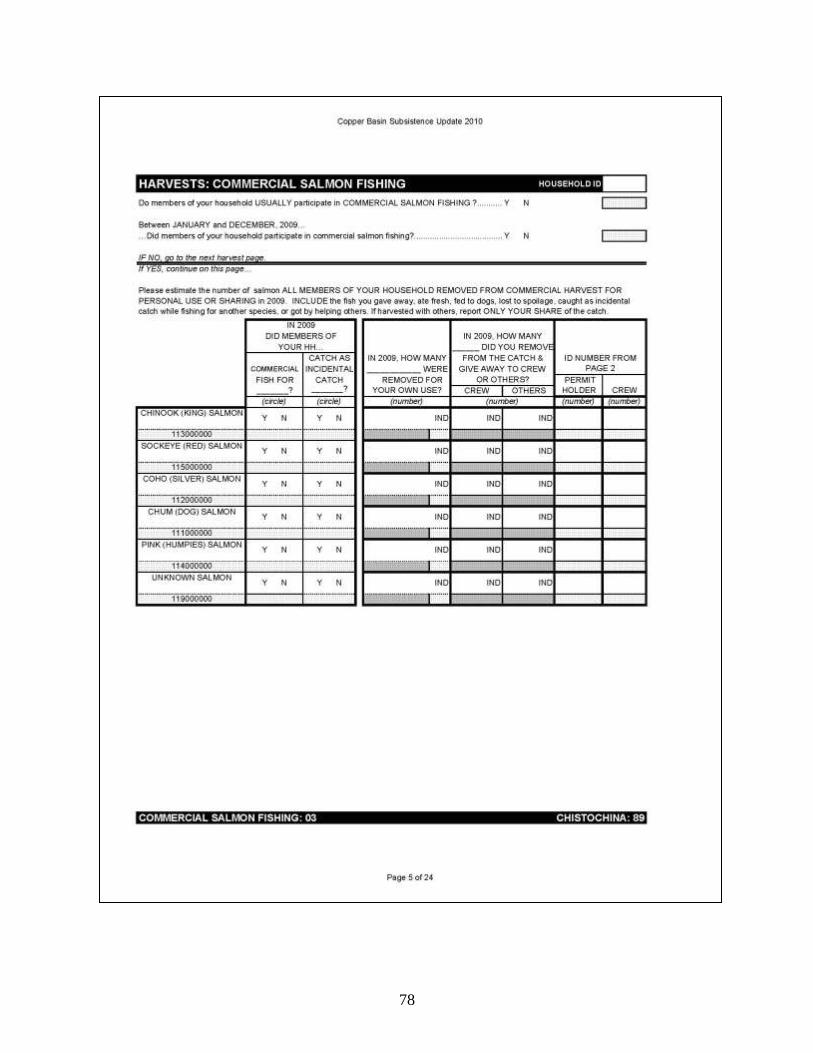
78

79
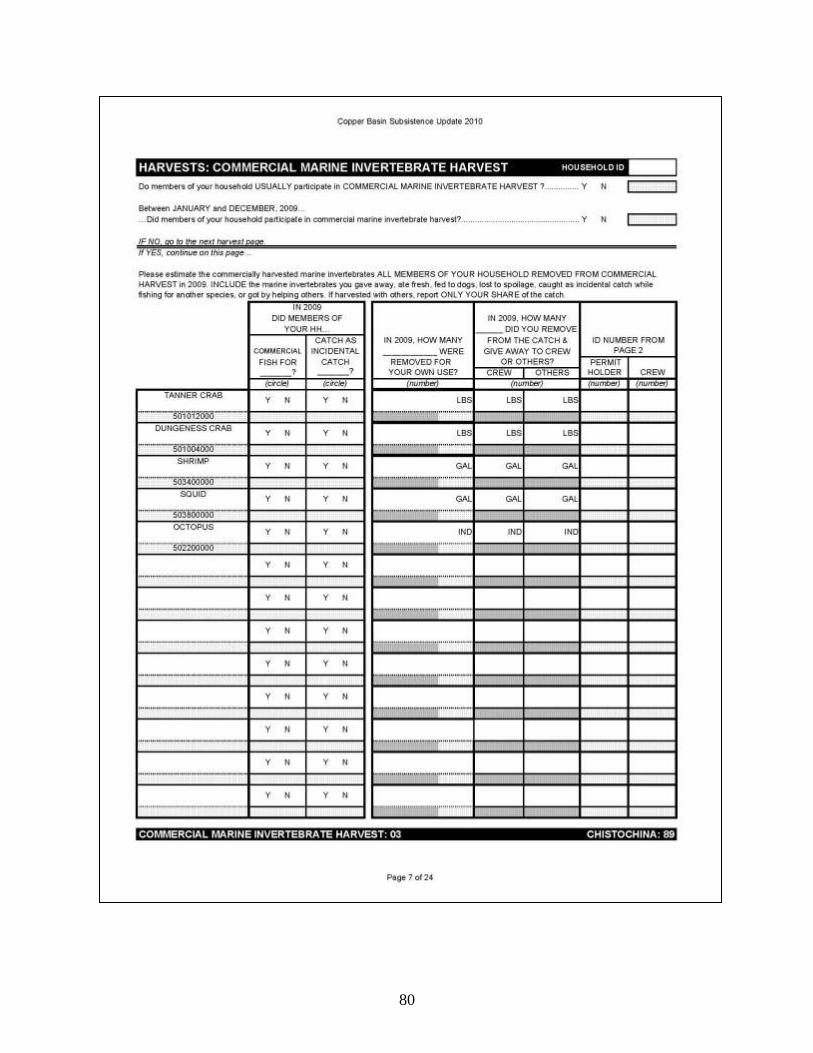
80

81

82

83

84

85

86

87

88

89
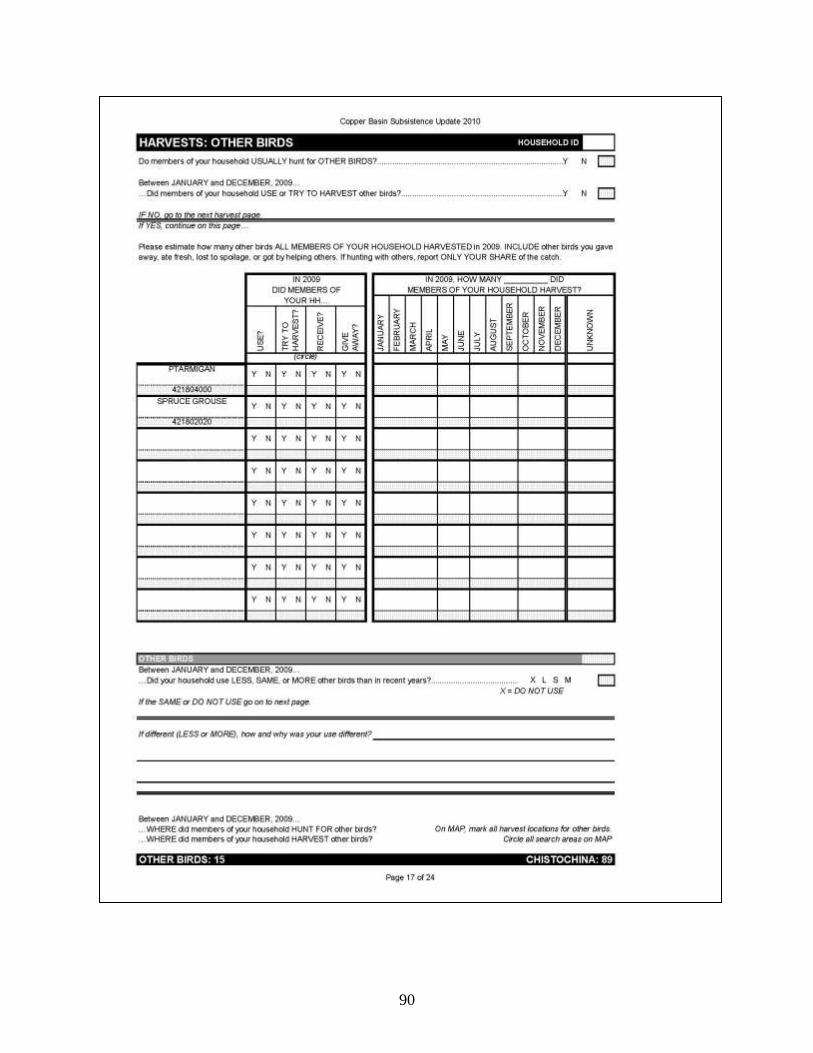
90

91

92

93

94
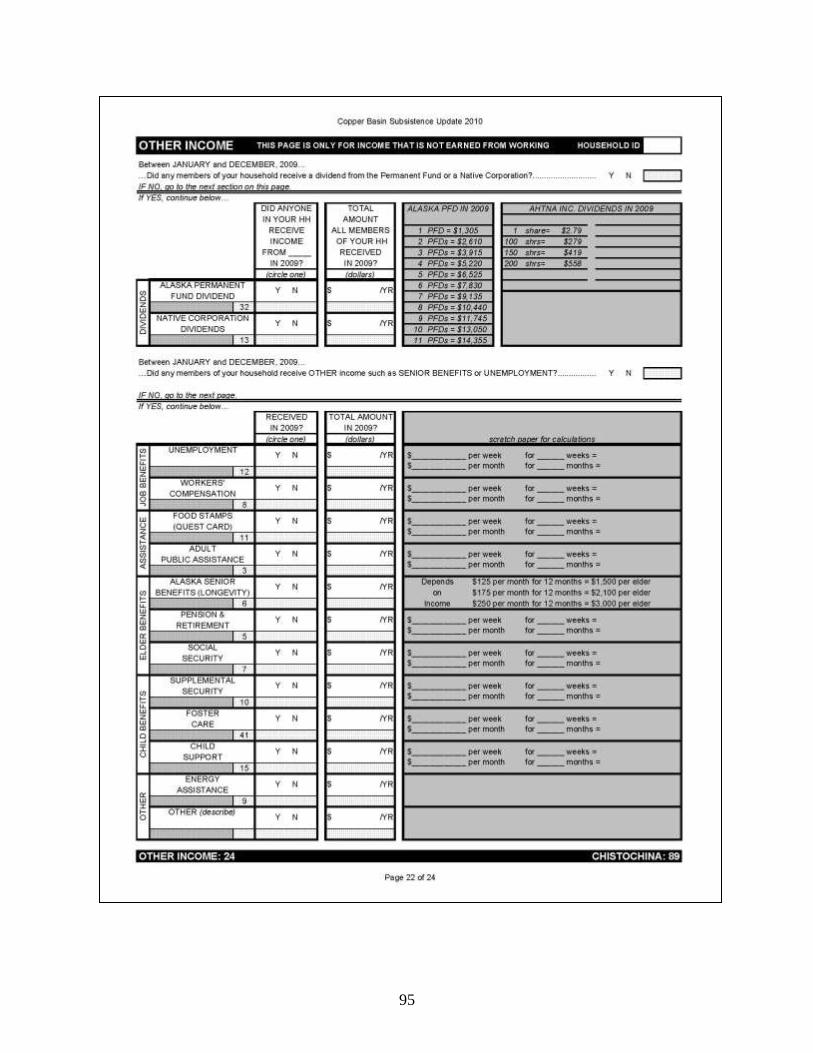
95

96
97
APPENDIX B: CONVERSION FACTORS

98
Appendix B.–Conversion factors.
Resource
Conversion
to
pounds
Chum salmon 4.88
Coho salmon 5.10
Chinook salmon 11.09
Pink salmon 2.99
Sockeye salmon 4.29
Landlocked salmon 1.50
Spawning sockeye salmon 2.00
Herring 6.00
Herring sac roe 7.00
Herring spawn on kelp 7.00
Smelt 6.00
Capelin (grunion) 3.25
Unknown smelt 3.25
Pacific (gray) cod 3.20
Walleye pollock (whiting) 1.40
Unknown cod 3.20
Flounder 3.00
Unknown flounder 3.00
Lingcod 4.00
Unknown greenling 1.00
Pacific halibut 23.50
Black rockfish 1.50
Rougheye (red) rockfish 4.00
Unknown rockfish 2.00
Sablefish (black cod) 3.10
Slimy sculpin (bullhead) 0.50
Unknown shark 9.00
Unknown sole 1.00
Stickleback (needlefish) 0.20
Wolffish 0.50
Alaska blackfish 0.07
Burbot 1.00
Arctic char 1.40
Dolly Varden 1.40
Dolly Varden–freshwater 1.40
Dolly Varden–saltwater 1.40
Lake trout 1.40
Arctic grayling 0.70
Northern pike 2.80
Sheefish 5.50
Unknown sturgeon 34.00
-continued-

99
Appendix B. Page 2 of 4.
Resource
Conversion
to
pounds
Longnose sucker 1.50
Rainbow trout 1.40
Steelhead trout 1.40
Unknown trout 1.40
Broad whitefish 4.00
Least cisco 0.40
Humpback whitefish 1.75
Round whitefish 1.00
Black bear 58.00
Brown bear 340.00
Caribou 150.00
Moose 540.00
Dall sheep 104.00
Beaver 8.75
Coyote a 0.00
Red fox 0.00
Red fox–crossphase 0.00
Arctic hare 5.60
Snowshoe hare 2.00
River otter 0.00
Lynx 4.00
Alaska marmot 5.00
American marten 0.00
Mink 0.00
Muskrat 0.75
Porcupine 8.00
Arctic ground (parka) squirrel 0.50
Red (tree) squirrel 0.50
Weasel 0.00
Gray wolf 0.00
Wolverine 0.00
Harbor seal 56.00
Harbor seal–freshwater 56.00
Harbor seal–saltwater 56.00
Unknown seal 56.00
Sea otter 0.00
Steller sea lion 200.00
Walrus 560.00
Beluga whale 831.00
Bufflehead 0.40
Canvasback 1.10
Gadwall 0.80
Unknown goldeneye 0.80
-continued-

100
Appendix B. Page 3 of 4.
Resource
Conversion
to
pounds
Mallard 1.00
Merganser 0.60
Northern pintail 0.80
Scaup 0.90
Unknown scaup 0.90
Scoter 0.90
Black scoter 0.90
Northern shoveler 0.60
Green-winged teal 0.30
Wigeon 0.70
American wigeon 0.70
Unknown wigeon 0.70
Unknown duck 0.78
Brant 1.20
Cackling Canada goose 1.20
Dusky Canada goose 3.60
Lesser Canada gooseb 1.20
Unknown Canada goose 1.96
Snow goose 2.30
White-fronted goose 2.40
Unknown goose 2.40
Tundra (whistling) swan 6.00
Unknown swan 6.00
Sandhill crane 8.40
Common snipe 0.10
Unknown loon 3.00
Tern 1.00
Arctic tern 1.00
Grouse 0.70
Unknown ptarmigan 0.70
Duck eggs 0.15
Unknown duck eggs 0.15
Goose eggs 0.30
Unknown goose eggs 0.30
Swan eggs 0.30
Unknown swan eggs 0.30
Seabird and loon eggs 0.30
Gull eggs 0.30
Unknown gull eggs 0.30
Tern eggs 0.05
Unknown tern eggs 0.05
Unknown eggs 0.15
Butter clam 3.00
-continued-
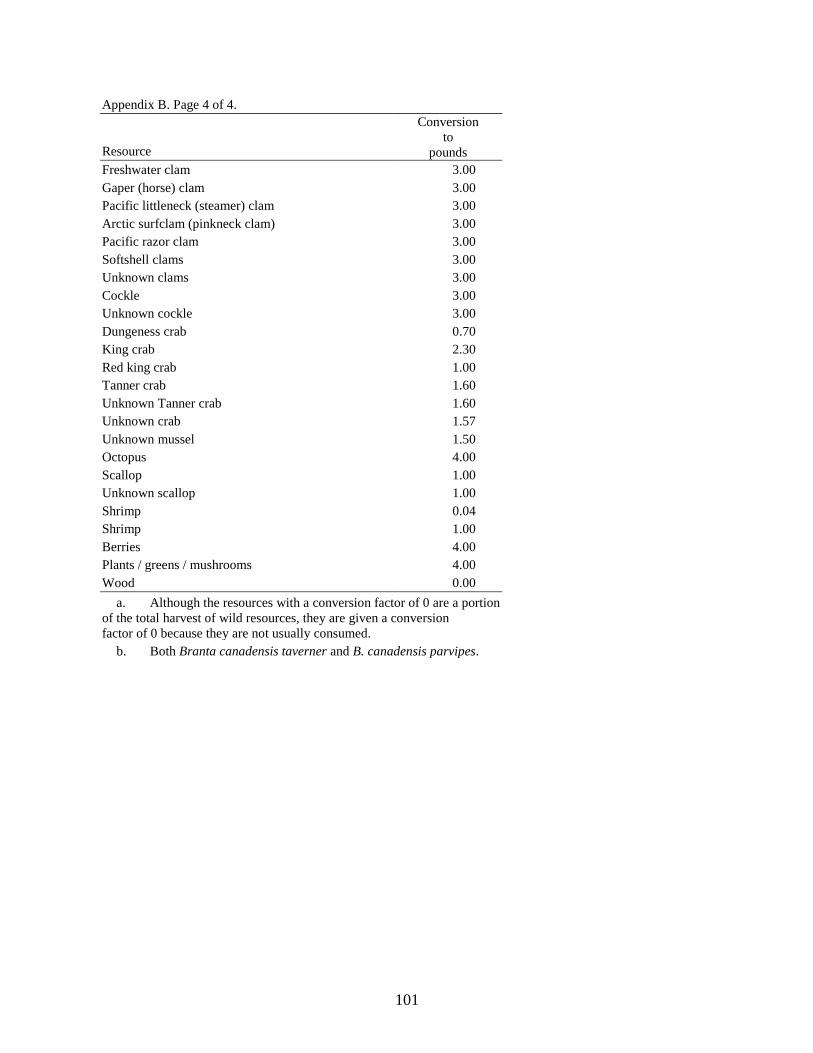
101
Appendix B. Page 4 of 4.
Resource
Conversion
to
pounds
Freshwater clam 3.00
Gaper (horse) clam 3.00
Pacific littleneck (steamer) clam 3.00
Arctic surfclam (pinkneck clam) 3.00
Pacific razor clam 3.00
Softshell clams 3.00
Unknown clams 3.00
Cockle 3.00
Unknown cockle 3.00
Dungeness crab 0.70
King crab 2.30
Red king crab 1.00
Tanner crab 1.60
Unknown Tanner crab 1.60
Unknown crab 1.57
Unknown mussel 1.50
Octopus 4.00
Scallop 1.00
Unknown scallop 1.00
Shrimp 0.04
Shrimp 1.00
Berries 4.00
Plants / greens / mushrooms 4.00
Wood 0.00
a. Although the resources with a conversion factor of 0 are a portion
of the total harvest of wild resources, they are given a conversion
factor of 0 because they are not usually consumed.
b. Both Branta canadensis taverner and B. canadensis parvipes.

102
APPENDIX C: ADDITIONAL HARVEST AND USE AREA
MAPS

103
Appendix C.–Additional harvest use area maps.

104
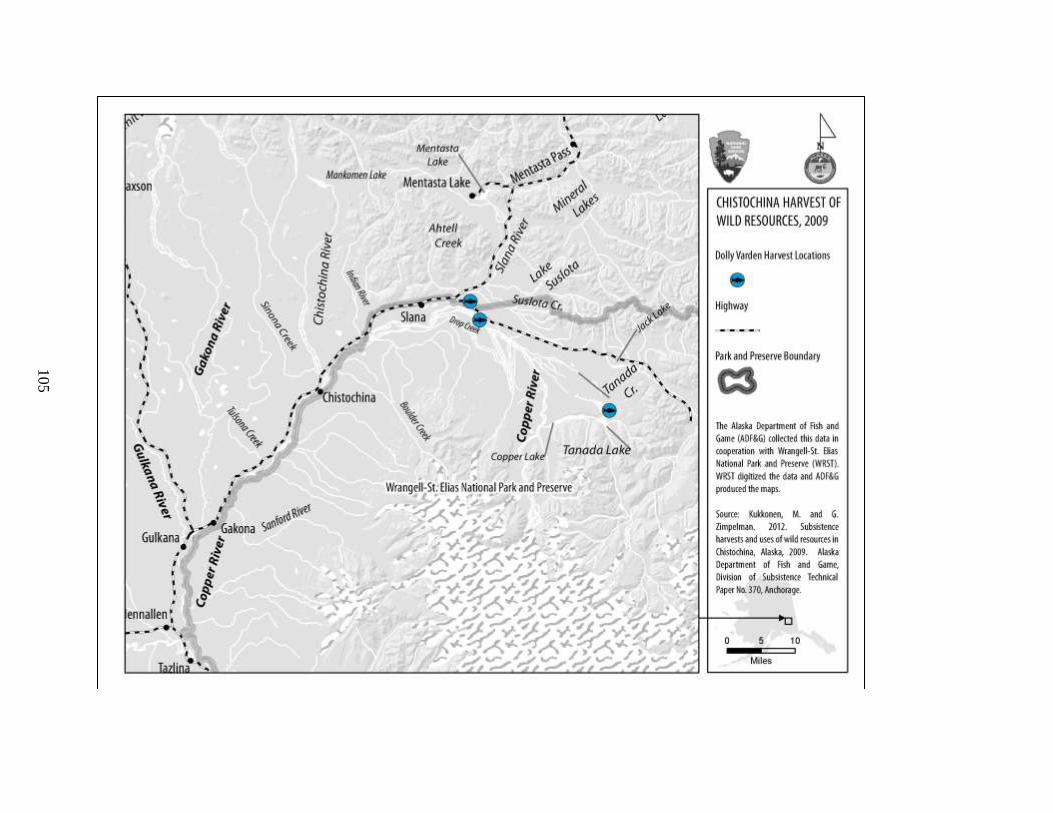
105
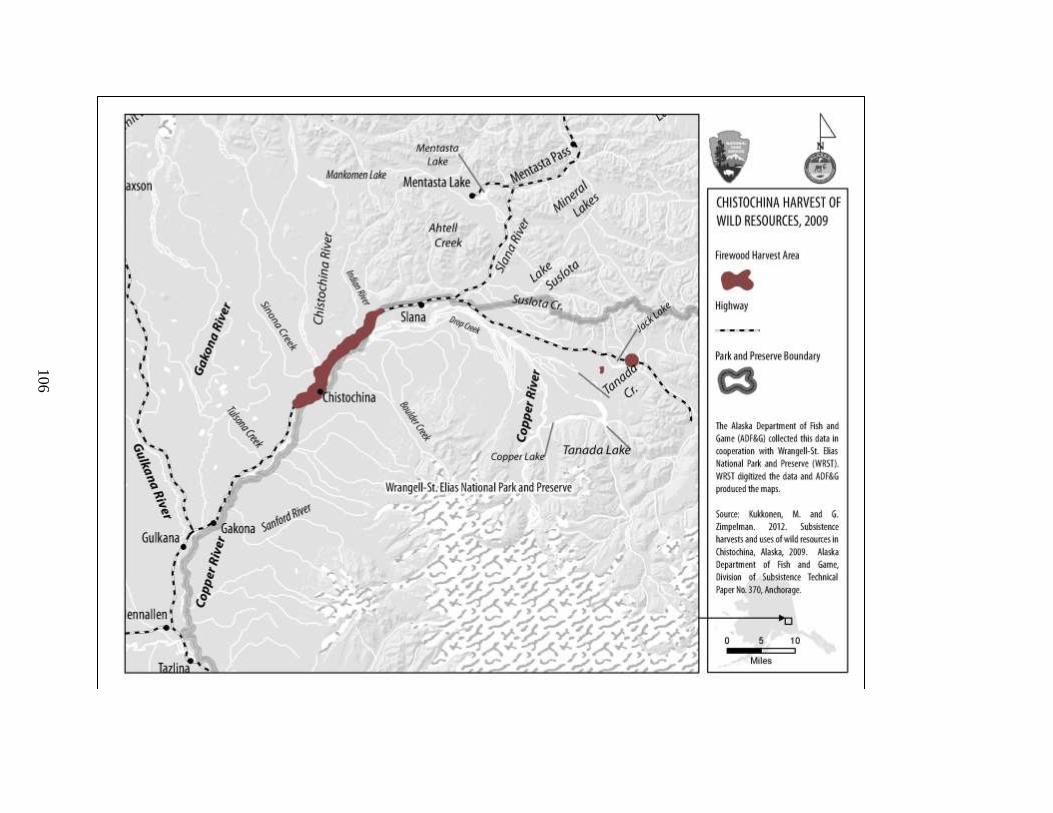
106

107
APPENDIX D: SUMMARY OF STUDY FINDINGS

108
Appendix D.–Summary of study findings.
Subsistence Harvests and Uses of Wild Resources in
Chistochina, Alaska, 2009
An Overview of Study Findings
Division of Subsistence
Alaska Department of Fish and Game
November 2012
Background
The following is a brief overview of research conducted by the Division of Subsistence of the Alaska
Department of Fish and Game (ADF&G) in collaboration with Wrangell-St. Elias National Park and
Preserve on subsistence harvests of all resources by residents of Chistochina. Funding for this study was
provided by the National Park Service through Alaska Regional Natural Resources Project Funds. The
study period covers January 1 to December 31, 2009. This study is part of a multiphase study to update
the subsistence harvest information for several communities in the Copper River Basin. Year one of this
multiyear study documented subsistence uses and harvests as well as demographic and other economic
data for the study year of 2009 in Chistochina.
Methods
The primary data gathering method was systematic household surveys using a modified version of the
ADF&G Division of Subsistence standard data gathering instrument. The surveys were conducted face-
to-face with community residents. The goal was to interview representatives of all households in
Chistochina. In total, 27 households were interviewed, approximately 82% of the year-round resident
households. With the help of a local research assistant, household interviews were conducted to collect
harvest and use information for all wild resources. Each household had accompanying mapping
conducted as well, for each resource, including use area and/or harvest location, amount of harvest, and
month of harvest. Participation was voluntary, and individual as well as household-level data are
confidential, as are mapped harvest locations. In addition, subsistence users were asked to discuss their
observations about resource use and abundance, and their concerns relating to subsistence resources and
their continuing opportunities to harvest subsistence resources.
Findings
In 2009, all Chistochina households used wild resources, 96% of the households attempted to harvest a
resource, and 93% of the households successfully harvested wild resources. Subsistence harvests were
lower than in previous study year (1987), but continue to be diverse. The mean total harvest was 522
pounds usable weight per household, or 199 pounds per person. On average, this per person harvest is
about 0.6 pounds of wild resources per day.
Figure 1 shows the composition of wild resource harvests in pounds usable weight by category for 2009.
The composition of the harvest varied by resource category with salmon and large land mammals
(specifically moose) making up the largest portions of the harvest. Many households also harvested and
used wood but firewood and some furbearers typically not eaten are excluded from the
weightcalculations. Table 1 shows the top ten specific resources harvested and used by Chistochina
households in 2009.

109
Figure 1.–Chistochina composition of wild resource harvests, pounds usable weight, 2009.
Table 1.–Top ten resources harvested and used, Chistochina, 2009.
Harvested
Used
Number Rank Resource
Pounds per
capita Number Rank Resource
Percentage
of
households
using
1 1. Sockeye salmon 93.5
1 1. Blueberry 77.8%
2 2. Chinook salmon 33.7
2 2. Wood 74.1%
3 3. Moose 25.4
3 3. Sockeye salmon 70.4%
4 4. Snowshoe hare 6.5
4 3. Moose 70.4%
5 5. Beaver 5.7
5 5. Lowbush cranberry 66.7%
6 6. Burbot 3.9
6 6. Chinook salmon 59.3%
7 7. Coho salmon 3.7
7 6. Spruce grouse 59.3%
8 8. Blueberry 3.5
8 7. Lake trout 40.7%
9 9. Northern pike 3.4
9 7. Arctic grayling 40.7%
10 10. Lake trout 2.9 10 7. Highbush cranberry 40.7%
Source ADF&G Division of Subsistence household survey, 2010.
Salmon
66%
Nonsalmon fish
8%
Large land
mammals
13%
Small land
mammals
7%
Birds and eggs
1%
Marine
invertebrates
<1%
Vegetation
5%
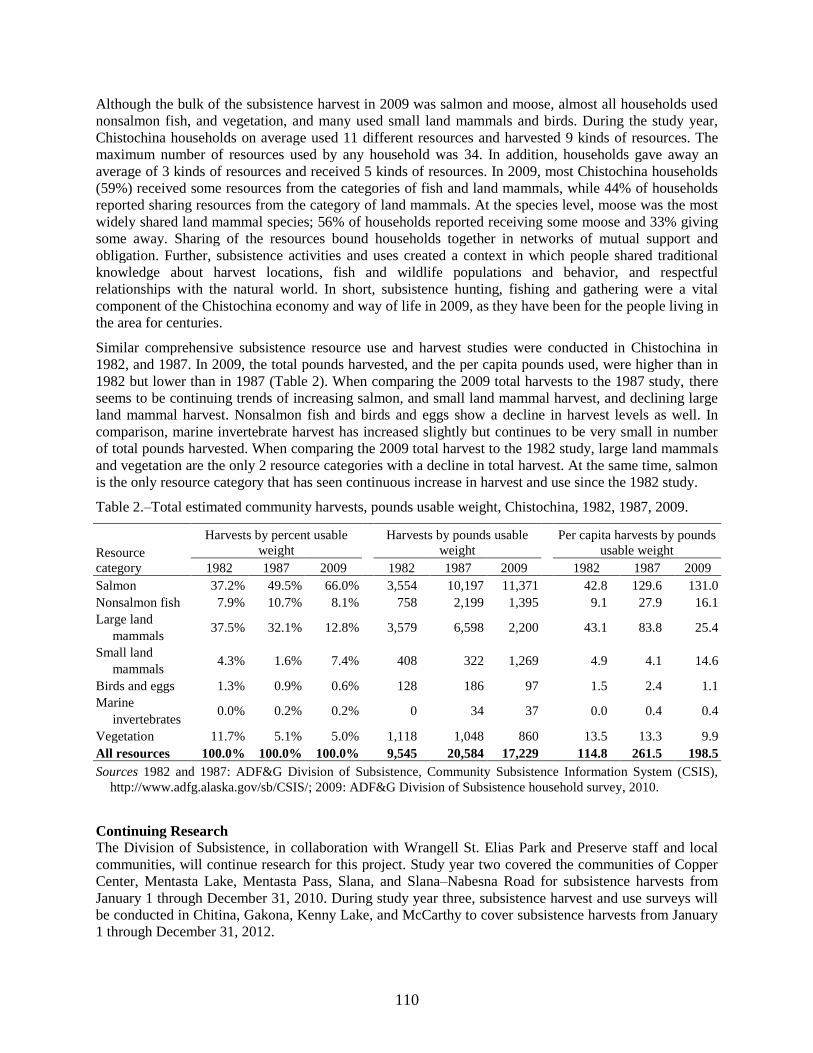
110
Although the bulk of the subsistence harvest in 2009 was salmon and moose, almost all households used
nonsalmon fish, and vegetation, and many used small land mammals and birds. During the study year,
Chistochina households on average used 11 different resources and harvested 9 kinds of resources. The
maximum number of resources used by any household was 34. In addition, households gave away an
average of 3 kinds of resources and received 5 kinds of resources. In 2009, most Chistochina households
(59%) received some resources from the categories of fish and land mammals, while 44% of households
reported sharing resources from the category of land mammals. At the species level, moose was the most
widely shared land mammal species; 56% of households reported receiving some moose and 33% giving
some away. Sharing of the resources bound households together in networks of mutual support and
obligation. Further, subsistence activities and uses created a context in which people shared traditional
knowledge about harvest locations, fish and wildlife populations and behavior, and respectful
relationships with the natural world. In short, subsistence hunting, fishing and gathering were a vital
component of the Chistochina economy and way of life in 2009, as they have been for the people living in
the area for centuries.
Similar comprehensive subsistence resource use and harvest studies were conducted in Chistochina in
1982, and 1987. In 2009, the total pounds harvested, and the per capita pounds used, were higher than in
1982 but lower than in 1987 (Table 2). When comparing the 2009 total harvests to the 1987 study, there
seems to be continuing trends of increasing salmon, and small land mammal harvest, and declining large
land mammal harvest. Nonsalmon fish and birds and eggs show a decline in harvest levels as well. In
comparison, marine invertebrate harvest has increased slightly but continues to be very small in number
of total pounds harvested. When comparing the 2009 total harvest to the 1982 study, large land mammals
and vegetation are the only 2 resource categories with a decline in total harvest. At the same time, salmon
is the only resource category that has seen continuous increase in harvest and use since the 1982 study.
Table 2.–Total estimated community harvests, pounds usable weight, Chistochina, 1982, 1987, 2009.
Resource
category
Harvests by percent usable
weight
Harvests by pounds usable
weight
Per capita harvests by pounds
usable weight
1982 1987 2009 1982 1987 2009
1982 1987 2009
Salmon 37.2% 49.5% 66.0%
3,554 10,197 11,371
42.8 129.6 131.0
Nonsalmon fish 7.9% 10.7% 8.1%
758 2,199 1,395
9.1 27.9 16.1
Large land
mammals 37.5% 32.1% 12.8%
3,579 6,598 2,200
43.1 83.8 25.4
Small land
mammals 4.3% 1.6% 7.4%
408 322 1,269
4.9 4.1 14.6
Birds and eggs 1.3% 0.9% 0.6%
128 186 97
1.5 2.4 1.1
Marine
invertebrates 0.0% 0.2% 0.2%
0 34 37
0.0 0.4 0.4
Vegetation 11.7% 5.1% 5.0%
1,118 1,048 860
13.5 13.3 9.9
All resources 100.0% 100.0% 100.0% 9,545 20,584 17,229 114.8 261.5 198.5
Sources 1982 and 1987: ADF&G Division of Subsistence, Community Subsistence Information System (CSIS),
http://www.adfg.alaska.gov/sb/CSIS/; 2009: ADF&G Division of Subsistence household survey, 2010.
Continuing Research
The Division of Subsistence, in collaboration with Wrangell St. Elias Park and Preserve staff and local
communities, will continue research for this project. Study year two covered the communities of Copper
Center, Mentasta Lake, Mentasta Pass, Slana, and Slana–Nabesna Road for subsistence harvests from
January 1 through December 31, 2010. During study year three, subsistence harvest and use surveys will
be conducted in Chitina, Gakona, Kenny Lake, and McCarthy to cover subsistence harvests from January
1 through December 31, 2012.

111
For More Information Complete results for this project appear in: M. Kukkonen and G. Zimpelman. 2012. Subsistence harvests
and uses of wild resources in Chistochina, Alaska, 2009. Alaska Department of Fish and Game, Division
of Subsistence Technical Paper No. 370, Anchorage.
Technical Paper series reports are available through the Alaska Resources Library and Information
Services (ARLIS), the Alaska State Library, and on the Internet: www.adfg.alaska.gov/sf/publications.
The Alaska Department of Fish and Game (ADF&G) administers all programs and activities free from
discrimination based on race, color, national origin, age, sex, religion, marital status, pregnancy,
parenthood, or disability. The department administers all programs and activities in compliance with Title
VI of the Civil Rights Act of 1964, Section 504 of the Rehabilitation Act of 1973, Title II of the
Americans with Disabilities Act (ADA) of 1990, the Age Discrimination Act of 1975, and Title IX of the
Education Amendments of 1972.
If you believe you have been discriminated against in any program, activity, or facility please write:
ADF&G ADA Coordinator, P.O. Box 115526, Juneau AK 99811-5526
U.S. Fish and Wildlife Service, 4040 N. Fairfax Drive, Suite 300 Webb, Arlington VA 22203
Office of Equal Opportunity, U.S. Department of the Interior, Washington DC 20240
The department’s ADA Coordinator can be reached via phone at the following numbers:
(VOICE) 907-465-6077, (Statewide Telecommunication Device for the Deaf) 1-800-478-3648, (Juneau
TDD) 907-465-3646, or (FAX) 907-465-6078
For information on alternative formats and questions on this publication, please contact:
ADF&G, Division of Subsistence, Website:
http://www.adfg.alaska.gov/index.cfm?adfg=contacts.anchorage


