
POLITECNICO DI TORINO
Master’s Degree in Computer Engineering
Study of relocation strategies for electric car
sharing system
Candidate: Supervisors:
Liu Xian Luca Vassio
S261423 Giordano Danilo
Alessandro Ciociola
April 2021


Declaration of Authorship LiuXian,declarethatthisthesistitled,‘Studyofrelocationstrategiesforelectric car sharing system’ and theworkpresented in it aremyown. Iconfirmthat:•ThisworkwasdonewhollyormainlywhileincandidatureforaresearchdegreeatthisUniversity.•WhereanypartofthisthesishaspreviouslybeensubmittedforadegreeoranyotherqualificationatthisUniversityoranyotherinstitution,thishasbeenclearlystated.• Where I have consulted the published work of others, this is alwaysclearlyattributed.•WhereIhavequotedfromtheworkofothers,thesourceisalwaysgiven.Withtheexceptionofsuchquotations,thisthesisisentirelymyownwork.•Ihaveacknowledgedallmainsourcesofhelp.•Wherethethesisisbasedonworkdonebymyselfjointlywithothers,Ihave made clear exactly what was done by others and what I havecontributedmy-self.
Signed: :
Date: :

Summary
Sharing Economy is developing rapidly in recent years due to itsadvantages in resource utilization and environmental protection. As fortransportation, electric car sharing system has the potential ability inreducing air pollution and improving transportation efficiency. Free-floatingcarsharingsystemisextremelyconvenientfortheusers.Itallowsusersdropoff thevehicleat anywhere in theoperationarea insteadofreturning vehicle in specific place. However, it is easy to cause theasymmetryproblemofvehiclesupplyanddemand.Therefore,relocationoperationwhichtakesvehiclesfromoversuppliedareatoundersuppliedareaisnecessaryforthesystemtoruninasustainablestate.ThegoalofthisMasterThesisisfirst,tounderstandifrelocationisusefuland profitable for car sharing system, then to investigate and comparedifferentrelocationstrategiesforElectricFreeFloatingCarSharing(EFFCS)systems. Two kinds of relocation strategies are discussedhere: reactiverelocationandproactivelayerrelocation.Reactiverelocationmeansthatrelocationoperationsareonlytriggeredattheendofeachtripwhenthebattery level of vehicle is below a specific threshold. Proactive layerrelocationreferstoattheendofeachhour,somevehicleswillberelocatedin order to meet the user demand for the next hour. The number ofrelocated vehicles depends on the number of system employee whichperformedtherelocationoperations.Foreachrelocationstrategy,systemperformanceandeconomicperformancearetestedandevaluated.Here,system performance refers to metrics like the faction satisfaction ofbooking request and number of unsatisfied booking request which noavailable vehicles nearby. Besides, economic performance refers to therelocation related cost including hiring operational workers and extraenergyusedforrelocation,revenuesandprofitrateforthewholeEFFCSsystemsoon.For this purpose, I adopt and extend an existing date-driven, discrete-event simulatorwritten in Python. I use the datasetwhich comes fromactual rentals in the city of Turin performed by a famous car sharingprogramcar2go. I conduct the case studyabout the cityof Turinunderdifferent configurations. Results show that relocation operation has a

positive impact in improving system performance of satisfying morebooking request for using vehicles. The faction of satisfied bookingrequests increases about 5% to 10% compared with no proactiverelocationscenarioinourexperiments.Asforchoosingchargingrelocationarea,choosetheclosestareawithavailablechargingpolesisregardedtobethebestsolution.Besides,doingrelocationoperation inagiventimefrequencysuchashourlyexecutionseemsmeaningful.However,atradeoffbetween better performance of system and extra cost needed to beconsidered. For instance, in our cases, hiring workers to do relocationoperationsdefinitely improves systemperformance.Theextra revenuesbroughtfromimprovingperformanceisaround10,000€.However,italsoleadstomoresystemcostbothforpayingforworkersandrelocationthevehiclesforabout45,000€.Myworkaboutdiscussingdifferentrelocationstrategyisusefulinsolvingthe problem about the unbalance between user demand and actualdistributionofvehiclesandimprovethesystemperformance.What’smore,analysisabouttheeconomicperformanceinrelocationismeaningfulwhenconsidering real world situation. As for further work, research can beexpanded to other big cities such as Milan. Besides, more complexrelocationstrategysuchasusingmachinelearningmodeltomakewholeoperationprocessadaptivetotherealtrafficsituationcouldbeconsideredandtested.

Acknowledgements

Contents
Declaration of Authorship.........................................................................................................II
Summary....................................................................................................................................III
Acknowledgements.....................................................................................................................V
List of Tables...........................................................................................................................VII
List of Figures........................................................................................................................VIII
Introduction...............................................................................................................................11.1SharingEconomy............................................................................................................................11.2CarSharing.....................................................................................................................................11.3ThesisPresentationandMotivation...............................................................................................3
Background................................................................................................................................62.1SimulationModellingBackground..................................................................................................62.2ICTBackground...............................................................................................................................72.3RelocationBackground...................................................................................................................82.4RelatedWork.................................................................................................................................9
2.4.1 eC2S .................................................................................................................................... 92.4.2 Dataset .............................................................................................................................. 112.4.3 Related Metrics ............................................................................................................... 12
Methodology and Tools............................................................................................................153.1Simulator......................................................................................................................................153.2ExtraMetrics................................................................................................................................163.3ReactiveRelocationStrategy........................................................................................................173.4ProactiveLayerRelocationStrategy..............................................................................................20
3.4.1. Zone Selection Techniques ............................................................................................ 21
Case Study of Turin.................................................................................................................234.1.ReactiveRelocationStrategyResults...........................................................................................23
4.1.1. System Performance ...................................................................................................... 244.1.2. Economic Performance ................................................................................................. 26
4.2.ProactiveRelocationStrategyResults..........................................................................................294.2.1. System Performance ...................................................................................................... 304.2.2. Economic Performance ................................................................................................. 35
Conclusions and Future Work.................................................................................................40
Bibliography............................................................................................................................41

VII
List of Tables TABLE 2.1 DATA FORMAT OF INPUT BOOKING REQUESTS TABLE 4.1 PARAMETER FOR CHARGING RELOCATION EXPERIMENTS
TABLE 4.2 PARAMETER FOR PROACTIVE RELOCATION EXPERIMENTS

VIII
List of Figures
1.1.1 Annual Carbon Dioxide Emissions during Last Century 1.2.1 Number of Car Sharing Users 2.1 Charging Zone Location in Turin 4.1.1 Fraction Satisfied,varying N_poles/N_vehicles_Factor 4.1.2 Charging outwards distance, varying N_poles/N_vehicles_Factor 4.1.3 Cost Related Metrics,varying N_poles/N_vehicles_Factor 4.1.4 Income Related Metrics,varying N_poles/N_vehicles_Factor 4.2.1.1 Fraction Satisfied,varying N_Vehicles 4.2.1.2 Fraction Satisfied,varying N_Vehicles,new proactive relocation 4.2.1.3 Total Vehicle Relocation Distance,varying N_Vehicles 4.2.1.4 Number of Relocations, varying N_Vehicles 4.2.1.5 Number of Relocations &Relocation Distance,varying N_Vehicles, new proactive relocation 4.2.1.6 Number of Relocations & Relocation Distance of delta strategy, varying N_Vehicles 4.2.2.1 Total Revenues, varying N_Vehicles 4.2.2.2 Total Revenues,varying N_Vehicles, new proactive relocation 4.2.2.3 Total Cost & Proactive Relocation Cost,varying N_Vehicles, new proactive relocation 4.2.2.4 Profits, varying N_Vehicles, new proactive relocation 4.2.2.5 Cost Gap and Revenue Gap, between no proactive relocation and new proactive relocation with three workers,varying N_Vehicles

1
Chapter 1
Introduction
1.1 Sharing Economy
Thesharingeconomyrefers to thesumofeconomicactivities thatusemoderninformationtechnologiessuchastheInternet,withthesharingofuse rights as the main feature, integrate massive and decentralizedresources,andmeetdiverseneeds.Itisdevelopingrapidlyovertheworldbecauseofsavingenergyandresource.Sharingeconomywillbecomethemost important force in the social service industry. In the fields ofaccommodation, transportation, education services, life services andtourism,excellentsharingeconomycompaniesareconstantlyemerging.
Figure1.2.1AnnualCarbonDioxideEmissionsduringLastCentury[1]
1.2 Car Sharing
In terms of transportation, car sharing is becoming more and morepopularinthelastdecadesduetoitsexcellentperformanceinreducingairpollutionandfuelconsumption,releasingtrafficjam.Figure1.2.1[1]showstheannualcarbondioxideemissionsduringthelastcentury.Wecansee

Introduction
2
thateachactionofreducingcarbonemissionisverynecessary.Carsharingisamodelofcarrentalwherepeoplerentcarsforshortperiodsoftime,oftenbythehour.Itdiffersfromtraditionalcarrentalinthattheownersof thecarsareoftenprivate individuals themselves,andthecarsharingfacilitatorisgenerallydistinctfromthecarowner.Carsharingispartofalargertrendofsharedmobility.Figure1.2.1[2]showsthatthenumberofusersincarsharingisincreasingstably.Mostofthisformoftransportationhasbeen takingplace in thecities inEurope,NorthAmerica, JapanandSingapore[3]. There are two main branches in car sharing system: thestationbasedcarsharingsystem,inwhichtheuserpicksanddropsthecarin the given parking spots and the Free Floating Car SharingSystem(FFCS)[4], inwhichtheuserpicksupanddropsthecaranywherewhenhestartsorendsthetripintheoperationalarea.
Thelattersolutionhasgivenmoreflexibilitytousershoweveritleadstospatiotemporal demand asymmetries. Leaving the system on its ownwithoutanyinterventionsavesmoneycostandhumanresource,butithasserious results. Vehicles are easily get stuck in areas with low demandcausingalossofmoneyandlowcustomersatisfaction.Thingsgetworseforelectricvehicles.Whenthevehiclesareinthestateoflowbattery,theyareno longerusable for futureperiodthusmakethesystemcorrupted.What relocation do is balancing supply and demand and charging low-batterycars,thusmakethewholesystemruninavirtuouscircle.Toofferanappropriatelevelofserviceinareaswithhighdemand,theoperatorhastomovethevehiclesfromoversuppliedareatoundersuppliedarea.Thosetransfersareoftenexecutedduringthedaytooptimallysupplythehighdemandduringpeakhours.Moreover,asforelectricvehicles(EV),whichismoreenvironmentalfriendlyandwidelyusedinpubliccarsharingsystem,theworkerhastorelocatecarstothecharginghubwhentheyaregoingtorunoutofbatteryinordertomakeituseinasustainableway.

Introduction
3
Figure1.2.1NumberofCarSharingUsers
1.3 Thesis Presentation and Motivation
In this thesis, I will study different relocation strategies for electricvehicles. Relocation operation is very useful to fill the gap betweendemandandsupplyinvehicles.Moreover,charginginfrastructureisalsoverynecessaryformakingtheelectricvehiclesruninalongtime.Inorderto improve the usage of charging infrastructure, charging relocationstrategy also have to be considered carefully. Futhermore, choosingchargingpolesinthemostefficientwaywillalsoimprovethewholesystemperformance.IuseasimulatortosimulaterealtrafficsituationinthecityofTurin,Italy.IgeneratethousandsofrealFFCStripsingiventimeperiod.Firstly, by implementing three different kinds of charging relocationstrategiesthatchoosechargingpolesattheendofeachtrip,Iobservetheirperformance and study the additional cost which relocation operationbring. Post charging relocation are also called reactive relocation in thethesis.
Next,Iconsiderproactiverelocation.Inthatway,relocationisnotonlyhappenedattheendofeachtrip,butcanbescheduledandoperatedinagiventimefrequency.Iusetwodifferentapproachestocatchthedemandspatialvariability.Weproposeanhourlytriggeredrelocationstrategy.Werelocatethecars tosomezoneswhichareconfrontedwiththedemandmodelattheendofeachhour.Bychangingthefleetsizeandthenumberofrelocationworkers,weanalyzemanyKeyPerformanceIndexessuchassatisfactionfractionofbookingtrip,relocationcostandsystemrevenueso

Introduction
4
astoconsidertheavailabilityofthisstrategy.
Themainquestionsthatwetrytoanswerare:
• Can I add more configurations to the existing simulator, able toimplementdifferentkindsofbothreactiveandproactiverelocationstrategies?
• Can I fairly compare system performance of different relocationstrategies?
• Can I fairly compare financial performance of different relocationstrategies?
More specifically, the research questions I pose to analyze are thefollowing:
• Howdothedifferentpostchargingrelocationstrategies influencesservicequalityandoperationalcostinthegivencityTurin?
• Howdoproactiverelocationstrategyinfluencesservicequalityandoperational cost comparingwithno relocation strategy scenario inthegivencityTurin?
• How do system parameters such as fleet size, the number ofrelocationworkersandchargingpolesdensityimpactservicequalityandoperationalcostinthegivencityTurin?
Ourresultsshowthatinthereactivemodel,takingthelowbatterycartothenearestavailablechargingpoleshasthemostefficientperformance.Besides,proactive relocation strategymake thewhole systemmaximizethe satisfied demand by increasing relatively acceptable additionalrelocationcost.
Thethesisisorganizedasfollows:InChapterIIIproposemoredetailedintroduction about previous work about relocation in free floating carsharingsystemandthesimulatorIuseforthewholethesis.What’smore,I also review existing scientific literature that talks about the simulator

Introduction
5
modellingtopics.ThencomestoChapter III thatdescribesthesimulatoranddataset that used for the experiment in detail. Besides, I introducebothreactiveandproactiverelocationstrategies.IpresenttheresultsofasimulationcampaignconductedforthecityofTurininChapterIV.Intheend,conclusionandfutureexpectationareproposedinChapterV.

6
Chapter 2
Background Inthissection,Iwillintroducewhysimulationiswidelyusedformodellingandanalysis.Then,Iwillintroducethepythonprojectandthedatathatweusedforthewholethesisexperiment.Otherrelatedtoolshavealsobeenmentionedinageneralview.Besides,thedefinitionofspecificmetricsislistedandshownforanalyzingtheexperimentsresults.
2.1 Simulation Modelling Background
Simulationmodellingsolvesreal-worldproblemssafelyandefficiently.Itprovides an important method of analysis which is easily verified,communicated, and understood. Across industries and disciplines,simulationprovidesvaluablesolutionsbygivingclearinsightsintocomplexsystems. Simulation enables experimentation on a valid digitalrepresentationofasystem.Unlikephysical,suchasmakingascalecopyofa building, simulation is computer based and uses algorithms andequations.Simulationsoftwareprovidesadynamicenvironment for theanalysisofcomputermodelswhiletheyarerunning.Theusesofsimulationinbusinessarevariedanditisoftenutilizedwhenconductingexperimentsonarealsystemisimpossibleorimpractical,oftenbecauseofcostortime.Herearetheadvantagesofthesimulation[5]:
• Risk-freeenvironment: Simulationprovidesa safeway to testandexploredifferent“what-if”scenarios.Theeffectofchangingstaffinglevelsinaplantmaybeseenwithoutputtingproductionatrisk.Maketherightdecisionbeforemakingreal-worldchanges.
• Savemoneyandtime: Virtualexperimentswithsimulationmodelsare less expensive and take less time than experiments with realassets. Marketing campaigns can be tested without alerting thecompetitionorunnecessarilyspendingmoney.
• Visualization: Simulationmodelscanbeanimatedin2D/3D,allowing
conceptsand ideas tobemoreeasilyverified, communicated,and

Background
7
understood.Analystsandengineersgaintrustinamodelbyseeingitinactionandcanclearlydemonstratefindingstomanagement.
• Insightintodynamics: Unlikespreadsheetorsolver-basedanalytic,simulationallowstheobservationofsystembehaviorovertime,atanylevelofdetail.Forexample,checkingwarehousestoragespaceutilizationonanygivendate.
Thesefeaturesareverysuitablefortransportation.Causetransportationisadynamicprocess,thestateofthewholesystemchangesallthetimeandit’shardtogetorcollectdatafromtherealworldduetotimeandscalelimitation. However, each coin has two sides. It also has somedisadvantages:
• Itcanbeexpensivetomeasurehowonethingaffectsanother,totakethe initial measurements and to create the model itself (such asaerodynamicwindtunnels).
• Tosimulatesomething,athoroughunderstandingisneededandanawareness of all the factors involved. Without this, a simulationcannotbecreated.
Theprocessfromscratchisdifficult.Becausetheworkerhastodesignthewholesystem,thestructureandanypartthatinvolveintheEFFCS.Theyalsohavetocollectrealworlddatathatconfigureintothesimulationtomakeitmoreconvinced.What’smore, it ishardbothforunderstandingthescientifictoolitselfandthescenariosthatneededtobeimplemented.Itrequiresbothcodingabilityandresearchabilityatarelativelyhighlevel.
2.2 ICT Background
Pythonischosenastheprogramminglanguagebecauseitiseasytowriteand understand. Due to its corporate sponsorship and big supportivecommunityofpython,pythonhasexcellent librariesthatyoucanuse toselectandsaveyourtimeandeffortontheinitialcycleofdevelopment.• As for simulation part, Simpy[6] is used which is a process-based
discrete-eventsimulationframeworkbasedonstandardPython.Itsevent dispatcher is based on Python's generators and can also be

Background
8
used for asynchronous networking or to implement multi-agentsystems.
• Pandas[7]ismainlyusedfordataprocessing.Pandasallowsvariousdatamanipulationoperationssuchasmerging,reshaping,selecting,aswellasdatacleaning,anddatawranglingfeatures.
• PandasisbuiltontopofNumPy[8]library,whichisthefundamental
pack- age for scientific computing with Python, providing amongotherthingsapowerfulandefficientN-dimensionalarrayobject.
• Tableau[9]isusedforcreateresultfigure.Itisapowerfulandfastest
growingdatavisualizationtool.Ithelpsinsimplifyingrawdataintotheveryeasilyunderstandableformat.DataanalysisisveryfastandclearwithTableauandthevisualizationscreatedareintheformofdashboardsandworksheets.
• OtherusefultoolstoworkwithPythonincludetheIDEsPyCharm[10],
whereIpullandmodifycodeanddosinglerunonlocalPCandtheJupyter[11] Notebook cluster, you can run multiple runs thatconsume more memory and time on the cluster by setting theappropriateportnumber.
2.3 Relocation Background
Inthissection,Ifocusmainlyonreviewingtheliteratureonoperationalaspectsoftherelocationprobleminvehicle-sharingsystemstohighlightmycontributions.IrefertoLaporte[12]foramorecomprehensivereviewofotherrelevantoperationalproblems.
In one-way car sharing systems, relocation can be carried out eitherthroughoperatorintervention,e.g.,usingrelocationpersonnel[13][14][15]andusingatripchoicemechanism[16]orthroughcustomersbycontrollingtheir actions, e.g., through incentives[17]. The focus of relocation is toachieve certain desirable inventory levels either through manualrebalancingusingtrucks[18]orthroughincentivemechanismsdesignedtoinfluencecustomerbehavior[19][20].

Background
9
In an initial conceptual paper,Weikl andBogenberger[22] present andevaluateseveraluser-basedandoperator-basedrelocationstrategiesforFFCSsystems. Inasubsequentpaper,WeiklandBogenbergerproposeapractice ready six step relocationmodel for a mixed FFCS systemwithtraditional and electric vehicles. Based on historical data, the area iscategorizedintomacrozonesandanoptimizationmodelisusedtoachievedesiredmacrolevelrelocation.Rulebasedmethodsareusedformakingintra zone micro-level relocation and refueling/recharging decisions. Asimilarmodelfordemand-basedrelocationinFFCSsystemsispresentedby Schulte and Voß and Herrmann[23]. Caggiani[24] propose dynamicclusteringmethodtoidentifythesizeandnumberofflexiblezonesinwhichtoperformrepositioningoperations.He[25]studiedrobustrepositioningstrategiesindynamicenvironments.
Closely related to my work, Alessandro[26] considers joint decisionmaking for EV relocation. When the charging operations are needed,electric vehicles are relocated to the nearest available charging stationinsteadofthenearestchargingstation.Althoughstationblockingwillnothappen, more relocation distance will be. Different charging relocationstrategies are compared in concern of the system and economicperformance.Onepossiblekindofapproachistoschedulerelocationsatfixed times (e.g., at night), to rebalance the system[27]. In this thesis, Iproposed the relocation strategies that relocation operations arehappenedinagiventimefrequency.
2.4 Related Work
2.4.1 eC2S
Alessandro Ciociola builds simulation named eC2S of the Electric FreeFloatingCarSharing(EFFCS)systemstoobserverealproblemsintermsofspatiotemporaldemandasymmetries.Acityoperatingareaisdividedintosquarezonesofdimension500m*500m.Eachzoneisassignedanidentitynumber.Eachtripismarkedfromanoriginzonetothedestinationzone.Everytripdistanceinthesimulationincomputedfromazonecentroidtoanotherzonecentroid.Duringthetrip,vehicleisnotavailableandmovesfromonezonetoanother,itsbatterylevelcorrespondingdecreaseswith

Background
10
thedistance.Afterthetripends,vehiclebecomesfreecarsindestinationzones. Theydefined valid zones as zones thatbecomedestinationof atleastonetripforthewholesystemduration.Chargingzoneisthezonewithcharging poles. The number of charging zones is given by a specificpercentageofthewholevalidzones.Chargingpolesarelocatedintheareaofthecitywiththehighestprobabilityofbeingdestinationzones.Figure2.1showsakindofpossiblethechargingzone’sdistributioninthecityofTurinbysettingtheratiobetweenchargingpolesandvehiclesto0.02.Wecanseethattripsaremore likelytohappened inthecentralofthecity.EachzonehasNpolesthatallowsNvehicleschargingatthesametime.Attheendofarental,ifthebatterylevelofavehicleisbelowathresholdb and needs to be charged to threshold a, we can have the highestprobabilitythatitdoesnotneedtoberelocatedandgetcharged.Ifthereareno charginghubs in its own zone, it is relocated to the closest freecharging point. Thismeans if there are charging poles in zone A and BwherezoneAisclosertothelowbatteryvehiclecomparedwithzoneB.ThevehiclewillberelocatedtozoneAunlessallofthechargingpolesarebeeninuseinzoneAwhilepolesinzoneBareavailable.Ifthereisnofreechargingpoleanywhereinthecity,thecarqueuesatthenearestchargingpole.Whenthechargingoperationends,it’sfreetochooseifthevehiclewillrelocatetoitsoriginzoneorjustleaveinthechargingzone.

Background
11
Figure2.1possibleChargingZoneLocationinTurin
2.4.2 Dataset Theinputdatacomesfromactualrentalsperformedbycar2gousersinthe city of Turin [5]. Each observed rental has precise geo-spatialcoordinatesfororiginanddestination,andaccuratetimestamps.Dataarestoredincsvformatfile.Eachlinecorrespondstoatrip.EachbookinghasthefollowinginformationdescribedinTable1:
Parameter Description Examplevalues
plate plateofthevehiclethatperformedthetrip 245/FF124SJ
start_time startingtimeofthebooking 2017-10-0102:00:37+02:00
end_time endingtimeofthebooking(unixtime)
2017-10-0102:37:18+02:00
start_longitude longitudeoftheinitialposition 7.628310000000001

Background
12
start_latitude
end_longitude
latitudeoftheinitialposition
longitudeofthefinalposition
45.0507
7.6712end_latitude latitudeoftheinitialposition 45.07638
euclidean_distance distancetravelledinmeters(lineconnectinginitialand
finalposition)4413
duration timeofthebookingsinsecond(final_timeminus
init_time)2201.0
start_year startyearatthebeginningofthebooking 2017
end_year endyearatthebeginningofthebooking 2017
year yearofthebooking 2017
start_month startmonthatthebeginningofthebooking 10
end_month endmonthatthebeginningofthebooking 10
month 10
start_hour starthouratthebeginningofthebooking 2
end_hour endyearatthebeginningofthebooking 2
start_weekday startdayatthebeginningofthebooking Sun
end_weekday enddayatthebeginningofthebooking Sun
start_daytypeIfstartdayisSundayorSaturday,thestart_daytypeis
weekend,otherwiseisweekday. weekend
end_daytypeIfenddayisSundayorSaturday,theend_daytypeis
weekend,otherwiseisweekday. weekend
TABLE 2.1
DATA FORMAT OF INPUT BOOKING REQUESTS
2.4.3 Related Metrics Theinterventionofthesystemisalwaysaccompaniedbycosts.Thewholesystem should be profitable for the provider, so costs and additionalbenefitshavetobecompared.Inordertomonitorthesystemperformanceandeconomiceffect,thefollowingmetricsarelistedandconsidered:
FractionSatisfied: Percentageofsatisfieduserrequests.Itiscalculatedasnumberofsatisfieduserrequestsdividetotalrequests.Whenanewrental

Background
13
request isgenerated, the system looks foranavailablecarwithenoughbatteryintheoriginzone,orinits1-hopneighborzone.Iftheusercan’tfindanavailablecarclosetotheoriginoftherequest,ordidnotfindacarwithenoughenergytoperformthedesiredtrip.Therequestisregardedasunsatisfied. This metric shows the system’s ability in distributing thevehicleswiththechangeabledemandandqualityoftheserviceintermsofcarsavailabilityforusers’requests.
RelocationCost: it givesan indicationof thecostof chargingprocess intermsoftimeofmoneyneededtodrivecarstocharge.Whenacarneedstobechargedandnouseriswillingtohelp,thesystemhastophysicallymoveittotheclosestchargingpoint.Relocation isanextraactivitythatexecutesbysystememployedworkers.Theyhavetobepaidgivenhourlysalary.Thetotalrelocationworkingcostcanbecalculatedas:
relocation worker cost = N workers * duration days * 24 * hourly worker cost
chargingcost:Therearechargingpoles infrastructurecostandchargingenergycostforelectricvehicles.Polescostisdefinedas:
poles cost = (N charging poles) * duration months * (hardware cost / pole useful life + pole labor cost / pole useful life + pole annual maintenance cost + pole annual tax) / 12
cpszonespercentage:Describethechargingzonesdensity.Forexample,ifitequalsto0.02,itmeansthatthenumberofchargingzonesis2%ofthenumberofvalidzones.
npolesnvehiclesfactor: Describethechargingpolesdensity.Thebiggerthenumberis,themorechargingpolesthewholesystemhas. Forexample,if it equals to 0.02, itmeans that the number of charging poles is twopercentageofthenumberoftotalsystemvehicles.
Energy cost is described by total kWh charging energy been used andenergyprice0.19euro/kWh.Itcanbecalculatedas:
energy cost = tot charging energy * kWh price
Revenue: Revenueisthesystemincomethatuserspayforrentingthe

Background
14
vehicles.Priceperminuteforusingthevehicleis0.2euro.Thus
revenue = tot mobility duration * price per minute
Profit: Profitdescribesthenetincomeofthesystem.Itisdefinedas
profit = ( revenue – total cost ) / total cost
Inordertoimprovethewholesystemperformance,differentrelocationstrategiesare implemented.Theyaredividedintwocategories:reactiveand proactive approaches. Reactive relocation refers to the relocationoperations happen only at the end of the trip. However, proactiverelocation operations happen at a given time frequency.With reactivestrategies,wedecideifandhowtorelocateonlywhenacertainconditionis triggered during the simulation.With proactive strategies,we decidehowandwhentorelocatewithaschedule. ImplementationdetailswillbediscussedinChapterIII.

15
Chapter 3
Methodology and Tools Inthissection,thestructureofthesimulatorwillbeintroducedfirst.Then,theextrametricsthatusedforshowtheexperimentresultswillbelisted.What’smore, thedefinitionandexplanationofeach relocation strategywillbementioned.
3.1 Simulator
eC2S is a data-driven, discrete-event simulation software for EFFCS(ElectricFreeFloatingCarSharing)system.Itisabletomodelcarsharingdemand from data coming from real car sharing systems and runparametricsimulationcampaigns,providingalsoanalysisandvisualisationtools useful to compare different charging scenarios and fleetmanagementstrategies.ItiswritteninPythonandcontainsthefollowingfolders:
• Demand_Modelling: contains code which implement the demandmodelforbyconfiguringcity,duration,simulationtechniqueandsoon.
• Data: containsrawdataincludingbookingtrips,citygeometricandchargingstationsinformsofpickleandcsv.
• Supply_Modelling:containscodewhichimplementthesupplymodelformeetingthedemandbyconfiguringnumberofvehicle,chargingpolesplacementpolicyandsoon.
• SimulationInput: contains classes implementing the logic formanagingthe inputof thesimulation.This includesmanydifferentrunningconfigurations,statisticalmodelsandshareddatastructures.
• Simulation:containsclassesimplementingthesimulationlogic.This

MethodologyandTools
16
includes the abstraction for user requests generation, mobility,chargingandrelocationstrategies.Itisthecoresimulationmodule.
• SimulationOutput: contains classes for statistics collection,aggregationandvisualisation.
• SingleRun: containsfunctionsforrunningasinglesimulationwithaspecifiedconfiguration.
• MultipleRun: contains functions for running a set of simulationsfollowingagridofconfigurationparameters.Itispossibletorunasetofsimulationsonmanycoresinparallel.
• Figures: contains charts produced in the simulation output phaseorganized by simulation city, scenario and configuration name. Itincludes booking requests and charging boxplot, event profiles,vehiclefeatureprofileandboxplotetc.
• Results: contains simulation results in form of pickles and csvorganised by simulation city, scenario and configuration name. Itincludes detailed booking requests, all system configuration andperformancemetrics,historystatusofstations,vehiclesandzones.Moredetailedmetricsabouttheresultfileareinappendix.
Eachbookingrequesthasseveralfeatures.Originidisthezonewhichthetripstartlocationbelongsto.Destinationidisthezonelocationwhichtheendlocationbelongsto.DrivingdistanceiscomputedasEuclideandistancebetween two zones multiplied by a correction factor representing theaveragedrivingdistance.Moreover,date,hourandstarttimeandendtimedescribeitstimeattribute.
3.2 Extra Metrics
Inordertoconsidersystemperformanceandeconomiccostindifferentrelocationstrategies,moredetailedmetricsshouldconsider.Asforsystemperformance,Iconsiderrelocationoutwarddistance,whichrepresentsthesumofallrelocationdistanceofthesystem.

MethodologyandTools
17
Asforeconomiccost,therewillbechargingpolesforchargingrelocationstrategies.Therefore,extracostforpreparationforthechargingzoneareneeded:zone make-ready cost = make-ready cost per zone * n charging zones /pole useful life / 12 * duration month Thus,thetotalcharginginfrastructurecostis:
charging infrastructure cost = poles cost + zone make-ready cost
Besides,carscostisdefinedas: cars cost = n vehicles * vehicles*annual leasing cost/ 12* duration month
scenario cost = cars cost + charging infrastructure cost
Washingcostisdefinedas:washing cost = disinfection cost *n charges + washing cost * n bookings / 100 Thecostforthesimulationprocessisdefinedas:
sim cost = relocation worker cost + energy cost + washing costThetotalcostforthewholesystemissumofsimulationcostandscenariocost:
total cost = scenario cost + sim cost
3.3 Reactive Relocation Strategy
E3f2shastoensurethatvehiclesspreadinthecityhaveenoughenergytoservetheusers. Aftertheendofeachtrip,thesimulatorshouldcheckeachvehicle’sbatterylevel,ifitisbelowaspecificthreshold,thevehicleneedstobechargebeforeitservesthenexttrip.Chargingpolesarenotlocated in every zoneof the city. So here comes to the question about

MethodologyandTools
18
choosing which zones with charging poles the low battery vehicle willrelocateto.HereIproposethreedifferentkindsofstrategiesinchoosingchargingzones:
• Closest_free:choosethenearestzonewithavailablechargingpolesto charge. After relocation operation, the vehicle can be chargedimmediately.FirstIwillsortthezonesbythedistancebetweentherelocationstartingzoneandallthechargingzone.ThenIwillcheckifthenearestchargingzonehasfreepoles,ifithasthenIchoosethiszone as charging relocation zone otherwise move to the secondnearestchargingzoneandcheckandsoon.
• # find the nearest available station with charging poles • for zone in zones_by_distance.index: • # check if the nearest charging zone is available • if self.charging_stations_dict[zone].charging_station.count <
self.charging_stations_dict[ • zone].charging_station.capacity: • free_pole_flag = 1 • charging_zone_id = zone • # calculate the energy needed for relocation • cr_soc_delta = self.get_cr_soc_delta( • booking_request["destination_id"], • charging_zone_id, • vehicle • ) • # remaining energy is not enough for relocation, mark the zone unavailable • if cr_soc_delta > booking_request["end_soc"]: • free_pole_flag = 0 • # choosing the zone as the relocation charging zone • else: • charging_zone_id = charging_zone_id • break
• Random:randomlypickonezonewithchargingpolestocharge.After
relocationoperation,thevehiclecanbechargedimmediately.Ijustpickonerandomchargingzonetocheckifithasfreechargingpoles.If ithas, Ichoosethiszoneaschargingrelocationzoneotherwise Ipickanotherzonerandomlyandcheckagainandsoon.

MethodologyandTools
19
• # find a random station to charge • while True: • # randomly pick one zone • random_zone_id = random.choice(zones_by_distance.index) • # remove the zone from picked zone list • zones_by_distance.pop(random_zone_id) • # check if the charging zone is available • if self.charging_stations_dict[random_zone_id].charging_stati
on.count < self.charging_stations_dict[ • random_zone_id].charging_station.capacity: • free_pole_flag = 1 • charging_zone_id = random_zone_id • # calculate the energy needed for relocation • cr_soc_delta = self.get_cr_soc_delta(booking_request["des
tination_id"], charging_zone_id, vehicle) • # remaining energy is not enough for relocation, mark the zone unavailable • if cr_soc_delta > booking_request["end_soc"]: • free_pole_flag = 0 • else: • charging_zone_id = charging_zone_id • # if the charging zone is available or all the zones have been picked,finish the
picking loop procedure • if free_pole_flag == 1 or zones_by_distance.empty : • break
• Closest_queueing: choose thenearest zonewithchargingpoles to
charge. After relocation operation, the vehicle should wait in thequeueuntilotherchargingoperationendsandchargingpolebecomeavailableagain.FirstIwillsortthezonesbythedistancebetweentherelocationstartingzoneandallthechargingzone.ThenIwillsetthenearestchargingzoneaschargingrelocationzone.
• # find a nearest station to charge • # sort the other charging zones by distance with the giving vehicle zone id • zones_by_distance = self.simInput.supply_model.zones_cp_distances.loc[ • int(booking_request["destination_id"]) • ].sort_values() • free_pole_flag = 0 • for zone in zones_by_distance.index: • free_pole_flag = 1 • charging_zone_id = zone • # calculate the energy needed for relocation • cr_soc_delta = self.get_cr_soc_delta( • booking_request["destination_id"], charging_zone_id, self
.vehicles_list[vehicle] • ) • # remaining energy is not enough for relocation, mark the zone unavailable • if cr_soc_delta > booking_request["end_soc"]: • free_pole_flag = 0

MethodologyandTools
20
• # choosing the zone as the relocation charging zone, finish the picking loop procedure
• else: • charging_zone_id = charging_zone_id • break
Relocationoperationaredescribedasadictionary:1. charge_dict = { 2. "charge": charge, 3. "resource": resource, 4. "vehicle": vehicle, 5. "operator": operator, 6. "zone_id": charging_zone_id, 7. "timeout_outward": timeout_outward, 8. "timeout_return": timeout_return, 9. "cr_soc_delta": cr_soc_delta, 10. "charging_outward_distance": charging_outward_distance 11. }
ZoneidisthechargingzoneidIchooseforrelocation.Timeoutoutwarddescribesthetimedurationofdoingtherelocationoperation.Ifrelocationflagequalstotrue,thevehiclehastoreturnbacktoitsoriginzonebeforechanging, timeout returnwillbeequal to timeoutoutwardotherwise0.Cr_coc_deltaisthebatteryconsumptionofdoingtherelocationoperationandchargingoutwarddistanceisthedistancebetweenrelocationstartingzoneandrelocationendingzone.Therelocationcostandsystemperformancewilldifferwithintheabovethreestrategies,causetherelocationpathanddistanceistotallydifferent.The closest_queueing strategy definitely has the minimum relocationdistance however closest_free strategy saves time forwaiting in queue,thus will make vehicle become available again more quickly. Randomstrategy is hard to tell its pros and cons. The overall performance willdependontheirexperimentresults.
3.4 Proactive Layer Relocation Strategy
The above part is reactive relocation, which means that the systemdecideswhethertodorelocationoperationsattheendofeachtrip.Thiskind of relocation strategy will be very time consuming and lack ofintelligence. Inordertoavoidthisproblem, Ihaveproposedaproactive

MethodologyandTools
21
layerrelocationstrategy.Thiskindofrelocationisnothappenedbytripsbutonaregulartimeduration.Wesettherelocationoperationexecuteattheendofeachhour.Whentripsendinthescheduledtimeslot,wetriggerrelocation. In otherword, proactive relocationhappens24 times aday.Givenanumberof relocationworkersN,eachworkerwill removeacarfromonechoosingzonetoanotherdestinationzone.So,therewillbeNelectricvehicleschangingtheirpositionseparatelyattheendofeachhour.Whichstrategieswewillusetochooserelocationstartingzonesandendingzones?3.4.1. Zone Selection Techniques
• Aggregation:Bychoosingstarting(ending)zone,wechoosecars inthemost(least) aggregatedand crowded zones.We sortedall thevalidzonesbythenumberofvehiclesinitszonebydescendingorder.ThenweselectedtopNzonesasourrelocationstarting(ending)zone.
• KDE[28][29]: By choosing the destination zones,we first tomake
surethattheendingzoneshouldbethevalidzones.Thentheendzoneslistshouldnotoverlapwiththestartingzones.Otherwisetherelocationworkisuseless,onerelocationmovesvehiclefromzoneAtozoneB,theothermovesitbackfromzoneBtoA.Thenweusethenexthour’sKDEdistributiontogenerateendingzoneforNtimesin order to get N ending zones. In statistics,kernel densityestimation(KDE) is a non-parametric way toestimatetheprobabilitydensityfunction of a random variable.Kernel densityestimationis a fundamental data smoothing problem whereinferencesabout thepopulationaremade,basedona finitedatasample.KDEislargelyusedasageneraltoolinspatialanalysis.Forexample,parametersoftrafficaccidentpredictionmodelshavebeenestimated mainly based not on KDE but on raw count data inJapan.Yu etal. (2014)recently reported that KDE outperformedother hazardous road segment identification methods. Wegeneralize over space using KDE. For this purpose, we leverageKernelDensity estimator from scikit-learn,with aGaussian kernelanda2x2identitymatrixasbandwidth.First,wedividethecityinto

MethodologyandTools
22
500mx500msquares,generatingamatrixofcityzones.Then,wefita four-dimensionalKDEonorigin-destination zonecouples,whereeachzoneisrepresentedbyitstwoindexesinsidethematrix.Wedothis fitting 48 times, one for each time slot forweekdays and forweekends. Thus, we have a spatial representation of mobilitypatternsbetweendifferentzonesduringeachhouroftheday.
• Delta[30]:Itisthemostcomplextechniquethatwepropose.Itusesthefractionofcurrentavailablevehiclesineachzone,asaproxyforcurrent state S. It uses approximated counts of origins (O) anddestinations counts (D), to calculate a prediction of the the totaloutcomingorincomingflowofvehiclesinazoneatagivenhourofagiventypeofday(i.e.,weekdayorweekend).OandDarederiveddirectlyfromthetrace,computingtheaverageout-flowandin-flowofvehiclesfromazoneatagivenhourofagivendaytype,andtheytypeforzonezisthemcomputedasthedifferencebetweenO(d,i;z)andD(d,i;z).Apositiveflowmeansthatwepredictthatthenumberofvehiclesdepartfromazoneatagivenhour,willbehigherthanthenumberofvehiclesarrive.Thestrategyselectsasstarting(ending)zone the one with the lowest (highest) delta (∆), which is thedifferencebetweenpredictedflowfornexthour(s)andcurrentstate,foragiventimet(inhours)andagivenzonez,ascanbeseenin(3.1).Thus, higher delta means that a shortage of vehicles is moreprobable.Forexample,itcanmeanthatwepredicthighpositiveflowandweknowfromSthattherearenotenoughvehicles.
∆ d, t; z = ( ),*;+ ,- ),*;+./012./3
4− S(d, t; z) (3.1)
ThisistheonlystrategyforwhichwecanspecifyawindowwidthW,tobe able to take into considerationmore than just one hour in the nextfuture.Thisisalsotheonlystrategythatallowsustorelocatemorethanonevehiclesatatime,withanumberofrelocatedvehiclesthatisgivenby∆itself.

23
Chapter 4
Case Study of Turin Inthischapter,variousrelocationstrategiesareimplementedandtestedinthesimulationbygivendifferentconfigurations.Aftergettingthedigitalresults,IdrawdifferentplotsinTableauinordertovisualizetheresultandanalyzethem.
4.1. Reactive Relocation Strategy Results
Inordertocomparesystemperformanceandeconomicperformanceofthreedifferentpostchargingrelocationstrategies. Irunthesimulator inthecityofTurinfromOctobertoNovemberof2017.Theparametersgridforthissetofsimulationsisintable4.1.
Parameter Description Values
a thechargingthreshold 20
b thechargingupperbound 100
cpszonespercentage chargingzonesdensitywithregardstototalzones 0.2
Npoles/Nvehiclesfactor
numberofchargingpoleswithregardstovehicles (0.01,0.19),step0.01
nvehiclessim totalvehiclesruninthesimulation 414
relocationtheflagtoshowifthecarafterchargingwillbring
toitsoriginzonebeforechargingFalse
relocationworker Thenumberofchargingrelocationworkers 1000
chargingrelocationstrategy
chargingrelocationstrategyusedforexperiments["closest_free",
"random","closest_queueing"]
annualleasingcost annualleasingcostpervehicle 4000
disinfectioncost disinfectionperchargingoperation 15

CasestudyofTurin
24
washingcost washingcostpervehicle 8
polelaborcost laborcostforbuildingthepole 2200
polehardwarecost hardwarecostforbuildingthepole 1700
poleusefullife howmanyyearsapolecanuse 10
poleannualmaintenancecost
polemaintenancecostperyear 5000
cosapannualtax poletaxfeeperyear 355
zonemake-readycost buildingcostperzone 1500
kWhcost energypriceperkWh 0.19
priceperminute pricethewhenauserusethevehicleperminute 0.2
requestratefactortheratiobetweenthenumberoftherealbooking
requestandinputbookingrequest1
TABLE 4.1
PARAMETER FOR CHARGING RELOCATION EXPERIMENTS
4.1.1. System Performance
Fig.4.1.1:FractionSatisfiedwithrespecttoNpoles/NvehiclesFactor.Curvesshowtheperformancewithdifferentchargingrelocationstrategies.

CasestudyofTurin
25
Figure4.1.1showsthefractionsatisfiedvaryingdifferentchargingpolesand relocation strategies.We can see that themore chargingpoles thesystemhas,themorebookingrequeststhatcanbesatisfied.Becausewhenthetripends, if thesystemhasasmanypolesaspossible,thevehicle iseasily to find charging poles and can reach to the charging zones veryquickly, at the same time it consumes little battery for relocation, thuschargingdurationalsodecreases.Asforrelocationstrategy,closest_freeand random has the overall better performance compared withclosest_queueing.WhentheNpoles/NvehiclesFactorisgreaterthan0.04,thesatisfiedfractionstaysinstablerateataround90%forthetwobetterstrategies. But for N poles/N vehicles Factor greater than 0.15, theperformancedoesn’tvaryalot.Therefore,itisnotnecessarytoincreasecharging poles as much as possible in order to improve systemperformance.Thereasoncanbethatasforclosest_queueing,thevehiclemayneedtowaitafteritreachestothechargingzone,sothevehicleisnotavailablebothatchargingtimeandwaitingtime,thisstrategywillreducethenumberofavailablevehiclesforthewholesystem,thusinfluencethesystemperformanceinsatisfybookingrequest.In Figure 4.1.2 shows the chargingoutwards distance varyingdifferentchargingpolesandrelocationstrategies.Wecanseethatthereisaclearorderthatrandomisgreaterthanclosest_free,andclosest_freeisgreaterthan closest queueing for charging outwards distance. It’s easily tounderstandbecauseinclosest_queueingstrategy,vehiclerelocatestoitsnearestzonehoweverclosest_free’s relocationzonemaya little furtherthanclosest_queueingbecausethezoneshouldbenotonlychargingzonebutalsocurrentlyfreeforcharging.Asforrandomrelocation,itisthemostdistanceconsuming.Therelocationzoneselectioniscompletelyrandomregardlessoftherelocationstartingzoneofthevehicle,thereforethesumofrelocationdistanceismuchhigherthantheothertwostrategies.Withthemoredensityofpolesintheoperationzone,vehicleismoreeasilytofindachargingzoneinitsneighbor,thereforethetotalchargingoutwardsdistancedecreaseswhen thenNpoles/NvehiclesFactor is greater than0.05bothinclosest_queueingandclosest_free.

CasestudyofTurin
26
Fig.4.1.2:ChargingoutwardsdistancewithrespecttoNpoles/NvehiclesFactor.Curvesshowtheperformancewithdifferentchargingrelocationstrategies.
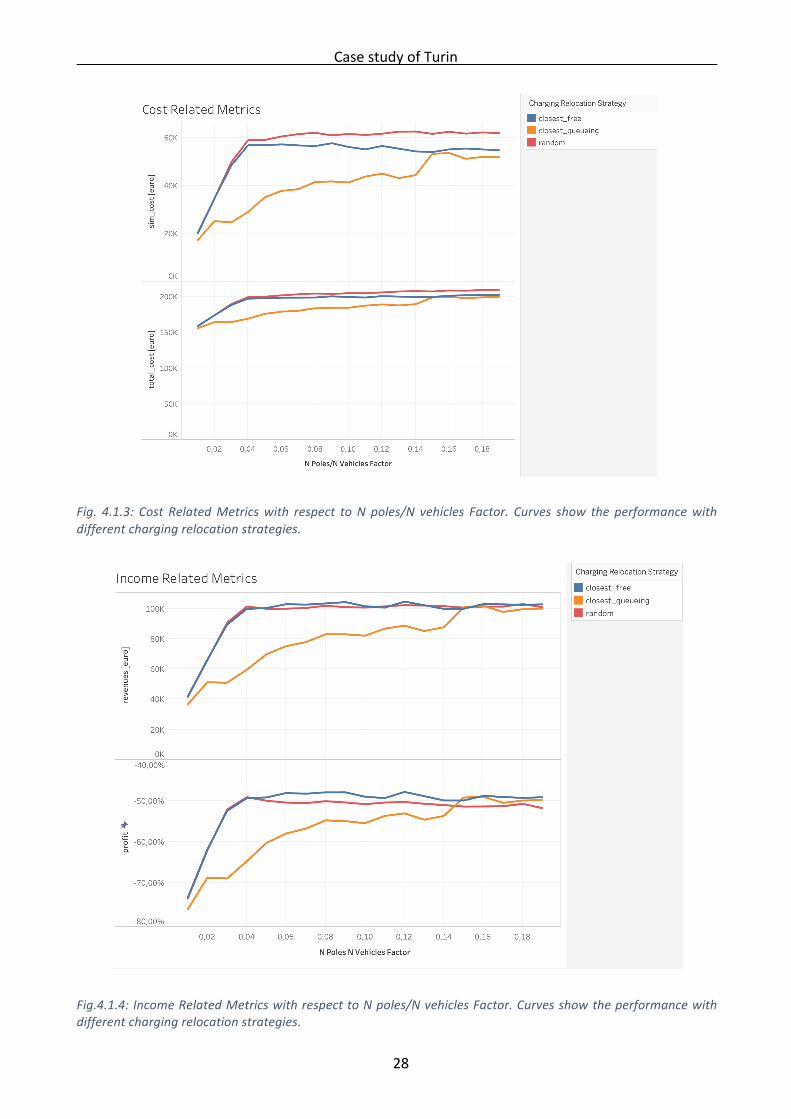
4.1.2. Economic Performance Thenwemovetoanalyzeeconomicmetricsforrelocationandthewholesystem.InFigure4.1.3,Ishowthecostrelatedmetricsincludingsimulatorcostandtotalcost.Firstly,itiseasytotellthatthemorechargingpolesthesystemhas,themoreinfrastructurecostforbuildingthechargingzoneandcharging poles will have. Therefore, the total cost will increase byincreasingchargingpoledensity.Next,asforsimulationcost,wecanseethatcostofrandomrelocationstrategyisgreaterthancostofclosest_freestrategy. Closest_queueing strategy has the lowest cost. This result isaccordance with the order of charging outwards distance and fractionsatisfiedabove.Themoresatisfiedfractionis,themorebookingrequestwill be. Therefore, there will be more vehicles need to charge so thecharging cost increase.Closest_queueing strategyhas the least satisfiedfraction,hence,thesimulationcostisthelowest.Closest_freeandrandomhave relatively equal satisfied fraction, but closest_free’s relocationdistancelowerthanrandom’s,sothecloest_free’ssimulationcostislowerthanrandom’s.Sincetotalcostisthesumofsimulationcostandscenario

CasestudyofTurin
27
costand scenario costdoesn’t changewithdifferentkindsof relocationstrategy,theshapeandtendoftotalcostisaccordancewiththesimulationcost.Finally,inFigure4.1.5,Ianalyzetherevenueandprofitsbygivingdifferentcharging relocation strategies. Revenue is strongly linear related to thetotalmobilityduration.So,wecangetaconclusionthatthemoresatisfiedfractionis,themoremobilitydurationitwillbe.Inconsequence,revenuewillbehigherwithmoresatisfiedfraction.Cloest_queueinghasthelowestsystem performance, therefore, it causes in the lowest revenue.Closest_freeandrandomhastherelativelysamesystemperformancesotherevenuetheygetisrelativelythesame.Profitsreferstonetincomeofthewholesystem,sobothcostandrevenuewillinfluencetheprofitrateofthecarsharingsystem.WecanseefromthefigurethatbytheNpoles/Nvehicles Factor is smaller than 0.15, closest_queueing has the lowestsystemprofits.Thereasonisthatalthoughclosest_queueingcostleastinrelocationandtotalsystem,italsobringstheleastrevenueforsatisfyingbookingrequest.Itbothearnstheleastandcosttheleast.However,fortheothertworelocationstrategies,boththerevenueandcostisrelativelyhigh,thustheprofitdon’tvaryalot.Butingeneral,closest_freehasthehighest profit because its relocation distance is much smaller thanrandom’s.Throughcomprehensiveconsiderationoftheabovedata,wecangetthefinalconclusionthatinthesimulationcaseofcityofTurinwiththespecificconfiguration,closest_queueingrelocationstrategyhastheworstsystemperformance. What’s more, closest_free is the best solution both forsystem performance and economic performance. Besides, as for thechargingpoledensity,too lowortoohigh isnotagoodchoice.Toolowdensityleadstobadsystemperformance,however,toomuchpolescostalot. Hence, N poles/N vehicles Factor between 0.04 and 0.15 performsgoodintheTurincasestudy.
CasestudyofTurin
28
Fig. 4.1.3: Cost RelatedMetricswith respect toN poles/N vehicles Factor. Curves show the performancewithdifferentchargingrelocationstrategies.
Fig.4.1.4:IncomeRelatedMetricswithrespecttoNpoles/NvehiclesFactor.Curvesshowtheperformancewithdifferentchargingrelocationstrategies.

CasestudyofTurin
29
4.2. Proactive Relocation Strategy Results
Still,inordertoseehowdifferentproactivelayerstrategieswillaffectthewholecarsharingsystem.Iimplementtheproactivelayerstrategyintheoriginalsimulator.Thenumberofrelocationworkerswillinfluenceboththe relocation throughput and relocation cost. Therefore, differentnumberofrelocationworkersaresetandtested.IrunthesimulatorinthecityofTurinfromOctobertoNovemberof2017.Theparametersgridforthissetofsimulationsisintable4.2:
Parameter Description Values
a thechargingthreshold 20
b thechargingupperbound 100
nvehicles totalvehiclesruninthesimulation (100,400),step10
nrequests numberofbookingrequests 10000
cpszonespercentagechargingzonesdensitywithregardstototal
zones0.2
Npoles/Nvehiclesfator
numberofchargingpoleswithregardstovehicles
0.2
chargingrelocationstrategy
chargingrelocationstrategyusedforexperiments
"closest_free"
annualleasingcost annualleasingcostpervehicle 4000
disinfectioncost disinfectionperchargingoperation 15
washingcost washingcostpervehicle 8
polelaborcost laborcostforbuildingthepole 2200
polehardwarecost hardwarecostforbuildingthepole 1700
poleusefullife howmanyyearsapolecanuse 10
poleannualmaintenancecost
polemaintenancecostperyear 500

CasestudyofTurin
30
cosapannualtax poletaxfeeperyear 355
zonemake-readycost buildingcostperzone 1500
kWhcost energypriceperkWh 0.19
vehiclerelocationtheflagtoshowifproactiverelocationwillbe
execueted[True,False]
vehiclerelocationstrategy
vehiclerelocationstrategychosenforexperiments
"only_scheduled"
vehiclerelocationtechnique
howtochoosestartingzonesandendzonesofrelocation
[{"start":"aggregation","end":"kde_sampling",},
{"start":"delta","end":"delta",}]
nrelocationworkers thenumberofproactiverelocationworkers [0,3,6,9,12]
workerhourlysalary priceforhiringtherelocationworkers 18
priceperminute pricethewhenauserusethevehicleperminute
0.2
requestratefactortheratiobetweenthenumberoftherealbookingrequestandinputbookingrequest
1.69546
TABLE 4.2
PARAMETER FOR PROACTIVE RELOCATION EXPERIMENTS
4.2.1. System Performance In the Figure 4.2.1.1, I visualize the satisfied fraction of thewhole carsharing system in the above configuration. Part (a) shows the systemperformance among different proactive relocation strategies. It is clearthatproactivelayerstrategyimprovesthesatisfieddemand.What’smore,deltarelocationstrategyperformsbetterthanotherstrategy.Ichangethetotalnumberofvehiclesinthewholesystemandthenumberofrelocationworkersinpart(b).Themoreworkers,themorerelocationsareexecutedhourly.Whenthenumberofworkerequalsto0,itmeansthatnosystemoperatoroperatesvehiclerelocation,therefore,proactivelayerrelocationdoesn’t trigger. We can see that when compared with no proactive

CasestudyofTurin
31
relocation,proactiverelocationhasanaverage2%~10%improvementinfraction satisfiedmetricwhen thenumberof vehicles is inanabundantlevel.However,whenthenumberofvehiclesistoolittle,inthiscaselessthan 160, fraction satisfied doesn’t vary a lot. The reason is that thenumber of vehicle itself can’t meet the demand of system, instead ofunbalanced distribution of vehicles leads to the unsatisfied bookingrequest.Whenthenumberofrelocationworkersincreases,thenumberofsatisfiedbookingrequestsalsoincreases.Thereasonisthatmorevehiclesarerelocatedtotheregionwhichmorerequestsaregenerated.Anotherobviousphenomenon is that themorevehicles thewholesystemowns,themorebookingrequestcanbesatisfied.
(a)variousstrategies (b)variousnumberofworkers
Fig4.2.1.1:FractionSatisfiedwithrespecttothenumberofvehicles.
Fig.4.2.1.2:FractionSatisfiedwithrespecttothenumberofvehiclesfornewproactiverelocation.Curvesshowtheperformancewithdifferentnumberofrelocationworkers.

CasestudyofTurin
32
Meanwhile, I also analyze vehicle relocation distance by varying thenumberofrelocationworkers.TheresultsareshowninFigure4.2.1.3.Itiseasytounderstandthatwithmorenumberofworkers,morerelocationoperations are executed, so the total relocation distance is positivelycorrelated with the number of workers. When the number of vehiclesincreases,totalvehiclerelocationdistancealsoincreasesslightly.Wecansee from Figure 4.2.1.4 that the number of relocations also increasesslightly with the number of vehicles increases. Why the number ofrelocationoperationincreases?Thereasonisthatalthoughourproactiverelocation is triggered hourly, it selects vehicles which end their tripsrecently. That means that only if a trip ends in a zone included in theschedule,we relocate. So,wedo less relocation thanplanned,until thenumberofvehicles ishighenoughtotriggerallscheduledrelocationforeachhour.Inordertoavoidthisissue,Ihavedevelopedanewproactiverelocationstrategy.Therelocationoperationisonlytriggeredattheendofeachhour,insteadoftheendoftrip.Theresultsareshownbelow:
Fig.4.2.1.3:TotalVehicleRelocationDistancewithrespecttothenumberofvehicles.Curvesshowtheperformancewithdifferentnumberofrelocationworkers.

CasestudyofTurin
33
Fig.4.2.1.4:NumberofRelocationswithrespecttothenumberofvehicles.Curvesshowtheperformancewithdifferentnumberofrelocationworkers.
WecanseefromthelowerpartofFigure4.2.1.5thatthenewproactiverelocationstrategykeepsthesameamountofrelocationsnomatterthenumberofvehicleschangesornot.Meanwhile,withhighercardensity,shorterdistancebetweenthestartingzoneandendingzonewillbe.Forthis reason, the total relocation distance decreases slightly with thenumberofvehiclesincreases.Besides, satisfied fraction isalsoupdatedandplotted inFigure4.2.1.2.With more relocations, more requests will be satisfied. The systemperformancegapbetweennorelocationandrelocationbecomesbigger.

CasestudyofTurin
34
Fig.4.2.1.5:NumberofRelocations&RelocationDistanceofnewproactiverelocationwithrespecttothenumber
ofvehicles.Curvesshowtheperformancewithdifferentnumberofrelocationworkers.
Fig.4.2.1.6:NumberofRelocations&RelocationDistanceofdeltastrategywithrespecttothenumberof
vehicles.Curvesshowtheperformancewithdifferentnumberofrelocationworkers.

CasestudyofTurin
35
4.2.2. Economic Performance Now we move to see the economic change that the proactive layerstrategybrings.Firstly,let’sseetheindexofrevenueinFigure4.2.2.1.Thetrendandshapeofrevenuearesimilarwiththesatisfiedfraction.Whenthenumberofvehiclesissmallerthan160,revenuesdoesn’tvaryalotbydifferent number of workers.When the number of vehicles is enough,proactivelayerstrategyactuallyimprovestherevenueofthewholesystem.Withmore number of workers, themoremoney the system can earn.However, that’s not absolute regulation. We can see that when thenumberofvehiclesequal to310, threerelocationworkersbringshigherrevenuecomparedwithsixandnineworkers.Thenreasonisthatrevenuereflectsthetotalmobilityduration.Totalmobilitydurationistheproductofnumberofbookingrequestandaveragedurationpertrip.Withmorerequestssatisfied,thatdoesn’tmeanthetotalmobilitydurationwill100%increase. But in a general view, increasing the number of relocationworkers has a positive effect in increasing the whole revenue. WhenconsideringnewproactiverelocationstrategyinFigure4.2.2.2,revenuesbecomeshigherwiththesamenumberofrelocationworkersandvehiclesbecauseofhighersatisfiedfractionforthecarsharingsystem.
Fig.4.2.2.1:TotalRevenueswithrespecttothenumberofvehicles.Curvesshowtheperformancewithdifferentnumberofrelocationworkers.

CasestudyofTurin
36
Fig.4.2.2.2:TotalRevenuesofnewproactiverelocationwithrespecttothenumberofvehicles.Curvesshowtheperformancewithdifferentnumberofrelocationworkers.
Figure 4.2.2.3 shows the cost related metrics including total cost andproactiverelocationcost.Relocationcostishighlycorrelatedwiththetotalrelocationdistance.BoththeshapeandtrendissimilarwithupperpartofFigure 4.2.1.6. As for total cost, it is easy to figure out that the morevehiclesandthemorenumberofrelocationworkers,thehighertotalcostwillbe.

CasestudyofTurin
37
Fig.4.2.2.3:TotalCost&ProactiveRelocationCostofnewproactiverelocationwithrespecttothenumberofvehicles.Curvesshowtheperformancewithdifferentnumberofrelocationworkers.
Last but not least, profits are shown in Figure 4.2.2.4. Profits are in areverseordercomparedwithrevenues.Noproactiverelocationscenariogetsthehighestprofit.Themorerelocationworkersemployed,thelowerprofitsystemperforms.It’snotdifficulttofindoutthereason.Althoughproactiverelocationimprovesthesystemperformance,whichmeansmorerequestsaresatisfied thusbringsmorerevenue,bothrelocationworkercostandenergycostarenotevitableincreasingatthesametime.Profitsshouldbeinfluencednotonlybytherevenue,butalsobythecost.Inthiscase,relocationoperationcostsmorethantheextrarevenueitcanbringfor thewhole system.What’smore, extra costwithmore vehicles alsoexceedstheextrarevenuemorevehiclescanbring.Inconsequence,profitsshowadownwardtrendwiththenumberofvehiclesincreases.

CasestudyofTurin
38
Fig4.2.2.4:Profitsofnewproactiverelocationwithrespecttothenumberofvehicles.Curvesshowthe
performancewithdifferentnumberofrelocationworkers.
Inordertoshowtheaboveconclusionmoreclearly,IhavedrawnFigure4.2.2.5. Given two scenarios of no proactive relocation and proactiverelocationswiththreerelocationworkers.Icalculatedtheextrarevenuesrelocationoperationbringsandextracostitneeded.Wecanseethatextrarevenue is far less that extra cost that relocation operation. Improvingsystemperformancecomesatthecostofadditionaloverhead.

CasestudyofTurin
39
Fig4.2.2.5:CostGapandRevenueGapwithrespecttothenumberofvehicles.

40
Chapter 5
Conclusions and Future Work Themaincontentofthethesisisthatmodifyandrunthesimulationbasedonpreviouse3f2swork.Bothreactiveandproactiverelocationstrategieshave been implemented. The simulation model has a number of inputparametersthatallowfortheevaluationofnumerousscenarios.Byusingthe simulation in the case of Turin, I focus on plotting the results anddigging out the hidden reason under the system performance andeconomicperformanceby changing fleet size, thenumberof relocationworkers, the number of charging poles and varying different relocationstrategies.IntheresultofTurin,itwasfoundthatwhenconsideringpostchargerelocationstrategy,closest-freehastheoverallbestperformancewhereasclosest-queueingisworseconsideredwiththeothertwo.Whenit comes to proactive relocation, it improves the system performancehowever it leads to extra cost. With the more number of relocationoperations,themorerequestscanbesatisfied.Amongdifferentrelocationstrategies, delta performed best in proactive relocation scenario. Thebalance between more cost and more earnings should be consideredcarefully.Therearestillmanythingsthatcanbeconsideredbesidesthethesis:• Improveeconomicperformance inproactivestrategy, forexample,
addrelocationoperationsfrequency.• Implementotherkindsofreactiverelocationstrategy,forexample,
addrelocationscenariobesideschargingrelocation.• Implementotherkindsofproactiverelocationstrategy,forexample,
addrelocationoperationsstrategyusingmachinelearning.• Addmoremeaningfulmetricsforsystemandeconomicanalysis.• Expandthesimulationscenariosinothercitiesandmakecomparison
amongcities.• Improve the simulation with hybrid energy transportation. For
example, add scooter, oil cars in the simulation. Consider morecomplexscenarios.

41
Bibliography [1]. https://ourworldindata.org/co2-emissions[2]. https://www.statista.com/outlook/502/100/carsharing/worldwide#
market-onlineRevenueShare[3]. Sheheen,S.,Cohen,A.P.,2007.Growthinworldwidecarsharing,an
internationalcomparison.TransportationResearchRecord1992,81–89.
[4]. AlessandroCiociola,2019,Modelling,simulationanddesignofElectricCarSharingsystemswitheC2S
[5]. https://www.bbc.co.uk/bitesize/guides/zvxp34j/revision/3[6]. https://pypi.org/project/simpy/[7]. http://geopandas.org/.[8]. https://numpy.org/.[9]. https://www.tableau.com/.[10]. https://www.jetbrains.com/pycharm/[11]. https://jupyter.org/[12]. Laporte,G.,F.Meunier,R.W.Calvo.2015.Sharedmobilitysystems.[13]. Kek,A.G.H.,R.L.Cheu,Q.Meng,C.H.Fung.2009,Adecisionsupport
systemforvehiclerelocationoperationsincarsharingsystems.[14]. Jian,S.,D.Rey,V.Dixit.2016.Dynamicoptimalvehiclerelocationin
carsharesystems.[15]. Bruglieri,M.,A.Colorni,A.Luè.2014.Thevehiclerelocationproblem
fortheone-wayelectricvehiclesharing.[16]. de Almeida Correia, G. H., A. P. Antunes. 2012. Optimization
approachtodepotlocationandtripselection [17]. Pfrommer,J.,J.Warrington,G.Schildbach,M.Morari.2014.Dynamic
vehicleredistributionandonlinepriceincentivesinsharedmobilitysystems.
[18]. Raviv, T.,M. Tzur, I. A. Forma. 2013. Static repositioning in a bikesharingsystem:Modelsandsolutionapproaches.
[19]. Fricker,Christine,NicolasGast.2016.Incentivesandredistributioninhomogeneousbike-sharingsystemswithstationsoffinitecapacity.
[20]. Haider,Zulqarnain,AlexanderNikolaev,JeeEunKang,Changhyun

Bibliography
42
[21]. Kwon. 2018. Inventory rebalancing through pricing in public bikesharingsystems.
[22]. Weikl,S.,K.Bogenberger.2015.Apractice-ready relocationmodelfor free-floating carsharing systems with electric vehicles–mesoscopicapproachandfieldtrialresults.
[23]. Herrmann,S.,F.Schulte,S.Voß.2014.Increasingacceptanceoffree-floating car sharing systems using smart relocation strategies: Asurveybasedstudyofcar2gohamburg.
[24]. Caggiani, L., R. Camporeale, M. Ottomanelli. 2017. A dynamicclustering method for relocation process in free-floating vehiclesharingsystems.
[25]. He, L., Z. Hu, M. Zhang. 2019a. Robust repositioning for vehiclesharing.
[26]. AlessandroCiociolab,MicheleCoccab,OnScalabilityofElectricCarSharinginSmartCitiesMichelangeloBarullia
[27]. TalRavivandOferKolka.«Optimalinventorymanagementofabike-sharingstation».
[28]. https://scikit-learn.org/stable/modules/density.html#kernel-density-estimation.
[29]. https://en.wikipedia.org/wiki/Kernel_density_estimation/[30]. Leonardo Tolomei, Relocation strategies for e-scooter system
optimization


