University of Pennsylvania University of Pennsylvania
ScholarlyCommons ScholarlyCommons
Publicly Accessible Penn Dissertations
2021
Structural And Mechanical Responses To Intermittent Parathyroid Structural And Mechanical Responses To Intermittent Parathyroid
Hormone Treatment, Discontinuation And Cyclic Administration Hormone Treatment, Discontinuation And Cyclic Administration
Regimens Regimens
Wei-Ju Tseng University of Pennsylvania
Follow this and additional works at: https://repository.upenn.edu/edissertations
Part of the Biomechanics Commons
Recommended Citation Recommended Citation Tseng, Wei-Ju, "Structural And Mechanical Responses To Intermittent Parathyroid Hormone Treatment, Discontinuation And Cyclic Administration Regimens" (2021). Publicly Accessible Penn Dissertations. 4225. https://repository.upenn.edu/edissertations/4225
This paper is posted at ScholarlyCommons. https://repository.upenn.edu/edissertations/4225 For more information, please contact [email protected].
Structural And Mechanical Responses To Intermittent Parathyroid Hormone Structural And Mechanical Responses To Intermittent Parathyroid Hormone Treatment, Discontinuation And Cyclic Administration Regimens Treatment, Discontinuation And Cyclic Administration Regimens
Abstract Abstract Bone mineral density rapidly decreases upon withdrawal from intermittent parathyroid hormone (PTH) treatment despite its potent effect of promoting bone formation. To better understand this adverse phenomenon, this study first aimed to investigate the phenotype of PTH withdrawal in both intact and estrogen-deficient rat model by using a well-designed experiment combined with innovative longitudinal imaging techniques and localized cellular activities. Due to observing a continuous anabolic window upon early discontinuation of PTH treatment in estrogen-deficient animals, we propose a potential effective treatment strategy, the short cycles of PTH and antiresorptive treatment regimen, which could extend the anabolic windows by increasing the number of newly activated modeling-based bone formation (MBF) sites. Lastly, to understand the structure-function relationships of bone tissue formed through MBF compared to the remodeling-based bone formation (RBF), we developed an innovative imaging platform with a mechanical testing platform to determine the mechanical properties of MBF and RBF and their long-term contributions in intact animals.
Degree Type Degree Type Dissertation
Degree Name Degree Name Doctor of Philosophy (PhD)
Graduate Group Graduate Group Mechanical Engineering & Applied Mechanics
First Advisor First Advisor X. Sherry Liu
Keywords Keywords anabolic windows, discontinuation of PTH treatment, intermittent parathyroid hormone (PTH), modeling-based bone formation (MBF), remodeling-based bone formation (RBF), the short cycles of PTH and antiresorptive treatment regimen
Subject Categories Subject Categories Biomechanics
This dissertation is available at ScholarlyCommons: https://repository.upenn.edu/edissertations/4225
STRUCTURAL AND MECHANICAL RESPONSES TO INTERMITTENT
PARATHYROID HORMONE TREATMENT, DISCONTINUATION AND
CYCLIC ADMINISTRATION REGIMENS
Wei-Ju Tseng
A DISSERTATION
in
Mechanical Engineering and Applied Mechanics
Presented to the Faculties of the University of Pennsylvania
in
Partial Fulfillment of the Requirements for the
Degree of Doctor of Philosophy
2021
Supervisor of Dissertation
__________________
X. Sherry Liu, Ph.D. Associate Professor of Orthopaedic Surgery, University of Pennsylvania
Graduate Group Chairperson
__________________
Jennifer R. Lukes, Ph.D. Professor of Mechanical Engineering and Applied Mechanics, University of Pennsylvania
Dissertation Committee
Kevin Turner, Ph.D. (Committee Chair) Professor of Mechanical Engineering and Applied Mechanics, University of Pennsylvania
Ling Qin, Ph.D. Associate Professor of Orthopaedic Surgery, University of Pennsylvania
Joel D. Boerckel, Ph.D. Assistant Professor of Orthopaedic Surgery, University of Pennsylvania
Liyun Wang, Ph.D. Professor of Mechanical Engineering, University of Delaware

ii
ACKNOWLEDGMENT
Many people have advised, supported, helped, and assisted me throughout my
time at the University of Pennsylvania, and without them, this work would not have been
possible to complete. I would first like to thank my advisor, Dr. X. Sherry Liu, for
guiding me and providing me the invaluable training. Additionally, I greatly appreciate
her giving me the freedom to explore the unknowns and supporting me throughout my
time working in her laboratory. I also would like to thank my committee members, Dr.
Liyun Wang, Dr. Ling Qin, Dr. Kevin Turner, and Dr. Joel Boerckel, for their guidance
and research advice; with an additional thank you to Dr. Wang for leading me into the
Orthopaedic research field when I was in her lab ten years ago.
I greatly appreciate the efforts of everyone who contributed directly to this
project. Dr. Allison Altman-Singles provided her essential knowledge in setting up the
initial study frameworks. Dr. Chantal de Bakker, Yihan Li, Dr. Wonsae Lee, Dr. Hongbo
Zhao, and Dr. Wenzheng Wang each provided numerous contributions to this project. It
was a pleasure working with and spending time with each of them, both inside and
outside the lab. I appreciate their scientific input, unwillingness to help, friendship, and,
especially, their support over the past several years. I also thank the past and present lab
members of the Liu lab, including Dr. Yang Liu, Laurel Leavitt, Mengting Huang, Tien-
Jung Lee, and Carlos Ozuna, for their contributions to this thesis. I very much am grateful
to members of the Qin lab: Dr. Abhishek Chandra, Dr. Tiao Lin, Dr. Wei Tong, Dr.
Haoruo Jia, Dr. Xiaoyuan Ma, and Dr. Luqiang Wang for their advice on the biological
assays and surgical techniques used in this thesis. I also appreciate the assistance of Dr.
Do-Gyoon Kim, Dr. Yonghoon Jeong, and Dr. Jie Liu from the Ohio State University

iii
with the nanoindentation portion of this study; with an additional thank to Dr. Yonghoon
Jeong for teaching me the details on the preparation of specimens and how to perform
nanoindentation. I very much thank Dr. Nathaniel Dyment and Dr. Xi Jiang for their
advice and assistance on the cryosectioning technique and the fluorescence imaging on
the thick sections. I very much appreciate the advice and the assistance of lab members of
the Turner’s lab: Dr. Yijie Jiang, Dr. Alexander Bennett, and Dr. Lisa Lallo for refining
the protocols in the nanoindentation portion of this thesis. I very much am grateful to Dr.
Lin Han, Dr. Prashant Chandrasekaran, and Dr. Qing Li from Drexel University for their
assistance on the nanoindentation portion and SEM portion of this study as well as Dr.
Edward Basgall for the assistance of ESEM from the Materials Characterization Core. I
very much appreciate the assistance of Dr. Andrea Strout from the Cell and
Developmental Biology (CDB) Microscopy Core and Dr. Gordon Ruthel from the Penn
Vet Imaging Core with the SHG portion of this study. I have special thanks to Carrie
Barnum of the Soslowsky lab and the Mckay Graduate Student Seminar. Carrie
introduced the SHG imaging to me after I presented my research and questions in the
Mckay Graduate Student Seminar. Without her kindness and advice, I will not be able to
develop the novel imaging platform in this thesis. I further would like to thank all the
members of the McKay labs and the members of the PCMD MicroCT Imaging Core that
provided me an excellent opportunity to learn and discuss ideas outside of my area of
expertise.
Finally, I would thank my family and friends for all of your endless support
throughout the ups and downs over the past few years, especially my lovely wife,
Wenmei, and my parents. Their kindness, generosity, and encouragement have helped me

iv
get through many challenges and played a huge role in achieving my goals. Again, this
work would not have been possible without all your support.
Wei-Ju
v
ABSTRACT
STRUCTURAL AND MECHANICAL RESPONSES TO INTERMITTENT
PARATHYROID HORMONE, DISCONTINUATION AND CYCLIC
ADMINISTRATION REGIMENS
Wei-Ju Tseng
Dr. X. Sherry Liu
Bone mineral density rapidly decreases upon withdrawal from intermittent
parathyroid hormone (PTH) treatment despite its potent effect of promoting bone
formation. To better understand this adverse phenomenon, this study first aimed to
investigate the phenotype of PTH withdrawal in both intact and estrogen-deficient rat
model by using a well-designed experiment combined with innovative longitudinal
imaging techniques and localized cellular activities. Due to observing a continuous
anabolic window upon early discontinuation of PTH treatment in estrogen-deficient
animals, we propose a potential effective treatment strategy, the short cycles of PTH and
antiresorptive treatment regimen, which could extend the anabolic windows by increasing
the number of newly activated modeling-based bone formation (MBF) sites. Lastly, to
understand the structure-function relationships of bone tissue formed through MBF
compared to the remodeling-based bone formation (RBF), we developed an innovative
imaging platform with a mechanical testing platform to determine the mechanical
properties of MBF and RBF and their long-term contributions in intact animals.
vi
TABLE OF CONTENTS
ACKNOWLEDGMENT..................................................................................................... ii
ABSTRACT .........................................................................................................................v
LIST OF ILLUSTRATIONS ............................................................................................. ix
CHAPTER 1 ........................................................................................................................1
1.1 Introduction ............................................................................................................... 1
1.2 Background ............................................................................................................... 3
1.2.1 Bone structure, composition and mechanical properties ................................... 3
1.2.2 Bone cells: Osteoblasts, osteoclasts, and osteocytes .......................................... 6
1.2.3 Bone modeling and bone remodeling ................................................................. 7
1.2.4 Osteoporosis ....................................................................................................... 8
1.2.5 Osteoporosis Treatment ...................................................................................... 9
1.3 Significance of Studies ............................................................................................ 11
1.4 Specific Aims .......................................................................................................... 13
1.5 Study Design ........................................................................................................... 14
1.6 Chapter Overview ................................................................................................... 16
1.7 Figures ..................................................................................................................... 17
CHAPTER 2 ......................................................................................................................23
2.1 Introduction ............................................................................................................. 23
2.2. Materials and Methods ........................................................................................... 25
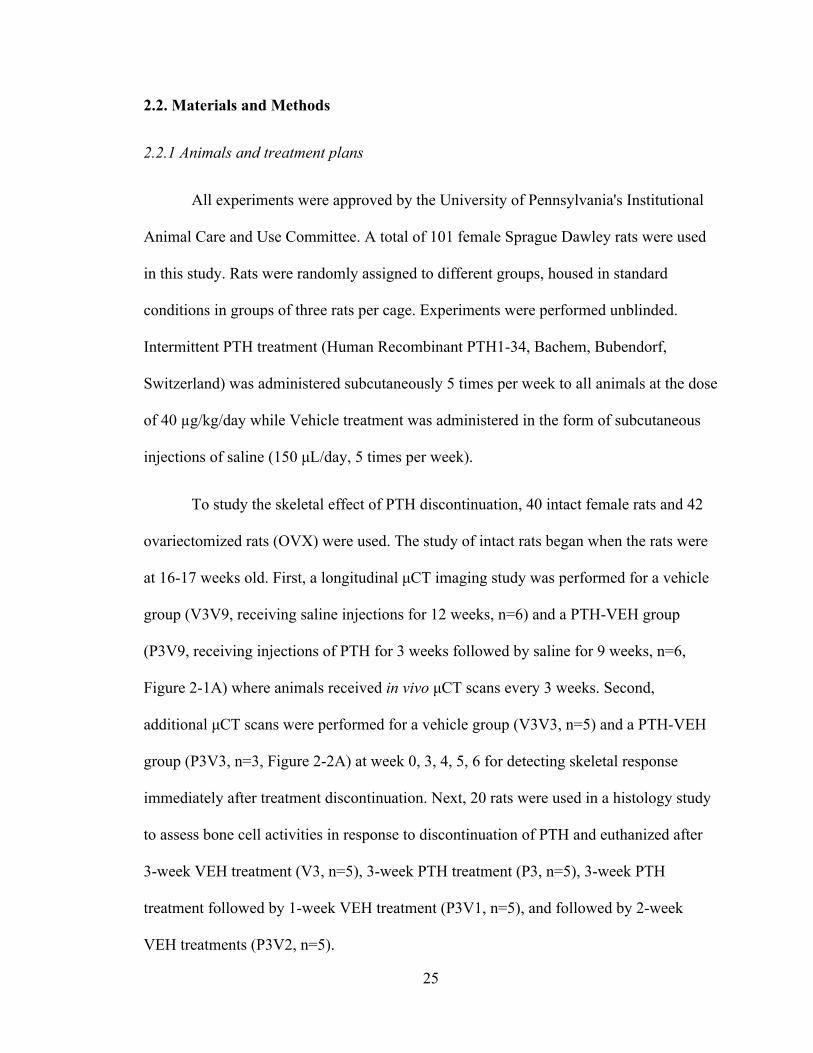
2.2.1 Animals and treatment plans ............................................................................ 25
2.2.2 In vivo µCT scans and analysis ........................................................................ 26
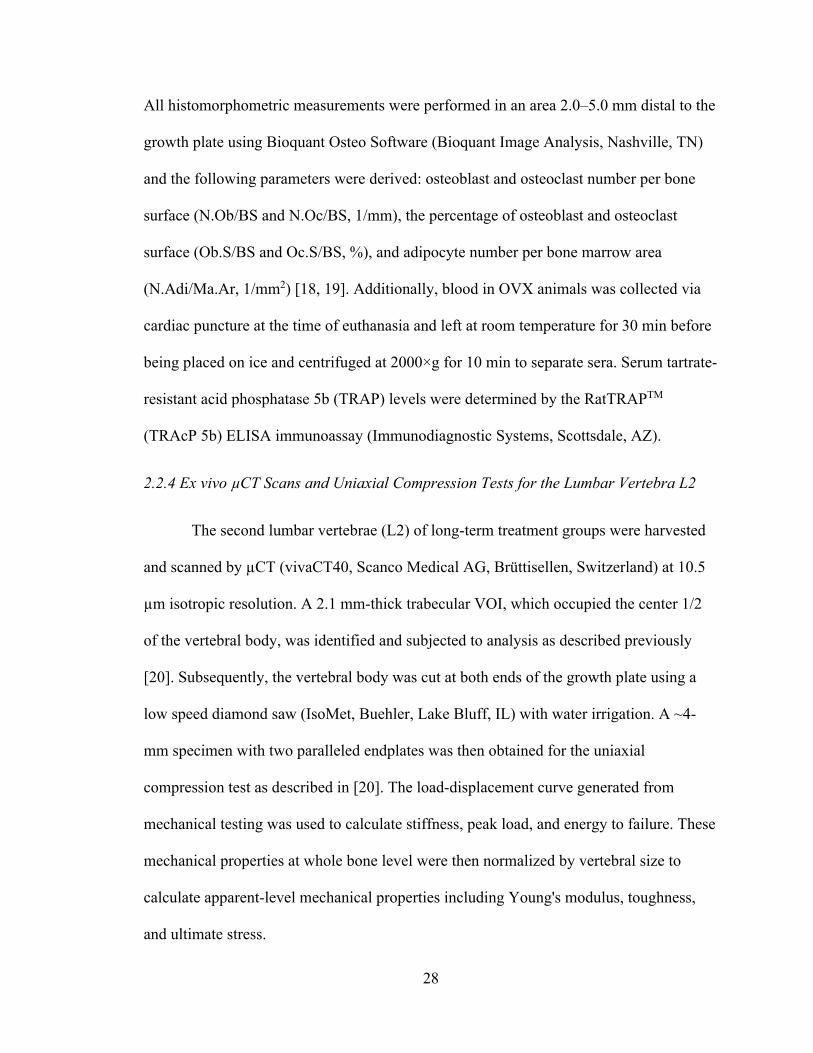
2.2.3 Bone histomorphometry and serum biochemistry analysis .............................. 27
2.2.4 Ex vivo µCT Scans and Uniaxial Compression Tests for the Lumbar Vertebra L2 ............................................................................................................................... 28
2.2.5 Cortical bone analysis and 4-point bending test of femoral shaft .................... 29
2.2.6 Statistical Analysis ............................................................................................ 29
2.3 Results ..................................................................................................................... 30
2.3.1 3-week PTH treatment benefits were maintained in intact rats upon 9-week discontinuation .......................................................................................................... 30
2.3.2 Early withdrawal from PTH is associated with a continuous anabolic window in OVX rats, but not in intact rats ............................................................................. 30
vii
2.3.3 3-week PTH treatment benefits diminished in OVX rats upon 9-week discontinuation .......................................................................................................... 31
2.3.4 Number of osteoblasts significantly reduced while number of osteoclasts and adipocytes increased upon withdrawal from PTH in OVX rats ................................ 32
2.3.5 Cyclic treatment regimen rescues PTH discontinuation-induced bone loss and extended treatment duration ...................................................................................... 33
2.4 Discussion ............................................................................................................... 34
2.5 Figures ..................................................................................................................... 40
CHAPTER 3 ......................................................................................................................52
3.1 Introduction ............................................................................................................. 52
3.2 Materials and Methods ............................................................................................ 55
3.2.1 Animals and treatment plans: skeletal effects by cyclic treatment regimens in estrogen-deficient rats ............................................................................................... 55
3.2.2 In vivo µCT scans and analysis ........................................................................ 56
3.2.3 Ex vivo µCT Scans and Uniaxial Compression Tests for the Lumbar Vertebra L2 ............................................................................................................................... 57
3.2.4 Cortical bone analysis and 4-point bending test of femoral shaft .................... 57
3.2.5 Nanoindentation tests for lumbar vertebra L1 ................................................. 58
3.2.6 Statistical Analysis ............................................................................................ 59
3.3 Results ..................................................................................................................... 59
3.3.1 Rescue bone deterioration in trabecular microarchitecture in the Cyclic Treatment Regimen .................................................................................................... 59
3.3.2 Improvements in the bone microarchitecture and mechanical competence in lumbar vertebrae L2 in Cyclic and alternating PTH and ALN groups ..................... 61
3.3.3 Alterations in whole-bone femoral mechanical properties, but minimal effects on cortical microarchitecture at the femur midshaft and on tissue elastic modulus (E) and hardness of the Lumbar Vertebra L1 after the cyclic and alternating treatment regimens..................................................................................................................... 62
3.4 Discussion ............................................................................................................... 63
3.5 Figures ..................................................................................................................... 68
CHAPTER 4 ......................................................................................................................76
4.1 Introduction ............................................................................................................. 76
4.2 Materials and Methods ............................................................................................ 78
4.2.1 Animals and Treatment Plans........................................................................... 78
4.2.2 Bone Histomorphometry of MBF and RBF for Thin Sections .......................... 79
viii
4.2.3 Sample Preparation for Thick Sections ............................................................ 80
4.2.4 Fluorescence, Second Harmonic Generation, and Brightfield Microscopic Imaging for Thick Sections ........................................................................................ 80
4.2.5 Nanoindentation ............................................................................................... 81
4.2.6 Bone Mineralization Density Distribution Analysis ......................................... 82
4.2.7 Statistical Analysis ............................................................................................ 83
4.3 Results ..................................................................................................................... 83
4.3.1 Bone Histomorphometry ................................................................................... 83
4.3.2 Bone Tissue Mechanical Properties and Tissue Heterogeneity ....................... 83
4.3.3 Bone Mineralization Density Distribution ....................................................... 84
4.4 Discussion ............................................................................................................... 84
4.5 Figures ..................................................................................................................... 90
CHAPTER 5 .................................................................................................................. 99
5.1 Summary ................................................................................................................. 99
5.1.1 Chapter Two Summary ..................................................................................... 99
5.1.2 Chapter Three Summary ................................................................................. 101
5.1.3 Chapter Four Summary .................................................................................. 102
5.2 Future Directions ................................................................................................... 103
5.2.1 Investigation of adverse effects and mechanisms including structural changes and biological changes on approved anabolic agents, e.g., Abaloparatide (PTHrP) and Romosozumab (Scl-Ab)..................................................................................... 103
5.2.2 Determination of the structure-function relationship of bone tissue formed through MBF and RBF ............................................................................................ 104
5.2.3 Elucidation of the cellular mechanisms behind the dynamic responses of MBF and RBF in short cycles of anabolic agents and anti-resorptive agents ................. 106
5.3 Final Conclusions .................................................................................................. 106

ix
LIST OF ILLUSTRATIONS
CHAPTER 1
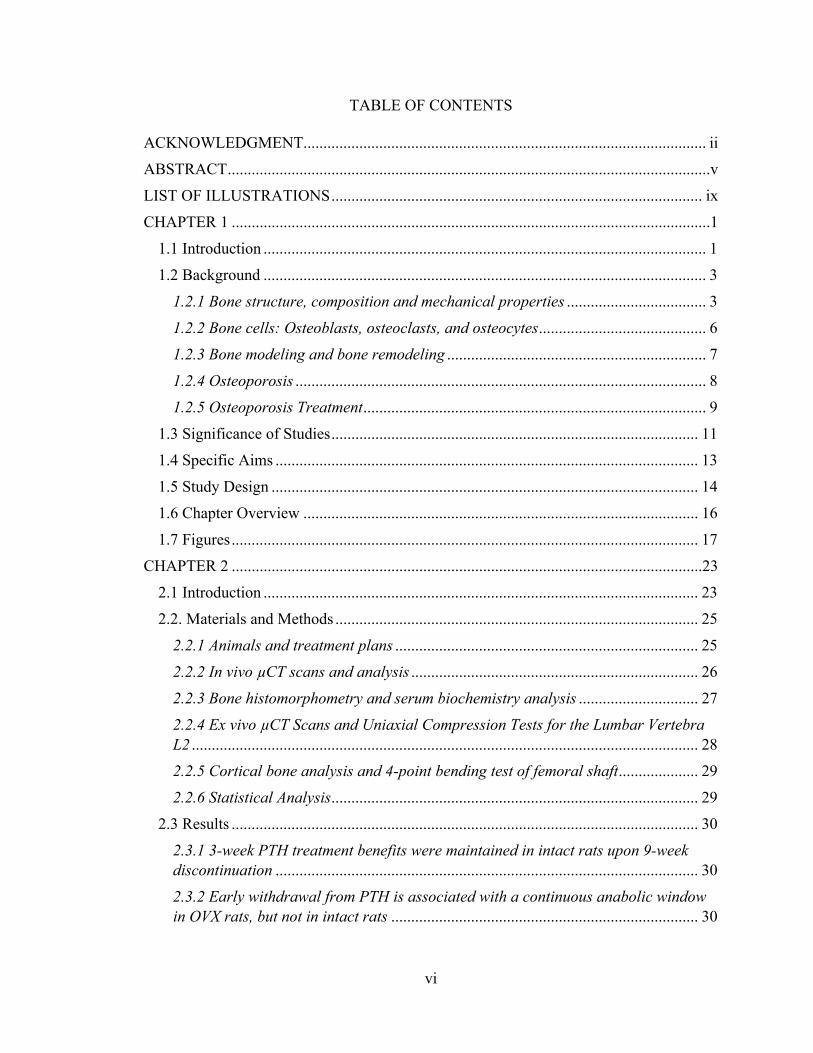
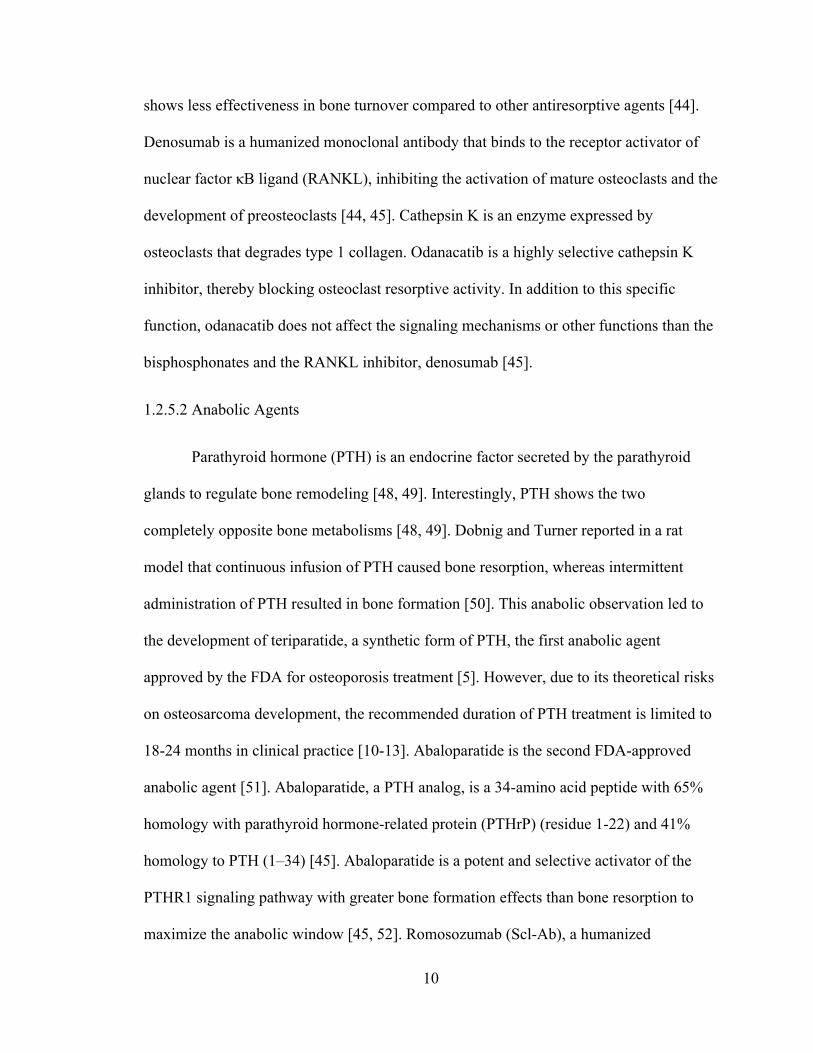
Figure 1-1. Hierarchical structural organization of bone .................................................. 17
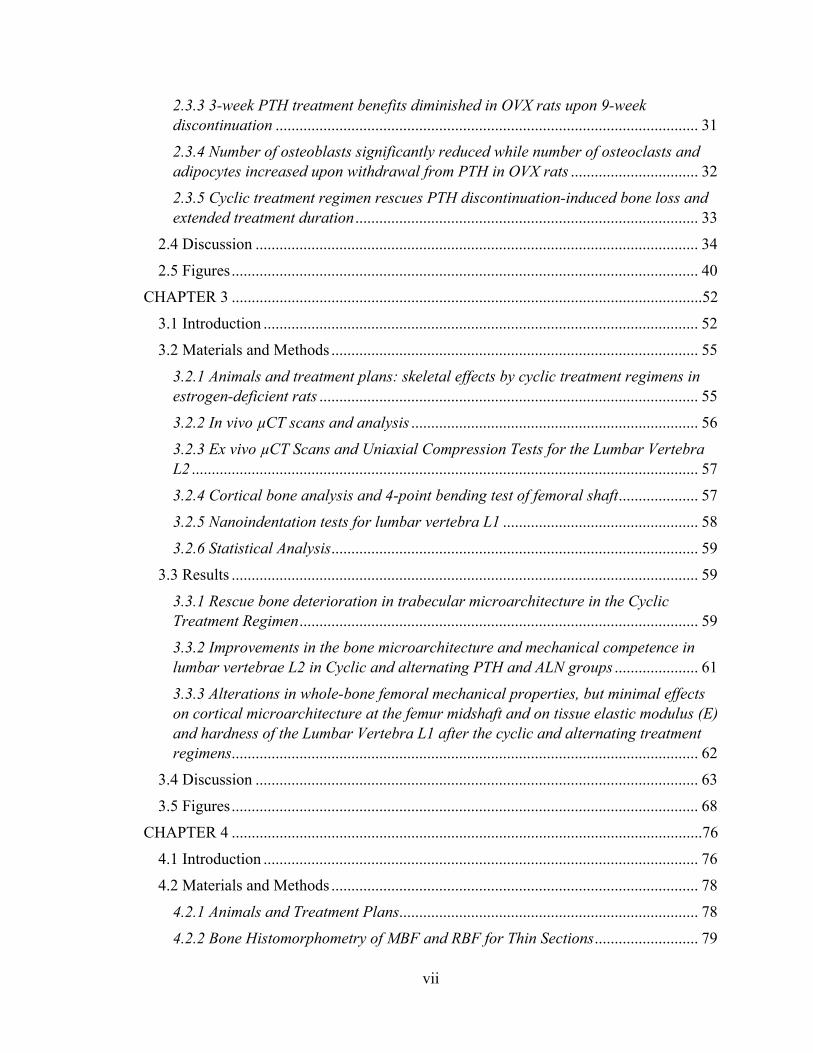
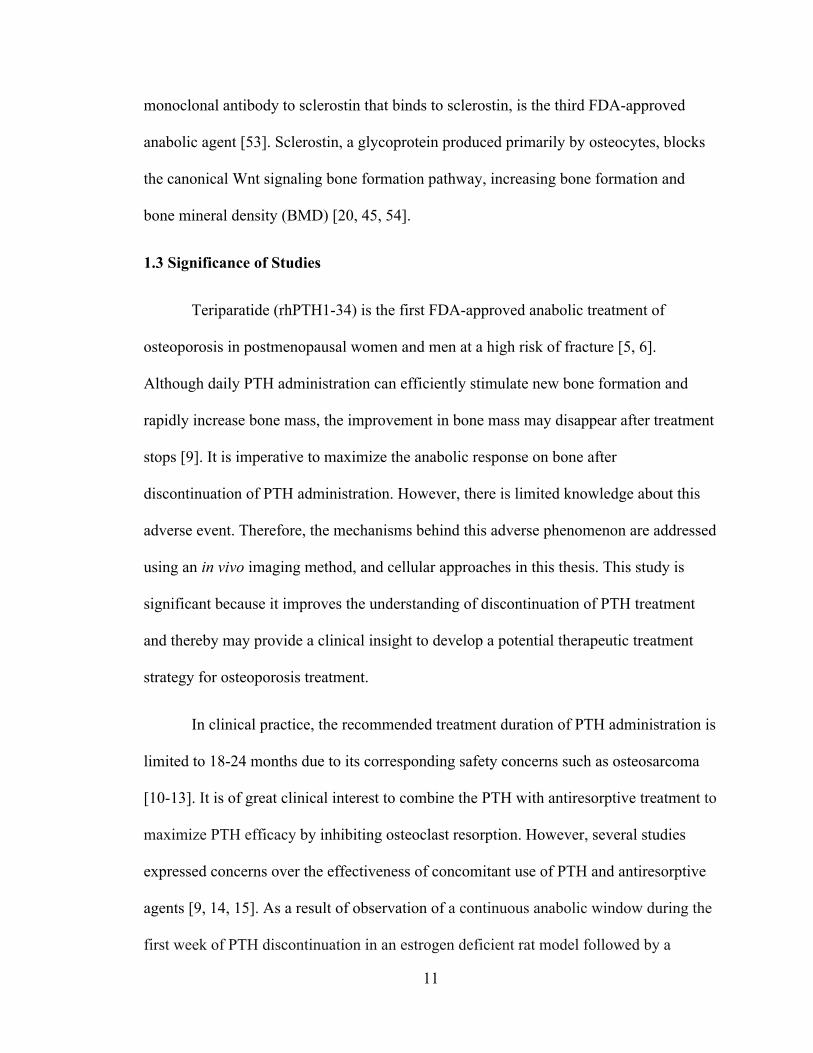
Figure 1-2. Idealized nanoindentation curve .................................................................... 18
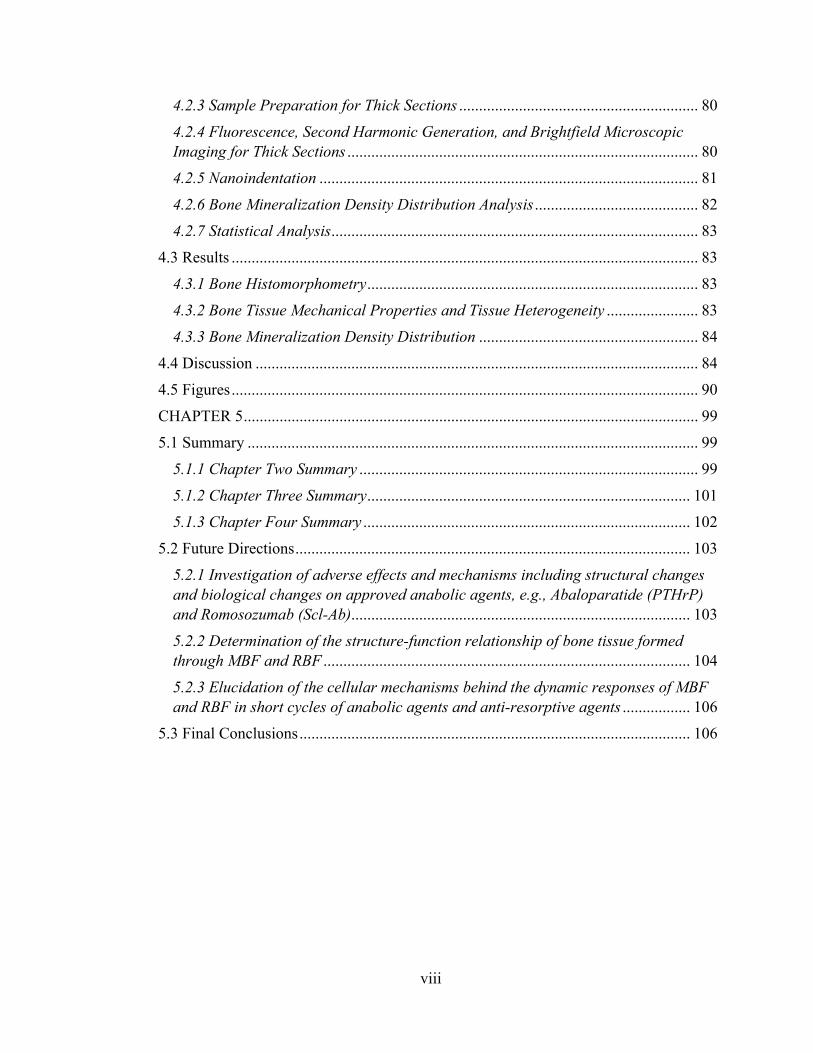
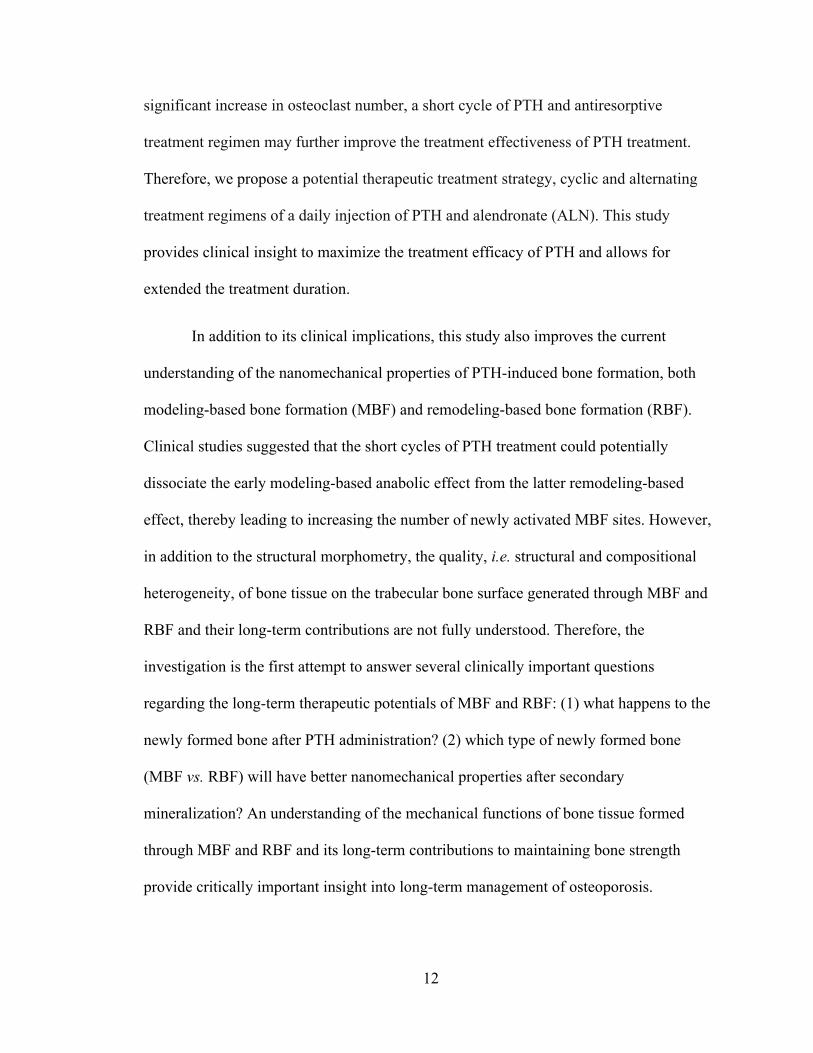
Figure 1-3. Schematic of modeling- and remodeling- based bone formation .................. 19
CHAPTER 2
Figure 2-1. Changes in tibial trabecular bone microarchitectures in intact female animals (3 weeks of PTH and 9 weeks of VEH) ............................................................................ 40
Figure 2-2. Changes in tibial trabecular bone microarchitectures in intact female animals (3 weeks of PTH and 3 weeks of VEH) ............................................................................ 41
Figure 2-3. Changes in tibial trabecular bone microarchitectures in estrogen-deficient animals (3 weeks of PTH and 9 weeks of VEH) .............................................................. 42
Figure 2-4. Cellular activities in estrogen-deficient animals ............................................ 44
Figure 2-5. Cellular activities in intact female animals .................................................... 45
Figure 2-6. Changes in tibial trabecular bone microarchitectures in estrogen-deficient animals in cyclic treatment regimens (3 cycles of PTH and VEH) .................................. 47
Figure 2-7. Mechanics of the lumbar vertebra after the cyclic treatment regimens ......... 48
Figure 2-8. Mechanics of the femur midshaft after the cyclic treatment regimens .......... 49
CHAPTER 3
Figure 3-1. Changes in tibial trabecular bone microarchitectures and cellular activities in estrogen-deficient animals ................................................................................................ 68
Figure 3-2. Changes in tibial trabecular bone microarchitectures in estrogen-deficient animals (3 cycles of PTH and ALN). ................................................................................ 70
Figure 3-3. Mechanics of the lumbar vertebra after the cyclic treatment regimens ......... 71
Figure 3-4. Mechanics of the femur midshaft after the cyclic treatment regimens .......... 72
Figure 3-5. Nanomechanical properties of lumbar vertebra after the cyclic treatment regimens ............................................................................................................................ 73
CHAPTER 4
Figure 4-1. Drug treatment and multiple fluorochrome injection plans to identify MBF and RBF in a thin section .................................................................................................. 90
Figure 4-2. Drug treatment and multiple fluorochrome injection plans and a guidance map for identification of MBF and RBF and for the subsequent nanoindentation test and quantitative backscattered electron imaging (qBEI) ......................................................... 91
Figure 4-3. Comparisons between MBF, RBF, and pre-existing bone tissue................... 92

x
Figure 4-4. Degree of bone tissue mineralization ............................................................. 93
Figure 4-5. Schematics of MBF, RBF, and overflow MBF (oMBF). .............................. 94
Figure 4-6. Confirmation of a MBF site on a 3D stack of images.................................... 95
1
CHAPTER 1
Introduction
1.1 Introduction
Osteoporosis is a disease characterized by significant reductions in overall bone
density and structural integrity, causing skeletal fragility and an increased risk of bone
fractures [1]. Millions of people suffer from osteoporosis and related symptoms in the
United States. According to the data from the National Health and Nutrition Examination
Survey, 2005 to 2010, 10.3% or 10.2 million adults over 50 years old in the United States
had osteoporosis at the femoral neck or lumbar spine [2]. Current osteoporosis treatments
focus on either inhibiting bone resorption using antiresorptive agents or promoting bone
formation using anabolic treatments [3]. However, due to bone formation-resorption
coupling mechanisms, drugs inhibiting bone resorption often indirectly reduce formation,
and those increasing formation also induce resorption, thereby limiting their potential
benefits [3]. Therefore, it is of great interest to understand the mechanisms behind
existing treatment options to better develop effective clinical treatment strategies [4].
Recombinant human parathyroid hormone (rhPTH) 1-34 is the first FDA-
approved anabolic treatment for postmenopausal women and men who are at a high risk
for fracture [5, 6]. Daily PTH administration can rapidly increase bone mass and restore
bone microarchitecture of trabecular bone [7, 8]. However, despite the potent effects of
PTH, clinical studies showed a rapid decline in bone mineral density (BMD) and bone
formation markers upon withdrawal of PTH treatment [9]. In addition to BMD and serum
markers, there is limited information on bone microarchitecture and cellular activities

2
after discontinuation of PTH treatment. Therefore, this thesis first aimed to uncover the
structural and biological changes behind this adverse phenomenon by using a well-
designed experiment combined with innovative longitudinal imaging techniques and
localized cellular responses.
In clinical practice, the recommended treatment duration of PTH administration is
limited to 18-24 months due to its corresponding safety concerns such as osteosarcoma
[10-13]. Thus, it is of great clinical interest to combine the PTH with antiresorptive
treatment to maximize PTH efficacy by inhibiting osteoclast resorption. However, several
studies expressed concerns over the effectiveness of concomitant use of PTH and
antiresorptive agents [9, 14, 15]. We found a continuous anabolic window during the first
week of PTH discontinuation in an ovariectomized (OVX) rat model followed by a
significant increase in osteoclast number in the first study. This result led to the
hypothesis that the short cycles of PTH treatment may extend the treatment duration and
incorporation with an antiresorptive treatment during the off-PTH period of cyclic
treatment regimen may further improve the treatment effectiveness of PTH. Therefore,
we propose a potential therapeutic treatment strategy, cyclic and alternating treatment
regimens of daily injection of PTH and alendronate (ALN). Indeed, clinical studies have
tested on this strategy and suggested that short PTH cycles could potentially dissociate
the early PTH-induced anabolic effects on modeling-based bone formation from the latter
effects on remodeling-based bone formation.
Recent studies identified the activation of modeling-based bone formation (MBF)
as a vital mechanism as a result of rapidly increasing new bone formation by anabolic
agents for osteoporosis [16], such as PTH [17-19] and sclerostin-neutralizing antibody
3
(Scl-Ab) [20]. In addition to treatment with an anabolic agent alone, studies have also
shown that MBF can be elicited on the trabecular bone surface by PTH with co-treatment
of an anti-resorptive drug [19, 21-27]. However, the quality, i.e., structural and
compositional heterogeneity, of bone tissue on the trabecular bone surface generated
through MBF is not fully understood, partially due to the difficulty in distinguishing these
types of formation on thick bone sections. The only difference that the literature reported
between MBF and remodeling-based bone formation (RBF) is structural morphometry on
thin sections [28]. Thus, in this thesis, we developed an imaging method that can be
coupled with a mechanical testing platform for reliable identification and examination of
mechanical properties of MBF and RBF on thick bone sections.
1.2 Background
1.2.1 Bone structure, composition and mechanical properties
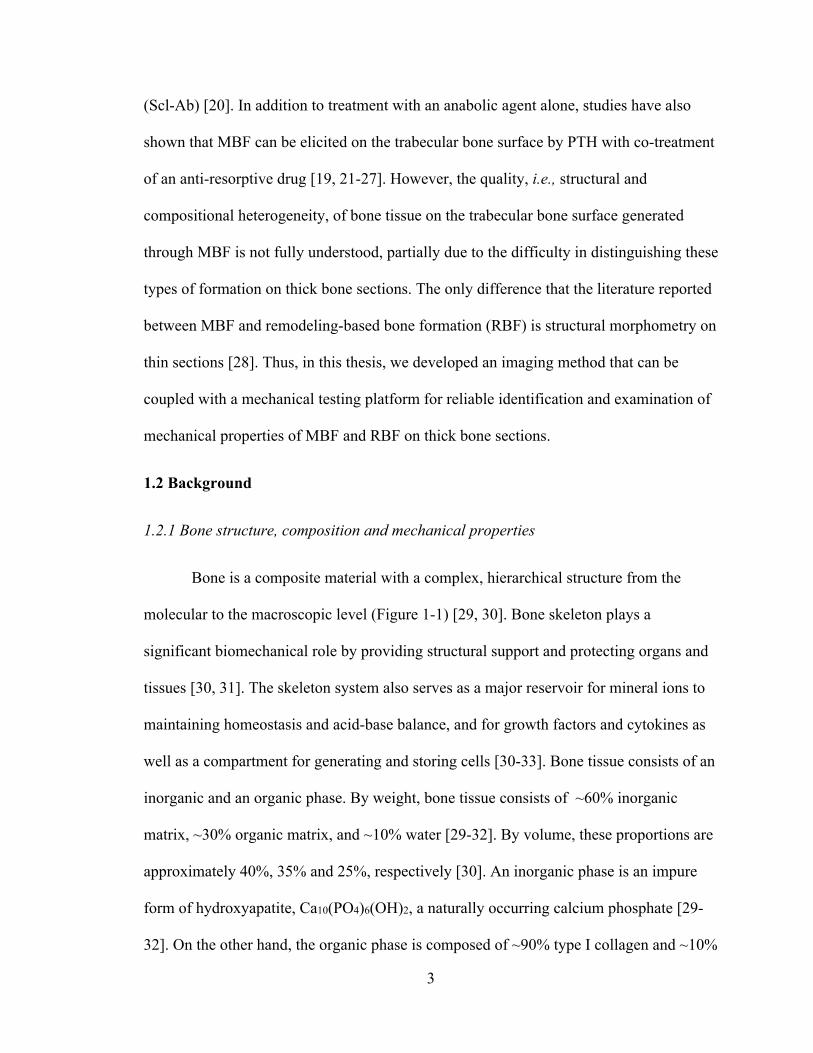
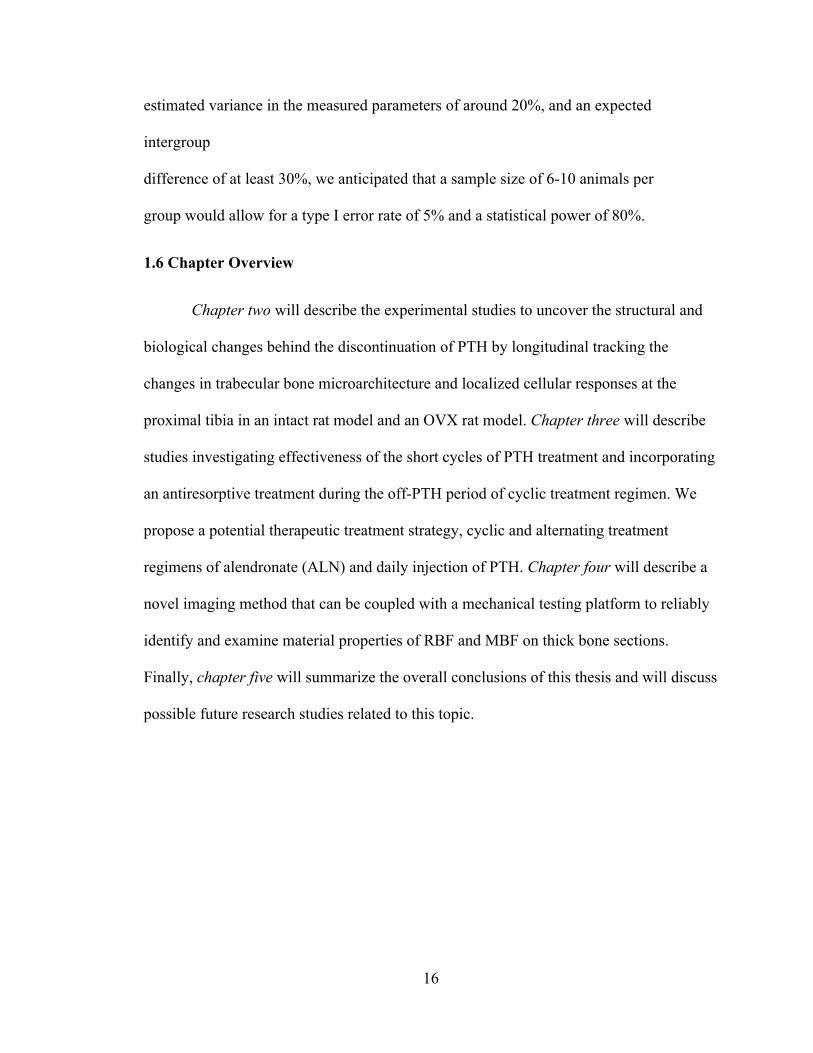
Bone is a composite material with a complex, hierarchical structure from the
molecular to the macroscopic level (Figure 1-1) [29, 30]. Bone skeleton plays a
significant biomechanical role by providing structural support and protecting organs and
tissues [30, 31]. The skeleton system also serves as a major reservoir for mineral ions to
maintaining homeostasis and acid-base balance, and for growth factors and cytokines as
well as a compartment for generating and storing cells [30-33]. Bone tissue consists of an
inorganic and an organic phase. By weight, bone tissue consists of ~60% inorganic
matrix, ~30% organic matrix, and ~10% water [29-32]. By volume, these proportions are
approximately 40%, 35% and 25%, respectively [30]. An inorganic phase is an impure
form of hydroxyapatite, Ca10(PO4)6(OH)2, a naturally occurring calcium phosphate [29-
32]. On the other hand, the organic phase is composed of ~90% type I collagen and ~10%
4
noncollagenous proteins, such as proteoglycans and glycoproteins [29-32]. These
molecular constituent elements at the sub-nanostructure level (below a few hundred
nanometers scale) are assembled to comprise the mineralized collagen fibrils. These
fibrils are laid down in lamellar pattern in alternating orientation, which are further
assembled into two distinct bone structures: (1) compact (cortical) bone assembled from
haversian systems (3-7 µm scale) and osteons (10-500 µm scale), and (2) cancellous
(trabecular) bone assembled from hemiosteons (or called packets) (3-7 µm scale) and
single trabeculae (10-500 µm scale) [29-32]. In the adult skeleton, the compact bone and
the cancellous bone are approximately 80% and 20%, respectively [29-33]. The compact
bone has a porosity of about 10% with 12-18GPa elastic moduli, while the cancellous
bone is a highly porous structure with 50-95% porosity with lower mechanical properties
ranging from 100 to 500MPa [29, 30].
1.2.1.1 Tissue-level Mechanical Properties
Tissue-level mechanical properties include the tissue-level elastic modulus,
toughness, and hardness that can be measured in microstructure, sub-microstructure and
nanostructure levels. Indentation is a mechanical testing technique that can evaluate such
properties, i.e., using a tip with known geometry and properties to press into a flat,
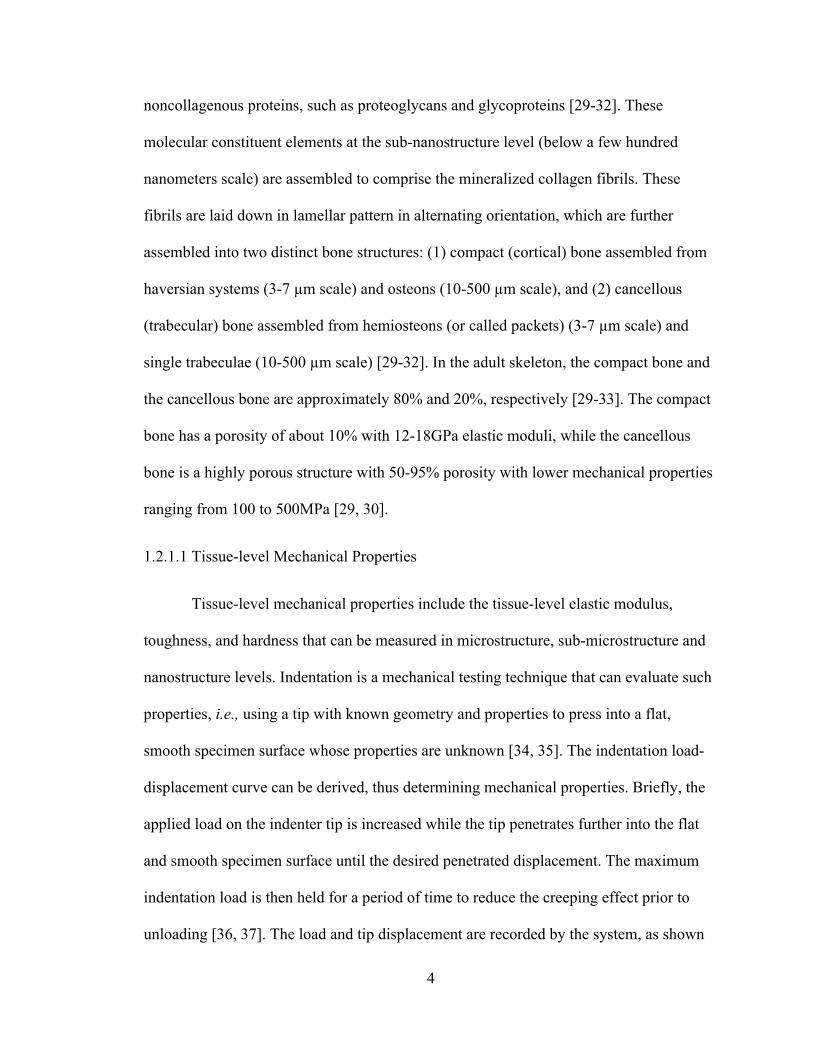
smooth specimen surface whose properties are unknown [34, 35]. The indentation load-
displacement curve can be derived, thus determining mechanical properties. Briefly, the
applied load on the indenter tip is increased while the tip penetrates further into the flat
and smooth specimen surface until the desired penetrated displacement. The maximum
indentation load is then held for a period of time to reduce the creeping effect prior to
unloading [36, 37]. The load and tip displacement are recorded by the system, as shown

5
in Figure 1-2. Therefore, hardness and elastic modulus of the specimens can be calculated
using the Oliver and Pharr method based on the initial unloading portion of the load-
displacement curve [34, 35]. Hardness can be measured using the equation [34, 35].
𝐻𝑃𝐴
where H is the contact hardness (GPa), Pmax is the peak indenting load (µN), and A is the
projected contact area (mm2) [34, 35]. The elastic modulus of the test specimen, Es, is
determined from the reduced modulus, Er, given by
𝐸√𝜋 ∙ 𝑆
2𝛽√𝐴
where β is a constant that depends only on the geometry of the indenter. β for the
Berkovich indenter is 1.034. S is the experimentally measured contact stiffness or the
slope of the initial portion of the unloading curve, as shown in Figure 1-2,
𝑆𝑑𝑃𝑑ℎ
The elastic modulus of the test specimen (Es) is calculated using the expression
1𝐸
1 𝑣𝐸
1 𝑣𝐸
where reduced modulus (Er) is measured by calculating the unloading slope from
the displacement-force curve. The indices s and i refer to the specimen and the indenter
material, respectively, and vs is Poisson’s ratio of the test specimen. Since the indenter tip
is made of diamond, the typical modulus Ei and the poison ratio value vi of diamond are

6
1141 GPa and 0.07, respectively. Poisson’s ratio of bone is assumed to be 0.3 based on
previous studies [38].
1.2.1.2 Whole Bone Mechanical Properties
Whole-bone mechanical properties include peak load, displacement, energy to
failure, and stiffness that can be directly measured by 3- or 4-point bending and
compression testing through evaluation of the force-displacement curve [39, 40]. The
apparent-level stress, strain, modulus, toughness, and ultimate stress can be derived based
on the dimensions of tested bone specimens. In addition, shear properties can be
evaluated by the torsional testing, and the fatigue life and microdamage can be
determined by the fatigue testing.
1.2.2 Bone cells: Osteoblasts, osteoclasts, and osteocytes
Three major cell types involved in formation and resorption are osteoblasts,
osteoclasts, and osteocytes. Osteoblasts are mononuclear cells derived from
mesenchymal cells and resided on the bone surfaces to form new bone tissue [30, 31].
Osteoblasts are generally cuboidal cells with 20-30 μm width and 10 μm tall [30, 31] but
they may also form other shapes, including a rounded shape, an oval shape or a
polyhedral shape. Osteoblasts synthesize and secrete mostly type I collagen and proteins,
including osteopontin, osteocalcin, cytokines, and growth factors as well as producing
and regulating calcium phosphate minerals [31, 33]. The adult osteoblasts transform into
osteocytes or undergo apoptosis [31]. Osteoclasts are highly specialized multinucleated
cells derived from the hematopoietic cell precursors in the bone marrow and peripheral
blood [30, 31]. Osteoclasts are large multinucleated cells with 1 to 50 nuclei with a
7
diameter of 20-100 μm [30, 31]. Osteoclasts reside on the bone surfaces to break down
both inorganic and organic bone matrix by acidification and enzymatically degrade
demineralized bone [31, 33]. Osteocytes are mature cells of osteoblasts embedded in the
mineralized matrix, which are more than 90% of bone cells in adult bone [41]. A single
osteocyte resides in lacunae that connect and communicate with neighboring cells
through canaliculi [30, 31, 41]. In the lacunae and canaliculi system, osteocytes sense and
respond to fluid flow shear stress or mechanical stimuli producing signaling molecules to
regulate osteoblasts and osteoclasts and to adjust bone formation and resorption [30-32,
41].
1.2.3 Bone modeling and bone remodeling
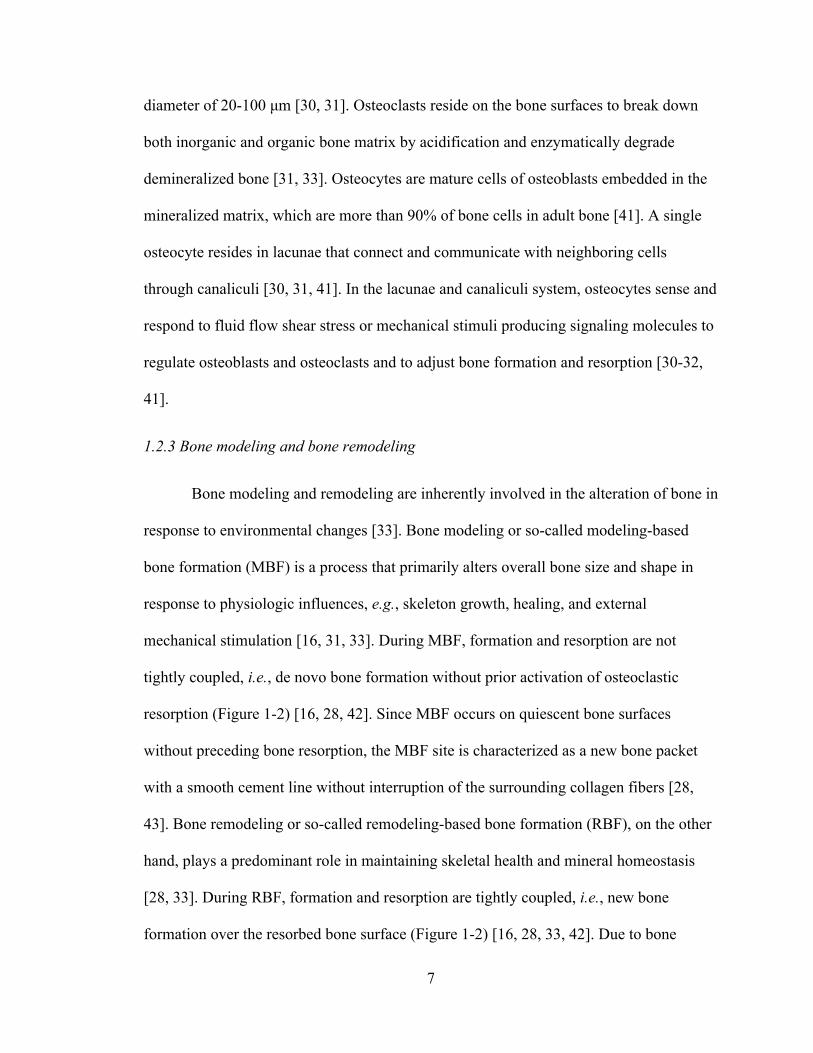
Bone modeling and remodeling are inherently involved in the alteration of bone in
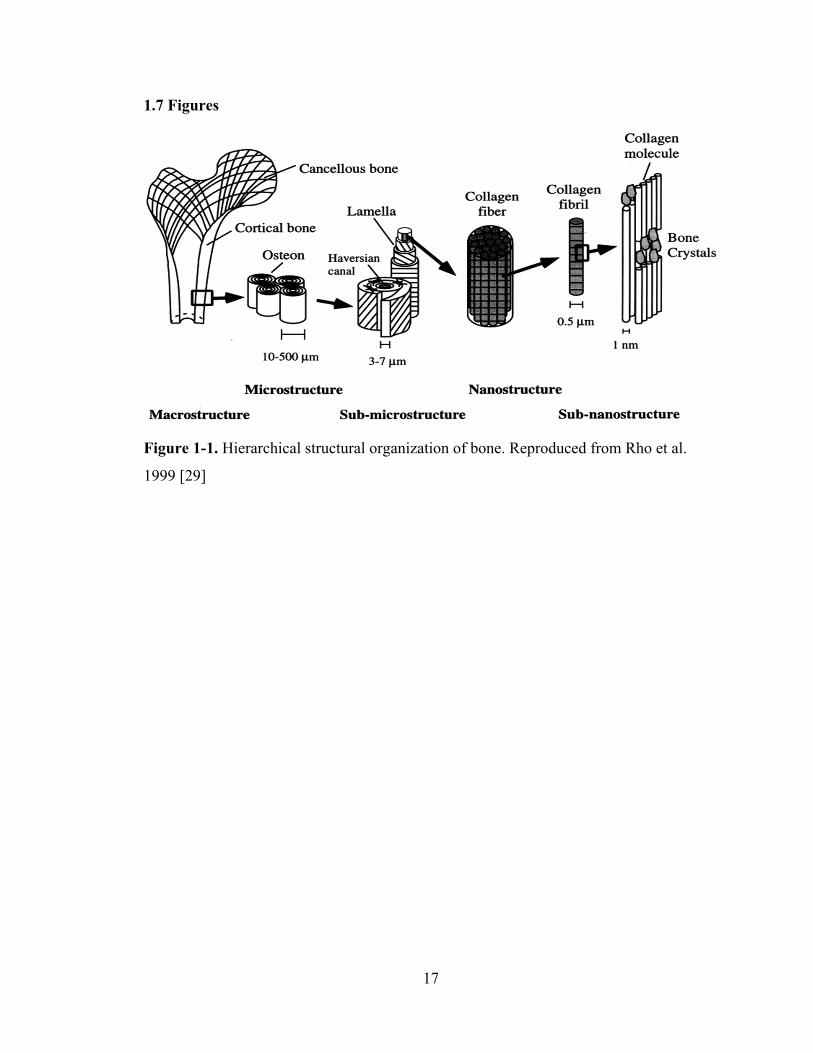
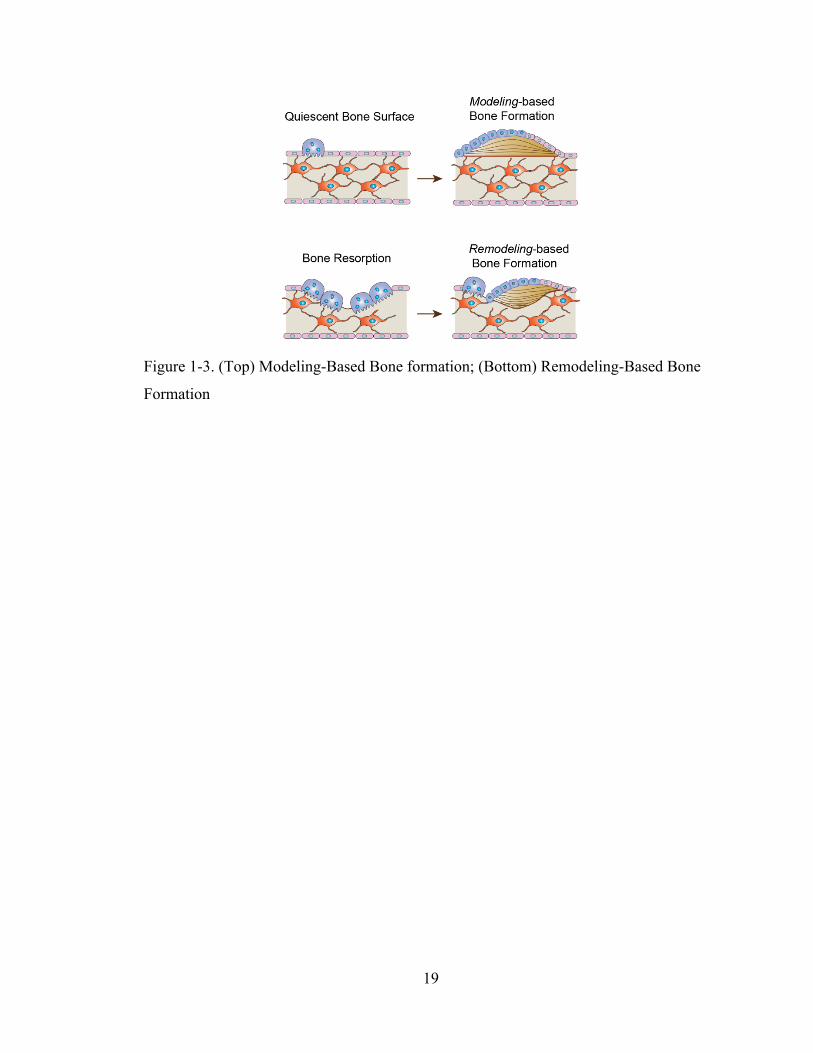
response to environmental changes [33]. Bone modeling or so-called modeling-based
bone formation (MBF) is a process that primarily alters overall bone size and shape in
response to physiologic influences, e.g., skeleton growth, healing, and external
mechanical stimulation [16, 31, 33]. During MBF, formation and resorption are not
tightly coupled, i.e., de novo bone formation without prior activation of osteoclastic
resorption (Figure 1-2) [16, 28, 42]. Since MBF occurs on quiescent bone surfaces
without preceding bone resorption, the MBF site is characterized as a new bone packet
with a smooth cement line without interruption of the surrounding collagen fibers [28,
43]. Bone remodeling or so-called remodeling-based bone formation (RBF), on the other
hand, plays a predominant role in maintaining skeletal health and mineral homeostasis
[28, 33]. During RBF, formation and resorption are tightly coupled, i.e., new bone
formation over the resorbed bone surface (Figure 1-2) [16, 28, 33, 42]. Due to bone

8
resorption preceding bone formation, the RBF site is characterized as a scalloped cement
line with interruption of surrounding cement lines [28, 43].
1.2.4 Osteoporosis
Bone is a dynamic tissue that is continuously remodeled to adapt to mechanical
stimuli and repair through osteoclast-based bone resorption and osteoblast-based bone
formation. Since bone resorption and bone formation are coupled, there is no change in
overall bone quality over time. However, when the regulation becomes a net imbalance
towards resorption due to aging or environmental changes, it may result in severe
metabolic bone diseases, such as osteoporosis [33]. A characteristic feature of
osteoporosis is significant reductions in overall bone density and structural integrity,
causing skeletal fragility and increased risk of bone fractures [1]. In the United States,
with millions of people suffering from osteoporosis and related symptoms, osteoporosis
is one of the leading causes of morbidity in the aging population [1]. According to the
data from the National Health and Nutrition Examination Survey, 2005 to 2010, 10.3% or
10.2 million adults over 50 years old had osteoporosis at femoral neck or lumbar spine
[2]. There are several types of osteoporosis. Postmenopausal osteoporosis in women, also
called primary type 1 osteoporosis, is the most common form of osteoporosis. Primary
type 2 osteoporosis due to aging occurs in both females and males. Additionally,
medicines, e.g., cancer chemotherapeutic drugs and glucocorticoids, may lead to bone
loss, which is referred to as secondary osteoporosis. The common sites that are
diagnostics of osteoporotic fracture are the spine, hip, distal forearm and proximal
humerus.
9
1.2.5 Osteoporosis Treatment
Current osteoporosis treatments focus on either inhibiting bone resorption using
antiresorptive agents or promoting bone formation using anabolic treatments.
Antiresorptive agents target to inhibit the activities of osteoclasts, reducing bone
resorption [3]. Anabolic agents, on the other hand, act by stimulating new bone formation
[3].
1.2.5.1 Antiresorptive Agents
Antiresorptive agents are an osteoporosis treatment that prevents bone loss by
inhibiting bone resorption, decreasing osteoclast formation and increasing osteoclast
apoptosis [44, 45]. Bisphosphonates are among the most commonly prescribed drugs to
reduce bone loss, preventing fractures in postmenopausal women and men with
osteoporosis [44, 46, 47]. However, recent studies indicated that the use of
bisphosphonates is associated with atypical subtrochanteric and femoral shaft fractures
[46, 47]. Estrogens suppress bone resorption, leading to increased BMD and bone
strength by blocking cytokine signals that activate osteoclasts [44]. Therefore, estrogen
replacement therapy effectively treats postmenopausal osteoporosis since it adds estrogen
to circulation to replace the loss of estrogen. However, due to the increased risks of
cancer and stroke, it is not as commonly used [44]. Selective estrogen receptor
modulators act on subclasses of estrogen receptors, inhibiting bone resorption by
blocking cytokine signals that activate osteoclasts [44]. An example of a selective
estrogen receptor modulator is raloxifene and tamoxifen [44]. Calcitonin is a non-sex,
non-steroid hormone that binds explicitly to osteoclasts to inhibit cytoskeletal function in
osteoclasts, thereby decreasing osteoclasts activities [44]. However, calcitonin treatment
10
shows less effectiveness in bone turnover compared to other antiresorptive agents [44].
Denosumab is a humanized monoclonal antibody that binds to the receptor activator of
nuclear factor κB ligand (RANKL), inhibiting the activation of mature osteoclasts and the
development of preosteoclasts [44, 45]. Cathepsin K is an enzyme expressed by
osteoclasts that degrades type 1 collagen. Odanacatib is a highly selective cathepsin K
inhibitor, thereby blocking osteoclast resorptive activity. In addition to this specific
function, odanacatib does not affect the signaling mechanisms or other functions than the
bisphosphonates and the RANKL inhibitor, denosumab [45].
1.2.5.2 Anabolic Agents
Parathyroid hormone (PTH) is an endocrine factor secreted by the parathyroid
glands to regulate bone remodeling [48, 49]. Interestingly, PTH shows the two
completely opposite bone metabolisms [48, 49]. Dobnig and Turner reported in a rat
model that continuous infusion of PTH caused bone resorption, whereas intermittent
administration of PTH resulted in bone formation [50]. This anabolic observation led to
the development of teriparatide, a synthetic form of PTH, the first anabolic agent
approved by the FDA for osteoporosis treatment [5]. However, due to its theoretical risks
on osteosarcoma development, the recommended duration of PTH treatment is limited to
18-24 months in clinical practice [10-13]. Abaloparatide is the second FDA-approved
anabolic agent [51]. Abaloparatide, a PTH analog, is a 34-amino acid peptide with 65%
homology with parathyroid hormone-related protein (PTHrP) (residue 1-22) and 41%
homology to PTH (1–34) [45]. Abaloparatide is a potent and selective activator of the
PTHR1 signaling pathway with greater bone formation effects than bone resorption to
maximize the anabolic window [45, 52]. Romosozumab (Scl-Ab), a humanized
11
monoclonal antibody to sclerostin that binds to sclerostin, is the third FDA-approved
anabolic agent [53]. Sclerostin, a glycoprotein produced primarily by osteocytes, blocks
the canonical Wnt signaling bone formation pathway, increasing bone formation and
bone mineral density (BMD) [20, 45, 54].
1.3 Significance of Studies
Teriparatide (rhPTH1-34) is the first FDA-approved anabolic treatment of
osteoporosis in postmenopausal women and men at a high risk of fracture [5, 6].
Although daily PTH administration can efficiently stimulate new bone formation and
rapidly increase bone mass, the improvement in bone mass may disappear after treatment
stops [9]. It is imperative to maximize the anabolic response on bone after
discontinuation of PTH administration. However, there is limited knowledge about this
adverse event. Therefore, the mechanisms behind this adverse phenomenon are addressed
using an in vivo imaging method, and cellular approaches in this thesis. This study is
significant because it improves the understanding of discontinuation of PTH treatment
and thereby may provide a clinical insight to develop a potential therapeutic treatment
strategy for osteoporosis treatment.
In clinical practice, the recommended treatment duration of PTH administration is
limited to 18-24 months due to its corresponding safety concerns such as osteosarcoma
[10-13]. It is of great clinical interest to combine the PTH with antiresorptive treatment to
maximize PTH efficacy by inhibiting osteoclast resorption. However, several studies
expressed concerns over the effectiveness of concomitant use of PTH and antiresorptive
agents [9, 14, 15]. As a result of observation of a continuous anabolic window during the
first week of PTH discontinuation in an estrogen deficient rat model followed by a
12
significant increase in osteoclast number, a short cycle of PTH and antiresorptive
treatment regimen may further improve the treatment effectiveness of PTH treatment.
Therefore, we propose a potential therapeutic treatment strategy, cyclic and alternating
treatment regimens of a daily injection of PTH and alendronate (ALN). This study
provides clinical insight to maximize the treatment efficacy of PTH and allows for
extended the treatment duration.
In addition to its clinical implications, this study also improves the current
understanding of the nanomechanical properties of PTH-induced bone formation, both
modeling-based bone formation (MBF) and remodeling-based bone formation (RBF).
Clinical studies suggested that the short cycles of PTH treatment could potentially
dissociate the early modeling-based anabolic effect from the latter remodeling-based
effect, thereby leading to increasing the number of newly activated MBF sites. However,
in addition to the structural morphometry, the quality, i.e. structural and compositional
heterogeneity, of bone tissue on the trabecular bone surface generated through MBF and
RBF and their long-term contributions are not fully understood. Therefore, the
investigation is the first attempt to answer several clinically important questions
regarding the long-term therapeutic potentials of MBF and RBF: (1) what happens to the
newly formed bone after PTH administration? (2) which type of newly formed bone
(MBF vs. RBF) will have better nanomechanical properties after secondary
mineralization? An understanding of the mechanical functions of bone tissue formed
through MBF and RBF and its long-term contributions to maintaining bone strength
provide critically important insight into long-term management of osteoporosis.
13
1.4 Specific Aims
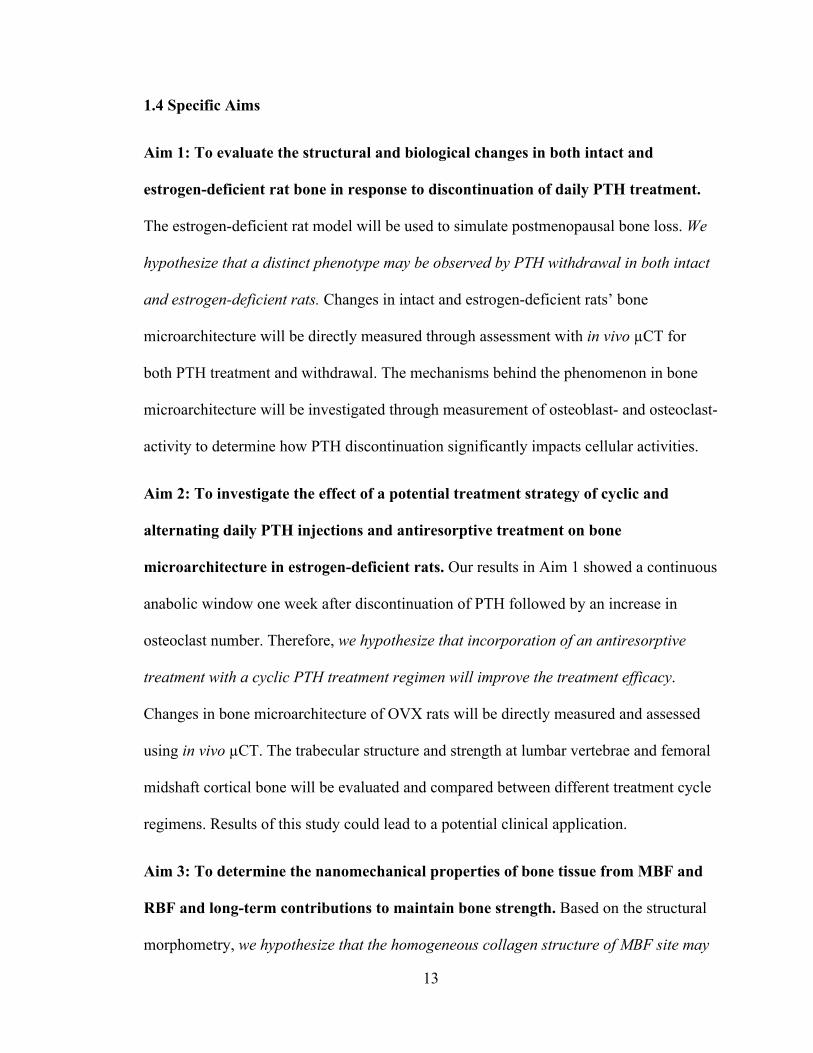
Aim 1: To evaluate the structural and biological changes in both intact and
estrogen-deficient rat bone in response to discontinuation of daily PTH treatment.
The estrogen-deficient rat model will be used to simulate postmenopausal bone loss. We
hypothesize that a distinct phenotype may be observed by PTH withdrawal in both intact
and estrogen-deficient rats. Changes in intact and estrogen-deficient rats’ bone
microarchitecture will be directly measured through assessment with in vivo µCT for
both PTH treatment and withdrawal. The mechanisms behind the phenomenon in bone
microarchitecture will be investigated through measurement of osteoblast- and osteoclast-
activity to determine how PTH discontinuation significantly impacts cellular activities.
Aim 2: To investigate the effect of a potential treatment strategy of cyclic and
alternating daily PTH injections and antiresorptive treatment on bone
microarchitecture in estrogen-deficient rats. Our results in Aim 1 showed a continuous
anabolic window one week after discontinuation of PTH followed by an increase in
osteoclast number. Therefore, we hypothesize that incorporation of an antiresorptive
treatment with a cyclic PTH treatment regimen will improve the treatment efficacy.
Changes in bone microarchitecture of OVX rats will be directly measured and assessed
using in vivo µCT. The trabecular structure and strength at lumbar vertebrae and femoral
midshaft cortical bone will be evaluated and compared between different treatment cycle
regimens. Results of this study could lead to a potential clinical application.
Aim 3: To determine the nanomechanical properties of bone tissue from MBF and
RBF and long-term contributions to maintain bone strength. Based on the structural
morphometry, we hypothesize that the homogeneous collagen structure of MBF site may

14
lead to reduced heterogeneity of tissue material properties when compared to RBF sites.
Long-term MBF and RBF properties and mechanical strength after secondary
mineralization will be quantified by using a newly developed microscopic imaging
platform and a nano-scale mechanical testing approach on adult intact rats treated with
PTH.
1.5 Study Design
All experiments were approved by the University of Pennsylvania's Institutional
Animal Care and Use Committee. A total of 135 Sprague-Dawley (SD) rats were used in
this thesis. The SD rat is a commonly used model to study skeletal physiology and
pathophysiology [55, 56]. In addition, the trabecular bone of the adult rat has an average
bone volume fraction (BV/TV) of ~0.3 and trabecular thickness (Tb.Th) of 0.075 mm at
the proximal tibia which is adequate for precise, longitudinal tracking of microstructural
changes by in vivo μCT [57]. All rats were purchased from Charles River at 3 months of
age and were housed at the University of Pennsylvania’s University Laboratory Animal
Resources facility. The experiment started when female rats were at the age of 16-17
weeks or at the age of 7 months. Although the long bones of rats continue to grow over
time due to not closing the growth plate, rats at the age of 16-17 weeks grow slower and
are able to use for ovariectomy (OVX) surgery in Aim 1 and Aim 2. At the age of 7
months, there is minimal bone growth at this age. Therefore, we used 7-month-old rats in
Aim 3.
Aim 1 focused on longitudinally tracking changes in bone microarchitecture for
treatment and discontinuation on estrogen deficient rats. Rats used in Aim 1 received
OVX surgery at age 16-17 weeks to induce estrogen deficiency. The right proximal tibia

15
of all rats was scanned using in vivo μCT and changes in bone microstructure were
evaluated. A cross-sectional study was also performed to observe the cellular activities,
including that of osteoblasts, osteoclasts and adipocytes. In addition, serum was collected
and evaluated for tartrate-resistant acid phosphatase (Serum TRAcP 5b), a marker of
bone resorption.
Aim 2 investigated the effect of a different treatment strategy of cyclic and
alternating antiresorptive treatment and daily PTH injections on bone microarchitecture
in estrogen-deficient rats. Rats used in this portion of the study received OVX surgery at
age 16-17 weeks to induce estrogen deficiency. We longitudinally tracked changes in
bone microarchitecture on the right proximal tibia. In addition, we evaluated the bone
microarchitecture and whole-bone mechanics on the midshaft region of the right femur
and the L2 lumbar vertebrae.
Aim 3 determined the mechanical properties of bone tissue from MBF and RBF
and long-term contributions to maintain bone strength. Rats used in Aim 3 received
multi-fluorochrome labels at the age of 7 months. A novel microscopic imaging platform
including fluorescence imaging, second harmonic generation imaging using a
multiphoton microscope, and brightfield imaging was first developed to identify MBF
and RBF on thick bone sections. Using this newly developed imaging platform and a
nano-scale mechanical testing approach, the mechanical properties in both MBF and RBF
were quantified after secondary mineralization. Finally, the quantification of bone
mineralization was evaluated on MBF and RBF sites using backscattered scanning
electron microscopy (SEM) images.
Power analyses were performed to estimate the required group sizes. Based on an
16
estimated variance in the measured parameters of around 20%, and an expected
intergroup
difference of at least 30%, we anticipated that a sample size of 6-10 animals per
group would allow for a type I error rate of 5% and a statistical power of 80%.
1.6 Chapter Overview
Chapter two will describe the experimental studies to uncover the structural and
biological changes behind the discontinuation of PTH by longitudinal tracking the
changes in trabecular bone microarchitecture and localized cellular responses at the
proximal tibia in an intact rat model and an OVX rat model. Chapter three will describe
studies investigating effectiveness of the short cycles of PTH treatment and incorporating
an antiresorptive treatment during the off-PTH period of cyclic treatment regimen. We
propose a potential therapeutic treatment strategy, cyclic and alternating treatment
regimens of alendronate (ALN) and daily injection of PTH. Chapter four will describe a
novel imaging method that can be coupled with a mechanical testing platform to reliably
identify and examine material properties of RBF and MBF on thick bone sections.
Finally, chapter five will summarize the overall conclusions of this thesis and will discuss
possible future research studies related to this topic.
17
1.7 Figures
Figure 1-1. Hierarchical structural organization of bone. Reproduced from Rho et al.
1999 [29]

18
Figure 1-2. A typical load-displacement curve of nanoindentation tests
19
Figure 1-3. (Top) Modeling-Based Bone formation; (Bottom) Remodeling-Based Bone
Formation
20
1.8 References
1. National Osteoporosis Foundation. 2. Wright, N.C., et al., The recent prevalence of osteoporosis and low bone mass in the
United States based on bone mineral density at the femoral neck or lumbar spine. J Bone Miner Res, 2014. 29(11): p. 2520‐6.
3. Watts, N.B. and J.P. Bilezikian, Advances in target‐specific therapy for osteoporosis. J Clin Endocrinol Metab, 2014. 99(4): p. 1149‐51.
4. Dempster, D.W., et al., Remodeling‐ and Modeling‐Based Bone Formation With Teriparatide Versus Denosumab: A Longitudinal Analysis From Baseline to 3 Months in the AVA Study. J Bone Miner Res, 2018. 33(2): p. 298‐306.
5. FDA Drug Approvals List [online] <https://www.accessdata.fda.gov/drugsatfda_docs/nda/2002/21‐318_Forteo.cfm>. 2002.
6. Berg, C., K. Neumeyer, and P. Kirkpatrick, Teriparatide. Nat Rev Drug Discov, 2003. 2(4): p. 257‐8.
7. Dempster, D.W., et al., Anabolic actions of parathyroid hormone on bone. Endocr Rev, 1993. 14(6): p. 690‐709.
8. Morley, P., J.F. Whitfield, and G.E. Willick, Anabolic effects of parathyroid hormone on bone. Trends Endocrinol Metab, 1997. 8(6): p. 225‐31.
9. Black, D.M., et al., One year of alendronate after one year of parathyroid hormone (1‐84) for osteoporosis. N Engl J Med, 2005. 353(6): p. 555‐65.
10. Canalis, E., A. Giustina, and J.P. Bilezikian, Mechanisms of anabolic therapies for osteoporosis. N Engl J Med, 2007. 357(9): p. 905‐16.
11. Vahle, J.L., et al., Skeletal changes in rats given daily subcutaneous injections of recombinant human parathyroid hormone (1‐34) for 2 years and relevance to human safety. Toxicol Pathol, 2002. 30(3): p. 312‐21.
12. Vahle, J.L., et al., Bone neoplasms in F344 rats given teriparatide [rhPTH(1‐34)] are dependent on duration of treatment and dose. Toxicol Pathol, 2004. 32(4): p. 426‐38.
13. Jolette, J., et al., Defining a noncarcinogenic dose of recombinant human parathyroid hormone 1‐84 in a 2‐year study in Fischer 344 rats. Toxicol Pathol, 2006. 34(7): p. 929‐40.
14. Cohen, A., et al., Bone Density After Teriparatide Discontinuation in Premenopausal Idiopathic Osteoporosis. J Clin Endocrinol Metab, 2015. 100(11): p. 4208‐14.
15. Leder, B.Z., et al., Effects of teriparatide treatment and discontinuation in postmenopausal women and eugonadal men with osteoporosis. J Clin Endocrinol Metab, 2009. 94(8): p. 2915‐21.
16. Langdahl, B., S. Ferrari, and D.W. Dempster, Bone modeling and remodeling: potential as therapeutic targets for the treatment of osteoporosis. Ther Adv Musculoskelet Dis, 2016. 8(6): p. 225‐235.
17. Hodsman, A.B. and B.M. Steer, Early histomorphometric changes in response to parathyroid hormone therapy in osteoporosis: evidence for de novo bone formation on quiescent cancellous surfaces. Bone, 1993. 14(3): p. 523‐7.
18. Dempster, D.W., et al., Effects of daily treatment with parathyroid hormone on bone microarchitecture and turnover in patients with osteoporosis: a paired biopsy study. J Bone Miner Res, 2001. 16(10): p. 1846‐53.
21
19. Lindsay, R., et al., A novel tetracycline labeling schedule for longitudinal evaluation of the short‐term effects of anabolic therapy with a single iliac crest bone biopsy: early actions of teriparatide. J Bone Miner Res, 2006. 21(3): p. 366‐73.
20. Ominsky, M.S., et al., Tissue‐level mechanisms responsible for the increase in bone formation and bone volume by sclerostin antibody. J Bone Miner Res, 2014. 29(6): p. 1424‐30.
21. Altman, A.R., et al., Enhanced individual trabecular repair and its mechanical implications in parathyroid hormone and alendronate treated rat tibial bone. J Biomech Eng, 2015. 137(1).
22. Altman, A.R., et al., A closer look at the immediate trabecula response to combined parathyroid hormone and alendronate treatment. Bone, 2014. 61: p. 149‐57.
23. de Bakker, C.M., et al., muCT‐based, in vivo dynamic bone histomorphometry allows 3D evaluation of the early responses of bone resorption and formation to PTH and alendronate combination therapy. Bone, 2015. 73: p. 198‐207.
24. Kostenuik, P.J., et al., OPG and PTH‐(1‐34) have additive effects on bone density and mechanical strength in osteopenic ovariectomized rats. Endocrinology, 2001. 142(10): p. 4295‐304.
25. Pierroz, D.D., et al., Are osteoclasts needed for the bone anabolic response to parathyroid hormone? A study of intermittent parathyroid hormone with denosumab or alendronate in knock‐in mice expressing humanized RANKL. J Biol Chem, 2010. 285(36): p. 28164‐73.
26. Jilka, R.L., et al., Continuous elevation of PTH increases the number of osteoblasts via both osteoclast‐dependent and ‐independent mechanisms. J Bone Miner Res, 2010. 25(11): p. 2427‐37.
27. Cusano, N.E. and J.P. Bilezikian, Combination antiresorptive and osteoanabolic therapy for osteoporosis: we are not there yet. Curr Med Res Opin, 2011. 27(9): p. 1705‐7.
28. Jee, W.S., X.Y. Tian, and R.B. Setterberg, Cancellous bone minimodeling‐based formation: a Frost, Takahashi legacy. J Musculoskelet Neuronal Interact, 2007. 7(3): p. 232‐9.
29. Rho, J.Y., L. Kuhn‐Spearing, and P. Zioupos, Mechanical properties and the hierarchical structure of bone. Med Eng Phys, 1998. 20(2): p. 92‐102.
30. Bartel, D.L., Davy, D.T., and Keaveny, T.M., Orthopaedic biomechanics: mechanics and design in musculoskeletal systems. Prentice Hall, 2006.
31. Cowin, S.C., Bone mechanics handbook, second edition. 2001. 32. Sikavitsas, V.I., J.S. Temenoff, and A.G. Mikos, Biomaterials and bone
mechanotransduction. Biomaterials, 2001. 22(19): p. 2581‐93. 33. Clarke, B., Normal bone anatomy and physiology. Clin J Am Soc Nephrol, 2008. 3 Suppl
3: p. S131‐9. 34. Oliver, W.C. and G.M. Pharr, An improved technique for determining hardness and
elastic modulus using load and displacement sensing indentation experiments. Journal of materials research, 1992. 7(06): p. 1564‐83.
35. Oliver, W.C. and G.M. Pharr, Measurement of hardness and elastic modulus by instrumented indentation: Advances in understanding and refinements to methodology. Journal of materials research, 2004. 19(01): p. 3‐20.
36. Briscoe, B.J., L. Fiori, and E. Pelillo, Nano‐indentation of polymeric surfaces. Journal of Physics D: Applied Physics, 1998. 31(19): p. 2395‐405.
37. Ebenstein, D.M. and L.A. Pruitt, Nanoindentation of biological materials. Nano Today, 2006.
22
38. Hoffler, C.E., et al., An application of nanoindentation technique to measure bone tissue Lamellae properties. Journal of biomechanical engineering, 2005. 127(7): p. 1046‐53.
39. Schriefer, J.L., et al., A comparison of mechanical properties derived from multiple skeletal sites in mice. J Biomech, 2005. 38(3): p. 467‐75.
40. Turner, C.H. and D.B. Burr, Basic biomechanical measurements of bone: a tutorial. Bone, 1993. 14(4): p. 595‐608.
41. Bonewald, L.F., The amazing osteocyte. J Bone Miner Res, 2011. 26(2): p. 229‐38. 42. Erben, R.G., Trabecular and endocortical bone surfaces in the rat: modeling or
remodeling? Anat Rec, 1996. 246(1): p. 39‐46. 43. Kobayashi, S., et al., Trabecular minimodeling in human iliac bone. Bone, 2003. 32(2): p.
163‐9. 44. Chen, J.S. and P.N. Sambrook, Antiresorptive therapies for osteoporosis: a clinical
overview. Nat Rev Endocrinol, 2011. 8(2): p. 81‐91. 45. Bandeira, L. and J.P. Bilezikian, Novel Therapies for Postmenopausal Osteoporosis.
Endocrinol Metab Clin North Am, 2017. 46(1): p. 207‐219. 46. Shane, E., et al., Atypical subtrochanteric and diaphyseal femoral fractures: second
report of a task force of the American Society for Bone and Mineral Research. J Bone Miner Res, 2014. 29(1): p. 1‐23.
47. Shane, E., et al., Atypical subtrochanteric and diaphyseal femoral fractures: report of a task force of the American Society for Bone and Mineral Research. J Bone Miner Res, 2010. 25(11): p. 2267‐94.
48. Qin, L., L.J. Raggatt, and N.C. Partridge, Parathyroid hormone: a double‐edged sword for bone metabolism. Trends Endocrinol Metab, 2004. 15(2): p. 60‐5.
49. Silva, B.C. and J.P. Bilezikian, Parathyroid hormone: anabolic and catabolic actions on the skeleton. Curr Opin Pharmacol, 2015. 22: p. 41‐50.
50. Dobnig, H. and R.T. Turner, The effects of programmed administration of human parathyroid hormone fragment (1‐34) on bone histomorphometry and serum chemistry in rats. Endocrinology, 1997. 138(11): p. 4607‐12.
51. FDA Drug Approvals List [online] <https://www.accessdata.fda.gov/scripts/cder/daf/index.cfm?event=overview.process&varApplNo=208743>. 2017.
52. Hattersley, G., et al., Binding Selectivity of Abaloparatide for PTH‐Type‐1‐Receptor Conformations and Effects on Downstream Signaling. Endocrinology, 2016. 157(1): p. 141‐9.
53. FDA Drug Approvals List [online] <https://www.accessdata.fda.gov/scripts/cder/daf/index.cfm?event=overview.process&varApplNo=761062>. 2019.
54. McClung, M.R., Romosozumab for the treatment of osteoporosis. Osteoporos Sarcopenia, 2018. 4(1): p. 11‐15.
55. Lelovas, P.P., et al., The laboratory rat as an animal model for osteoporosis research. Comp Med, 2008. 58(5): p. 424‐30.
56. Jee, W.S. and W. Yao, Overview: animal models of osteopenia and osteoporosis. J Musculoskelet Neuronal Interact, 2001. 1(3): p. 193‐207.
57. Schulte, F.A., et al., In vivo micro‐computed tomography allows direct three‐dimensional quantification of both bone formation and bone resorption parameters using time‐lapsed imaging. Bone, 2011. 48(3): p. 433‐42.

23
CHAPTER 2
Cyclic Treatment Regimen Rescues Parathyroid Hormone Discontinuation-Induced
Bone Loss and Microarchitecture Deterioration in Ovariectomized Rats
2.1 Introduction
Osteoporosis is a disease characterized by significant reductions in overall bone
density and structural integrity, causing skeletal fragility and an increased risk of bone
fractures [1]. Risks of osteoporosis and fragility fracture significantly increased in women
post menopause, as rapid decline in estrogen levels during menopause leads to
accelerated bone resorption that outpaces bone formation. Current treatments for
postmenopausal osteoporosis focus on either inhibiting bone resorption using anti-
catabolic agents or promoting bone formation using anabolic treatments [2]. Teriparatide,
recombinant human parathyroid hormone (rhPTH) 1-34, is the first FDA-approved
anabolic agent for osteoporosis when administered intermittently. This anabolic agent is
approved for the treatment of osteoporosis in postmenopausal women and in men at high
risk of bone fracture [3, 4]. Unlike the anti-resorptive agents which suppress bone
resorption through inhibition of osteoclast activities, its mechanism of action is to
promote bone remodeling and to shift the balance of remodeling towards increased bone
formation [5-7], thereby rapidly increasing bone mass and reducing the risk of fractures.
In clinical practice, the recommended duration of PTH treatment is limited to 18-
24 months due to its theoretical risks on the development of osteosarcoma [8-11].
However, osteoporosis in postmenopausal women and elderly men is a life-long, chronic
condition. Despite the potent effect of PTH on promoting new bone formation, if not

24
followed by an antiresorptive agent, the gains in bone mineral density (BMD) were
quickly lost upon withdrawal from PTH treatment [12-14]. In a randomized, 2-year study
with a 1-year treatment of PTH1-84 followed by a 1-year treatment of alendronate or
placebo, women who were randomly given a placebo after PTH treatment experienced a
nearly 2% loss in BMD at the spine. Moreover, trabecular bone is more susceptible to the
bone loss upon PTH discontinuation, demonstrated by a striking 10% decrease in the
trabecular volumetric BMD at the spine. However, mechanisms behind this adverse event
is not clear. To maximize the efficacy of PTH, it is imperative to obtain a better
understanding of the mechanisms behind the bone loss upon discontinuation from PTH
treatment. Therefore, the first objective of this study was to establish a rat model to study
the structural changes and cellular responses after discontinuation of intermittent PTH
administration in both intact and estrogen deficient rats. By using an in vivo μCT imaging
technique with high spatial and temporal resolution, we discovered a continuous anabolic
window of bone gain upon early withdrawal from PTH treatment in the estrogen-
deficient rats, which was further confirmed by histological analyses of bone cells. The
anabolic window would offer a new mechanism in support of the cyclic PTH treatment
regimen to maximize the anabolic effect of PTH and extend treatment duration. With this
being said, the second objective was to test the efficacy of a cyclic PTH treatment
regimen on rescuing PTH's withdrawal effects. We hypothesized that a cyclic PTH
treatment regimen with repeated cycles of on and off daily injection of PTH would best
utilize the anabolic window upon withdrawal, resulting in extended treatment duration
and significant improvement in bone mass, bone microarchitecture, and mechanical
properties.
25
2.2. Materials and Methods
2.2.1 Animals and treatment plans
All experiments were approved by the University of Pennsylvania's Institutional
Animal Care and Use Committee. A total of 101 female Sprague Dawley rats were used
in this study. Rats were randomly assigned to different groups, housed in standard
conditions in groups of three rats per cage. Experiments were performed unblinded.
Intermittent PTH treatment (Human Recombinant PTH1-34, Bachem, Bubendorf,
Switzerland) was administered subcutaneously 5 times per week to all animals at the dose
of 40 µg/kg/day while Vehicle treatment was administered in the form of subcutaneous
injections of saline (150 μL/day, 5 times per week).
To study the skeletal effect of PTH discontinuation, 40 intact female rats and 42
ovariectomized rats (OVX) were used. The study of intact rats began when the rats were
at 16-17 weeks old. First, a longitudinal μCT imaging study was performed for a vehicle
group (V3V9, receiving saline injections for 12 weeks, n=6) and a PTH-VEH group
(P3V9, receiving injections of PTH for 3 weeks followed by saline for 9 weeks, n=6,
Figure 2-1A) where animals received in vivo μCT scans every 3 weeks. Second,
additional μCT scans were performed for a vehicle group (V3V3, n=5) and a PTH-VEH
group (P3V3, n=3, Figure 2-2A) at week 0, 3, 4, 5, 6 for detecting skeletal response
immediately after treatment discontinuation. Next, 20 rats were used in a histology study
to assess bone cell activities in response to discontinuation of PTH and euthanized after
3-week VEH treatment (V3, n=5), 3-week PTH treatment (P3, n=5), 3-week PTH
treatment followed by 1-week VEH treatment (P3V1, n=5), and followed by 2-week
VEH treatments (P3V2, n=5).

26
Rats in the OVX group received a bilateral ovariectomy (OVX) surgery at 16-17
weeks of age. The study began after a 4-week development of osteoporosis in the OVX
rats. Similar to the intact rats, 18 OVX rats were assigned to 2 groups for a longitudinal
μCT imaging study: a vehicle (OVX-V3V9, n=9) group receiving saline injections for 12
weeks and a PTH-VEH group (OVX-P3V9, n=9) receiving PTH injections for 3 weeks
followed by saline for 9 weeks (Figure 2-3). In vivo μCT scans were performed at week -
4, 0, 3, 4, 5, 6, 8, 10, and 12. Additionally, 24 rats were used to assess bone cell activities
after 3-week VEH treatment (OVX-V3, n=6), 3-week PTH treatment (OVX-P3, n=6), 3-
week PTH treatment followed by 1-week VEH treatment (OVX-P3V1, n=6), and
followed by 2-week VEH treatments (OVX-P3V2, n=6).
To test efficacy of long-term treatment regimens, 20 OVX rats were assigned to 3
groups: VEH (18-week saline injections, n=6), PTH-VEH (9-week PTH treatment
followed by 9-week vehicle treatment, n=7), and Cyclic PTH (3-week PTH followed by
3-week vehicle treatment, repeat for 3 cycles, n=7).
2.2.2 In vivo µCT scans and analysis
As described in [15] and [16], rats were anesthetized (4.0/2% isoflurane), and the
right leg of each rat was inserted into a custom holder to prevent movement during the
scan. A 4-mm region of the tibia, distal to the proximal growth plate, was scanned at 10.5
μm voxel size, 55 kVp energy, 145 µA intensity, 200 ms integration time, and 1000
projections, using a 0.5mm Al filter and a standard, manufacturer-provided beam-
hardening correction algorithm, resulting in a total scan time of about 20 minutes and
approximate radiation dose of 0.639 Gy per scan.

27
The follow-up scans were registered to the baseline scan following procedures as
described in our previous publications [15, 17]. Briefly, a volume of interest (VOI) of
trabecular bone compartment in the secondary spongiosa, starting approximately 2.3 mm
distal from the growth plate and consisting of 200 slices (corresponding to a 2.1 mm thick
section) was chosen in the last scan. By applying 3D image registration [15, 17], the
corresponding VOIs of trabecular bone in images from the previous time points were
precisely identified. Representative baseline and registered follow-up images of each
treatment group are shown in Figure 2-1B and 2-3B.
Bone voxels of each registered image were segmented from the bone marrow and
background using Gaussian filtering (sigma=1.2 and support=2.0) and a global threshold
corresponding to 564.8 mgHA/cm3. Bone microstructural parameters including bone
volume fraction (BV/TV), trabecular thickness (Tb.Th), trabecular separation (Tb.Sp),
trabecular number (Tb.N), structure model index (SMI), and connectivity density
(Conn.D), were evaluated for all registered VOIs.
2.2.3 Bone histomorphometry and serum biochemistry analysis
The right tibiae in the V3, P3, P3V1, and P3V2 group of intact and OVX rats
were harvested immediately after euthanasia for methylmethacrylate (MMA) embedding.
Five-µm-thick longitudinal sections were cut using a Polycut-S motorized microtome
(Reichert, Heidelberg, Germany) for static bone histomorphometry measurements.
Goldner's trichrome staining was performed to identify osteoblasts, osteoclasts, and bone
surface. Furthermore, for estrogen-deficient rats, the left tibia was harvested for paraffin
embedding. Five-µm-thick longitudinal paraffin sections were sectioned. Hematoxylin
and eosin (H&E) staining was performed to identify adipocytes and bone marrow area.
28
All histomorphometric measurements were performed in an area 2.0–5.0 mm distal to the
growth plate using Bioquant Osteo Software (Bioquant Image Analysis, Nashville, TN)
and the following parameters were derived: osteoblast and osteoclast number per bone
surface (N.Ob/BS and N.Oc/BS, 1/mm), the percentage of osteoblast and osteoclast
surface (Ob.S/BS and Oc.S/BS, %), and adipocyte number per bone marrow area
(N.Adi/Ma.Ar, 1/mm2) [18, 19]. Additionally, blood in OVX animals was collected via
cardiac puncture at the time of euthanasia and left at room temperature for 30 min before
being placed on ice and centrifuged at 2000×g for 10 min to separate sera. Serum tartrate-
resistant acid phosphatase 5b (TRAP) levels were determined by the RatTRAPTM
(TRAcP 5b) ELISA immunoassay (Immunodiagnostic Systems, Scottsdale, AZ).
2.2.4 Ex vivo µCT Scans and Uniaxial Compression Tests for the Lumbar Vertebra L2
The second lumbar vertebrae (L2) of long-term treatment groups were harvested
and scanned by µCT (vivaCT40, Scanco Medical AG, Brüttisellen, Switzerland) at 10.5
µm isotropic resolution. A 2.1 mm-thick trabecular VOI, which occupied the center 1/2
of the vertebral body, was identified and subjected to analysis as described previously
[20]. Subsequently, the vertebral body was cut at both ends of the growth plate using a
low speed diamond saw (IsoMet, Buehler, Lake Bluff, IL) with water irrigation. A ~4-
mm specimen with two paralleled endplates was then obtained for the uniaxial
compression test as described in [20]. The load-displacement curve generated from
mechanical testing was used to calculate stiffness, peak load, and energy to failure. These
mechanical properties at whole bone level were then normalized by vertebral size to
calculate apparent-level mechanical properties including Young's modulus, toughness,
and ultimate stress.
29
2.2.5 Cortical bone analysis and 4-point bending test of femoral shaft
The right femurs of the long-term treatment groups were dissected after
euthanasia. A 1.2-mm region of femur midshaft was scanned by μCT (µCT 35, Scanco
Medical AG, Brüttisellen, Switzerland) at 6 μm image voxel size. Standard cortical
parameters including cortical thickness (Ct.Th), cortical porosity (Ct.Po), cortical tissue
mineral density (Ct.TMD), polar moment of inertia (pMOI), periosteal perimeter
(Ct.Pe.Pm), and endosteal perimeter (Ct.En.Pm) were evaluated for a 0.3 mm thick
region in the center of the midshaft. A destructive 4-point bending test was then
performed at the midshaft region with a displacement rate of 1.8 mm/min with the outer
supports being 26.56 mm apart and the inner supports being 8.84 mm apart (Instron 5542,
Norwood, MA). The load-displacement curve generated from mechanical testing was
used to calculate stiffness, peak load, Young's modulus, energy to failure, and post-yield
energy to failure [21].
2.2.6 Statistical Analysis
All statistical analyses were performed using NCSS 7.1.14 (NCSS, LLC,
Kaysville, UT). Mean ± standard deviation (SD) are given for all the results. For
longitudinal µCT image-based measurements, a two-way, repeated measures ANOVA
was used to compare treatment groups over time. All comparisons were adjusted for
baseline measures. In the presence of statistically significant main effects of time,
treatment, and treatment*time interactions, post-hoc comparisons of between-group
differences at each time point and within-group differences between different time points
were made using a Bonferroni correction. For all cross-sectional group comparisons, a
one-way ANOVA with a Tukey HSD post hoc test was performed to determine the

30
treatment effects among groups. For all analyses, a two-tailed p<0.05 was considered to
indicate statistical significance.
2.3 Results
2.3.1 3-week PTH treatment benefits were maintained in intact rats upon 9-week
discontinuation
3-week PTH treatment to intact rats caused 29% and 33% increase in tibial
BV/TV and Tb.Th, respectively, a 31% decrease in Conn.D, and a decrease of 0.69 in
SMI (Figure 2-1). On the other hand, intact rats in the VEH group showed no changes in
BV/TV, Tb.Th, Tb.Sp, or SMI, but an 8% decrease in Tb.N after 3 week saline treatment
(Figure 2-1). BV/TV and Tb.Th were 34% and 26% greater, respectively, and SMI and
Conn.D were 54% and 3% lower, respectively, in the PTH-treated animals compared to
the VEH-treated animals at week 3 (Figure 2-1).
Upon 9 weeks of discontinuation, the treatment benefits were maintained in
BV/TV, Tb.Th, Tb.Sp, and Conn.D in PTH treated animals while Tb.N decreased by 5%
(Figure 2-1). In contrast, continuous 9-week vehicle treatment resulted in 9% and 23%
decrease in Tb.N and Conn.D, respectively, and a 15% increase in Tb.Sp (Figure 2-1). By
the end of week 12, BV/TV and Tb.Th were 38% and 21% greater, and SMI was 40%
lower in the PTH-treated animals compared to the VEH-treated animals (Figure 2-1).
2.3.2 Early withdrawal from PTH is associated with a continuous anabolic window in
OVX rats, but not in intact rats
Before the treatment starts, 4-week osteopenia development in OVX rats caused a
50%, 33% and 65% decrease in tibial BV/TV, Tb.N, and Conn.D, respectively, and an

31
increase of 1.3 in SMI (Figure 2-3). Compared to week 0, 3-week VEH treatment was
associated with a 32% and 59% decrease in Tb.N and Conn.D, respectively, respectively,
and a 71% increase in Tb.Sp (p<0.05). In contrast, 3-week PTH treatment effectively
slowed down bone loss, causing a 30% and 39% increase in BV/TV and Tb.Th,
respectively and no changes in SMI, Tb.Sp, and Conn.D (Figure 2-3). As a result,
BV/TV, Tb.Th and Tb.N were 98%, 28% and 25% greater, respectively, and SMI was
30% lower in the PTH-treated animals compared to VEH-treated animals at week 3.
Surprisingly, 1 week after withdrawal (week 4), BV/TV, Tb.Th, and SMI continued to
show trends of improvement, resulting in 7% and 8% increase in BV/TV and Tb.Th,
respectively, and a decrease of 0.14 in SMI. This continuous anabolic effect upon 1-week
withdrawal from PTH was only observed in OVX rats, but not in intact rats (Figure 2-2).
2.3.3 3-week PTH treatment benefits diminished in OVX rats upon 9-week
discontinuation
Following the 1-week anabolic window, a rapid decline in BV/TV occurred from
the second week (week 5) upon withdrawal from PTH in OVX rats. As a result, treatment
benefit in BV/TV and SMI diminished and Tb.N became 23% lower compared to that at
week 0. 9 weeks after discontinuation of PTH, the treatment benefits in trabecular bone
completely diminished, with no difference between the PTH and VEH groups in any
trabecular bone microstructure parameters (Figure 2-3).
32
2.3.4 Number of osteoblasts significantly reduced while number of osteoclasts and
adipocytes increased upon withdrawal from PTH in OVX rats
N.Ob/BS and Ob.S/BS were 117% and 107% greater in PTH-treated group than
the vehicle-treated group (P3 vs. V3), respectively, while N.Oc/BS, Oc.S/BS and
Adi.N/Ma.Ar were 55%, 52% and 69% lower in the P3 compared to the V3 group,
respectively (Figure 2-4). After 1-week withdrawal from PTH, N.Ob/BS and Ob.S/BS
decreased by 38% and 38 (P3V1 vs. P3), respectively, but remained 36% and 30%
greater than the VEH group (P3V1 vs. V3, Figure 2-4). In contrast, no change was found
in N.Oc/BS and Adi.N/Ma.Ar 1 week after discontinuation of PTH (P3V1 vs. P3, Figure
2-4). 2-week after discontinuation of PTH, there was no remaining difference in
N.Ob/BS, Ob.S/BS, N.Oc/BS and Oc.S/BS from the VEH group (P3V2 vs. V3) while
Adi.N/Ma.Ar was still 29% lower than the VEH group (P3V2 vs. V3, Figure 2-4). Serum
TRAP levels showed the similar trend as the N.Oc/BS and Oc.S/BS; however, no
difference was detected between groups (Figure 2-4N).
The responses of intact rats to the PTH treatment were similar to those of OVX
rats, as demonstrated by 108% and 116% greater N.Ob/BS and Ob.S/BS, as well as 71%
and 71% lower N.Oc/BS and Oc.S/BS in the PTH compared to the VEH group,
respectively (P3 vs. V3, Figure 2-5). However, in contrast to rapid responses in bone cells
to PTH discontinuation, there was no difference in any of osteoblast and osteoclast
parameters between PTH-treated group and groups of 1- or 2-week after PTH
discontinuation (P3 vs. P3V1, or P3 vs. P3V2, Figure 2-5).
33
2.3.5 Cyclic treatment regimen rescues PTH discontinuation-induced bone loss and
extended treatment duration
Without therapeutic intervention, significant bone loss and trabecular bone
microarchitecture deterioration occurred in the proximal tibia of the VEH group over 18
weeks, resulting in 61%, 58% and 87% decreases in BV/TV, Tb.N and Conn.D, and 25%
and 147% increase in Tb.Th and Tb.Sp, respectively (Figure 2-6). In the PTH-VEH
group, 9-week PTH treatment led to 99% and 92% increase in BV/TV and Tb.Th,
respectively, a 18% decrease in Tb.N and a decrease of 1.35 in SMI (p<0.01, Figure 2-6).
After 9-week discontinuation of PTH, BV/TV and Tb.Th underwent dramatic reductions
of 305% and 151% while Tb.Sp underwent a substantial increase of 54%, and SMI
underwent an increase of 1.21. By the end of week 18, PTH treatment benefit was
completely lost, as reflected by no difference between the PTH-VEH and VEH groups in
any trabecular bone microarchitecture parameters. In contrast, in the Cyclic PTH group,
the first cycle of 3-week PTH on and 3-week off prevented reduction in BV/TV and led
to a 55% increase in Tb.Th and a decrease of 0.55 in SMI. BV/TV and SMI stabilized
and Tb.Th continued to increase during the 2nd and 3rd cycles. At week 18, BV/TV in the
Cyclic PTH group was 45% and 65% greater than that of the PTH-VEH and VEH group
while Tb.Th was 27% and 23% in the Cyclic PTH group vs. PTH-VEH and VEH group,
respectively (p<0.05, Figure 2-6).
By the end of week 18, there was no difference in any trabecular bone
microarchitecture parameters or mechanics properties of the lumbar vertebra L2 between
the VEH and PTH-VEH groups (Figure 2-7). In contrast, BV/TV of the Cyclic PTH
group was 38% greater than that of the VEH group and Tb.Th was 26% and 16% greater
34
than that of the VEH and PTH-VEH groups, respectively (Figure 2-7). The Cyclic PTH
group also achieved the greater mechanical properties of L2 than the VEH group both at
the whole bone level (37% and 65% greater peak load and energy to failure, respectively)
and at the apparent level (84% and 53% greater toughness and ultimate stress,
respectively) which were calculated by normalizing whole-bone mechanics by vertebral
size.
In terms of femur midshaft, at the end of week 18, the Ct.Th in the Cyclic PTH
group is 10% greater than the VEH group (Figure 2-8). There was no effect on other
cortical bone microarchitecture parameters, including pMOI, porosity, TMD, Ct.Pe.Pm
and Ct.En.Pm in the Cyclic PTH group compared to the PTH-VEH and VEH group,
respectively (Figure 2-8). At the whole bone level, the Cyclic PTH group resulted in 25%
and 43% increase in peak load and total energy to failure when compared to the VEH
group (Figure 2-8).
2.4 Discussion
The results of this study indicate that significant tibial bone loss and bone
microarchitecture deterioration occurred in estrogen-deficient animals in response to
discontinuation of PTH treatment while no adverse effect was observed in intact rats,
suggesting coupled effects between PTH withdrawal and the degree of bone remodeling
dynamics. Intriguingly, there is a continuous anabolic window upon first week
withdrawal from PTH in estrogen-deficient rats during which osteoblast activities
outpaced osteoclast activities. In contrast, changes in bone cells, increased in number of
osteoclasts and decreased in number of osteoblasts, 2 weeks after discontinuation of PTH
treatment led to a decline in bone mass and bone microarchitecture. 9 weeks after
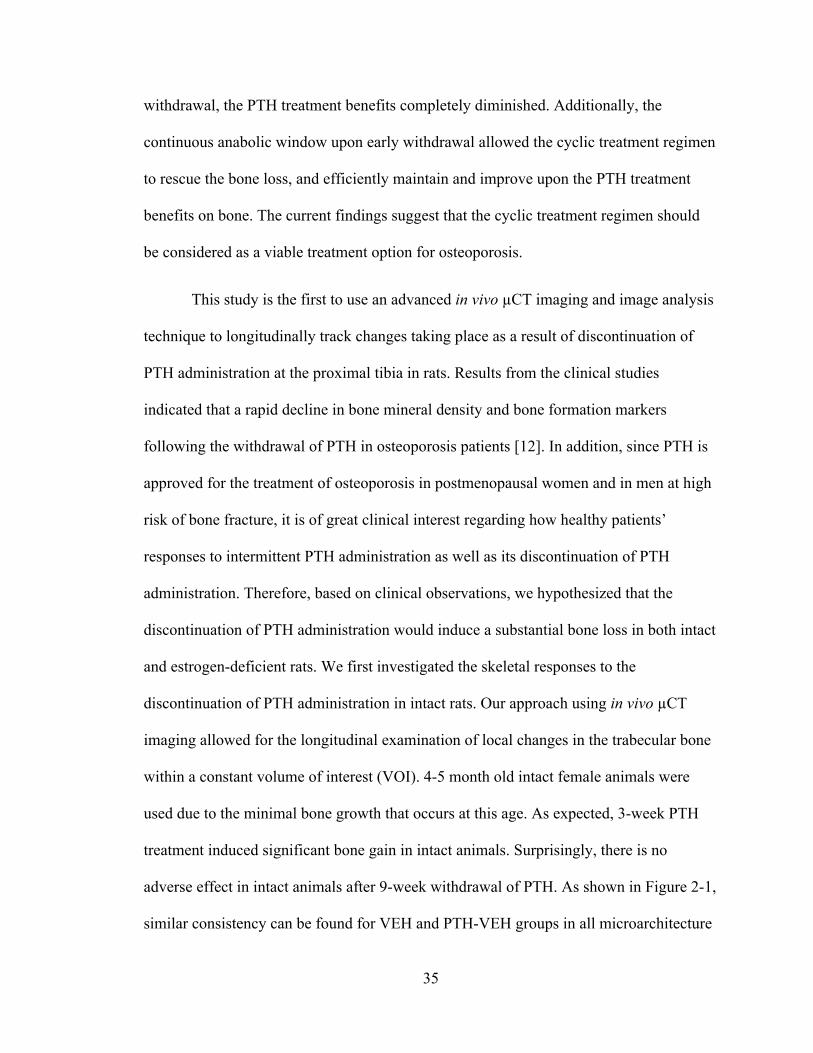
35
withdrawal, the PTH treatment benefits completely diminished. Additionally, the
continuous anabolic window upon early withdrawal allowed the cyclic treatment regimen
to rescue the bone loss, and efficiently maintain and improve upon the PTH treatment
benefits on bone. The current findings suggest that the cyclic treatment regimen should
be considered as a viable treatment option for osteoporosis.
This study is the first to use an advanced in vivo µCT imaging and image analysis
technique to longitudinally track changes taking place as a result of discontinuation of
PTH administration at the proximal tibia in rats. Results from the clinical studies
indicated that a rapid decline in bone mineral density and bone formation markers
following the withdrawal of PTH in osteoporosis patients [12]. In addition, since PTH is
approved for the treatment of osteoporosis in postmenopausal women and in men at high
risk of bone fracture, it is of great clinical interest regarding how healthy patients’
responses to intermittent PTH administration as well as its discontinuation of PTH
administration. Therefore, based on clinical observations, we hypothesized that the
discontinuation of PTH administration would induce a substantial bone loss in both intact
and estrogen-deficient rats. We first investigated the skeletal responses to the
discontinuation of PTH administration in intact rats. Our approach using in vivo µCT
imaging allowed for the longitudinal examination of local changes in the trabecular bone
within a constant volume of interest (VOI). 4-5 month old intact female animals were
used due to the minimal bone growth that occurs at this age. As expected, 3-week PTH
treatment induced significant bone gain in intact animals. Surprisingly, there is no
adverse effect in intact animals after 9-week withdrawal of PTH. As shown in Figure 2-1,
similar consistency can be found for VEH and PTH-VEH groups in all microarchitecture
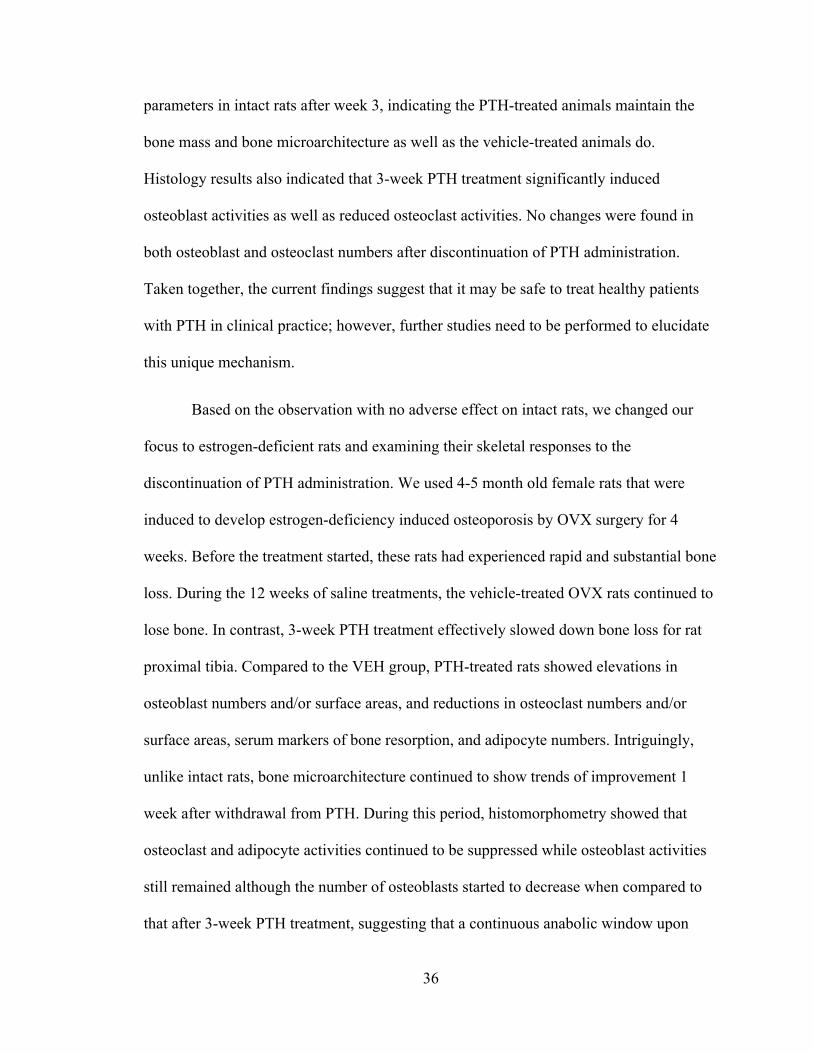
36
parameters in intact rats after week 3, indicating the PTH-treated animals maintain the
bone mass and bone microarchitecture as well as the vehicle-treated animals do.
Histology results also indicated that 3-week PTH treatment significantly induced
osteoblast activities as well as reduced osteoclast activities. No changes were found in
both osteoblast and osteoclast numbers after discontinuation of PTH administration.
Taken together, the current findings suggest that it may be safe to treat healthy patients
with PTH in clinical practice; however, further studies need to be performed to elucidate
this unique mechanism.
Based on the observation with no adverse effect on intact rats, we changed our
focus to estrogen-deficient rats and examining their skeletal responses to the
discontinuation of PTH administration. We used 4-5 month old female rats that were
induced to develop estrogen-deficiency induced osteoporosis by OVX surgery for 4
weeks. Before the treatment started, these rats had experienced rapid and substantial bone
loss. During the 12 weeks of saline treatments, the vehicle-treated OVX rats continued to
lose bone. In contrast, 3-week PTH treatment effectively slowed down bone loss for rat
proximal tibia. Compared to the VEH group, PTH-treated rats showed elevations in
osteoblast numbers and/or surface areas, and reductions in osteoclast numbers and/or
surface areas, serum markers of bone resorption, and adipocyte numbers. Intriguingly,
unlike intact rats, bone microarchitecture continued to show trends of improvement 1
week after withdrawal from PTH. During this period, histomorphometry showed that
osteoclast and adipocyte activities continued to be suppressed while osteoblast activities
still remained although the number of osteoblasts started to decrease when compared to
that after 3-week PTH treatment, suggesting that a continuous anabolic window upon
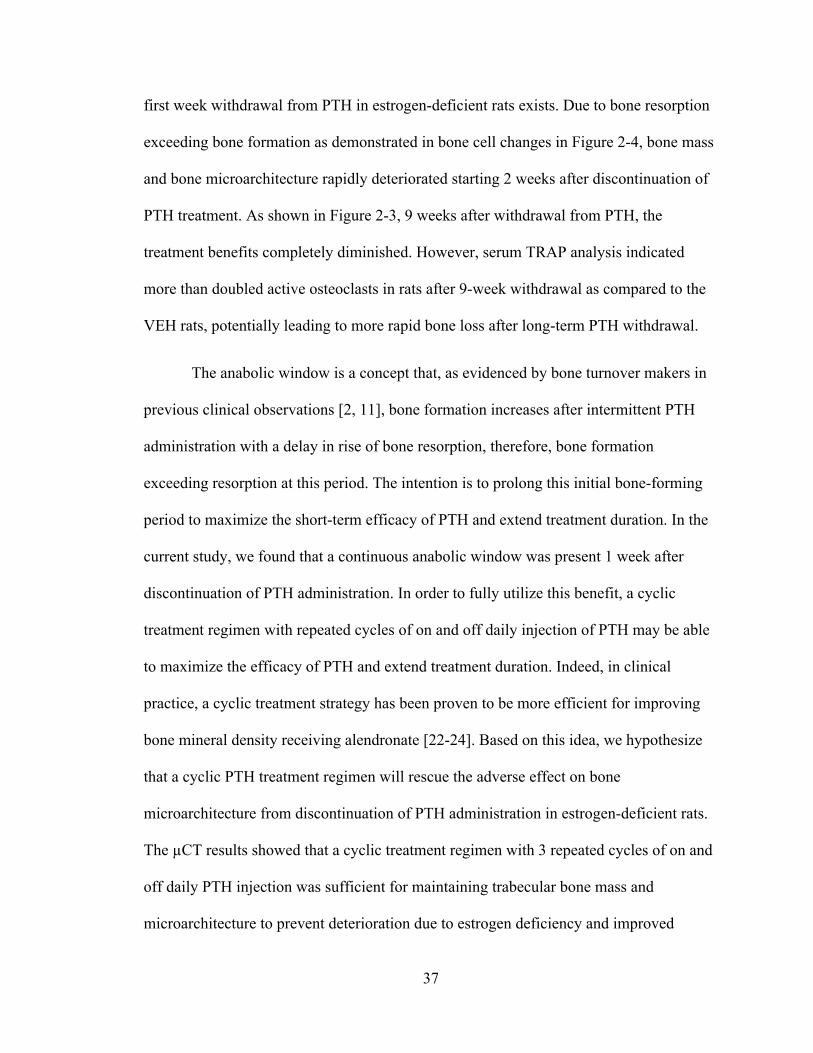
37
first week withdrawal from PTH in estrogen-deficient rats exists. Due to bone resorption
exceeding bone formation as demonstrated in bone cell changes in Figure 2-4, bone mass
and bone microarchitecture rapidly deteriorated starting 2 weeks after discontinuation of
PTH treatment. As shown in Figure 2-3, 9 weeks after withdrawal from PTH, the
treatment benefits completely diminished. However, serum TRAP analysis indicated
more than doubled active osteoclasts in rats after 9-week withdrawal as compared to the
VEH rats, potentially leading to more rapid bone loss after long-term PTH withdrawal.
The anabolic window is a concept that, as evidenced by bone turnover makers in
previous clinical observations [2, 11], bone formation increases after intermittent PTH
administration with a delay in rise of bone resorption, therefore, bone formation
exceeding resorption at this period. The intention is to prolong this initial bone-forming
period to maximize the short-term efficacy of PTH and extend treatment duration. In the
current study, we found that a continuous anabolic window was present 1 week after
discontinuation of PTH administration. In order to fully utilize this benefit, a cyclic
treatment regimen with repeated cycles of on and off daily injection of PTH may be able
to maximize the efficacy of PTH and extend treatment duration. Indeed, in clinical
practice, a cyclic treatment strategy has been proven to be more efficient for improving
bone mineral density receiving alendronate [22-24]. Based on this idea, we hypothesize
that a cyclic PTH treatment regimen will rescue the adverse effect on bone
microarchitecture from discontinuation of PTH administration in estrogen-deficient rats.
The µCT results showed that a cyclic treatment regimen with 3 repeated cycles of on and
off daily PTH injection was sufficient for maintaining trabecular bone mass and
microarchitecture to prevent deterioration due to estrogen deficiency and improved

38
trabecular thickness significantly in both tibial bone and vertebral bone. Additionally, the
cyclic treatment regimen significantly improved the whole bone and apparent level
mechanical properties, as indicated in peak load and energy to failure, in the lumbar
vertebra and femur to be comparable with the VEH rats. Taken together, these results
suggest that the cyclic treatment regimen can alleviate bone deterioration and extend the
treatment duration.
As discussed earlier, clinical studies observed bone formation increases after
intermittent PTH administration before bone resorption increases. However, our current
results showed that 3-week PTH treatment stimulated new bone formation on bone
surfaces with suppressed resorption activities in estrogen-deficient rats. Similar
observation was also reported in previous studies in the rat model. Liu and Kalu showed
that the increase in trabecular induced by PTH was associated with increased in
osteoblast number and decreased in osteoclast number of tibia in static bone
histomorphometry in the estrogen-deficient rat model [25]. Sato et al. indicated that 2
years of PTH treatment led to prominent osteoblasts but near absence of osteoclasts in
femora, tibia and vertebra in histological sections of an intact rat model [26]. Our
previous study in the estrogen-deficient rat model also demonstrated reduced bone
resorption activities in PTH animals when compared to the VEH rats in static bone
histomorphometry, serum resorption marker, and 3D in vivo bone dynamic
histomorphometry [27]. Still, the reason behind the discrepancy between the clinical
findings and rat model is not clear, which needs to be determined in future studies.
In addition to the observation of the continuous anabolic windows after early
withdrawal from PTH treatment, histomorphometry results showed a significant increase
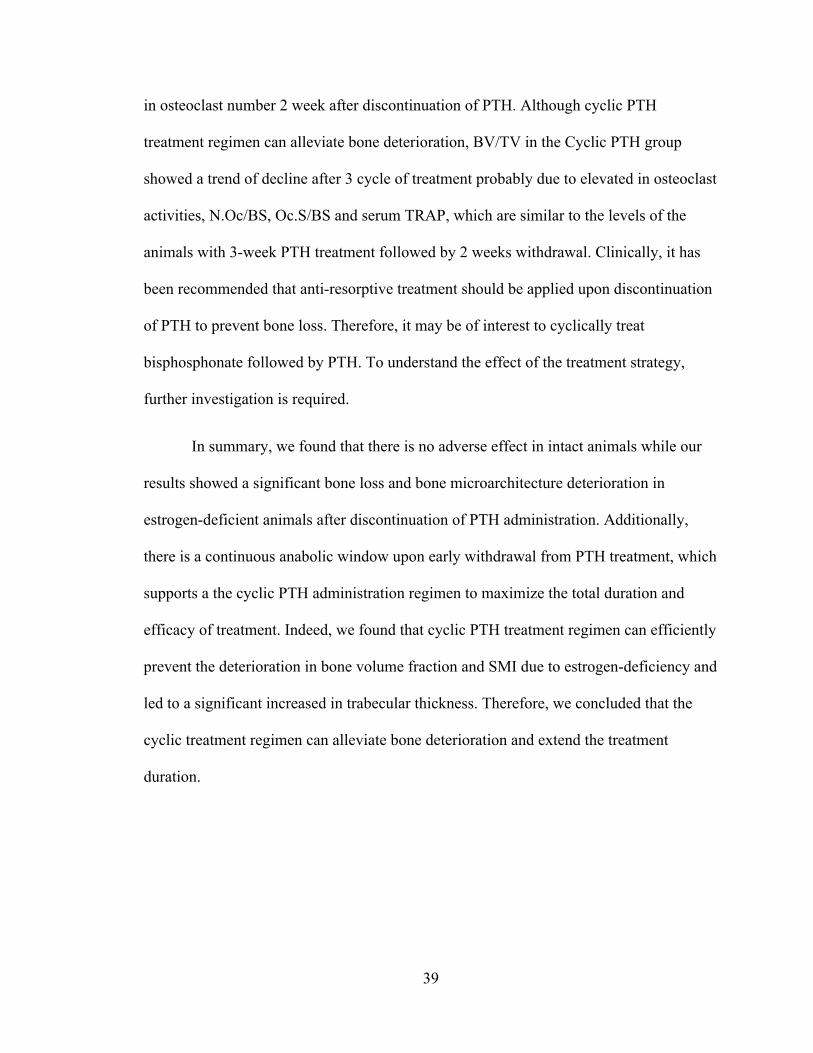
39
in osteoclast number 2 week after discontinuation of PTH. Although cyclic PTH
treatment regimen can alleviate bone deterioration, BV/TV in the Cyclic PTH group
showed a trend of decline after 3 cycle of treatment probably due to elevated in osteoclast
activities, N.Oc/BS, Oc.S/BS and serum TRAP, which are similar to the levels of the
animals with 3-week PTH treatment followed by 2 weeks withdrawal. Clinically, it has
been recommended that anti-resorptive treatment should be applied upon discontinuation
of PTH to prevent bone loss. Therefore, it may be of interest to cyclically treat
bisphosphonate followed by PTH. To understand the effect of the treatment strategy,
further investigation is required.
In summary, we found that there is no adverse effect in intact animals while our
results showed a significant bone loss and bone microarchitecture deterioration in
estrogen-deficient animals after discontinuation of PTH administration. Additionally,
there is a continuous anabolic window upon early withdrawal from PTH treatment, which
supports a the cyclic PTH administration regimen to maximize the total duration and
efficacy of treatment. Indeed, we found that cyclic PTH treatment regimen can efficiently
prevent the deterioration in bone volume fraction and SMI due to estrogen-deficiency and
led to a significant increased in trabecular thickness. Therefore, we concluded that the
cyclic treatment regimen can alleviate bone deterioration and extend the treatment
duration.

40
2.5 Figures
Figure 2-1. Intact Animals (A) Schematics of treatment strategies, (B) Representative 3D
renderings of the proximal tibia of a VEH and PTH rat at weeks 0, 3, 6, 9, 12. (C-H)
changes in tibial trabecular bone microstructure measurements in PTH and VEH groups.
# indicates a significant difference between PTH and VEH groups (p<0.05). + indicates a
significant difference between in VEH group between week 3 and week 12 (p<0.05). *
indicates a significant difference between in PTH-VEH group between week 3 and week
12 (p<0.05).
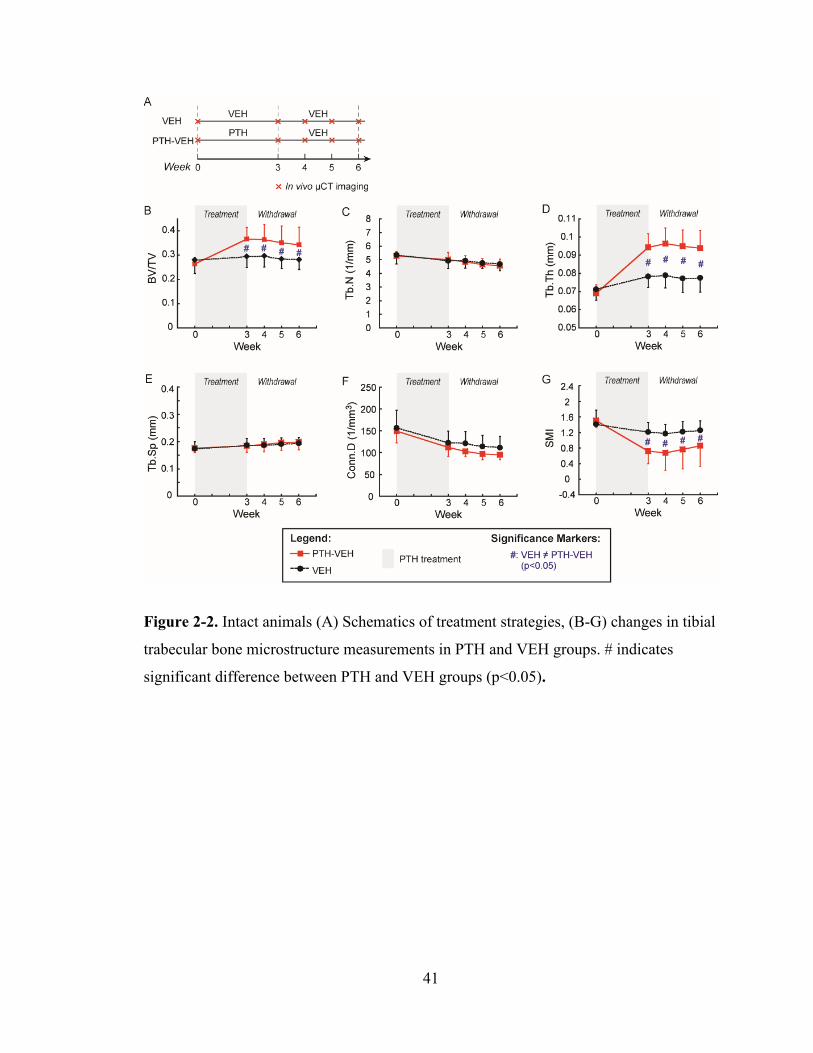
41
Figure 2-2. Intact animals (A) Schematics of treatment strategies, (B-G) changes in tibial
trabecular bone microstructure measurements in PTH and VEH groups. # indicates
significant difference between PTH and VEH groups (p<0.05).

42
Figure 2-3. Estrogen-deficient animals (A) Schematics of treatment strategies, (B)
Representative 3D renderings of the proximal tibia of a VEH and PTH rat at weeks -4, 0,
3, 6, 12. (C-H) changes in tibial trabecular bone microstructure measurements in PTH
and VEH groups. # indicates a significant difference between PTH and VEH groups
(p<0.05). + indicates a significant difference between in VEH group between week 3 and
week 12 (p<0.05). * indicates a significant difference between in PTH-VEH group
between week 3 and week 12 (p<0.05).

43

44
Figure 2-4. Estrogen-deficient animals (A-D) Osteoblasts (yellow arrows) and
osteoclasts (black arrows) were shown in Goldner’s Trichrome staining of trabecular
bone sections in OVX rats with 3-week VEH (V3) and PTH (P3) treatments, and 3-week
PTH treatment followed by 1 and 2 weeks withdrawal (P3V1 and P3V2). Adipocytes
were shown in H&E staining of trabecular bone sections in OVX rats at (E) V3, (F) P3,
(G) P3V1, and (H) P3V2. Histomorphometric measurements of (I) osteoblast number
(N.Ob/BS), (J) osteoblast surface (Ob.S/BS), (K) adipocyte number (Adi.N/Ma.Ar), (L)
osteoclast number (N.Oc/BS), (M) osteoclast surface (Oc.S/BS), (N) ELISA analysis of
serum concentration of bone resorption (TRAcP 5b) marker were measured for V3, P3,
P3V1, and P3V2. * indicates a significant difference between treatment groups (p<0.05).
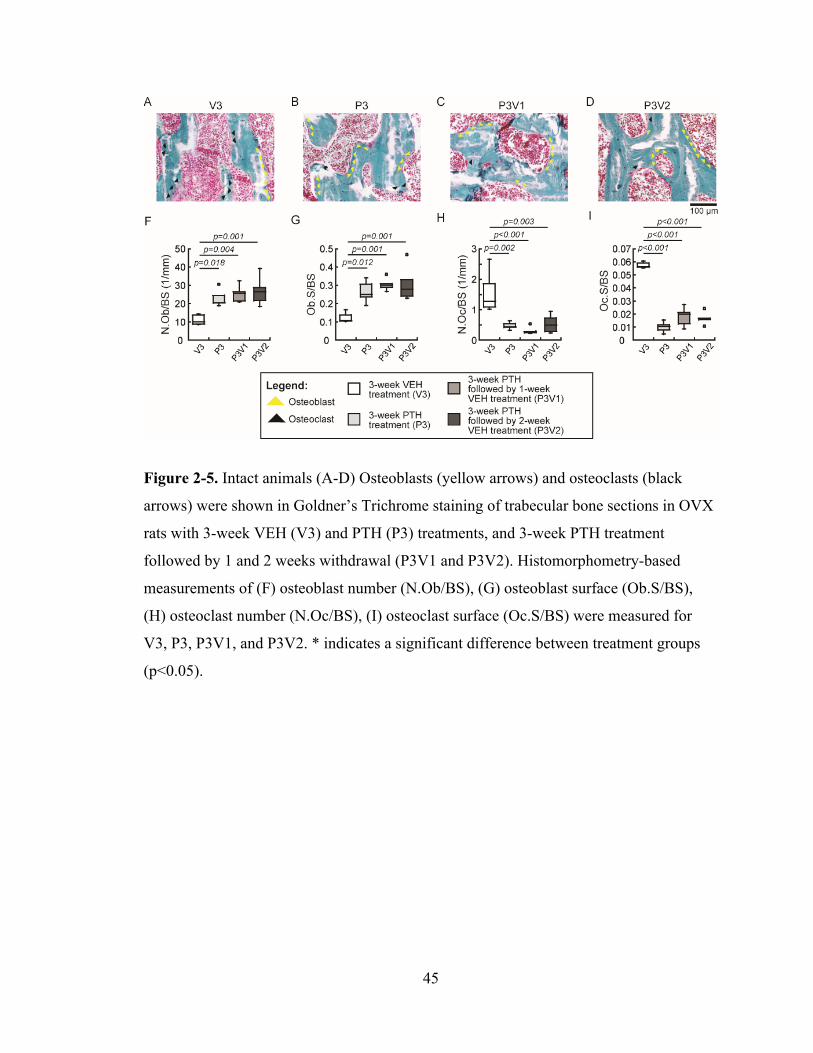
45
Figure 2-5. Intact animals (A-D) Osteoblasts (yellow arrows) and osteoclasts (black
arrows) were shown in Goldner’s Trichrome staining of trabecular bone sections in OVX
rats with 3-week VEH (V3) and PTH (P3) treatments, and 3-week PTH treatment
followed by 1 and 2 weeks withdrawal (P3V1 and P3V2). Histomorphometry-based
measurements of (F) osteoblast number (N.Ob/BS), (G) osteoblast surface (Ob.S/BS),
(H) osteoclast number (N.Oc/BS), (I) osteoclast surface (Oc.S/BS) were measured for
V3, P3, P3V1, and P3V2. * indicates a significant difference between treatment groups
(p<0.05).

46

47
Figure 2-6. Estrogen-deficient animals in cyclic treatment regimens (A) Schematics of
treatment strategies, (B) Representative 3D renderings of the proximal tibia of a VEH,
PTH-VEH, and Cyclic PTH rat at weeks 0 and 18. (C-H) changes in tibial trabecular
bone microstructure measurements in VEH, PTH-VEH, and Cyclic PTH groups. a
indicates a significant difference between Cyclic PTH and VEH groups (p<0.05). b
indicates a significant difference between PTH-VEH and VEH groups (p<0.05). c
indicates a significant difference between in Cyclic PTH and PTH-VEH groups (p<0.05).
+ indicates a significant difference from week 0 in VEH group (p<0.05). # indicates a
significant difference from week 0 in PTH-VEH group (p<0.05). * indicates a significant
difference from week 0 in Cyclic PTH group (p<0.05).
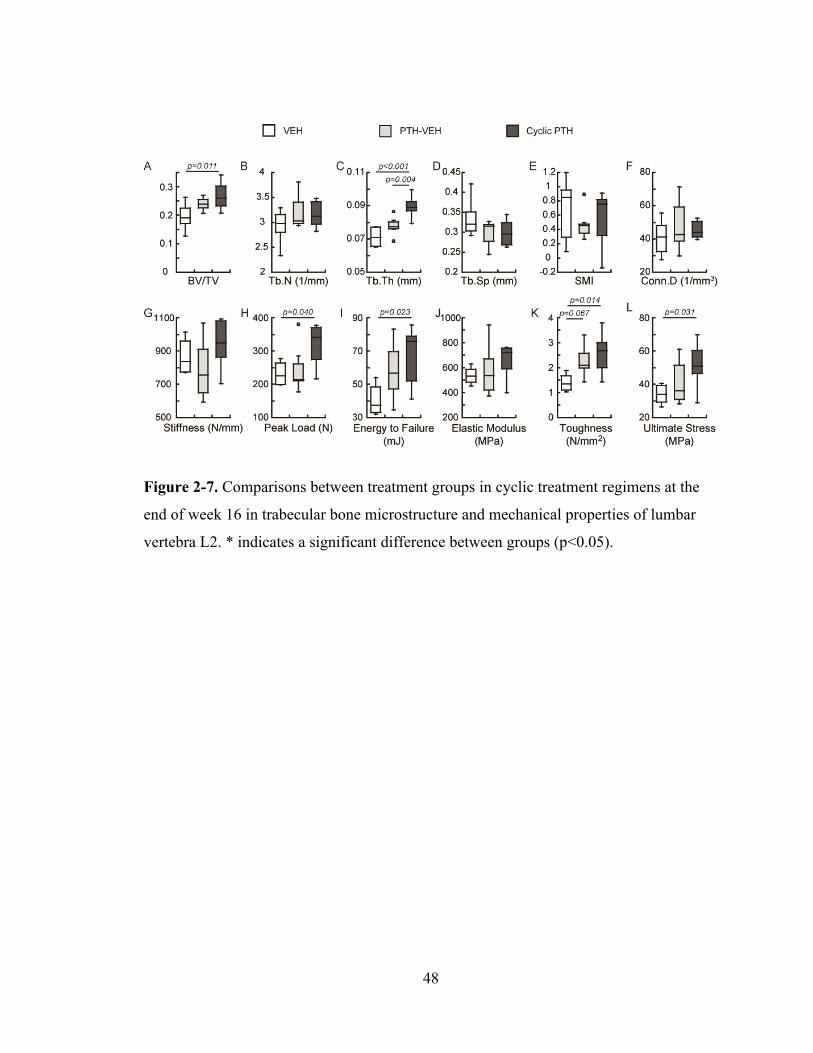
48
Figure 2-7. Comparisons between treatment groups in cyclic treatment regimens at the
end of week 16 in trabecular bone microstructure and mechanical properties of lumbar
vertebra L2. * indicates a significant difference between groups (p<0.05).

49
Figure 2-8. Comparisons between treatment groups in cyclic treatment regimens at the
end of week 16 in cortical bone microstructure and mechanical properties of femur. *
indicates a significant difference between groups (p<0.05).
50
2.6 References
1. Nih Consensus Development Panel on Osteoporosis Prevention, D. and Therapy, Osteoporosis prevention, diagnosis, and therapy. JAMA, 2001. 285(6): p. 785‐95.
2. Watts, N.B. and J.P. Bilezikian, Advances in target‐specific therapy for osteoporosis. J Clin Endocrinol Metab, 2014. 99(4): p. 1149‐51.
3. Berg, C., K. Neumeyer, and P. Kirkpatrick, Teriparatide. Nat Rev Drug Discov, 2003. 2(4): p. 257‐8.
4. FDA Drug Approvals List [online] <https://www.accessdata.fda.gov/drugsatfda_docs/nda/2002/21‐318_Forteo.cfm>. 2002.
5. Jilka, R.L., Molecular and cellular mechanisms of the anabolic effect of intermittent PTH. Bone, 2007. 40(6): p. 1434‐46.
6. Compston, J.E., Skeletal actions of intermittent parathyroid hormone: effects on bone remodelling and structure. Bone, 2007. 40(6): p. 1447‐52.
7. Qin, L., L.J. Raggatt, and N.C. Partridge, Parathyroid hormone: a double‐edged sword for bone metabolism. Trends Endocrinol Metab, 2004. 15(2): p. 60‐5.
8. Vahle, J.L., et al., Bone neoplasms in F344 rats given teriparatide [rhPTH(1‐34)] are dependent on duration of treatment and dose. Toxicol Pathol, 2004. 32(4): p. 426‐38.
9. Vahle, J.L., et al., Skeletal changes in rats given daily subcutaneous injections of recombinant human parathyroid hormone (1‐34) for 2 years and relevance to human safety. Toxicol Pathol, 2002. 30(3): p. 312‐21.
10. Jolette, J., et al., Defining a noncarcinogenic dose of recombinant human parathyroid hormone 1‐84 in a 2‐year study in Fischer 344 rats. Toxicol Pathol, 2006. 34(7): p. 929‐40.
11. Canalis, E., A. Giustina, and J.P. Bilezikian, Mechanisms of anabolic therapies for osteoporosis. N Engl J Med, 2007. 357(9): p. 905‐16.
12. Black, D.M., et al., One year of alendronate after one year of parathyroid hormone (1‐84) for osteoporosis. N Engl J Med, 2005. 353(6): p. 555‐65.
13. Cohen, A., et al., Bone Density After Teriparatide Discontinuation in Premenopausal Idiopathic Osteoporosis. J Clin Endocrinol Metab, 2015. 100(11): p. 4208‐14.
14. Leder, B.Z., et al., Effects of teriparatide treatment and discontinuation in postmenopausal women and eugonadal men with osteoporosis. J Clin Endocrinol Metab, 2009. 94(8): p. 2915‐21.
15. Altman, A.R., et al., A closer look at the immediate trabecula response to combined parathyroid hormone and alendronate treatment. Bone, 2014. 61: p. 149‐57.
16. Bach‐Gansmo, F.L., et al., Calcified cartilage islands in rat cortical bone. Calcif Tissue Int, 2013. 92(4): p. 330‐8.
17. Lan, S., et al., 3D image registration is critical to ensure accurate detection of longitudinal changes in trabecular bone density, microstructure, and stiffness measurements in rat tibiae by in vivo microcomputed tomography (muCT). Bone, 2013. 56(1): p. 83‐90.
18. Parfitt, A.M., et al., Bone histomorphometry: standardization of nomenclature, symbols, and units. Report of the ASBMR Histomorphometry Nomenclature Committee. J Bone Miner Res, 1987. 2(6): p. 595‐610.
19. Dempster, D.W., et al., Standardized nomenclature, symbols, and units for bone histomorphometry: a 2012 update of the report of the ASBMR Histomorphometry Nomenclature Committee. J Bone Miner Res, 2013. 28(1): p. 2‐17.
51
20. Pendleton, M.M., et al., High‐precision method for cyclic loading of small‐animal vertebrae to assess bone quality. Bone Rep, 2018. 9: p. 165‐172.
21. Schriefer, J.L., et al., A comparison of mechanical properties derived from multiple skeletal sites in mice. J Biomech, 2005. 38(3): p. 467‐75.
22. Cosman, F., et al., Daily and cyclic parathyroid hormone in women receiving alendronate. New England Journal of Medicine, 2005. 353(6): p. 566‐575.
23. Cosman, F., et al., Administration of teriparatide for four years cyclically compared to two years daily in treatment Naive and alendronate treated women. Bone, 2019. 120: p. 246‐253.
24. Cosman, F., et al., Daily or Cyclical Teriparatide Treatment in Women With Osteoporosis on no Prior Therapy and Women on Alendronate. J Clin Endocrinol Metab, 2015. 100(7): p. 2769‐76.
25. Liu, C.C. and D.N. Kalu, Human parathyroid hormone‐(1‐34) prevents bone loss and augments bone formation in sexually mature ovariectomized rats. J Bone Miner Res, 1990. 5(9): p. 973‐82.
26. Sato, M., et al., Abnormal bone architecture and biomechanical properties with near‐lifetime treatment of rats with PTH. Endocrinology, 2002. 143(9): p. 3230‐42.
27. Altman‐Singles, A.R., et al., Intermittent Parathyroid Hormone After Prolonged Alendronate Treatment Induces Substantial New Bone Formation and Increases Bone Tissue Heterogeneity in Ovariectomized Rats. J Bone Miner Res, 2017. 32(8): p. 1703‐1715.
52
CHAPTER 3
Cyclic and Alternating Parathyroid Hormone and Alendronate Treatment
Regimens Further Improve Bone Microarchitecture and Strength Beyond Daily and
Cyclic Parathyroid Hormone Regimens
3.1 Introduction
Teriparatide, recombinant human parathyroid hormone (rhPTH) 1-34, is the first
FDA-approved anabolic agent for osteoporosis when administered intermittently. This
anabolic agent is approved for the treatment of osteoporosis in postmenopausal women
and in men at high risk of bone fracture [1, 2]. Unlike the anti-resorptive agents which
suppress bone resorption through inhibition of osteoclast activities, its mechanism of
action is to promote bone remodeling and to shift the balance of remodeling towards
increased bone formation [3-5], thereby rapidly increasing bone mass and reducing the
risk of fractures. In clinical practice, the recommended duration of PTH treatment is 18-
24 months. Despite showing the potent effects of promoting new bone formation, the
anabolic effect of PTH treatment tends to reach a plateau over time [6-8] and the
increased bone mineral density (BMD) in patients rapidly declines after discontinuation
of PTH administration [6, 9, 10]. Additionally, the cost of PTH is much higher than that
of anti-resorptive agents, e.g. Bisphosphonates. However, since osteoporosis in
postmenopausal women and elderly men is a life-long chronic condition, alternate
treatment strategies for a more sustained, long-term therapeutic approach are of great
clinical interest.
53
In order to enhance the PTH-induced bone formation, limit PTH-induced bone
resorption, and reduce the cost of PTH treatment, a cyclic PTH regimen with or without
antiresorptive agents which has been reported in several clinical trials [11-15] and in the
murine model was proposed [16, 17]. The efficacy of the cyclic treatment regimen was
compared to that of the standard daily treatment regimens. In humans, despite a lower
PTH dosage, the cyclic PTH regimen consisting of repeated cycles of 3-month on and off
daily PTH injection (20 or 25 μg/day) proved to be as effective as the standard daily
injection of PTH on BMD in spine, femur and radius with prior and ongoing
bisphosphonate alendronate (ALN) [12-14]. In mice, a repeated cyclic regimen consisting
of one week of daily PTH injection (40 μg/kg/day) and one week off produced similar
anabolic effects as a daily regimen. This is most notably depicted by the similarity in
improved trabecular and cortical bone microarchitecture and cellular activities in the
vertebra but not in the femur [16, 17]. Moreover, the efficacy of the cyclic PTH treatment
regimen alone was also compared to that of the cyclic PTH and sequential antiresorptive
regimens. The cyclic treatment regimen of PTH and antiresorptive agents, either
calcitonin [15, 18] or denosumab [11], may suggest a beneficial effect in the lumbar spine
or cortical bone. However, it is still not clear how bone quality and bone strength changes
relative to the cyclic treatment regimens with or without antiresorptive agents. Although
clinical trials and the murine model showed improvements with use of the cyclic
treatment regimens, it would also be desirable to explore a model in rats that can monitor
the temporal and spatial changes in bone in response to treatment. Additionally, using a
rat model may allow for increased access to bone strength, especially of the vertebrae,

54
due to the technical difficulties presented by mouse models, e.g. small specimen size, and
limited human cadaver samples.
Our previous study discovered a continuous anabolic window of bone gain upon
early withdrawal of PTH treatment, which was associated with elevation of osteoblast
activity and suppression of osteoclast activity in the rat tibia (Figure 3-1). Based on this
observation, we hypothesize that a repeated cyclic PTH treatment regimen, switching
between weeks of daily PTH injection and saline injection would best utilize the anabolic
window upon withdrawal. This would further result in extended treatment duration and
significant improvement in bone mass, bone microarchitecture, and mechanical
properties. Moreover, histomorphometic analyses of the rat tibial bone indicated an
increase in osteoclast activity followed by the anabolic windows (Figure 3-1C). Based on
this phenomenon, we further hypothesized that incorporation of an anti-resorptive
treatment during the period of the cyclic regimen without PTH may further improve the
treatment efficacy including bone mass, bone microarchitecture, and mechanical and
material properties. According to the observations of the bone microarchitecture and bone
cell activity (Figure 3-1) as well as bone resorption marker, tartrate-resistant acid
phosphatase (TRAcP 5b) (data not shown), a cyclic regimen with repeated cycles of a 3-
week on and off daily PTH injection was chosen in this study. Therefore, the objective of
this study was to investigate the effect of cyclic and alternating treatment regimens of
daily injection of PTH and ALN on bone microarchitecture and mechanical competence
in estrogen-deficient rats. We first investigated the skeletal responses to the cyclic and
alternating treatment regimens of PTH and ALN at the proximal tibia in estrogen-
deficient rats using an advanced in vivo µCT imaging and image analysis technique.
55
After sacrifice, we evaluated the mechanical properties using a 4-point bending technique
on the femur and an axial compression test on lumbar vertebrae L2, respectively, and
determined material properties of lumbar vertebrae L1 using nanoindenatation.
3.2 Materials and Methods
3.2.1 Animals and treatment plans: skeletal effects by cyclic treatment regimens in
estrogen-deficient rats
All experiments were approved by the University of Pennsylvania's Institutional
Animal Care and Use Committee. A total of 36 female Sprague Dawley rats were
purchased (Charles River Laboratories, Willmington, MA) and received a bilateral
ovariectomy (OVX) surgery at 16-17 weeks of age. The study began after a 4-week
development of osteoporosis in the OVX rats. Five treatment regimens were examined in
OVX rats: (1) a vehicle (VEH) group (n=6) receiving subcutaneous saline injections
(150μL/day, 5 times per week) for 18 weeks, (2) a PTH-VEH group (n=7) receiving
subcutaneous injections of PTH (40 µg/kg/day, 5 times per week) for 9 weeks followed
by saline for 9 weeks, (3) a Cyclic PTH-VEH group (n=7) receiving 3 weeks of PTH
followed by 3 weeks of saline injections, repeated for 3 cycles, (4) a Cyclic PTH-ALN
group (n=8) receiving 3 weeks of PTH followed by 3 weeks of alendronate injections
(ALN, 28 µg/kg/day, 2 times per week), repeat for 3 cycles, and (5) a Cyclic ALN-PTH
group (n=8) receiving 3 weeks of PTH followed by 3 weeks of alendronate injections,
repeated for 3 cycles. Rats were randomly assigned to different groups, housed in
standard conditions in groups of three rats per cage. Experiments were performed
unblinded. Rats were randomly assigned to different groups and housed in standard
conditions in groups of three rats per cage. Experiments were performed unblinded.
56
3.2.2 In vivo µCT scans and analysis
The right proximal tibiae of all estrogen-deficient rats were scanned by μCT at
week -4 (before OVX surgery), then at week 0, 3, 6, 9, 12, 15, and 18 (Figure 3-2A). As
described in [19] and [20], rats were anesthetized (4.0/2% isoflurane), and the right leg of
each rat was inserted into a custom holder to ensure minimal movement during the scan.
A 4-mm region of the tibia, distal to the proximal growth plate, was scanned at 10.5 μm
voxel size, 55 kVp energy, 145 µA intensity, 200 ms integration time, and 1000
projections, using a 0.5mm Al filter and a standard, manufacturer-provided beam-
hardening correction algorithm, resulting in a total scan time of about 20 minutes and
approximate radiation dose of 0.639 Gy per scan.
A landmark-initialized, mutual-information-based registration toolkit of an open
source software (National Library of Medicine Insight Segmentation and Registration
Toolkit, USA) was used to register the baseline and follow-up scans [21-23]. The volume
of interest (VOI) chosen was approximately 2.3 mm distal from the growth plate and
consisted of 200 slices corresponding to a 2.1 mm thick section of the trabecular
compartment in the last scan (Week 18). Transformation matrices from the registrations
were then applied to the VOI in order to locate the corresponding volume of trabecular
bone in images from previous time points. Representative baseline and registered follow-
up images of each treatment group are shown in Figure 3-1B.
Bone voxels of each registered image were segmented from the bone marrow and
background using Gaussian filtering (sigma=1.2 and support=2.0) and a global threshold
corresponding to 564.8 mgHA/cm3. Bone microstructural parameters including bone
volume fraction (BV/TV), trabecular thickness (Tb.Th), trabecular separation (Tb.Sp),
57
trabecular number (Tb.N), structure model index (SMI), and connectivity density
(Conn.D), were evaluated for registered VOIs of weeks -4, 0, 3, 6, 9, 12, 15 and 18 in
estrogen-deficient rats for all groups.
3.2.3 Ex vivo µCT Scans and Uniaxial Compression Tests for the Lumbar Vertebra L2
After euthanasia, the second lumbar vertebra (L2) was harvested and scanned by
µCT (vivaCT40, Scanco Medical AG, Brüttisellen, Switzerland) at 10.5 µm isotropic
resolution. A 2.1 mm-thick trabecular VOI, which occupied the center 1/2 of the vertebral
body, was identified and subjected to analysis as described previously [24]. Following the
μCT imaging analyses, the vertebral body was cut at both ends of the growth plate using
a low speed diamond saw (IsoMet, Buehler, Lake Bluff, IL) with water irrigation. A ~4-
mm specimen with two paralleled endplates was then obtained for the uniaxial
compression test. The uniaxial compression test was performed in a displacement control
with a speed of 0.03 mm/s using an Instron 5542 universal testing system (Instron,
Norwood, MA). The specimen was compressed between two concentric cylindrical plates
under room temperature. The load-displacement curve generated from mechanical testing
was used to calculate stiffness, peak load, Young's modulus, ultimate stress, energy to
failure, and post-yield energy to failure.
3.2.4 Cortical bone analysis and 4-point bending test of femoral shaft
The right femur was dissected after euthanasia. A 1.2-mm region of femur
midshaft was scanned using μCT (µCT 35, Scanco Medical AG, Brüttisellen,
Switzerland) at 6 μm image voxel size. Standard cortical parameters including cortical
thickness (Ct.Th), cortical porosity (Ct.Po), cortical tissue mineral density (Ct.TMD),

58
polar moment of inertia (pMOI), periosteal perimeter (Ct.Pe.Pm), and endosteal
perimeter (Ct.En.Pm) were evaluated for a 0.3 mm thick region in the center of the
midshaft. A destructive 4-point bending test was then performed at the midshaft region
with a displacement rate of 1.8 mm/min with the outer supports being 26.56 mm apart
and the inner supports being 8.84 mm apart (Instron 5542, Norwood, MA). The load-
displacement curve generated from mechanical testing was used to calculate stiffness,
peak load, Young's modulus, energy to failure, and post-yield energy to failure [25].
3.2.5 Nanoindentation tests for lumbar vertebra L1
L1 was sectioned along the transverse plane by a low-speed diamond saw under
water irrigation. The dissected surface of specimens was polished using silicon carbide
abrasive papers with decreasing grit sizes (1200, 2400, and 4000 grits) and Al2O3 pastes
(1 and 0.3mm) on soft polishing cloths in wet conditions. Sonication of the specimen in
deionized water followed to remove debris. Then, the unpolished surface of the specimen
was glued onto a polycarbonate holder with a fluid drainage system in a nanoindenter
(Nano-XP; MTS, Oakridge, TN, USA) as described in previous studies [26-28]. All
specimens were hydrated during nanoindentation. Central (C, center of a trabecula) and
surface (S, ~10mm from the edge of a trabecula) regions of individual trabecular bone
structures were identified using a light microscope incorporated within the nanoindenter,
and 5-10 indents were made for those regions of each specimen using a pyramidal
Berkovich tip of the nanoindenter. An indentation load rate corresponding to a
displacement rate of 10 nm/s was applied up to a 500-nm indentation depth. Following
the 30-s holding period, the indenter was unloaded with the same rate. Using the slope of
the unloading force-displacement curve, nanoindentation elastic moduli for the inner

59
trabecular region (Ec) and the surface (Es) were measured using the Oliver-Pharr method
[29]. Coefficient of variance was calculated for each treatment group to examine the
heterogeneity of elastic modulus (Ecv) and hardness (Hcv), respectively.
3.2.6 Statistical Analysis
All statistical analyses were performed using NCSS 7.1.14 (NCSS, LLC,
Kaysville, UT). Mean ± standard deviation (SD) are given for all the results. For
longitudinal µCT image-based measurements, a two-way, repeated measures ANOVA
was used to compare treatment groups over time. All comparisons were adjusted for
baseline measures. In the presence of statistically significant main effects of time,
treatment, and treatment*time interactions, post-hoc comparisons of between-group
differences at each time point and within-group differences between different time points
were made using a Bonferroni correction. A one-way ANOVA with a Tukey HSD post
hoc test was performed to determine the treatment effect on vertebral trabecular bone,
femoral cortical bone, and mechanical properties. For all analyses, a two-tailed p<0.05
was considered to indicate statistical significance.
3.3 Results
3.3.1 Rescue bone deterioration in trabecular microarchitecture in the Cyclic Treatment
Regimen
During the 4-week osteopenia development, all bone microstructural parameters
underwent a dramatic deterioration. Bone loss continued in the VEH group for 18 weeks.
This tibial bone loss was associated with 61%, 58% and 88% decreases in BV/TV, Tb.N
and Conn.D, respectively, and 26% and 147% increase in Tb.Th and Tb.Sp, respectively
60
(p<0.01, Figure 3-2CDEFH). In the PTH-VEH group, 9-week PTH treatment led to a
100% and 92% increase in BV/TV and Tb.Th, respectively, a 19% and 31% decrease in
Tb.N and Conn.D, respectively, and a decrease of 1.35 in SMI (p<0.01, Figure 3-
2CDEGH). After 9 weeks of PTH discontinuation, BV/TV, Tb.Th, Tb.N and Conn.D
underwent a dramatic, 305%, 151%, 158% and 250% reduction, respectively, Tb.Sp
underwent a substantial 54% increase, and SMI underwent an increase of 1.21 in SMI
(p<0.01, Figure 3-2C-H). By the end of week 18, there were no difference between the
PTH-VEH and VEH groups in BV/TV, Tb.N, Tb.Th, Tb.Sp and Conn.D (Figure 3-
2CDEFH). In contrast, in the Cyclic PTH-VEH group, the first cycle of 3-week on and 3-
week off PTH prevented reduction in BV/TV and led to a 51% increase in Tb.Th, 124%
and 151% decrease in Tb.N and Conn.D, and a decrease of 0.55 in SMI. During the 2nd
and 3rd cycles, BV/TV and SMI stabilized, Tb.Th and Tb.Sp continued to increase, and
Tb.N and Conn.D continued to decrease. At week 18, BV/TV and Tb.Th in Cyclic PTH-
VEH animals were significantly greater and SMI was significantly lower than both PTH-
VEH and VEH animals (p<0.05, Figure 3-2CEG). Tb.N and Conn.D in the Cyclic PTH-
VEH group were significantly greater than the VEH group (p<0.05, Figure 3-2DH).
Regarding the Cyclic PTH-ALN group, the first 3-week of PTH treatment led to a 55%
and 50% increase in BV/TV and Tb.Th, respectively, a decrease of 0.56 in SMI (p<0.05,
Figure 3-2CEG). The treatment benefit was maintained by treatment of ALN during the
first cycle. BV/TV, Tb.Th and SMI continued to improve throughout the 2nd and 3rd
cycles (p<0.05, Figure 3-2CEG). At the end of the 3 cycles of treatment BV/TV and
Tb.Th increased by 120% and 94%, respectively, and SMI decrease by 0.73 when
compared to week 0 (p<0.05, Figure 3-2CEG). In terms of the Cyclic ALN-PTH group,
61
BV/TV, Tb.Th, Tb.Sp and SMI were maintained during the first 3 weeks of ALN
treatment (p<0.05, Figure 3-2CEFG). BV/TV and Tb.Th started to increase and SMI
started to decrease after PTH treatment. BV/TV and Tb.Th increased by 91% and 70% ,
respectively, and SMI decreased by 0.57 during the 3 cycles of treatment (p<0.05, Figure
3-2CEG). At week 18, the treatment benefit of PTH was further improved in both Cyclic
PTH-ALN and Cyclic ALN-PTH groups in BV/TV, Tb.N, Tb.Sp, SMI and Conn.D when
compared to the Cyclic PTH-VEH group (p<0.05, Figure 3-2CDFGH). Moreover, the
Cyclic PTH-ALN group results in a thicker trabecular bone when compared to the Cyclic
PTH-VEH and Cyclic ALN-PTH groups (p<0.05, Figure 3-2E).
3.3.2 Improvements in the bone microarchitecture and mechanical competence in lumbar
vertebrae L2 in Cyclic and alternating PTH and ALN groups
At the end of week 18, BV/TV of the lumbar vertebra L2 of the Cyclic PTH-VEH
group was 38% greater than that of the VEH group (Figure 3-3A). Additionally, Tb.Th of
the lumbar vertebra L2 of the Cyclic PTH-VEH group was 26% and 16% greater than
that of the VEH and PTH-VEH groups, respectively (Figure 3-3C). No difference was
found in any trabecular bone microarchitecture parameters of the lumbar vertebra L2
between the VEH and PTH-VEH groups (Figure 3-3A-F), and no difference was found in
Tb.N, Tb.Sp, SMI and Conn.D of the lumbar vertebra L2 between the PTH-VEH group
and the Cyclic PTH-VEH group (Figure 3-3BDEF). Moreover, both Cyclic PTH-ALN
and Cyclic ALN-PTH treatments led to greater BV/TV, Tb.Th, and plate-likeness
(indicated by reduction in SMI), and less Tb.Sp than the VEH, PTH-VEH and Cyclic
PTH-VEH groups (Figure 3-3ACE).
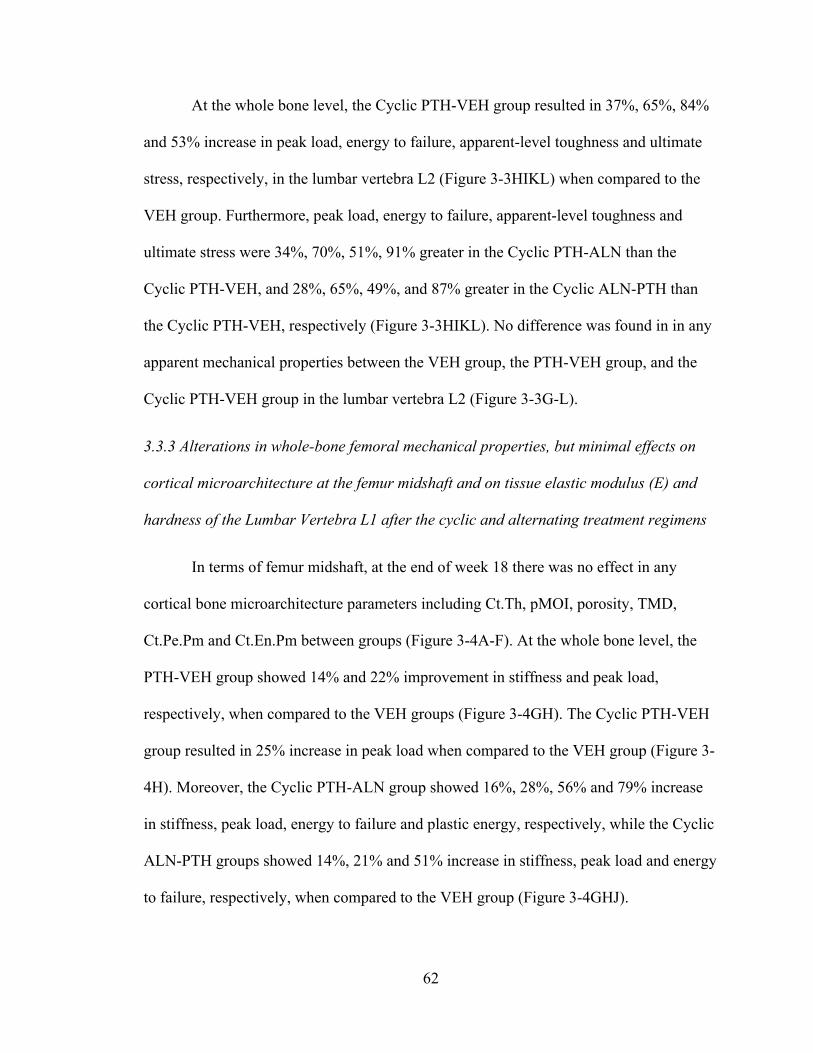
62
At the whole bone level, the Cyclic PTH-VEH group resulted in 37%, 65%, 84%
and 53% increase in peak load, energy to failure, apparent-level toughness and ultimate
stress, respectively, in the lumbar vertebra L2 (Figure 3-3HIKL) when compared to the
VEH group. Furthermore, peak load, energy to failure, apparent-level toughness and
ultimate stress were 34%, 70%, 51%, 91% greater in the Cyclic PTH-ALN than the
Cyclic PTH-VEH, and 28%, 65%, 49%, and 87% greater in the Cyclic ALN-PTH than
the Cyclic PTH-VEH, respectively (Figure 3-3HIKL). No difference was found in in any
apparent mechanical properties between the VEH group, the PTH-VEH group, and the
Cyclic PTH-VEH group in the lumbar vertebra L2 (Figure 3-3G-L).
3.3.3 Alterations in whole-bone femoral mechanical properties, but minimal effects on
cortical microarchitecture at the femur midshaft and on tissue elastic modulus (E) and
hardness of the Lumbar Vertebra L1 after the cyclic and alternating treatment regimens
In terms of femur midshaft, at the end of week 18 there was no effect in any
cortical bone microarchitecture parameters including Ct.Th, pMOI, porosity, TMD,
Ct.Pe.Pm and Ct.En.Pm between groups (Figure 3-4A-F). At the whole bone level, the
PTH-VEH group showed 14% and 22% improvement in stiffness and peak load,
respectively, when compared to the VEH groups (Figure 3-4GH). The Cyclic PTH-VEH
group resulted in 25% increase in peak load when compared to the VEH group (Figure 3-
4H). Moreover, the Cyclic PTH-ALN group showed 16%, 28%, 56% and 79% increase
in stiffness, peak load, energy to failure and plastic energy, respectively, while the Cyclic
ALN-PTH groups showed 14%, 21% and 51% increase in stiffness, peak load and energy
to failure, respectively, when compared to the VEH group (Figure 3-4GHJ).
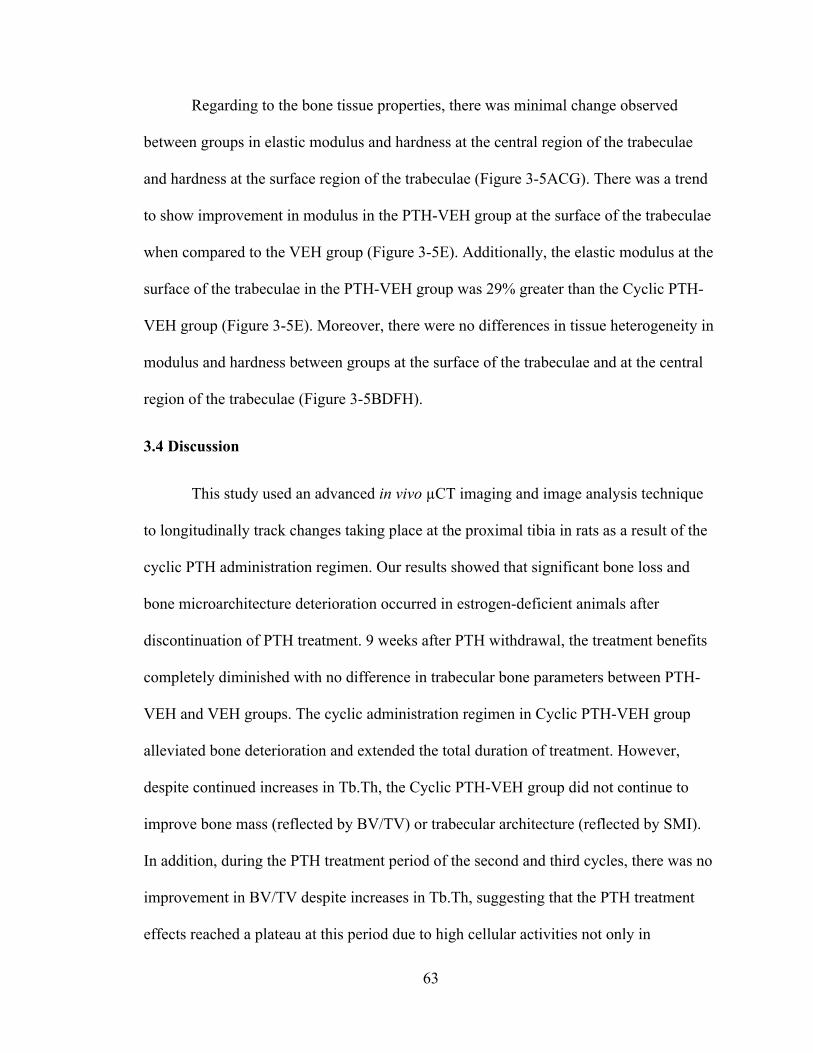
63
Regarding to the bone tissue properties, there was minimal change observed
between groups in elastic modulus and hardness at the central region of the trabeculae
and hardness at the surface region of the trabeculae (Figure 3-5ACG). There was a trend
to show improvement in modulus in the PTH-VEH group at the surface of the trabeculae
when compared to the VEH group (Figure 3-5E). Additionally, the elastic modulus at the
surface of the trabeculae in the PTH-VEH group was 29% greater than the Cyclic PTH-
VEH group (Figure 3-5E). Moreover, there were no differences in tissue heterogeneity in
modulus and hardness between groups at the surface of the trabeculae and at the central
region of the trabeculae (Figure 3-5BDFH).
3.4 Discussion
This study used an advanced in vivo µCT imaging and image analysis technique
to longitudinally track changes taking place at the proximal tibia in rats as a result of the
cyclic PTH administration regimen. Our results showed that significant bone loss and
bone microarchitecture deterioration occurred in estrogen-deficient animals after
discontinuation of PTH treatment. 9 weeks after PTH withdrawal, the treatment benefits
completely diminished with no difference in trabecular bone parameters between PTH-
VEH and VEH groups. The cyclic administration regimen in Cyclic PTH-VEH group
alleviated bone deterioration and extended the total duration of treatment. However,
despite continued increases in Tb.Th, the Cyclic PTH-VEH group did not continue to
improve bone mass (reflected by BV/TV) or trabecular architecture (reflected by SMI).
In addition, during the PTH treatment period of the second and third cycles, there was no
improvement in BV/TV despite increases in Tb.Th, suggesting that the PTH treatment
effects reached a plateau at this period due to high cellular activities not only in

64
osteoblasts, but also in osteoclasts. In order to further improve PTH treatment benefits,
ALN was used during the off PTH period to inhibit osteoclast activities. Our results
indicated significant improvement in bone microarchitecture and bone strength by both
Cyclic PTH-ALN and ALN-PTH regimens when compared to the Cyclic PTH-VEH at
the tibia and lumbar vertebrae L2. It was also shown that there was no influence on bone
microarchitecture and bone strength by treatment sequence of Cyclic PTH-ALN and
Cyclic ALN-PTH, except for effect on trabecular thickness. The current findings suggest
that the alternating cyclic PTH and ALN treatment regimens should be considered as a
viable treatment option for osteoporosis.
We proposed the cyclic PTH administration regimen according to the findings in
bone microarchitecture and bone cells activities in a rat model in our previous study: (1) a
continuous anabolic window of bone gain was found upon early withdrawal of PTH
treatment in the tibial bone (Figure 3-1A), and (2) osteoblast activity was elevated
(Figure 3-1B) while osteoclast activity was suppressed (Figure 3-1C) during this period.
On the other hand, the cyclic administration regimen in previous clinical and murine
studies [11-18, 30] was proposed based on the observations of (1) modeling-based bone
formation, i.e. bone formation without prior bone resorption during the first few weeks of
daily PTH administration, (2) an anabolic window, i.e. elevation of bone resorption
markers about 6 months after early stimulation of bone formation of daily PTH
administration, and (3) a plateau of BMD in daily PTH treatment over time. Despite the
differences in the initial aims of the previous clinical and murine studies, our findings led
to the same treatment strategy, i.e. the cyclic PTH administration regimen.
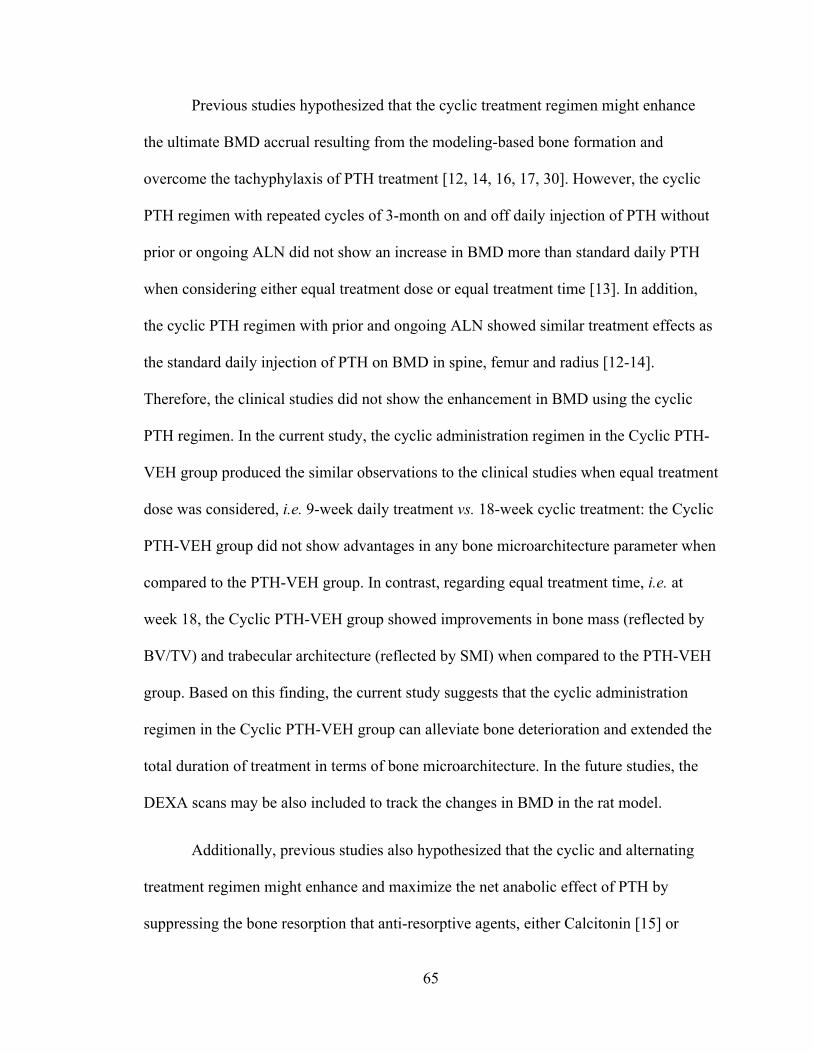
65
Previous studies hypothesized that the cyclic treatment regimen might enhance
the ultimate BMD accrual resulting from the modeling-based bone formation and
overcome the tachyphylaxis of PTH treatment [12, 14, 16, 17, 30]. However, the cyclic
PTH regimen with repeated cycles of 3-month on and off daily injection of PTH without
prior or ongoing ALN did not show an increase in BMD more than standard daily PTH
when considering either equal treatment dose or equal treatment time [13]. In addition,
the cyclic PTH regimen with prior and ongoing ALN showed similar treatment effects as
the standard daily injection of PTH on BMD in spine, femur and radius [12-14].
Therefore, the clinical studies did not show the enhancement in BMD using the cyclic
PTH regimen. In the current study, the cyclic administration regimen in the Cyclic PTH-
VEH group produced the similar observations to the clinical studies when equal treatment
dose was considered, i.e. 9-week daily treatment vs. 18-week cyclic treatment: the Cyclic
PTH-VEH group did not show advantages in any bone microarchitecture parameter when
compared to the PTH-VEH group. In contrast, regarding equal treatment time, i.e. at
week 18, the Cyclic PTH-VEH group showed improvements in bone mass (reflected by
BV/TV) and trabecular architecture (reflected by SMI) when compared to the PTH-VEH
group. Based on this finding, the current study suggests that the cyclic administration
regimen in the Cyclic PTH-VEH group can alleviate bone deterioration and extended the
total duration of treatment in terms of bone microarchitecture. In the future studies, the
DEXA scans may be also included to track the changes in BMD in the rat model.
Additionally, previous studies also hypothesized that the cyclic and alternating
treatment regimen might enhance and maximize the net anabolic effect of PTH by
suppressing the bone resorption that anti-resorptive agents, either Calcitonin [15] or
66
Denosumab [11], were given sequentially after the PTH treatment. However, neither
study showed greater BMD improvements in the cyclic and alternating regimen when
compared to the cyclic PTH alone group [15] or the daily treatment group [11]. Hodsman
et al. indicated that using calcitonin could be the wrong choice since it is a relatively
weak anti-resorptive agent [15] while Cosman et al. indicated that the denosumab
withdrawal effects may even out the following PTH treatment effects [11]. On the other
hand, our results showed a significant improvement in bone microarchitecture with both
Cyclic PTH-ALN & ALN-PTH regimens when compared to the Cyclic PTH-VEH at the
tibia and lumbar vertebrae L2, indicating that the cyclic and alternating PTH and anti-
resorptive regimens further improved bone mass and bone microarchitecture beyond the
Cyclic PTH-VEH regimen, suggesting that ALN may be the better choice as anti-
resorptive agent following PTH treatment. However, the reason for the discrepancy
between the clinical findings and rat model is not clear, indicating a need for the future
studies in this area.
The clinical and murine studies reported that the cyclic treatment may show the
beneficial effects in the lumbar spine and femur [11, 15, 16]. Hodsman et al. observed
that there were very low incident vertebral fracture rates over 2-year cyclic and
alternating PTH and Calcitonin treatments in osteoporosis patients [15]. Cosman et al.
indicated that the cyclic PTH and Denosumab regimen might show a beneficial effect in
the highly cortical bone sites in osteoporosis patients [11]. Iida-Klein et al. showed an
increase in bone strength in the femur but not in the vertebrae in the intact murine model
[16]. Our current results showed an enhancement in bone microarchitecture and bone
strength in the cyclic administration regimen in Cyclic PTH-ALN and Cyclic ALN-PTH

67
groups in lumbar vertebrae L2, which may support Hodsman et al.’s findings, i.e. low
vertebral fracture rate [15]. In order to further understand the material properties, a
nanoindentation technique was performed on lumbar vertebrae L1. Unfortunately, no
difference was found in elastic modulus or hardness. Moreover, our results did not show
any structural or mechanical changes on femoral cortical bone, which was not consistent
with previous findings [11]. The discrepancy may be due to the different properties of
anti-resorptive agents, i.e. ALN vs. denosumab, and the animal models, i.e. rat vs. mice
and estrogen deficiency vs. intact animals. Further studies need to be performed to
address the differences.
In summary, we found that the cyclic PTH treatment regimen in the Cyclic PTH-
VEH group can efficiently prevent bone loss and deterioration in trabecular
microarchitecture due to estrogen-deficiency and led to a significant increase in
trabecular thickness. The cyclic and sequential treatment of PTH and ALN can further
improve the treatment efficacy of daily and cyclic PTH treatments on bone
microarchitecture and bone strength and extend PTH treatment duration. Therefore, we
concluded that the alternating cyclic PTH and ALN treatment regimens can alleviate
bone deterioration and allow for extended the treatment duration and should therefore be
considered as a viable treatment option for osteoporosis.

68
3.5 Figures
Figure 3-1. Estrogen-deficient animals (A) changes in tibial trabecular bone
microstructure measurements in PTH and VEH groups. # indicates a significant
difference between PTH and VEH groups (p<0.05). + indicates a significant difference
between in VEH group between week 3 and week 12 (p<0.05). * indicates a significant
difference between in PTH-VEH group between week 3 and week 12 (p<0.05).
Histomorphometric measurements of (B) osteoblast number (N.Ob/BS) and (C)
osteoclast number (N.Oc/BS).
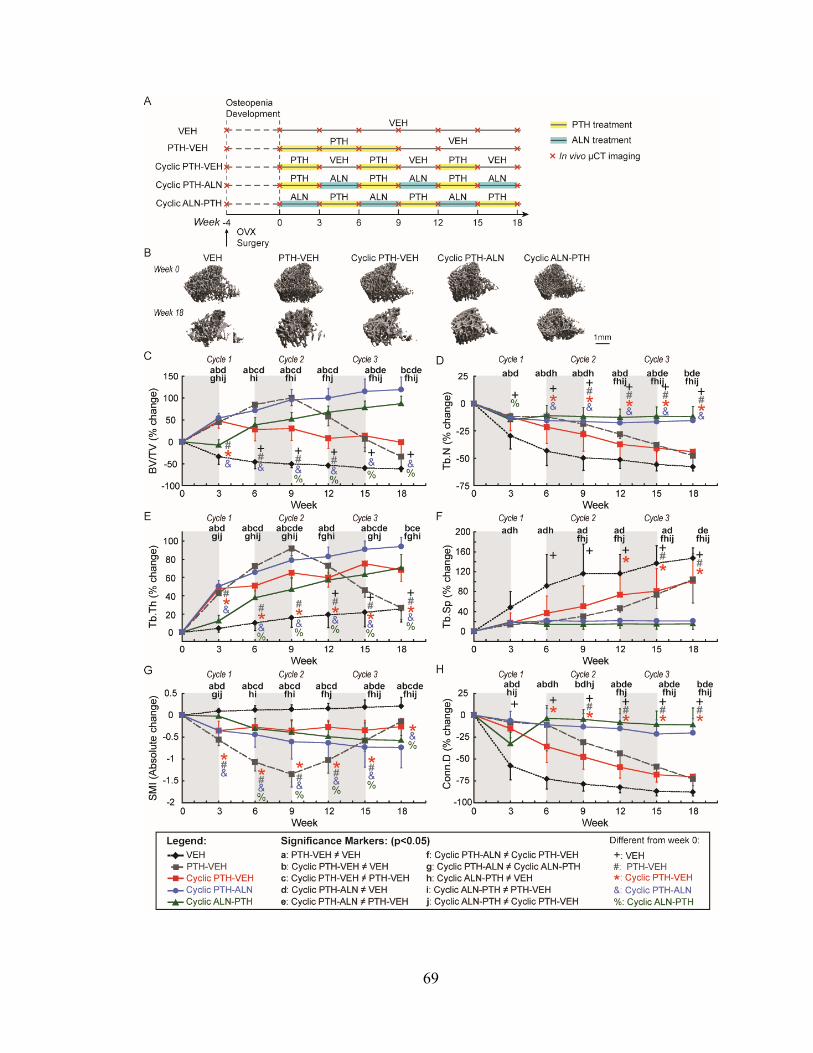
69

70
Figure 3-2. Estrogen-deficient animals (A) Schematics of treatment strategies, (B)
Representative 3D renderings of the proximal tibia of a VEH, PTH-VEH, Cyclic PTH-
VEH, Cyclic PTH-ALN and Cyclic ALN-PTH rat at weeks 0 and 18. (C-H) changes in
tibial trabecular bone microstructure measurements in VEH, PTH-VEH, Cyclic PTH-
VEH, Cyclic PTH-ALN and Cyclic ALN-PTH groups. a indicates a significant difference
between PTH-VEH and VEH groups (p<0.05). b indicates a significant difference
between Cyclic PTH-VEH and VEH groups (p<0.05). c indicates a significant difference
between in Cyclic PTH-VEH and PTH-VEH groups (p<0.05). d indicates a significant
difference between Cylic PTH-ALN and VEH groups (p<0.05). e indicates a significant
difference between Cyclic PTH-ALN and PTH-VEH groups (p<0.05). f indicates a
significant difference between in Cyclic PTH-ALN and Cyclic PTH-VEH groups
(p<0.05). g indicates a significant difference between PTH-ALN and Cyclic ALN-PTH
groups (p<0.05). h indicates a significant difference between Cyclic ALN-PTH and VEH
groups (p<0.05). i indicates a significant difference between in Cyclic ALN-PTH and
PTH-VEH groups (p<0.05). j indicates a significant difference between in Cyclic ALN-
PTH and Cyclic PTH-VEH groups (p<0.05). + indicates a significant difference from
week 0 in VEH group (p<0.05). # indicates a significant difference from week 0 in PTH-
VEH group (p<0.05). * indicates a significant difference from week 0 in Cyclic PTH-
VEH group (p<0.05). & indicates a significant difference from week 0 in Cyclic PTH-
ALN group (p<0.05). % indicates a significant difference from week 0 in Cyclic ALN-
PTH group (p<0.05).

71
Figure 3-3. Comparisons between treatment groups in cyclic treatment regimens at the
end of week 18 in trabecular bone microstructure and mechanical properties of lumbar
vertebra L2.
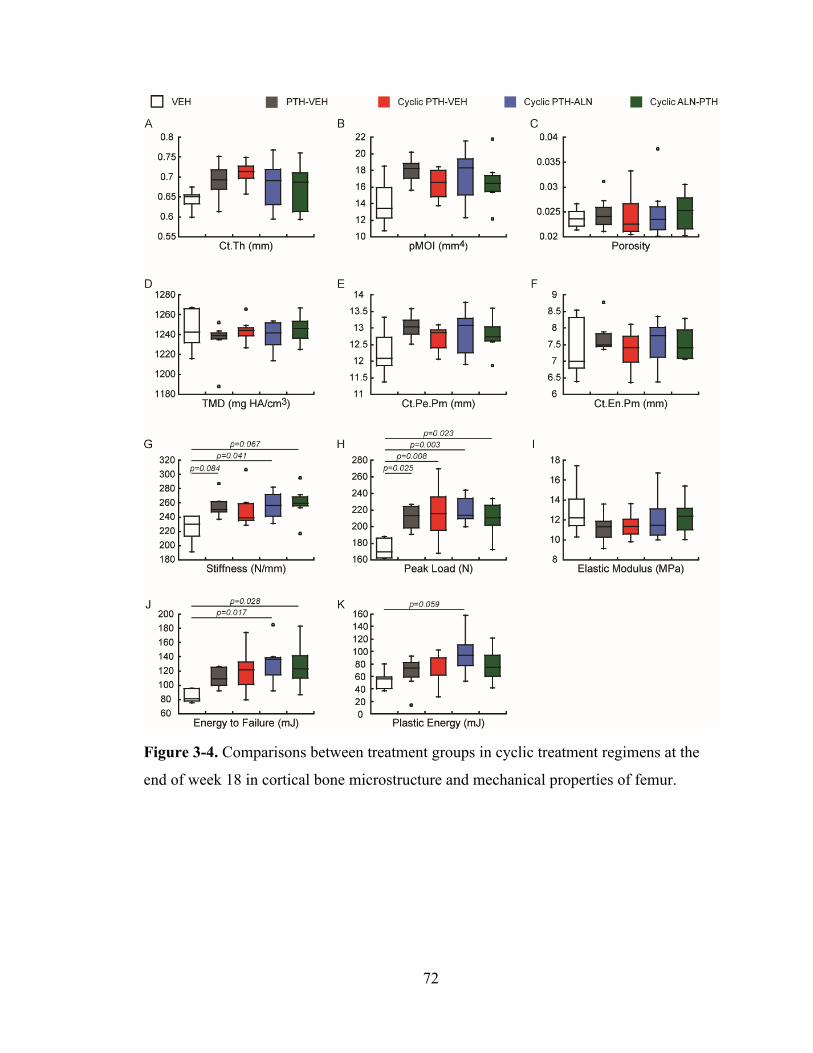
72
Figure 3-4. Comparisons between treatment groups in cyclic treatment regimens at the
end of week 18 in cortical bone microstructure and mechanical properties of femur.

73
Figure 3-5. Comparisons between treatment groups in cyclic treatment regimens at the
end of week 18 in trabecular bone tissue material properties of lumbar vertebra L1.
74
3.6 References
1. Berg, C., K. Neumeyer, and P. Kirkpatrick, Teriparatide. Nat Rev Drug Discov, 2003. 2(4): p. 257‐8.
2. FDA Drug Approvals List [online] <https://www.accessdata.fda.gov/drugsatfda_docs/nda/2002/21‐318_Forteo.cfm>. 2002.
3. Jilka, R.L., Molecular and cellular mechanisms of the anabolic effect of intermittent PTH. Bone, 2007. 40(6): p. 1434‐46.
4. Compston, J.E., Skeletal actions of intermittent parathyroid hormone: effects on bone remodelling and structure. Bone, 2007. 40(6): p. 1447‐52.
5. Qin, L., L.J. Raggatt, and N.C. Partridge, Parathyroid hormone: a double‐edged sword for bone metabolism. Trends Endocrinol Metab, 2004. 15(2): p. 60‐5.
6. Black, D.M., et al., One year of alendronate after one year of parathyroid hormone (1‐84) for osteoporosis. N Engl J Med, 2005. 353(6): p. 555‐65.
7. Bilezikian, J.P. and M.R. Rubin, Combination/sequential therapies for anabolic and antiresorptive skeletal agents for osteoporosis. Curr Osteoporos Rep, 2006. 4(1): p. 5‐13.
8. Black, D.M., et al., The effects of parathyroid hormone and alendronate alone or in combination in postmenopausal osteoporosis. N Engl J Med, 2003. 349(13): p. 1207‐15.
9. Cohen, A., et al., Bone Density After Teriparatide Discontinuation in Premenopausal Idiopathic Osteoporosis. J Clin Endocrinol Metab, 2015. 100(11): p. 4208‐14.
10. Leder, B.Z., et al., Effects of teriparatide treatment and discontinuation in postmenopausal women and eugonadal men with osteoporosis. J Clin Endocrinol Metab, 2009. 94(8): p. 2915‐21.
11. Cosman, F., et al., Standard Versus Cyclic Teriparatide and Denosumab Treatment for Osteoporosis: A Randomized Trial. J Bone Miner Res, 2020. 35(2): p. 219‐225.
12. Cosman, F., et al., Daily and cyclic parathyroid hormone in women receiving alendronate. New England Journal of Medicine, 2005. 353(6): p. 566‐575.
13. Cosman, F., et al., Administration of teriparatide for four years cyclically compared to two years daily in treatment Naive and alendronate treated women. Bone, 2019. 120: p. 246‐253.
14. Cosman, F., et al., Daily or Cyclical Teriparatide Treatment in Women With Osteoporosis on no Prior Therapy and Women on Alendronate. J Clin Endocrinol Metab, 2015. 100(7): p. 2769‐76.
15. Hodsman, A.B., et al., A randomized controlled trial to compare the efficacy of cyclical parathyroid hormone versus cyclical parathyroid hormone and sequential calcitonin to improve bone mass in postmenopausal women with osteoporosis. J Clin Endocrinol Metab, 1997. 82(2): p. 620‐8.
16. Iida‐Klein, A., et al., Effects of cyclic versus daily hPTH(1‐34) regimens on bone strength in association with BMD, biochemical markers, and bone structure in mice. J Bone Miner Res, 2006. 21(2): p. 274‐82.
17. Iida‐Klein, A., et al., Effects of cyclic vs. daily treatment with human parathyroid hormone (1‐34) on murine bone structure and cellular activity. Bone, 2007. 40(2): p. 391‐8.
18. Hodsman, A.B., et al., Histomorphometric evidence for increased bone turnover without change in cortical thickness or porosity after 2 years of cyclical hPTH(1‐34) therapy in women with severe osteoporosis. Bone, 2000. 27(2): p. 311‐8.

75
19. Altman, A.R., et al., A closer look at the immediate trabecula response to combined parathyroid hormone and alendronate treatment. Bone, 2014. 61: p. 149‐57.
20. Bach‐Gansmo, F.L., et al., Calcified cartilage islands in rat cortical bone. Calcif Tissue Int, 2013. 92(4): p. 330‐8.
21. Collignon A, et al., Automated multi‐modality image registration based on information theory. 1995 p. 263–274.
22. Viola, P. and W.M. Wells III, Alignment by maximization of mutual information. Int J Comput Vis, 1997. 24(2): p. 137‐54.
23. Ibanez L, S.W., Ng L, Cates J., The ITK software guide. 2nd ed. [Available at http://www.itk.org/ItkSoftwareGuide.pdf. Accessed December 5, 2008]. 2005.
24. Pendleton, M.M., et al., High‐precision method for cyclic loading of small‐animal vertebrae to assess bone quality. Bone Rep, 2018. 9: p. 165‐172.
25. Schriefer, J.L., et al., A comparison of mechanical properties derived from multiple skeletal sites in mice. J Biomech, 2005. 38(3): p. 467‐75.
26. Kim, D.G., et al., Relationships of viscosity with contact hardness and modulus of bone matrix measured by nanoindentation. J Biomech Eng, 2010. 132(2): p. 024502.
27. Kim, D.G., et al., Effect of estrogen deficiency on regional variation of a viscoelastic tissue property of bone. J Biomech, 2013. 46(1): p. 110‐5.
28. Huja, S.S., F.M. Beck, and D.T. Thurman, Indentation properties of young and old osteons. Calcif Tissue Int, 2006. 78(6): p. 392‐7.
29. Oliver, W.C. and G.M. Pharr, Measurement of hardness and elastic modulus by instrumented indentation: Advances in understanding and refinements to methodology. Journal of Materials Research, 2004. 19(1): p. 3‐20.
30. Dempster, D.W., et al., Effects of Daily or Cyclic Teriparatide on Bone Formation in the Iliac Crest in Women on No Prior Therapy and in Women on Alendronate. J Bone Miner Res, 2016. 31(8): p. 1518‐26.
76
CHAPTER 4
Differences in Material Properties of Trabecular Bone Tissue from Modeling- and
Remodeling-Based Bone Formation in Rats
4.1 Introduction
Bone undergoes continuous changes during life through processes of bone
remodeling and modeling. Both are inherently involved in the alteration of bone in
response to environmental changes. Bone remodeling or so-called remodeling-based bone
formation (RBF) plays a predominant role in maintaining skeletal health and mineral
homeostasis [1]. During RBF, formation and resorption are tightly coupled, i.e., new
bone forms over the resorbed bone surface [2]. Due to bone resorption preceding bone
formation, the RBF site is characterized as a scalloped cement line with interruption of
surrounding cement lines. On the other hand, bone modeling or so-called modeling-based
bone formation (MBF) is a process that primarily alters overall bone size and shape in
response to physiological influences. Previous studies suggested that MBF mainly occurs
during growth, healing, and in response to external mechanical loading, and is less
commonly found in the adult skeleton [3-7]. During MBF, formation and resorption are
not tightly coupled, i.e., de novo bone formation without prior activation of osteoclastic
resorption [2]. Since MBF occurs on quiescent bone surfaces without preceding bone
resorption, the MBF site is characterized as a new bone packet with a smooth cement line
without interruption of the surrounding collagen fibers.
Recently, the concept of MBF has received increased attention due to the
discovery of its involvement in several osteoporosis treatments [5, 7-11]. Lindsay et al.

77
reported that clinical treatment by teriparatide, intermittent injections of parathyroid
hormone (PTH) 1-34, increases bone mass rapidly in 3 months by activating both RBF
and MBF where MBF may account for more than 30% of bone gain by PTH [7].
Moreover, another recent study in rats and monkeys reported that Scl-Ab
(Romosuzumab) improves aBMD primarily through a more than 10-fold increase in
MBF without affecting the RBF rate, making MBF a promising target to treat
osteoporosis [10]. Furthermore, MBF is not only elicited by anabolic agents but also
responds to antiresorptive agents. Denosumab, a RANKL inhibitor, induces MBF at the
endocortical bone surfaces [12], while Odanacatib, a cathepsin K inhibitor, stimulates
MBF at the periosteal bone surfaces [11]. Additionally, studies have shown that MBF can
be elicited on the trabecular bone surface by an anabolic agent with co-treatment of an
anti-resorptive drug [5, 13-19].
While targeting MBF maximizes the net increase of bone quantity, there is limited
knowledge on the quality of bone tissue that results from MBF. The only difference
between MBF and RBF that the literature reported is structural morphometry, which was
identified on a thin plastic section using polarized light [3]. It is unclear whether other
aspects of tissue composition, structure, and mechanics of bone tissue from MBF differ
from those of RBF, and whether such differences subsequently influence macro-scale
bone fracture resistance. Moreover, most studies on bone tissue mechanics have focused
on cortical bone [20]. The only mechanics reported on trabecular bone were the quasi-
static and dynamic nanomechanical properties [21]. However, there is a critical
knowledge gap regarding the contribution of the MBF compared to the RBF to structure-
function relationships of trabecular bone tissue at multiple length scales. These

78
challenges may result from lacking reliable differentiation between MBF and RBF on a
thick bone specimen, causing the inability to investigate the quality of the bone tissue
generated through these two distinct cellular mechanisms. Therefore, the objective of this
study was to (1) investigate the dynamics of MBF and RBF in response to PTH, (2)
develop an imaging method that can be coupled with a mechanical testing platform for
reliable identification and examination of material properties of RBF and MBF on thick
bone sections, and (3) determine the differences in material properties of trabecular bone
tissue from RBF and MBF. We hypothesize that the homogeneous collagen structure of
the MBF site may lead to reduced heterogeneity of tissue material properties compared to
RBF sites.
4.2 Materials and Methods
4.2.1 Animals and Treatment Plans
All experiments were approved by the Institutional Animal Care and Use
Committee of the University of Pennsylvania. A total of 17 female Sprague Dawley rats
were used in this study. All rats were randomly assigned to different groups and housed
in standard conditions in groups of three rats per cage. Experiments were performed
unblinded. Intermittent PTH treatment (Human Recombinant PTH1-34, Bachem,
Bubendorf, Switzerland) was administered subcutaneously 5 times per week to all
animals at the dose of 20 µg/kg/day while Vehicle treatment was administered as
subcutaneous injections of saline 5 times per week at the dose of 150 μL/day.
The study began when the animals were at the age of 7 months due to minimally
active bone accrual in rat skeleton at this age. To investigate the dynamic responses of

79
MBF and RBF, 12 intact female rats were used. Starting from day 0, the animals received
daily subcutaneous injections of VEH or PTH for 3 weeks (Figure 4-1A). Alternatively,
in order to determine the mechanical properties of trabecular bone tissue from RBF and
MBF, 5 intact female rats were used. Starting from day 0, the animals received daily
subcutaneous PTH injections for 3 weeks followed by 9 weeks of saline treatment
(Figure 4-2A). Each rat was injected with a sequence of fluorochrome labels including
calcein (green, G, 20 mg/kg, Sigma Aldrich, St. Louis, MO), alizarin complexone (red, R,
30 mg/kg, Sigma Aldrich, St. Louis, MO), tetracycline (yellow, Y, 25 mg/kg, Sigma
Aldrich, St. Louis, MO) in the order of G-R-Y-G at days -2, 5, 12, 19 (Figure 4-1A, 4-
2A). The animals were sacrificed on either day 21 (week 3, Figure 4-1A) or day 84 (week
12, Figure 4-2A). Multi-color fluorochrome labeling allowed for accurate identification
of formation sites of different tissue ages in the fluorescent image of the bone.
4.2.2 Bone Histomorphometry of MBF and RBF for Thin Sections
After euthanasia, the left tibia was harvested and fixed in 4% paraformaldehyde
(PFA) at 4 °C for 48 hours. Samples were stored in 30% sucrose and then cryo-
embedded. Undecalcified specimens were sectioned in 8μm-thick sections as previously
described [22] and attached to glass microscope slides using 1% chitosan adhesive.
Mounted slides were rehydrated and scanned using Axio Scan Z1 (Zeiss, Oberkochen,
Germany) to obtain fluorescent images (Figure 4-1B). After the first round of imaging,
the sections were decalcified using Formical-2000TM decalcifier (StatLab, McKinney,
TX) and the cement line and collagen fiber alignment were visualized under a polarizing
microscope (Leica, Wetzlar, Germany, Figure 4-1C). Based on the structural
morphometry and the overlaid images of fluorescent and polarized images (Figure 4-

80
1DE), MBF and RBF sites were identified, and the histomorphometric measurements,
including mineralizing surface (MS/BS), mineral apposition rate (MAR), and bone
formation rate (BFR/BS), were measured using OsteoMeasureTM (OsteoMetrics, Atlanta,
GA).
4.2.3 Sample Preparation for Thick Sections
After sacrifice, the right tibia was harvested for methylmethacrylate (MMA)
embedding without decalcification and then cut into a 4-mm-thick section along the
coronal plane using a low-speed diamond saw (IsoMet, Buehler, Lake Bluff, IL) with
water irrigation. The bone specimen surface was continuously manually polished using 1
μm and 0.3 μm aluminum oxide (Al2O3) lapping discs in wet conditions and finally with
a napless cloth with 0.06 μm non-crystallizing silica (SiO2) suspension. Sonication of the
specimen in deionized water followed each step to remove debris.
4.2.4 Fluorescence, Second Harmonic Generation, and Brightfield Microscopic Imaging
for Thick Sections
Fluorochrome labels (Figure 4-2B) of the entire bone specimen were captured
with a fluorescence microscope (Axio Zoom, Carl Zeiss Inc., Thornwood, NY). The
fluorochrome labels (Figure 4-2B) and collagen fibers (Figure 4-2C) of the entire
trabecular bone region were observed with spectral confocal and multiphoton
microscopes (Leica TCS SP8, Wetzlar, Germany) using a 20x/0.9 numerical aperture
(NA) HC IRAPO motCORR water immersion objective. Calcein, alizarin complexone,
tetracycline, and collagen fibers were imaged simultaneously. The individual images
were overlaid (Figure 4-2D) with calcein shown in green, alizarin complexone in red,
tetracycline in yellow and collagen fibers in cyan. Collagen fibers and cement lines were
81
obtained using two-photon, second harmonic generation (SHG) [21, 23], with an
excitation wavelength at 930 nm and collection at 465 nm. The brightfield image (Figure
4-2G) of the entire bone specimen was obtained with an optical microscope using 5x,
0.13 NA objective (Axio Imager.A1m, Carl Zeiss Inc., Thornwood, NY). This brightfield
image served as a reference image for co-registration with other imaging modalities.
4.2.5 Nanoindentation
A bright field image overlaid by a fluorescent image with MBF and RBF
identified were used to guide test site selection (Figure 4-2F). 80-90% of bone formation
sites were labeled with all 4 markers (G-R-Y-G) and only these sites (tissue age 10-12
weeks) were chosen for indentation tests. The distance between labels is roughly 8 µm.
10±2 MBF and 9±2 RBF sites were tested for each specimen. At each site, the
indentation started from the pre-existing bone and ended at the PMMA (Figure 4-2H).
The distance between 2 neighbor indents was 10-20 µm. The indent locations were
precisely determined using an optical microscope with a 20X objective at a calibrated
distance away from the indenter tip (10x zoom capacity, encoder resolution 500 nm,
Figure 4-2G). As an example, indent marks performed on a MBF site are shown by SEM
images (Figure 4-2IJ). Indentation tests were performed using a pyramidal Berkovich tip
(Hysitron TI-950 TriboIndenter, Bruker, Billerica, MA) with a speed of 50 µN/s, held at
a load of 2500 µN for 30 s, and unloaded at 50 µN/s. The indentation depth ranges from
350-650 nm, which is considered sufficient to minimize the influence of surface
roughness on the measurement. The elastic modulus (E) and hardness (H) were
calculated based on the unloading portion of the load-displacement curve by the Oliver-
Pharr method [24, 25]. The full width at half maximum (FWHM) of the Gaussian curve

82
fit to the distribution of E and H was used to assess heterogeneity of each indentation
parameter for each type of bone tissue. The coefficient of variance (CV) was also
calculated to examine the heterogeneity of elastic modulus and hardness, respectively.
4.2.6 Bone Mineralization Density Distribution Analysis
After the nanoindentation tests, each bone specimen was subjected to quantitative
backscattered electron imaging (qBEI) [26, 27]. An environmental scanning electron
microscope (ESEM, FEI XL-30, Field Electron and Ion Company, Hillsboro, OR)
equipped with a backscattered electron (BSE) detector was used to image the bone
specimens. All images were captured with an accelerating voltage of 25 kV, a working
distance of 13 mm, and a nominal magnification of 100X. The pixel resolution of the
digital backscattered electron image was 0.375 µm per pixel. All images were taken
under the same brightness and contrast condition. Carbon (Z=6) and Aluminum (Z=13)
were used to calibrate the greyscale level with the atomic number [27, 28]. Weight %
Calcium (wt%Ca) standardization was achieved by using osteoid with 0% Ca and pure
hydroxyapatite with 39.86% Ca (Z=14.06) as reference points [26, 27, 29]. By registering
the qBEI image with the fluorescent maps (Figure 4-2K), histograms of wt%Ca
distribution for the entire MBF and RBF sites were contoured and separately calculated
to derive the mean and heterogeneity of calcium distribution for each type of tissue.
Furthermore, histograms of wt%Ca distribution of an 80-pixel region at the pre-existing
bone, MBF and RBF, next to each indentation location (Figure 4-2H) were calculated to
derive the mean and heterogeneity of calcium distribution for each type of tissue [26, 27,
30].

83
4.2.7 Statistical Analysis
All statistical analyses were performed using NCSS 7.1.14 (NCSS, LLC,
Kaysville, UT). Mean ± standard deviation (SD) are given for all the results. A one-way
ANOVA with a Tukey HSD post hoc test was performed to determine the treatment
effect on mechanical properties. For all analyses, a two-tailed p<0.05 was considered to
indicate statistical significance.
4.3 Results
4.3.1 Bone Histomorphometry
Mineralizing surface (MS/BS) between MBF and RBF did not differ in the
vehicle (VEH)-treated 7-month-old female (Figure 4-1F). 3-week PTH treatment led to
7.7 fold greater MBF-induced MS/BS compared to the VEH group in intact female rats
(Figure 4-1F). On the other hand, PTH resulted in 3.6-fold greater RBF-induced MS/BS
compared to the VEH group in intact female rats (Figure 4-1F). However, no difference
in MAR between MBF and RBF was found in either VEH- or PTH groups (Figure 4-1G).
4.3.2 Bone Tissue Mechanical Properties and Tissue Heterogeneity
26±4, 22±3, and 26±4 indents were performed for MBF, RBF, and the pre-
existing bone of each specimen, respectively. No difference in elastic modulus or
hardness was found between MBF and RBF. However, both MBF and RBF had lower
elastic modulus (18.7% and 20.6%) and hardness (25.1% and 23.1%) than pre-existing
bone (Figure 4-3AD). Surprisingly, the EFWHM of MBF was 27.4% and 27.9% greater
than that in RBF and pre-existing bone, respectively (Figure 4-3B), indicating increased
heterogeneity in MBF. Similar results were also found in the ECV (Figure 4-3C). In

84
contrast, there was no difference in HFWHM among MBF, RBF and pre-existing bone
(Figure 4-3E). In terms of the HCV, MBF exhibited greater heterogeneity in hardness than
pre-existing bone (Figure 4-3F). Furthermore, the dynamics of bone tissue maturation,
i.e., 9-10 weeks, 10-11 weeks and 11-12 weeks, was evaluated in E and compared
between MBF and RBF sites (Figure 4-4). MBF sites showed a greater degree of
mineralization than RBF sites (Figure 4-4), which may indicate why MBF sites have
greater heterogeneity (Figure 4-3BC).
4.3.3 Bone Mineralization Density Distribution
wt%Ca was calculated next to each indentation location. No difference in wt%Ca
was found between MBF and RBF. There was no difference in wt%Ca among MBF,
RBF and pre-existing bone (Figure 4-3G). In terms of the heterogeneity of wt%Ca, there
was no difference between MBF and RBF (Figure 4-3H). However, the heterogeneity of
wt%Ca (%CaFWHM) in pre-existing bone was greater than that in both MBF and RBF
(Figure 4-3H). Regarding wt%CaCV, there was no difference between groups (Figure 4-
3I).
4.4 Discussion
Previous rodent and clinical investigations were referenced and either double
labeling or quadruple tetracycline labeling methods were used to identify and
differentiate between MBF and RBF sites of trabecular bone on plastic-embedded,
undecalcified thin bone sections. Those studies first used fluorochrome labels to locate
the new bone formation sites and then observed cement lines at these sites using
transmission light or polarized light on Villanueva bone stained sections [4] or toluidine-

85
blue stained sections [6]. Bone formation was designated as MBF if the underlying
cement line was smooth and RBF if the cement line was scalloped.
Several studies [16-18, 31-34] including ours [35-37] evaluated the effects of
PTH with inhibited or absent osteoclasts in rodent bone and observed a significant
anabolic response to PTH, thus, indicating that MBF accounts for a substantial fraction of
PTH-induced bone formation in rodent bone. Using these criteria and methods, our first
study investigated the dynamics of MBF and RBF of PTH and provided direct evidence
showing that MBF and RBF were identified in 7-month-old PTH-treated female rats by
employing a series of multi-color fluorochrome injections. These results suggest that both
MBF and RBF contribute to skeletal homeostasis in the adult rat skeleton, and PTH
exerts its anabolic actions through both MBF and RBF.
However, in addition to morphological analysis, the contribution of the MBF
compared to the RBF for structure-function relationships of trabecular bone tissue is
critical. Without a reliable method to differentiate MBF and RBF on a thick bone
specimen, the quality of the bone tissue generated through these two distinct cellular
mechanisms cannot be investigated. This current study is the first to investigate the
mechanical aspects of bone tissue resulting from MBF and RBF of trabecular bone on
thick bone sections using a novel microscopic imaging and a nano-scale mechanical
testing platform. Our novel imaging platform overcame this limitation for identifying
MBF and RBF sites on a thick bone section, thereby allowing for testing subsequent
tissue mechanical properties on the identified MBF/RBF sites. Similar to the previous
studies on thin sections, the new bone formation sites were identified using fluorochrome
labels. Instead of using transmission light or polarized light, the SHG imaging was

86
utilized to observe the collagen fiber alignment and determine the cement lines to
differentiate MBF and RBF using the same criteria.
We further refined the identification criteria using a 3D stack of SHG and
fluorescent images. Based on the SHG imaging, about 10% of bone formation sites
cannot be reliably differentiated into either MBF or RBF on thick sections. Moreover, the
literature suggested that some RBF sites belong to overflow MBF (oMBF), where new
bone formation extends beyond the limits of the RBF (Figure 4-5). Therefore, the sites
with precise characteristics of MBF and RBF were included in this study. Nevertheless,
because of the existence of oMBF, some of the formation sites may be erroneously
interpreted to be MBFs occurring on the smooth surface based on the observed X-Y plane
of the bone surface. In contrast, in the adjacent planes along the z-axis, a scalloped
cement line may be present. We confirmed all MBF and RBF sites using a 3D stack of
SHG and fluorescent images to examine the collagen fibers and cement lines up to 50 µm
in depth (Figure 4-6).
In optimizing our indentation protocol, the significant improvements in this study
were the calibration and the indentation depth. The indentation depth on previous studies
[20, 21] using the indentation machine, Bruker Hysitron TI-950, ranged from 50 to 250
nm due to the calibration on the fused silica. However, since the surface roughness is
around 50 nm based on the size of polishing particles, no-crystallizing silica (SiO2)
suspension, the indentation depth may not be deep enough to eliminate the effects on the
surface roughness. Therefore, in order to minimize the influence of surface roughness on
the measurement, a magnesium alloy was chosen for the calibration standard in this study
because the elastic modulus of the magnesium alloy is 45GPa, which is closer to that of

87
the bone specimens when compared to fused silica, 72GPa. By using the magnesium
alloy as the calibration standard, the indentation depth ranges from 350 to 650 nm, which
is deep enough to eliminate the effect on surface roughness.
Based on the structural differences between MBF and RBF, we initially
hypothesized that MBF has lower heterogeneity in tissue mechanical properties than
RBF. While we observed no difference in the mean value of E and H between bone tissue
from MBF and RBF, surprisingly, the current finding indicated greater heterogeneity in
nano-scale E and H in bone tissue from MBF than those from RBF and pre-existing bone.
Furthermore, we found that the degree of mineralization was greater in MBF compared to
that in RBF. It has been suggested that bone tissue heterogeneity plays a critical role in
determining bone tissue toughness and fracture resistance [4]. Therefore, the bone
mineral density distribution (BMDD) was tested to determine the mechanisms behind the
difference of the dynamics of bone tissue maturation. We further refined the protocol to
measure the BMDD by qBEI. Previous studies measures the BMDD using carbon-coated
specimens [27]. In order to keep the specimens intact, the ESEM was used; therefore, the
specimens were scanned without conducted coating. It is still possible to indent the
specimens after ESEM scanning. Due to greater heterogeneity and degree of
mineralization in MBF using nanoindentation tests, the greater wt%Ca and heterogeneity
were thought to be consistent with the indentation test results. However, no difference
between MBF and RBF was found in bone mineral distribution. This inconsistency could
be due to the bigger analyzing region compared to the indentation region, and therefore
has to be further tested.

88
Although this study was the first of its kind to examine the mechanical properties
of trabecular bone tissue from MBF and RBF on thick bone sections, several limitations
exist, beginning with a small sample size of 5. This limitation may prevent apparent
generalized mechanical properties between bone tissue from MBF and RBF. Second, the
specimens were manually polished. Manual-polished specimens may result in an
unparalleled specimen surface, i.e., a tilted bone surface, causing long scanning time and
the inaccuracy of z-stack SHG imaging. Third, BSE imaging was taken after
nanoindentation. In bone specimens, the compositional changes associated with bone
tissue maturation depend on the mineral content, causing the grayscale level difference
[38], e.g., the output image with a brighter grayscale level indicates higher mineral
content at that region and vice versa. Since the ESEM was used in this study, the bone
specimens were kept intact without coatings. ESEM imaging should be used to assist in
identifying MBF and RBF sites along with the SHG imaging. Therefore, a modified
protocol is proposed here. First, an automatic polishing method by a machine should be
used to obtain a parallel, non-tilted, bone surface. Second, a region of interest (ROI) in
the bone specimen is identified using a fluorescent microscope to determine bone
formation sites. Third, SHG imaging and ESEM imaging are taken to identify MBF and
RBF sites at the same ROI. Fourth, based on these identification sites, the indentation
locations are chosen and the indents are performed at these locations. Finally, ESEM
imaging can be utilized to examine the calcium distribution next to the indentation
locations.
In summary, we developed an innovative microscopic imaging and nano-scale
mechanical testing platform to examine the mechanical properties of trabecular bone
89
tissue from MBF and RBF on thick bone sections. We found greater heterogeneity in
nano-scale E and H in bone tissue from MBF than those from RBF and pre-existing bone.
We also found that the degree of mineralization was greater in MBF compared to that in
RBF. Our results suggest that targeting MBF in the adult skeleton may not only
maximize the capacity of net bone volume increase, but also lead to high tissue quality
toward better fracture resistance. Importantly, targeting MBF may be a more efficient
strategy for osteoporosis treatment.

90
4.5 Figures
Figure 4-1. (A) Drug treatment and multiple fluorochrome injection plan. Representative
MBF and RBF sites on a thin section under (B) Fluorescent Imaging, (C) Polarized
Imaging for cement lines, and (D) Overlaid image of (B) and (C) of a trabeculae; (E) A
schematic representation of (C). MBF highlighted in green and RBF in red (F) MS/BS
and (G) MAR of MBF and RBF in response to 3-week treatments of VEH and PTH in
intact female rats.
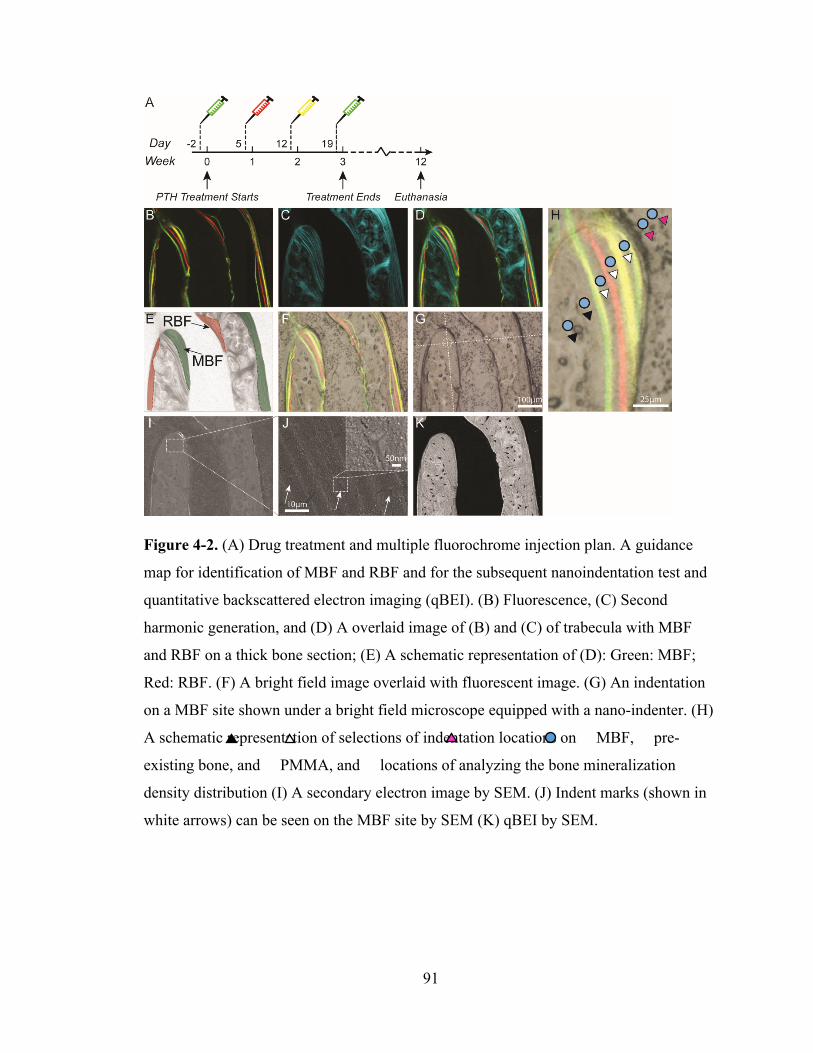
91
Figure 4-2. (A) Drug treatment and multiple fluorochrome injection plan. A guidance
map for identification of MBF and RBF and for the subsequent nanoindentation test and
quantitative backscattered electron imaging (qBEI). (B) Fluorescence, (C) Second
harmonic generation, and (D) A overlaid image of (B) and (C) of trabecula with MBF
and RBF on a thick bone section; (E) A schematic representation of (D): Green: MBF;
Red: RBF. (F) A bright field image overlaid with fluorescent image. (G) An indentation
on a MBF site shown under a bright field microscope equipped with a nano-indenter. (H)
A schematic representation of selections of indentation locations on MBF, pre-
existing bone, and PMMA, and locations of analyzing the bone mineralization
density distribution (I) A secondary electron image by SEM. (J) Indent marks (shown in
white arrows) can be seen on the MBF site by SEM (K) qBEI by SEM.
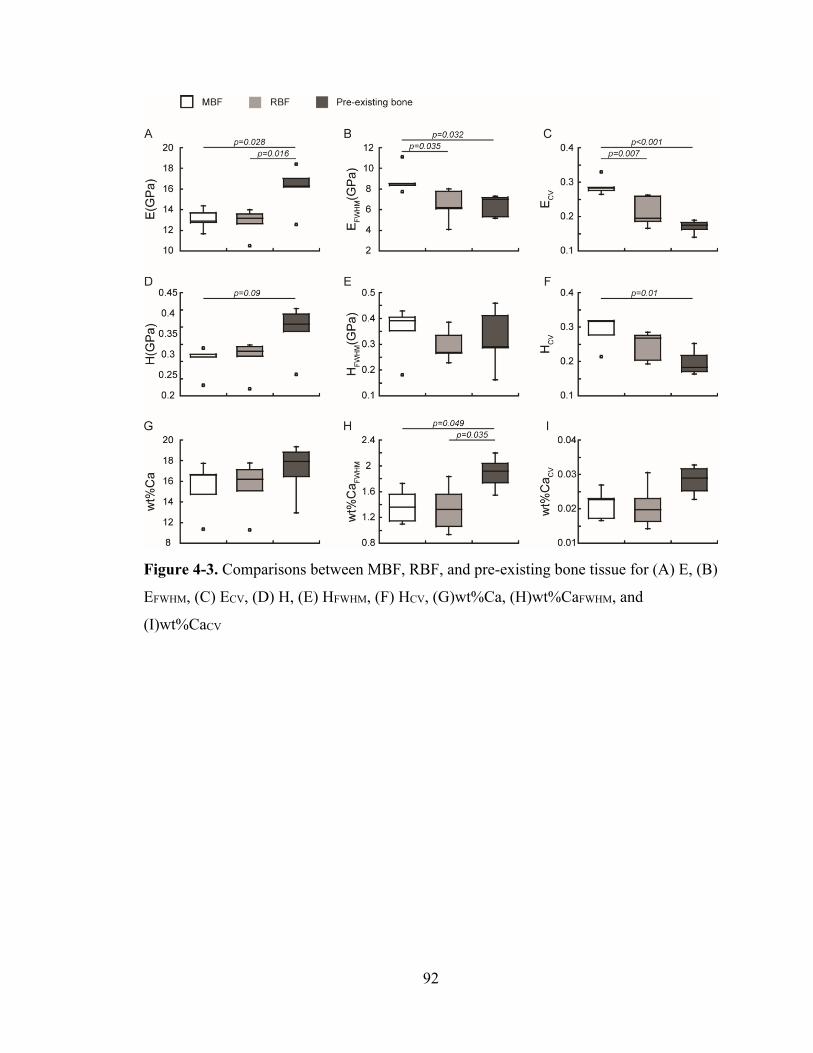
92
Figure 4-3. Comparisons between MBF, RBF, and pre-existing bone tissue for (A) E, (B)
EFWHM, (C) ECV, (D) H, (E) HFWHM, (F) HCV, (G)wt%Ca, (H)wt%CaFWHM, and
(I)wt%CaCV
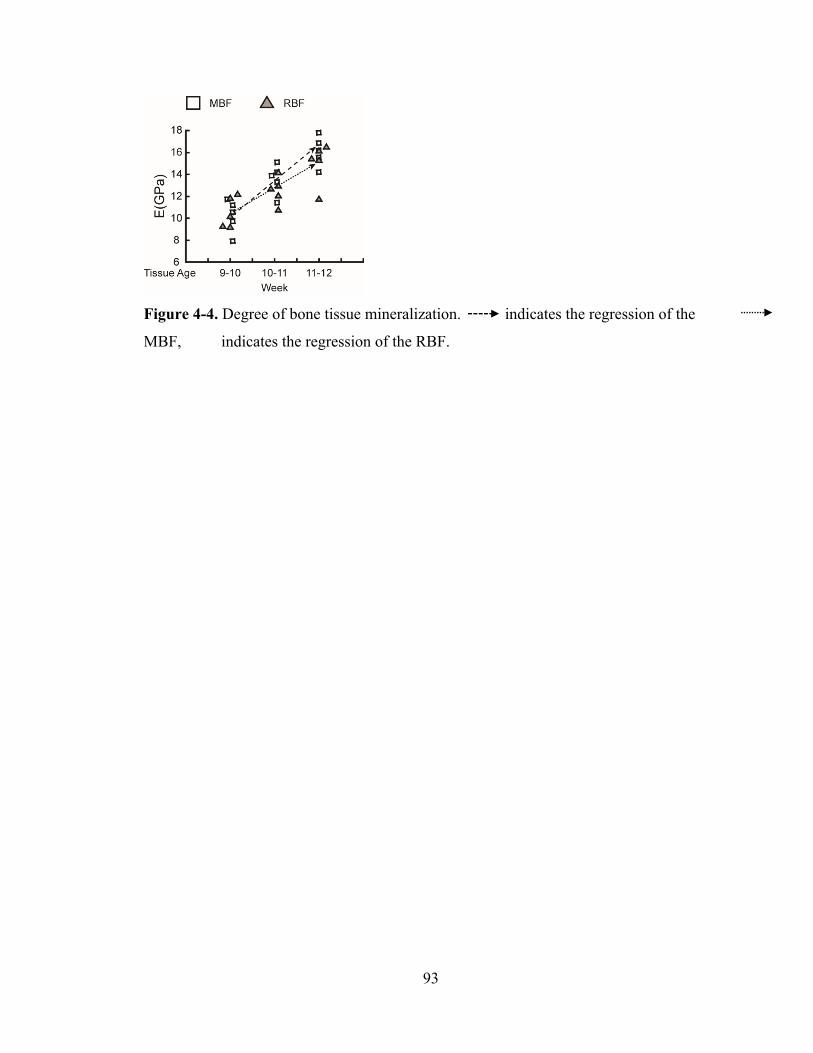
93
Figure 4-4. Degree of bone tissue mineralization. indicates the regression of the
MBF, indicates the regression of the RBF.
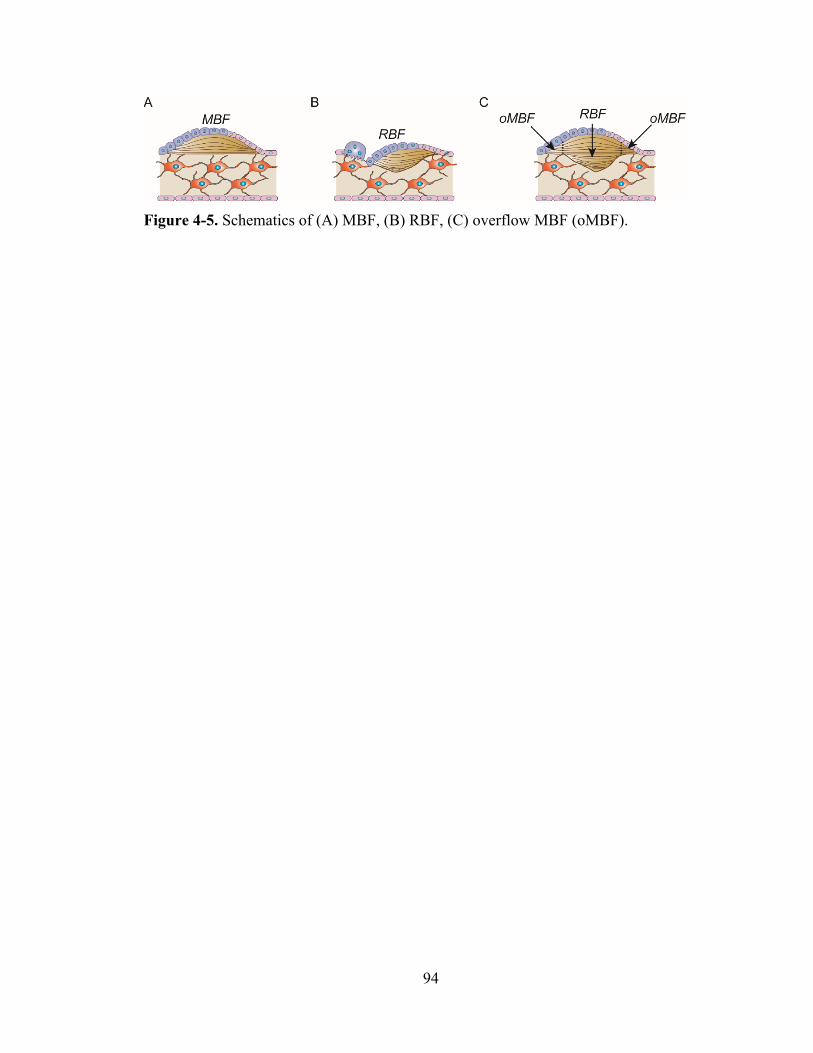
94
Figure 4-5. Schematics of (A) MBF, (B) RBF, (C) overflow MBF (oMBF).
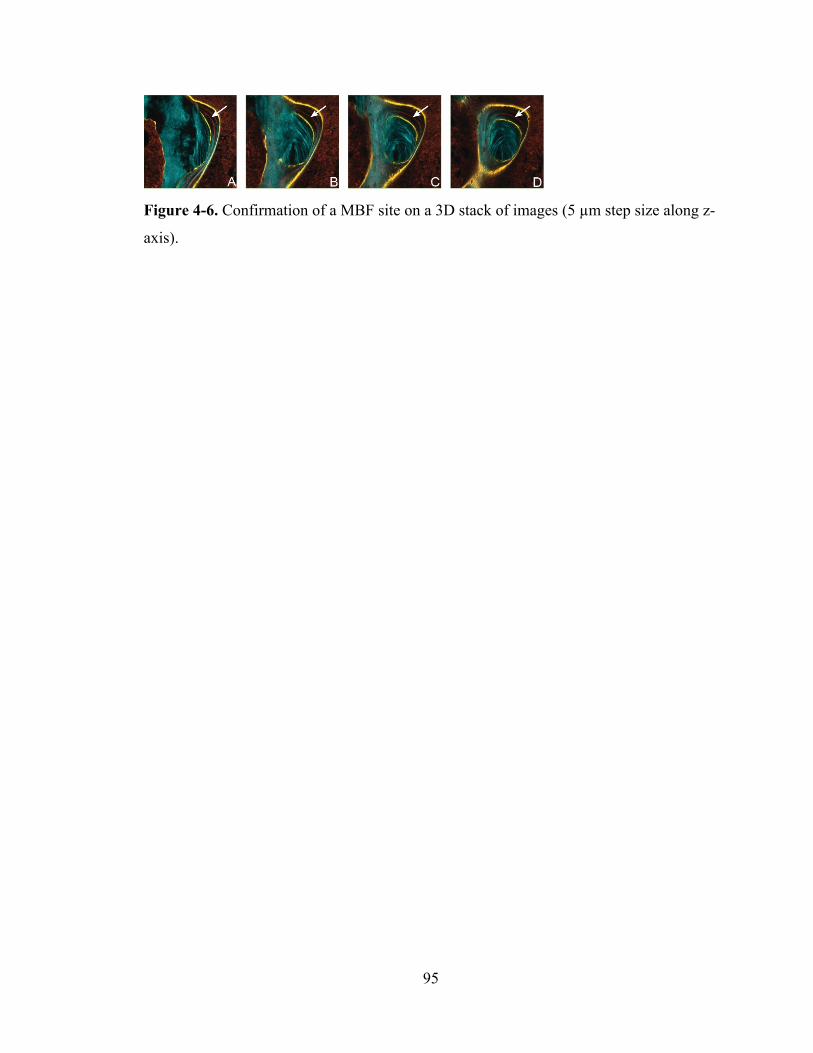
95
Figure 4-6. Confirmation of a MBF site on a 3D stack of images (5 µm step size along z-
axis).
96
4.6 References
1. Jee, W.S., X.Y. Tian, and R.B. Setterberg, Cancellous bone minimodeling‐based formation: a Frost, Takahashi legacy. J Musculoskelet Neuronal Interact, 2007. 7(3): p. 232‐9.
2. Erben, R.G., Trabecular and endocortical bone surfaces in the rat: modeling or remodeling? Anat Rec, 1996. 246(1): p. 39‐46.
3. Frost, H.M., Skeletal structural adaptations to mechanical usage (SATMU): 1. Redefining Wolff's law: the bone modeling problem. Anat Rec, 1990. 226(4): p. 403‐13.
4. Kobayashi, S., et al., Trabecular minimodeling in human iliac bone. Bone, 2003. 32(2): p. 163‐9.
5. Lindsay, R., et al., A novel tetracycline labeling schedule for longitudinal evaluation of the short‐term effects of anabolic therapy with a single iliac crest bone biopsy: early actions of teriparatide. J Bone Miner Res, 2006. 21(3): p. 366‐73.
6. Ma, Y.L., et al., Teriparatide increases bone formation in modeling and remodeling osteons and enhances IGF‐II immunoreactivity in postmenopausal women with osteoporosis. J Bone Miner Res, 2006. 21(6): p. 855‐64.
7. Dempster, D.W., et al., Remodeling‐ and Modeling‐Based Bone Formation With Teriparatide Versus Denosumab: A Longitudinal Analysis From Baseline to 3 Months in the AVA Study. J Bone Miner Res, 2018. 33(2): p. 298‐306.
8. Hodsman, A.B. and B.M. Steer, Early histomorphometric changes in response to parathyroid hormone therapy in osteoporosis: evidence for de novo bone formation on quiescent cancellous surfaces. Bone, 1993. 14(3): p. 523‐7.
9. Dempster, D.W., et al., Longitudinal Effects of Teriparatide or Zoledronic Acid on Bone Modeling‐ and Remodeling‐Based Formation in the SHOTZ Study. J Bone Miner Res, 2018. 33(4): p. 627‐633.
10. Ominsky, M.S., et al., Tissue‐level mechanisms responsible for the increase in bone formation and bone volume by sclerostin antibody. J Bone Miner Res, 2014. 29(6): p. 1424‐30.
11. Pennypacker, B.L., et al., Inhibition of cathepsin K increases modeling‐based bone formation, and improves cortical dimension and strength in adult ovariectomized monkeys. J Bone Miner Res, 2014. 29(8): p. 1847‐58.
12. Ominsky, M.S., et al., Sustained Modeling‐Based Bone Formation During Adulthood in Cynomolgus Monkeys May Contribute to Continuous BMD Gains With Denosumab. J Bone Miner Res, 2015. 30(7): p. 1280‐9.
13. Altman, A.R., et al., Enhanced individual trabecular repair and its mechanical implications in parathyroid hormone and alendronate treated rat tibial bone. J Biomech Eng, 2015. 137(1).
14. Altman, A.R., et al., A closer look at the immediate trabecula response to combined parathyroid hormone and alendronate treatment. Bone, 2014. 61: p. 149‐57.
15. de Bakker, C.M., et al., muCT‐based, in vivo dynamic bone histomorphometry allows 3D evaluation of the early responses of bone resorption and formation to PTH and alendronate combination therapy. Bone, 2015. 73: p. 198‐207.
16. Kostenuik, P.J., et al., OPG and PTH‐(1‐34) have additive effects on bone density and mechanical strength in osteopenic ovariectomized rats. Endocrinology, 2001. 142(10): p. 4295‐304.
17. Pierroz, D.D., et al., Are osteoclasts needed for the bone anabolic response to parathyroid hormone? A study of intermittent parathyroid hormone with denosumab or
97
alendronate in knock‐in mice expressing humanized RANKL. J Biol Chem, 2010. 285(36): p. 28164‐73.
18. Jilka, R.L., et al., Continuous elevation of PTH increases the number of osteoblasts via both osteoclast‐dependent and ‐independent mechanisms. J Bone Miner Res, 2010. 25(11): p. 2427‐37.
19. Cusano, N.E. and J.P. Bilezikian, Combination antiresorptive and osteoanabolic therapy for osteoporosis: we are not there yet. Curr Med Res Opin, 2011. 27(9): p. 1705‐7.
20. Donnelly, E., et al., Reduced cortical bone compositional heterogeneity with bisphosphonate treatment in postmenopausal women with intertrochanteric and subtrochanteric fractures. J Bone Miner Res, 2012. 27(3): p. 672‐8.
21. Donnelly, E., et al., Quasistatic and dynamic nanomechanical properties of cancellous bone tissue relate to collagen content and organization. Journal of Materials Research, 2006. 21(8): p. 2106‐2117.
22. Dyment, N.A., et al., High‐Throughput, Multi‐Image Cryohistology of Mineralized Tissues. J Vis Exp, 2016(115).
23. Chen, X., et al., Second harmonic generation microscopy for quantitative analysis of collagen fibrillar structure. Nat Protoc, 2012. 7(4): p. 654‐69.
24. Oliver, W.C. and G.M. Pharr, An Improved Technique for Determining Hardness and Elastic‐Modulus Using Load and Displacement Sensing Indentation Experiments. Journal of Materials Research, 1992. 7(6): p. 1564‐1583.
25. Oliver, W.C. and G.M. Pharr, Measurement of hardness and elastic modulus by instrumented indentation: Advances in understanding and refinements to methodology. Journal of Materials Research, 2004. 19(1): p. 3‐20.
26. Roschger, P., et al., Bone mineralization density distribution in health and disease. Bone, 2008. 42(3): p. 456‐66.
27. Roschger, P., et al., Validation of quantitative backscattered electron imaging for the measurement of mineral density distribution in human bone biopsies. Bone, 1998. 23(4): p. 319‐26.
28. Lloyd, G.E., Atomic‐Number and Crystallographic Contrast Images with the Sem ‐ a Review of Backscattered Electron Techniques. Mineralogical Magazine, 1987. 51(359): p. 3‐19.
29. Roschger, A., et al., Relationship between the v(2)PO(4)/amide III ratio assessed by Raman spectroscopy and the calcium content measured by quantitative backscattered electron microscopy in healthy human osteonal bone. J Biomed Opt, 2014. 19(6): p. 065002.
30. Ruffoni, D., et al., The bone mineralization density distribution as a fingerprint of the mineralization process. Bone, 2007. 40(5): p. 1308‐19.
31. Henriksen, K., et al., Local communication on and within bone controls bone remodeling. Bone, 2009. 44(6): p. 1026‐33.
32. Samadfam, R., Q. Xia, and D. Goltzman, Pretreatment with anticatabolic agents blunts but does not eliminate the skeletal anabolic response to parathyroid hormone in oophorectomized mice. Endocrinology, 2007. 148(6): p. 2778‐87.
33. Samadfam, R., Q. Xia, and D. Goltzman, Co‐treatment of PTH with osteoprotegerin or alendronate increases its anabolic effect on the skeleton of oophorectomized mice. J Bone Miner Res, 2007. 22(1): p. 55‐63.
34. Campbell, G.M., et al., The bone architecture is enhanced with combined PTH and alendronate treatment compared to monotherapy while maintaining the state of surface mineralization in the OVX rat. Bone, 2011. 49(2): p. 225‐32.
98
35. Altman, A., et al., Enhanced Individual Trabecular Repair and Its Mechanical Implications in PTH and Alendronate Treated Rat Tibial Bone. J Biomech Eng, 2015. 137(1): p. 011004‐1‐8.
36. Altman, A.R., et al., A closer look at the immediate trabecula response to combined parathyroid hormone and alendronate treatment. Bone, 2014. 61C: p. 149‐157.
37. De Bakker, C.M., et al., µCT‐based, in vivo dynamic bone histomorphometry allows 3D evaluation of the early responses of bone resorption and formation to PTH and alendronate combination therapy. Bone, 2015. 73: p. 198‐207.
38. Skedros, J.G., et al., The meaning of graylevels in backscattered electron images of bone. Journal of biomedical …, 1993.
99
CHAPTER 5
Summary and Future Work
5.1 Summary
Millions of people suffer from osteoporosis and related symptoms in the United
States. The current treatment strategies are either inducing bone formation using anabolic
agents or inhibiting bone resorption via antiresorptive agents. However, neither of these
strategies is ideal for osteoporosis treatment. Therefore, it is of great interest to
understand the mechanisms behind existing treatment options to better develop effective
treatment strategies. In this thesis, we began with understanding the structural and
developmental changes as well as withdrawal effects on the first FDA approved anabolic
agent, rhPTH (1-34). As a result of observing a continuous anabolic window, we
proposed a potential effective treatment strategy, the short cycles of PTH and
antiresorptive treatment regimen, which may lead to an increase in the number of newly
activated modeling-based bone formation (MBF) sites. Since recent studies suggested
that MBF may be a potential target of osteoporosis treatment, we developed an imaging
method coupled with a mechanical testing platform to examine the quasistatic
nanomechanical properties to compare MBF and remodeling-based bone formation
(RBF) sites on thick bone sections.
5.1.1 Chapter Two Summary
Intermittent parathyroid hormone (PTH) is the first FDA approved anabolic agent
for osteoporosis treatment. In clinical practice, the recommended duration of PTH
treatment is 18-24 months. Despite the potent effect of intermittent PTH treatment on
100
promoting new bone formation, BMD rapidly decreases upon discontinuation of PTH
administration. To uncover the mechanisms behind this adverse phenomenon, we first
examined the changes in tibial bone microarchitecture in both intact and ovariectomized
(OVX) rats using in vivo µCT. Significant tibial bone loss and bone microarchitecture
deterioration occurred in estrogen-deficient animals in response to discontinuation of
PTH treatment while no adverse effect was observed in intact rats. Intriguingly, there is a
continuous anabolic window upon the first week of withdrawal of PTH in estrogen-
deficient rats during which no significant change occurred in the number of osteoclasts
despite the number of osteoblasts starting to decrease. 2 weeks after discontinuation of
PTH treatment, changes in bone cells, an increase in the number of osteoclasts and a
decrease in the number of osteoblasts, led to a decline in bone mass and bone
microarchitecture. 9 weeks after withdrawal, the PTH treatment benefits completely
diminished. However, the observation of the continuous anabolic window upon early
withdrawal from PTH offers a new mechanism in support of a cyclic administration
regimen with repeated cycles of on and off PTH treatment. The cyclic treatment regimen
allows for rescue of the bone loss and efficiently maintains and improves upon the PTH
treatment benefits on bone as well as whole-bone mechanical properties. Overall, this
study provided a thorough characterization of the precise structural changes to investigate
the discontinuation of PTH in both intact and estrogen-deficient rat models as well as a
cyclic administration regimen. It was unexpected that no adverse effect was shown at the
tibial bone on the intact rat after discontinuation of PTH, further indicating that PTH
could be a viable treatment for a healthy individual. Moreover, our study discovered a
continuous anabolic window upon early withdrawal from PTH supporting the short cyclic

101
administration regimen of PTH. The current findings suggest that the cyclic treatment
regimen can alleviate bone deterioration and extend the treatment duration.
5.1.2 Chapter Three Summary
Bone mineral density rapidly decreases upon withdrawal from intermittent PTH
treatment despite its positive effects on promoting bone formation. Our previous study
showed a continuous anabolic window during the first week of PTH discontinuation in
OVX rats, which offers a new mechanism supporting a cyclic administration regimen
with repeated cycles of on and off PTH treatment to maximize the treatment duration.
Moreover, osteoclast number showed a significant increase following the anabolic
window. Therefore, we hypothesized that incorporating an antiresorptive treatment
during the off-PTH period of the cyclic treatment regimen may further improve the
treatment efficacy. To test this hypothesis, we directly compared changes in bone
structure following OVX surgery in rats with short cycles of PTH and Alendronate
(ALN) regimens. In vivo μCT-based longitudinal evaluation of trabecular microstructure
indicated that cyclic and alternating PTH-ALN significantly improved bone volume
fraction (BV/TV), trabecular thickness (Tb.Th), and structural model index (SMI) at the
proximal tibial trabecular bone when compared to the estrogen deficient animals with or
without short cycles of PTH and saline treatment. Additionally, short cycles of PTH and
ALN alternating regimens showed greater whole bone mechanical properties at lumbar
vertebrae L2. Taken together, results from this study indicate that the cyclic and
alternating treatment of PTH and ALN significantly improve the treatment efficacy on
bone microarchitecture and bone strength and extend PTH treatment duration.
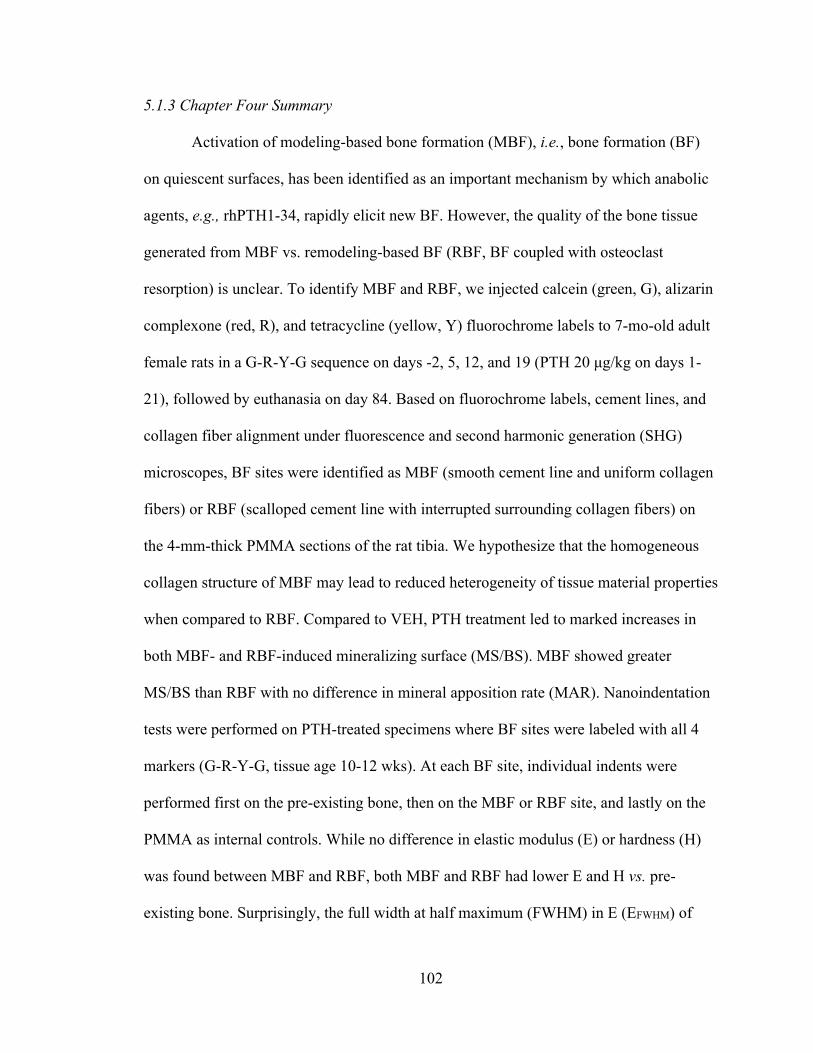
102
5.1.3 Chapter Four Summary
Activation of modeling-based bone formation (MBF), i.e., bone formation (BF)
on quiescent surfaces, has been identified as an important mechanism by which anabolic
agents, e.g., rhPTH1-34, rapidly elicit new BF. However, the quality of the bone tissue
generated from MBF vs. remodeling-based BF (RBF, BF coupled with osteoclast
resorption) is unclear. To identify MBF and RBF, we injected calcein (green, G), alizarin
complexone (red, R), and tetracycline (yellow, Y) fluorochrome labels to 7-mo-old adult
female rats in a G-R-Y-G sequence on days -2, 5, 12, and 19 (PTH 20 μg/kg on days 1-
21), followed by euthanasia on day 84. Based on fluorochrome labels, cement lines, and
collagen fiber alignment under fluorescence and second harmonic generation (SHG)
microscopes, BF sites were identified as MBF (smooth cement line and uniform collagen
fibers) or RBF (scalloped cement line with interrupted surrounding collagen fibers) on
the 4-mm-thick PMMA sections of the rat tibia. We hypothesize that the homogeneous
collagen structure of MBF may lead to reduced heterogeneity of tissue material properties
when compared to RBF. Compared to VEH, PTH treatment led to marked increases in
both MBF- and RBF-induced mineralizing surface (MS/BS). MBF showed greater
MS/BS than RBF with no difference in mineral apposition rate (MAR). Nanoindentation
tests were performed on PTH-treated specimens where BF sites were labeled with all 4
markers (G-R-Y-G, tissue age 10-12 wks). At each BF site, individual indents were
performed first on the pre-existing bone, then on the MBF or RBF site, and lastly on the
PMMA as internal controls. While no difference in elastic modulus (E) or hardness (H)
was found between MBF and RBF, both MBF and RBF had lower E and H vs. pre-
existing bone. Surprisingly, the full width at half maximum (FWHM) in E (EFWHM) of
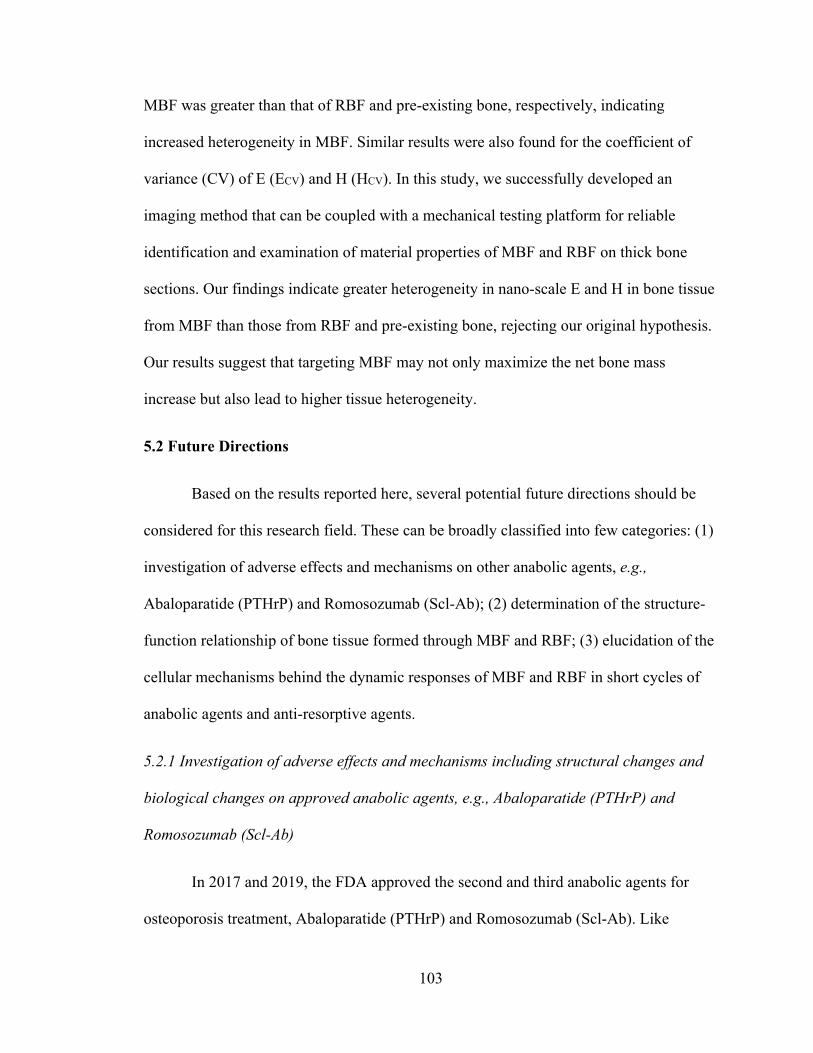
103
MBF was greater than that of RBF and pre-existing bone, respectively, indicating
increased heterogeneity in MBF. Similar results were also found for the coefficient of
variance (CV) of E (ECV) and H (HCV). In this study, we successfully developed an
imaging method that can be coupled with a mechanical testing platform for reliable
identification and examination of material properties of MBF and RBF on thick bone
sections. Our findings indicate greater heterogeneity in nano-scale E and H in bone tissue
from MBF than those from RBF and pre-existing bone, rejecting our original hypothesis.
Our results suggest that targeting MBF may not only maximize the net bone mass
increase but also lead to higher tissue heterogeneity.
5.2 Future Directions
Based on the results reported here, several potential future directions should be
considered for this research field. These can be broadly classified into few categories: (1)
investigation of adverse effects and mechanisms on other anabolic agents, e.g.,
Abaloparatide (PTHrP) and Romosozumab (Scl-Ab); (2) determination of the structure-
function relationship of bone tissue formed through MBF and RBF; (3) elucidation of the
cellular mechanisms behind the dynamic responses of MBF and RBF in short cycles of
anabolic agents and anti-resorptive agents.
5.2.1 Investigation of adverse effects and mechanisms including structural changes and
biological changes on approved anabolic agents, e.g., Abaloparatide (PTHrP) and
Romosozumab (Scl-Ab)
In 2017 and 2019, the FDA approved the second and third anabolic agents for
osteoporosis treatment, Abaloparatide (PTHrP) and Romosozumab (Scl-Ab). Like

104
teraparitide (PTH), both new anabolic agents increase bone mineral density (BMD) by
enhancing bone formation [1-4]. However, the treatment efficacy of both drugs,
compared to teraparitide, on bone microarchitecture are unclear. Moreover, due to the
diminished treatment benefit of PTH upon discontinuation in estrogen-deficient bone, it
is of interest to investigate the withdrawal effects on the new drugs. Our pilot study
evaluating longitudinal changes in tibial trabecular bone after PTHrP withdrawal at the
proximal tibia also indicated a continuous anabolic window upon early discontinuation of
PTHrP and a rapid bone loss afterward. In conjunction with the results in chapter two,
PTH and PTHrP efficiently increase bone volume by thickening the remaining
trabeculae. Both treatments require follow-up with antiresorptive therapy upon
discontinuation to maintain their treatment benefits. Further investigation into a cyclic
administration regimen of PTHrP would be beneficial. Furthermore, in addition to
structural changes, the biological changes of trabecular bone, e.g., cellular levels and
molecular levels, using ovariectomized rats after discontinuation of anabolic drugs
remains unclear and should be evaluated in future investigations.
5.2.2 Determination of the structure-function relationship of bone tissue formed through
MBF and RBF
In chapter four, we developed a novel imaging method, allowing for reliable
identification and examination of material properties of RBF and MBF on thick bone
sections. Future studies are required to examine the material composition of bone tissue
from MBF and RBF to elucidate the structural mechanisms behind the different material
properties between bone tissues from MBF and RBF. Addressing the mechanisms behind
the difference in the dynamics of bone tissue maturation structural mechanisms, this will
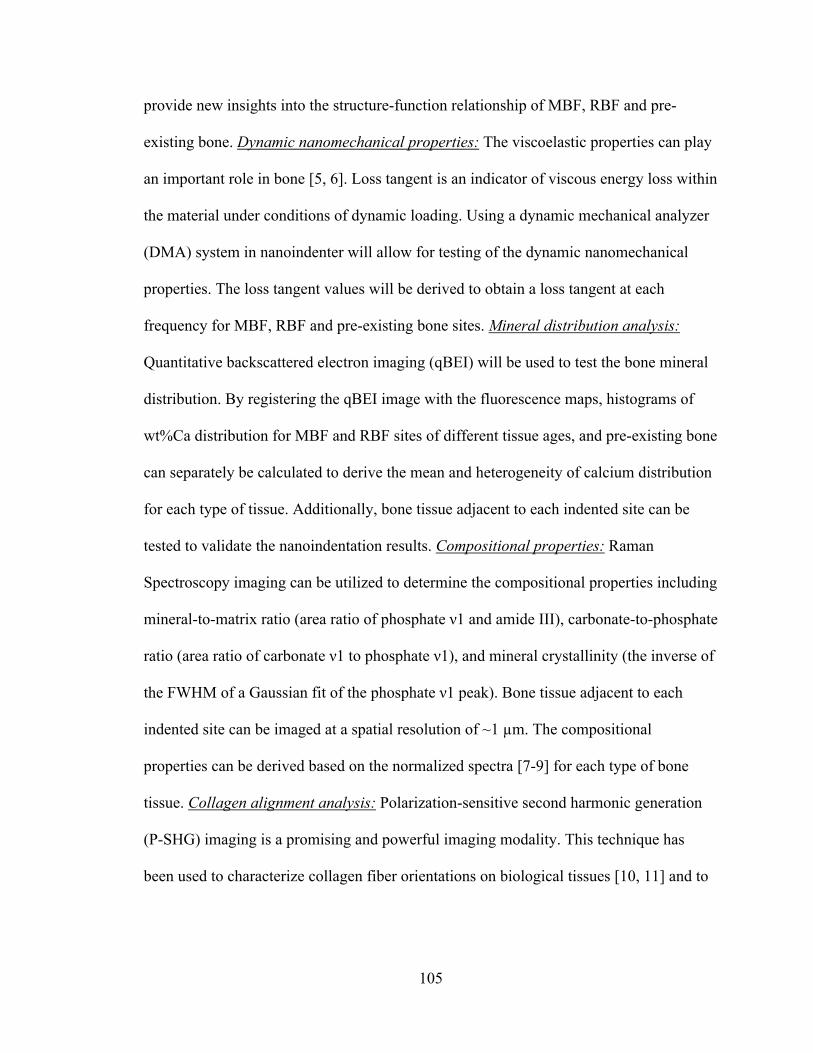
105
provide new insights into the structure-function relationship of MBF, RBF and pre-
existing bone. Dynamic nanomechanical properties: The viscoelastic properties can play
an important role in bone [5, 6]. Loss tangent is an indicator of viscous energy loss within
the material under conditions of dynamic loading. Using a dynamic mechanical analyzer
(DMA) system in nanoindenter will allow for testing of the dynamic nanomechanical
properties. The loss tangent values will be derived to obtain a loss tangent at each
frequency for MBF, RBF and pre-existing bone sites. Mineral distribution analysis:
Quantitative backscattered electron imaging (qBEI) will be used to test the bone mineral
distribution. By registering the qBEI image with the fluorescence maps, histograms of
wt%Ca distribution for MBF and RBF sites of different tissue ages, and pre-existing bone
can separately be calculated to derive the mean and heterogeneity of calcium distribution
for each type of tissue. Additionally, bone tissue adjacent to each indented site can be
tested to validate the nanoindentation results. Compositional properties: Raman
Spectroscopy imaging can be utilized to determine the compositional properties including
mineral-to-matrix ratio (area ratio of phosphate ν1 and amide III), carbonate-to-phosphate
ratio (area ratio of carbonate ν1 to phosphate ν1), and mineral crystallinity (the inverse of
the FWHM of a Gaussian fit of the phosphate ν1 peak). Bone tissue adjacent to each
indented site can be imaged at a spatial resolution of ~1 µm. The compositional
properties can be derived based on the normalized spectra [7-9] for each type of bone
tissue. Collagen alignment analysis: Polarization-sensitive second harmonic generation
(P-SHG) imaging is a promising and powerful imaging modality. This technique has
been used to characterize collagen fiber orientations on biological tissues [10, 11] and to

106
diagnose a wide range of diseases [11, 12]. In the future study, P-SHG can be used to
map the degree of alignment of the collagen fibers [13] within regions of MBF and RBF.
5.2.3 Elucidation of the cellular mechanisms behind the dynamic responses of MBF and
RBF in short cycles of anabolic agents and anti-resorptive agents
Due to the observation of the rapid bone loss after discontinuation of anabolic
agents, it has been suggested that antiresorptive agents should be used in treatment after
the discontinuation of anabolic agents [14, 15]. Additionally, studies have shown that
modeling-based bone formation can be stimulated on the trabecular bone surface using
intermittent PTH with co-treatment of an anti-resorptive drug [15-21]. Together with the
conclusion in chapters three and four, short cycles of anabolic agents and anti-resorptive
agents may increase the number of newly activated MBF, retain the RBF and quiescent
bone, and improve bone tissue heterogeneity. Therefore, further investigation of the
cellular mechanisms behind the dynamic responses of MBF and RBF will provide more
insights into the potential osteoporosis target, modeling-based bone formation.
5.3 Final Conclusions
The search for effective osteoporosis treatment targets continues. Modeling-based
bone formation (MBF) could be of significant value. However, many unknowns still
exist, emphasizing the need for further investigations to shed light on MBF. The studies
in this thesis provided important information on structural, cellular and mechanical
effects on the skeleton in both intact and estrogen-deficient bone. The findings and the
methods reported here create the frameworks for future MBF investigations. In addition,
the translation of these findings and methods to a clinical setting will not only further

107
improve the understanding of MBF but also provide insights into developing effective
treatment strategies.
108
5.4 References
1. Ominsky, M.S., et al., Tissue‐level mechanisms responsible for the increase in bone formation and bone volume by sclerostin antibody. J Bone Miner Res, 2014. 29(6): p. 1424‐30.
2. Bandeira, L. and J.P. Bilezikian, Novel Therapies for Postmenopausal Osteoporosis. Endocrinol Metab Clin North Am, 2017. 46(1): p. 207‐219.
3. Hattersley, G., et al., Binding Selectivity of Abaloparatide for PTH‐Type‐1‐Receptor Conformations and Effects on Downstream Signaling. Endocrinology, 2016. 157(1): p. 141‐9.
4. McClung, M.R., Romosozumab for the treatment of osteoporosis. Osteoporos Sarcopenia, 2018. 4(1): p. 11‐15.
5. Yamashita, J., et al., The use of dynamic mechanical analysis to assess the viscoelastic properties of human cortical bone. J Biomed Mater Res, 2001. 58(1): p. 47‐53.
6. Donnelly, E., et al., Quasistatic and dynamic nanomechanical properties of cancellous bone tissue relate to collagen content and organization. Journal of Materials Research, 2006. 21(8): p. 2106‐2117.
7. Morris, M.D. and G.S. Mandair, Raman assessment of bone quality. Clin Orthop Relat Res, 2011. 469(8): p. 2160‐9.
8. Akkus, O., F. Adar, and M.B. Schaffler, Age‐related changes in physicochemical properties of mineral crystals are related to impaired mechanical function of cortical bone. Bone, 2004. 34(3): p. 443‐53.
9. Lloyd, A.A., et al., Atypical fracture with long‐term bisphosphonate therapy is associated with altered cortical composition and reduced fracture resistance. Proc Natl Acad Sci U S A, 2017. 114(33): p. 8722‐8727.
10. Yasui, T., Y. Tohno, and T. Araki, Determination of collagen fiber orientation in human tissue by use of polarization measurement of molecular second‐harmonic‐generation light. Applied optics, 2004. 43(14): p. 2861‐7.
11. Chen, X., et al., Second harmonic generation microscopy for quantitative analysis of collagen fibrillar structure. Nature protocols, 2012. 7(4): p. 654‐69.
12. Campagnola, P., Second harmonic generation imaging microscopy: applications to diseases diagnostics. Analytical chemistry, 2011. 83(9): p. 3224‐31.
13. Mansfield, J.C., et al., Collagen reorganization in cartilage under strain probed by polarization sensitive second harmonic generation microscopy. J R Soc Interface, 2019. 16(150): p. 20180611.
14. Bilezikian, J.P. and M.R. Rubin, Combination/sequential therapies for anabolic and antiresorptive skeletal agents for osteoporosis. Curr Osteoporos Rep, 2006. 4(1): p. 5‐13.
15. Cusano, N.E. and J.P. Bilezikian, Combination antiresorptive and osteoanabolic therapy for osteoporosis: we are not there yet. Curr Med Res Opin, 2011. 27(9): p. 1705‐7.
16. Altman, A.R., et al., Enhanced individual trabecular repair and its mechanical implications in parathyroid hormone and alendronate treated rat tibial bone. J Biomech Eng, 2015. 137(1).
17. Altman, A.R., et al., A closer look at the immediate trabecula response to combined parathyroid hormone and alendronate treatment. Bone, 2014. 61: p. 149‐57.
18. de Bakker, C.M., et al., muCT‐based, in vivo dynamic bone histomorphometry allows 3D evaluation of the early responses of bone resorption and formation to PTH and alendronate combination therapy. Bone, 2015. 73: p. 198‐207.

109
19. Pierroz, D.D., et al., Are osteoclasts needed for the bone anabolic response to parathyroid hormone? A study of intermittent parathyroid hormone with denosumab or alendronate in knock‐in mice expressing humanized RANKL. J Biol Chem, 2010. 285(36): p. 28164‐73.
20. Lindsay, R., et al., A novel tetracycline labeling schedule for longitudinal evaluation of the short‐term effects of anabolic therapy with a single iliac crest bone biopsy: early actions of teriparatide. J Bone Miner Res, 2006. 21(3): p. 366‐73.
21. Jilka, R.L., et al., Continuous elevation of PTH increases the number of osteoblasts via both osteoclast‐dependent and ‐independent mechanisms. J Bone Miner Res, 2010. 25(11): p. 2427‐37.


