
San Diego County Food Safety Program
Review Prepared by:
The National Environmental Health Association (NEHA) for the Department of Environmental Health (DEH),
Food and Housing Division (FHD)
June 17,2008
2
Table of Contents I. ABSTRACT .................................................................................................................... 3 II. EXECUTIVE SUMMARY................................................................................................. 4 SUMMARY OF RECOMMENDATIONS ........................................................................... 10
III. BACKGROUND/INTRODUCTION .................................................................................. 12 IV. METHODS .................................................................................................................. 14 V. RESULTS..................................................................................................................... 21
Section A - Assessing Food Safety Risks ....................................................................... 21 Section B ‐ Communicating Food Safety Risks ............................................................. 28 Section C ‐ Managing Food Safety Risks ...................................................................... 34 Section D ‐ Verifying Quality of Service ........................................................................ 45
VI. CONCLUSION .............................................................................................................. 52 SUMMARY OF RECOMMENDATIONS ........................................................................... 52
REFERENCES ...................................................................................................................... 55 APPENDIX A ....................................................................................................................... 56 NEHA Food Program Review ‐ Site Visit Agenda .......................................................... 56
APPENDIX B ....................................................................................................................... 57 RISK‐BASED MANAGEMENT INSPECTION PROGRAMS ................................................. 57
APPENDIX C ....................................................................................................................... 60 [Wisconsin] Program Standards Evaluation Tool 2007,................................................ 60 Agent Self‐Assessment Form ........................................................................................ 60
APPENDIX D ....................................................................................................................... 61 Dashboard Report -2005-2007 and ............................................................................... 61 TEAM Excellence Risk-Based Food Safety System Executive Summary .................. 61
APPENDIX E ....................................................................................................................... 62 Technology Upgrade Studies by: .................................................................................. 62 1. Tacoma‐Pierce County Health Department ........................................................... 62 2. Baltimore County Health Department ................................................................... 62
APPENDIX F ....................................................................................................................... 63 Evaluation Team – Food Safety Profiles ...................................................................... 63
3
I. ABSTRACT
At the request of the San Diego County, Department of Environmental Health
(DEH), Food and Housing Division (FHD), five food safety program experts from the
National Environmental Health Association (NEHA) conducted a review of the San
Diego County’s risk-based food safety program. This review was conducted during
the first quarter of 2008.
Methods utilized to perform the review included reference materials provided
by DEH/FHD, a three-day site visit, and the use of a program standards evaluation
tool that is based in the FDA “National Retail Food Program Standards
Recommendation.” The findings indicate an exceptionally strong program that is
based in risk management principles. The panel made recommendations in the areas
of data management upgrades, messaging for the grading system and staffing
capacity.
4
II. EXECUTIVE SUMMARY
Introduction
This report describes a program review of the Food Safety Program in San
Diego County, California. At the request of the Department of Environmental Health
(DEH), Food and Housing Division (FHD), which administers the program, five food
safety experts from the National Environmental Health Association (NEHA)
conducted the review in the first quarter of 2008. The food safety experts selected for
the review of the FHD Food Safety Program were selected for their ability as a source
of objective information and their judgment of the program within the context of a
large county-based food protection program.
Background
The Department of Environmental Health (DEH), Food and Housing Division
(FHD), developed and implemented a system that incorporated a risk analysis
framework with four areas of focus: assessing risk, communicating risk, managing
risk, and verifying quality of service. These conceptual pieces make up the TEAM
Excellence Performance Measurement System which was developed along with
DEH’s stakeholders in 2001 (See Appendix D for the Executive Summary and latest
Dashboard Reports developed by DEH/FHD). Since that time the department has
been using this framework to measure performance and evaluate the effectiveness of
their objectives and goals. The primary goal of the program is to reduce foodborne
illness. Objectives have been developed around the risk-based philosophy of public
health interventions that are designed to reduce the risk of foodborne illnesses.
One of the reasons this evaluation is significant is that local food inspection
programs in California are independent and do not have routine state or federal
oversight. San Diego County is one of 29 programs (of the 62 California programs)
that participates in the FDA Retail Food Program standards process as an alternative
way to evaluate food safety programs. San Diego County received the Samuel J.
Crumbine Consumer Protection Award for excellence in 1959 for the first restaurant
grading system in the country. The Department of Environmental Health won the
5
award again in 2005 for the TEAM Excellence model. This demonstrates the
department’s long commitment to public health and food safety.
The review was conducted in January during a 3-day site visit, which
consisted of a combination of presentations, discussions, and ride-along inspections
with the environmental health specialists. The review panel met with FHD
supervisors, FHD industry stakeholders, and DEH/FHD leadership. The panel also
met with the epidemiology staff from the Health and Human Services Agency
(HHSA). Prior to the visit and afterwards, the panel reviewed materials about the
TEAM Excellence program that were provided by DEH.
Wisconsin Program Standards Evaluation Tool Results
The “Wisconsin Program Standards Evaluation Tool” was used in addition to
the program materials to gather information about the program. This tool is a self-
assessment form that was developed from the FDA National Retail Food Program
Standards Recommendation (created 2004 and updated 2007). Upon analysis of the
data provided by DEH the panel found a solid foundation for food safety. The self-
evaluation review indicated that the San Diego food program has undertaken efforts
in all food program assessment areas recommended by the FDA.
SUMMARY OF PANEL REVIEW
Assessing Food Safety Risks
The panel members noted strengths in FHD’s inspection focus on mitigating
risk factors most likely to cause foodborne illness. This follows the current
conventions used successfully in many jurisdictions around the country that are
modeled after the FDA recommended risk-based inspection program. The panel also
noted the positive impact of a mandatory system that is in place to require some level
of training of all food handlers in addition to a standardized test. Another program
strength is the long history (25 years) of using Active Managerial Control
A-B-C Grading System
The program uses a grading system that has been in existence for nearly six
decades. It recently came under scrutiny. Panel members noted that the internal
6
debate about the grading system reflects the national debate on this issue. There are
differing opinions as to whether or not inspections should be scored or graded and if
scored and graded, what type of scoring and grading system should be used, as well
as how those scores/grades should be published, or if they should be published at all.
In recent years, the FDA recommendations have changed focus away from scores.
However, some professionals believe that some form of inspection scoring is valuable
for both management and establishments to compare inspections from year to year.
The potential problem for the public to understand the nuances of the grading system
is that, it may be safe to eat at a restaurant with either an “A” or a “B” score. In both
cases, risk factors are corrected during the inspection and the restaurant remains open.
According to data gathered by DEH in surveys of public perception, 74% of
respondents report that they would not eat at a restaurant that does not display an “A”
placard. The panel also noted the effect that the grading system may have on
individual inspectors, establishment operators, and their relationships. The report
encourages DEH to continue the discussion and evaluation on the best way to ensure
public food safety, and on the best method to communicate the actuality of risk
factors to the public.
Communicating Food Safety Risks
Panel members learned that an important part of the program is to increase
stakeholder knowledge of food safety issues with the hope that this communication
will naturally lead to the outcome of improved food preparation practices which in
turn will lead to reduced foodborne illnesses. Panel members noted that the food
industry is very supportive of the San Diego food program and observed strength the
department’s strong focus on community outreach activities and community training.
The panel commented favorably the methods of notification such as “Constant
Contact,” an email notification list initiated by DEH and the posting of inspection
information on the Web site as an effective system for providing new or urgent
information to the food operators and the public. The panel also noted the good
relationship with the police department and the Border task force for enforcement
problems.

7
The panel members were very impressed with the collaboration process that
demonstrates a solid relationship with the San Diego Health and Human Services
Agency (HHSA). This relationship provides access to an excellent epidemiology
program, real-time disease surveillance systems, and outbreak investigation. HHSA’s
work with community reporting and partnerships with local hospitals should also be
noted as outstanding. FHD also has a well documented protocol for investigation of
foodborne illness complaints.
Unlicensed Operations
Although the Food Safety Program has an excellent epidemiology connection
with the Public Health Department that is able to track cases of foodborne illness,
many foodborne outbreaks do not come from licensed establishments. Additional
attention may be needed to prevent future outbreaks from unlicensed food vendors.
Measuring Program Effectiveness
The panel noted that DEH may have set some goals that are unachievable
because the objectives measure things that the department cannot control. For
example, the panel recommends reconsidering the practice of using county-wide
incidence of Salmonella/Campylobacter as an indicator of program success.
Introduction of cross-border infections and emerging pathogens makes this an
inherently suspect metric, and may open the program to unnecessary and invalid
criticism.
Managing Food Safety Risks
The FDA National Retail Food Program Standards Recommendation from
2004 provided a basis for the revision of San Diego’s inspection reports in 2004.
These recommended standards (which were updated in 2007) provide guidelines for a
risk factor and intervention methodology that is being adopted across the nation in
local health department jurisdictions. All panel members were familiar with this
methodology and had direct experience with implementing a risk based system within
their own jurisdictions.

8
Data Collection and Management
Data collection and management is accomplished with a system called KIVA
and TELEForms software which provides the capability for scanning inspection
reports and generating various reports. The KIVA system is used throughout other
county agencies. The department has also used Geographic Information Systems
(GIS). The panel acknowledged the many improvements DEH has made to the
system, especially in its interfaces with the public and FHD personnel. However, the
panel found the system to be cumbersome, inefficient, lacking uniformity and not
very user friendly. Recommendations were made for an automated field system and a
system that could interface with the data management system which would reduce the
dependency on the KIVA system. Recommendations were also made to hire
additional information technology (IT) staff.
Enforcement and Compliance
The review team was unable perform a comprehensive evaluation on the
effectiveness of the enforcement procedures during the site visit. DEH management
explained that a more consistent and uniform enforcement and compliance process
had been implemented after gaps in this area were identified in the initial baseline
report and that it had been effective in contributing to the downward trend in major
risk factor violations. The panel noted strength in the three-tiered enforcement
system, which includes immediate corrective action, assisting operators with
implementing long-term control systems by using risk control plans (RCP’s), and
formal enforcement action if the first two do not work. The panel also found the
"Marking Guide" Handbook a very well-done tool and very useful to help standardize
the staff.
Verifying Quality of Service
The panel found the management, which are recognized as leaders in food
safety in California to be positive, accessible and transparent. Staff training is
encouraged. The panel found the staff training manual and program impressive.
Staff reports that communication is open at all levels of the food safety division. Of
the staff observed (about 10%), they were well-trained, enthusiastic and demonstrated

9
a priority in educating operators during the inspection. A strength that serves to
standardize the workforce is that all inspectors are required to be California
Registered Environmental Health Specialists (REHS) by state law.
Staffing Capacity and Workload
The panel was unable to completely evaluate the workload requirements of
the staff though they noted high expectations, reports of stress, and a heavy workload
for environmental health specialists that could create the potential for burnout. The
panel found through a limited random selection of about 30 file reviews that
inspections do not appear to be reaching the four annual inspections per facility the
program proposed for high-risk establishments. The panel acknowledged the impacts
as resources were reallocated due to major fires, recent food recalls, foodborne
outbreaks due to illegal food vendors and the work that went into implementing the
new CalCode. The panel also noted that there was at least a three-year delay in filling
needed positions but that recently seven new environmental health specialists had
been hired and trained.
Conclusion
Overall, the Panel found that the San Diego Food Program is an excellent
program; however, there are a few program areas that warrant further consideration
and attention by management. It is important to note that virtually every area of
concern that the panel found has already been identified and discussed by DEH/FHD
management. In most cases, improvements had already begun to be implemented by
management and staff. The recommendations presented in this program review must
be considered in this context. The Food Program operates in a very dynamic
environment and the challenge that DEH/FHD has excelled in is its ability to adapt to
and effectively manage their resources to meet new challenges under some difficult
conditions.

10
SUMMARY OF RECOMMENDATIONS Recommendation I: A-B-C Grading system - It is recommended that the FHD review
the A-B-C Grading System to determine if the public health messages communicating
risk that are conveyed by the present placard system are accurately understood by the
public, and if not, how those public communications can be improved.
Recommendation II: Unlicensed Establishments – It is recommended that the FHD
reconsider the food safety program’s broad goal of reducing foodborne illness to a
more realistically defined goal of reducing the number of Salmonella and
Campylobacter cases or outbreaks in “licensed” facilities.
Recommendation III: Re-examine Food Establishment Classifications – It is
recommended that the FHD re-examine establishment classifications to reduce the
number of "full-service" facilities that actually pose minimal risk.
Recommendation IV: Automating the Manual Inspection Forms and the Field
Inspection System – It is recommended that the DEH/FHD continue to research how
an automated field inspection system can be integrated within the current KIVA
system to support the current food program.
Recommendation V: Need for a Separate Data Management System –It is
recommended that the DEH/FHD research the feasibility of developing a separate
system with all the features needed to manage and evaluate the FHD program that can
interface with the KIVA system.
Recommendation VI: Additional IT Staff – It is recommended that DEH/FHD
provide additional IT staff for adequate technical support, maintenance of database,
and preparing management reports.
11
Recommendation VII: Staff Capacity –It is recommended that DEH review the
budget planning process and implement changes, if possible, so that new employees
can be hired in a timely manner.
Recommendation VIII: Expected Workloads for Field Staff – It is recommended that
DEH/FHD review the data to determine if the expectations for the number of
inspections conducted per day/per year for field staff is reasonable and that
adjustments be made in staffing levels, if necessary, to reflect consistently achievable
inspection objectives by staff.
12
III. BACKGROUND/INTRODUCTION
The San Diego County Department of Environmental Health (DEH), Food and
Housing Division (FHD) has a long history of leadership, initiative, and commitment to
public health in the food safety program that it administers. The program received the
1959 Samuel J. Crumbine Consumer Protection Award for excellence when it developed
the first restaurant grading system in the country. In addition, the program won the
coveted award again in 2005 for a food safety program model called the “Team
Excellence Performance Measurement System” which implemented risk-based
intervention strategies. According to the program materials, the implementation of
strategies that have a goal of reducing foodborne illness resulted in reduced trends in
major risk factor violations in retail food facilities, improved food employee behaviors
and food preparation practices, and enhanced foodborne illness surveillance methods that
have identified other food safety risks in the community. (See Appendix D - Team
Excellence, Executive Summary).
With an understanding that all inspection programs require a balance between
enforcement and education, FHD operates with an underlying philosophy of education
and consultancy first, and regulation (enforcement) when needed. According to the
department leadership and staff, public risk of foodborne illness guides their decision
making in regards to food safety and the inspection process.
Demographics
DEH is responsible for more than 12,000 regulated food facilities (6800
restaurants, 2500 markets, and 1300 mobile food facilities) within San Diego County,
which has a population of 3 million people and occupies area of 4261 square miles. The
complex demographics include 18 cities in the county and a growing ethnic population
that consists of immigrants from Mexico, Central America, Southeast Asia, the Middle
East and Eastern Europe, as well as refugee populations from African countries.
According to the demographics provided to the team, Hispanics are the largest and fastest
growing minority population. In addition to significant immigrant and ethnic populations,
San Diego County is home to 15,000 Native Americans and five major military

13
installations. (See appendix D - Team Excellence, Executive Summary and presentation
at on-site visit)
Resources
The Food and Housing Division’s food safety program operates with a budget of
over $7.2 million dollars. The program is run by 73 professional and support staff
employed by FHD and it is funded by food facility permit fees that allow the program to
operate as full-cost recovery. In other words, it is not dependent on the San Diego County
general purpose revenues. FHD management explained that this can offer stable staffing
and resources to the program. These resources are focused on activities and a system of
inspection frequencies that aim to reduce the risk of foodborne illness. Risk factors that
have been identified by the Centers for Disease Control and Prevention (CDC) as the
most prevalent contributing factor to foodborne illness or injury include: food from
unsafe sources, improper holding temperatures, inadequate cooking, contaminated
equipment, and poor personal hygiene.
Collaboration
Stakeholders are given the opportunity to provide input to the current and long-
range goals and objectives in annual meetings with industry groups such as the California
Grocers Association, the San Diego Food and Beverage Association, the Neighborhood
Market Association, and the San Diego Chapter of the California Restaurant Association.
The review panel members met with several representatives from industry groups and
their findings of this exchange are reported later in this paper.
Background of Study
The desire for an independent review by experts in the field of food safety was
prompted initially as a result of two media reports that made front page news in the San
Diego Union-Tribune in July, 2007. The stories included both positive and negative
aspects of FHD’s food safety program. However, serious questions about the reliability of
the popular and long standing grading system and inspection scores were reported as well
as general criticisms of the program. These assertions were based on a 4-month analysis
of program data that was provided by DEH to the San Diego Tribune. The specific
criticisms fell into several categories which included training and oversight of
14
environmental health specialists, uniformity in noting and scoring inspection violations,
policies used to restore an “A” grade to a facility following a downgrade and enforcement
procedures.
This evaluation is significant for several reasons. First, local food inspection
programs in California are independent and do not have state or federal oversight.
Although, there is no routine program evaluation of California food programs by the
state, it should be noted that 29 of the 62 California food safety programs, including San
Diego County, are participating in the FDA Retail Food Program Standards Process as an
alternative way to evaluate food safety programs.
Secondly, this evaluation is significant because it was requested by the agency
being evaluated—the San Diego County Department of Environmental Health. Program
managers have embraced this opportunity for a completely independent program
evaluation by experts experienced in food safety inspection programs.
IV. METHODS
Selecting a Panel of Experts
Five review panel members were asked to perform this evaluation by the National
Environmental Health Association (NEHA) and approved by the San Diego Department
of Environmental Health (DEH) management. NEHA provided oversight and
coordination through one staff member. NEHA is a national not-for-profit professional
society headquartered in Denver, Colorado with approximately 5,000 members. Its
mission is “to advance the environmental health and protection professional for the
purpose of providing a healthful environmental for all.” NEHA has a wide range of
educational and credentialing programs that encompass the entire range of environmental
health professions. The association represents the best interests and best practices of the
profession and it was the natural choice in a search for a panel to review the San Diego
program. Some of the predominate job responsibilities of NEHA’s members are in the
area of food safety and protection. It is this nationally regarded expertise that the San
Diego Department of Environmental Health wanted to access when its management
approached NEHA to make experts available to evaluate the food safety program from an
outside and expert perspective.
15
NEHA management, with input from its board of directors and DEH, created a set
of criteria for the makeup of an objective panel comprised of generally recognized food
safety experts. It was important to find individuals from diverse employment settings and
geographical locations who held senior level or equivalent of experience (e.g. director,
manager, senior consultant, associate professor or higher, etc.). NEHA looked for
individuals experienced in directing the operation of a local food protection program. At
least one individual was required to have experience within a health department that
serves more than 1 million people, preferably 3 million which is on par with San Diego.
It was also important to find individuals who had a good working knowledge of
databases. One panel member was required to have experience working in the state of
California (but not San Diego) to help to provide a reference point with the California
food code and regulations.
With over thirty qualified professionals in food safety to choose from, five
individuals were chosen and asked to be part of the review panel. The panel members
brought with them over 150 cumulative years of food safety and management years to the
project (see appendix E for biographies as they relate to environmental health and food
safety programs). At the time of the review, three panel members were current directors
or administrators of county health departments, one was a professor in health sciences
with extensive experience working in California and one was a food safety consultant
after recently retiring as a manager in a local health department. Their background
experience extended back 36 calendar years in the field of environmental health and food
safety. With this mix of experience and expertise all of the criteria were satisfied for an
expert and objective review panel.
Use of Expert Opinions
The food safety experts selected for the review of the FHD Food Safety Program
were selected for their ability as a source of objective information and their judgment of
the program within the context of a large county-based food safety program. Expert
opinion is extremely important when the judgment involves subjective values, especially
when assessing the overall effectiveness of a program.

16
Preliminary Work and Review
Prior to the onsite visit, the NEHA Review Panel reviewed documents about the
program that were provided by DEH. Five comprehensive manuals detailed the “Team
Excellence Performance Measurement System,” which is a long-range plan that was
developed in 2001 and 2002 by DEH and its stakeholders from the retail food industry,
academia, and other public health professionals.
This plan defines the strategies for assessing risk, communicating risk, managing
risk, and verifying the quality of service in the San Diego County Food Safety Program.
Several telephone conference calls were conducted with DEH management and the panel
members to define what additional information was needed to conduct a review and to
refine a detailed agenda for the three-day site visit. (See Appendix A for the agenda of
the site visit and Appendix B for a general description of risk-based systems).
Site Visit
The three-day site visit consisted of a combination of presentations, discussions,
and ride-along visits with environmental health specialists. DEH management, which
included Gary Erbeck, Director of the San Diego Department of Environmental Health
(DEH), Jack Miller, Assistant Director, and Liz Pozzebon, Chief, Food and Housing
Division (FHD) presented the Team Excellence model to the panel. The presentation
focused on the context within which it operates and their intended plans for the future in
regards to staffing, technology and the inspection program in general. This was an open
forum that allowed panel members to learn more about the relationship between state and
county health departments in California, to learn about various state panels and their
functions, and to understand how the risk-based inspections were researched and
developed for San Diego. DEH management presented their position that an important
aspect of the food safety program is the ongoing communication and interaction with
stakeholders, including those from regulated industry and the public.
The review panel met with FHD supervisors (without management present) and
asked questions to ascertain their overall opinions of the program, how they thought the
program could be strengthened, lines of communication, morale, program vision,
technology, training, and time management. In a separate meeting (also without
management present), the panel met with FHD stakeholders to gather their reflections

17
and impressions of the program. Representatives were present from a major market chain,
a major fast food restaurant chain and a food establishment industry representative.
Questions and discussions focused on lines of communication between industry, the
DEH/FHD leadership, training that industry received from FHD staff with the
introduction of the new California Food Code (CalCode), and the grading system used by
San Diego County to grade retail food facilities. Direct questions were asked about how
well the program works and what could be improved. A total of three hours were spent
with these two groups.
On the second day, a full half-day was devoted to ride-along field inspections
where each panel member accompanied field staff members (Environmental Health
Specialists) on inspections of full service facilities to observe the risk-based inspection in
practice. None of the facilities involved had prior notice of these inspections. Prior to the
visit, the team had asked to observe only facilities that were considered high risk (e.g. full
service restaurants as opposed to low risk prepackaged food facilities). The panel learned
that the four field staff that went on the ride-along inspections had more than 3 years
experience and one was newly trained in the last half of 2007. During the inspections,
panel members observed how staff employed the inspector/educator/consultant model of
risk-based inspections.
Following the inspections, the team gathered for a discussion with the same FHD
staff for an hour and a half (without management present) to gather their reflections on
the program, its goals, lines of communication, workloads, technology, the risk-based
inspection process, time management and the grading system. The panel wanted to find
out how well it worked for them and what could be improved.
At the end of the second day, the team spent about a half hour reviewing
randomly selected establishment files. Most were pre-selected by the team from a list of
establishments provided prior to the visit. Time constraints prevented the review of
additional records that the team was interested in reviewing: employee training records;
compliance and enforcement standards; and foodborne illness investigation records.
On the third morning, the panel reconvened for a foodborne illness investigation
discussion with staff from the Health and Human Services Agency (HHSA), in their
offices. A thorough presentation outlined the existing communicable disease surveillance
systems. The presentation demonstrated the excellent collaboration and communication
18
between the epidemiology group and FHD and the roles each plays in the goal to reduce
foodborne illness in the county.
This meeting was followed by a demonstration of the current database technology
used for recording and reporting on facility inspections. The focus of the questions
centered on how information is uploaded and retrieved, the ease of generating reports,
type of reports available, the strengths and weaknesses of the system, and the overall
compatibility of the system for food inspection reports. Again there was an open
discussion about the benefits and shortfalls of the current system.
During the exit interview on the third day with DEH management, the panel
addressed their observations and made comments about the budget, staffing, workloads,
technology, and the grading system. The panel noted the many positive features of the
food safety program and its ability to be flexible and manage change. Preliminary
recommendations were discussed and it was noted that all of the items brought out by the
panel had been discussed within the department and most were already part of the
department’s long-range plans.
Wisconsin Program Standards Evaluation Tool
Through the initial teleconference meetings, panel members discussed different
assessment models for the review, including the possibility of developing a specialized
evaluation format. The San Diego program had already won the prestigious Crumbine
award in 2005. The review team and San Diego DEH management agreed that evaluating
the program again by the same criteria would not be useful to DEH. After evaluating
several FDA-based survey instruments, it was determined that the Wisconsin “Program
Standards Evaluation Tool” was the best option to gather information about the San
Diego program. This tool is a self-assessment form that was developed from the FDA
National Retail Food Program Standards Recommendation (created 2004 and updated
2007). One panel member was familiar with its successful use by the Wisconsin
Department of Health and Family Services to evaluate food inspection programs
throughout the State of Wisconsin. When the review team, including DEH management
reviewed the format, all agreed that this tool was useful and suitable for gathering
relevant evaluation data about the San Diego Food Safety Program.
19
According to the documentation provided with the Wisconsin self-evaluation
model, the questionnaire could be used as a measurement tool in that it is designed to
help an agent (in this case, the San Diego County FHD) measure performance and status
of a food safety program. The tool is intended to be used in combination with periodic
field evaluations, standardization, and paperwork audits to chart the course for consistent
and uniform inspection programs. In this way it can be used as an evaluation tool (See
Appendix C for the form as it was filled out by DEH staff).
The tool contains a series of queries about nine program standards and goals.
1. Program Foundation - this section provides documentation for the regulatory
foundation such as statutes, regulations, rules, ordinances, or other prevailing
sets of regulatory requirements that govern the operation of a retail food
establishment.
2. Trained Regulatory Staff – this section includes goals and allows the agent to
describe essential elements of a training program for regulatory staff that
demonstrates that they have the knowledge, skills and ability to adequately
perform their required duties.
3. Inspection Program Based on Risk Principles – this section deals with the
inspection program and how it focuses on the status of risk factors, how it
determines and documents compliance, and how it develops corrective
actions.
4. Uniform Inspection Program – this section deals with the internal policies and
procedures that ensure uniformity among regulatory staff. Do they have a
uniform interpretation of regulatory requirements, program policies and
compliance/enforcement procedures? Is there an on-going quality assurance
program that evaluates inspection uniformity, quality, inspection frequency,
etc.?
5. Foodborne Illness – This section provides questions to document
investigation and subsequent review of alleged foodborne illness incidents and
outbreaks. Is there an established system to collect and investigate complaints
of food-related illness and injury? Is there a system to investigate foodborne
disease outbreaks?

20
6. Compliance and Enforcement – This section applies to all compliance and
enforcement activities. Is the jurisdiction achieving compliance with
regulations? Is there a timely follow-up for out-of-control risk factors and
timely correction of code violations? Is there evidence of a long-term decrease
in the number of CDC risk factors?
7. Industry and Community Relations – This section applies to industry and
community outreach activities. Is input solicited concerning the food
program? Is there communication of sound public health and food safety
principles and are community initiatives focused on the reduction of
foodborne disease risk factors fostered and recognized?
8. Program Support and Resources – This section deals with whether there are
sufficient resources (budget, staff, equipment, etc) to support an inspection
and surveillance system that is designed to reduce risk factors. Are there
sufficient resources (funding, staff and equipment) to comply with state
contact obligations?
9. Program Assessment – This section deals with the measurement of systems,
programs and procedures that are in place to track data. Can the managers
measure their program against national criteria? Are there program elements
that require improvement or are there elements that deserve recognition? This
section focuses on three elements: the inspection profile, the violations profile
and consumer complaints.
Analysis of the San Diego Self-evaluation
The panel reported that the use of the Wisconsin Program Standards Self-
Evaluation Tool provided a valuable summary of the San Diego program. The tool
clearly brought out the many strengths of the San Diego Food Safety Program and
provided a good description of how the program is set up to operate. The program
foundation is solid, staff training is a priority and clearly the program is based on risk
principles. Inspector standardization is taking place to improve inspector consistency, a
solid foodborne illness investigation procedure is in place, and compliance and
enforcement does occur. An ongoing food safety partnership with industry as well as
good communication with the general public on food safety issues is indicated. Finally,

21
San Diego County DEH was able to provide data that describes what they are doing. The
self-evaluation review indicated to the panel that the San Diego food program has
undertaken efforts in all food program assessment areas recommended by the FDA.
Post Site Review
Following the onsite visit, panel members documented their observations and
recommendations of the FHD Food Safety Program. These were submitted to NEHA for
compilation into this report. It should be noted that except for very minor points that are
noted, the review panel members were unanimous in their observations and
recommendations. For this reason, this report is presented as the observation and opinion
of the entire panel.
V. RESULTS
The following sections describe what the panel learned (see description of
existing program component) about the different aspects of the Team Performance
system during the site visit and in the materials provided prior to the visit. The discussion
sections describe the review panel members’ reflections and observations in regards to
whether the program is meeting its goals. This section includes an assessment by the
panel based on their experience and knowledge of the strengths and areas for continued
improvement of the program.
Finally, each section contains a recommendation that reflects the panel members’
experience of best practices and general knowledge. Often a recommendation reflects
knowledge or direct experience of what has worked well in other departments across the
country. The recommendations are intended to be suggestions for program enhancement
in future planning activities. The San Diego Food Safety Program has been evolving for
more than 50 years and will continue to evolve.
Section A - Assessing Food Safety Risks
1. Description of Existing Program Component
Baseline Report
According to the Team Excellence materials provided to the panel members and the
presentations during the site visit, the panel learned that FHD established a historical
22
baseline report using inspection data from January 2001 through December 2002 as well
as actual surveys of food employees during March/April 2003 (Executive Summary, p
20). The purpose of the survey was to determine the food safety knowledge of food
employees that prepare or handle unpackaged foods. In addition to assessing knowledge,
FHD wanted to compare the effectiveness of three types of food handler training
programs that were in use. FHD learned from the trends identified in the response data
how to develop training and other intervention strategies needed to reduce risk of
foodborne illness (See Appendix D - Team Excellence, Executive Summary, p 20).
Dashboard Report
FHD also developed a dashboard report in 2003 that monitors the occurrence of
risk factor violations. This report details inspection data (risk factor violations) that are
stored in a computerized database. The report is reviewed monthly to determine if
intervention by FHD field staff is effective and to identify changes in trends or identify
new issues. Panel members were given a copy of the most recent dashboard report (see
Appendix D).
Annually, assessments are done of risk factors found during investigations of
foodborne illnesses. In addition, reported Salmonella and Campylobacter illnesses have
been tracked and evaluated on a weekly basis. These reviews and Pulsed Field Gel
Electrophoresis (PFGE) analysis allowed FHD to link illness with illegal cheese sold by
street vendors with illnesses.
Updated Interventions
The panel learned from the presentations and materials provided that FHD
identified very specific needs after reviewing the results of this baseline data and surveys
taken by more than twelve hundred food handlers. After analysis of risk factor violations,
FHD staff developed interventions to improve the practices for cold holding
temperatures, employee hygiene and proper cleaning and sanitization of food contact
surfaces. The following interventions have resulted in decreasing trends in major risk
factor violations.
o Taking a lead role in developing a food safety law that required more
accountability for the person in charge to restrict or exclude ill food employees,
23
o Using risk control plans which included workbooks for both retail and wholesale
food facilities,
o Developing a new risk-based inspection process,
o Developing a wholesale food warehouse inspection and education program,
o Developing an operator’s guide in multiple languages,
o Developing guides that focused on approved food sources, use of wiping cloths,
temperature control logs and calibration procedures, and
o Conducting outreach workshops.
After analysis of the surveys that ascertained food employee knowledge, FHD
explained that the most prevalent lack of knowledge lay in proper cooking and hot
holding temperatures. However, FHD could not determine a direct relationship between
lack of knowledge and the most frequent risk factor violations (Team Excellence
Executive Summary, p 23). In other words, because what people know does not
necessarily lead to proper food handling procedures, FHD explained that they focused on
strengthening their enforcement and compliance procedures. Another survey is planned
for 2008 to identify any improvements in knowledge of food safety procedures as a result
of these actions and interventions.
A-B-C Grading System
The A-B-C grading system has been used in the San Diego food safety program
for the past six decades. Letter grades are assigned following inspections, based upon a
numerical score; a score of "90" or above rates an "A" placard, which is to be displayed
in the establishment. A score below 90 results in "De-Grading", and a "B" placard must
be displayed pending re-inspection to confirm correction of major violations. The DEH
web site says that an "A" placard means the establishment is in "…substantial
compliance…" while a "B" means the establishment needs significant improvement.
In the view of DEH management, the A-B-C grading system is primarily a public
awareness tool that demonstrates overall facility performance. However, the panel
disagrees that the grade is indicative of overall performance, but sees it only as an
indication of how the facility scored at the time of inspection. DEH management related
to the panel that the grade has proved to be an incentive for operators to comply with the
law. DEH also tracks the scores in order to measure food facility performance over time.
24
Facilities with repeated degrading, reports with major violations, and closures are subject
to further intervention in order to increase long term compliance for food facilities in the
county. DEH management has demonstrated that this process has been a key factor in
decreasing trends in the occurrence of major risk factor violations in the county. For
example, data shows that there has been a 46% reduction in the number of food facilities
with three or more of the same major risk factor since 2005.
Recent changes to the grading system were made in response to changes in state
laws that require the distinction between major and minor violations in order to promote a
more risk-based inspection process. Statewide model guidelines were developed for
scoring and grading by a panel of regulators and stakeholders. These guidelines are
described in the program materials (TEAM Excellence, Executive Summary, Tab 4). The
inspection process requires immediate corrective action for major violations. In this way
risk is reduced if it is corrected on the spot. If a facility is an imminent health risk, it is
closed immediately and the grade card is replaced with a closure sign. The FHD
inspection system weights major violations more than minor violations. When a facility is
degraded, the appropriate grade card is required to be displayed. When it is closed, a
closure sign is posted.
2. Discussion
Assessing risk is the component of a risk-based food safety program that brings
validity to the program. It ensures that the baseline trends have identified training and
other intervention strategies that actually are related to a reduction in risk factors. If this
is done correctly and the managers of the risk-based food safety program can redirect
resources to address emerging food safety issues, one can state with confidence that the
program is addressing food safety risks that are contributing factors to foodborne illness.
This is a key characteristic and definite advantage of a risk-based management system.
The panel members noted favorably the fact that FHD’s inspection focus is on
mitigating risk factors most likely to cause foodborne illness if not corrected as opposed
to simply tracking numbers and results of inspections. This follows the current
conventions used successfully in many jurisdictions around the country that are modeled
after the FDA recommended risk-based inspection programs. It is the experience of
several panel members that risk-based guidance sheets that are in use by the San Diego
25
program, such as temperature logs, have been successful at changing food establishment
employee behaviors so that fewer risk factors are present.
In addition, the panel noted the positive impact of a mandatory system that is in
place to require some level of training of all food handlers in addition to a standardized
test. This is a strength that greatly supports the program’s goals of reducing foodborne
illness. Another strength of the program is the long history (25 years) of using Active
Managerial Control (AMC). AMC is a comprehensive food safety system with tools that
help to reduce the risks of foodborne illness by helping establishment operators and food
handler staff control practices and procedures that can contribute to foodborne illness.
Increase in Reported Foodborne Illness
A review of the data on foodborne illness in the county found that there have been
more reports of foodborne illnesses in recent years (a confirmed or probable illness
involving people from two different households or one person if a toxin) that are linked
to a particular restaurant. This seemed to contradict other data that showed a decrease in
foodborne illnesses. Based on information provided by the epidemiologists with Health
and Human Services Agency (HHSA) and the FHD staff, it was evident that there is
improved surveillance and reporting of suspected foodborne illness and this activity has
resulted in the increasing numbers in the reports. FHD and the HHSA staffs have worked
with the food industry, medical providers, schools, and laboratories to improve their
response to foodborne illness reports. As a result, major food product recalls have been
initiated because of their efforts and the public’s health was further protected.
According to FHD, when there is a report of confirmed or a probable case of foodborne
illness, it is aggressively investigated in the field and the laboratory. FHD assists HHSA
in obtaining stool specimens from food employees and customers. The Public Health
Laboratory conducts laboratory and PFGE analysis to identify links, if any.
In recent years, they have also started testing for Norovirus in the public health
laboratory. This process has helped to identify additional illnesses.
A-B-C Grading System
The A-B-C grading system recently came under scrutiny by the media and the
2006-2007 San Diego County Grand Jury. An internal DEH/FHD discussion about the
26
grade system has been occurring, according to DEH management and staff. This reflects
the national debate on this issue. Panel members recognized that there are differing
opinions as to whether or not inspections should be scored or graded and if scored and
graded, what type of scoring and grading system should be used, as well as how those
scores/grades should be published, or if they should be published at all. Some food safety
professionals are not in favor of using scores, an opinion which reflects the most recent
editions of the FDA model code. Other food safety professionals support various
different types of notification systems to post in establishments.
Some panel members felt that some form of inspection scoring might be valuable
because it is one way for the supervisor to see what is occurring from place to place and
inspector to inspector. It could also be a good way for restaurant operators to compare
their own inspections from year to year. The panel noted, however, that the 100 point
perfect score system that is used by San Diego could be problematic because a facility
can have multiple violations of the same type that are only counted once. For example, if
three different refrigeration units are not holding proper temperature in a San Diego
restaurant, a correction can be made on the spot by moving the food to other refrigeration
units or discarding the food. If there are no other violations, the establishment maintains
it’s “A” rating, even though a large volume of food could have been held at unsafe
temperatures for a long period of time. Some say that such an establishment should be
able to maintain an "A" rating. Others say that the three refrigeration units should be
counted as separate violations, and the establishment de-graded. Additionally, when
major violations are repeated in subsequent inspections, the A-B-C issue is more
complicated.
Degrading and Public Communication
The long-standing rationale for posting scores, letter grades, or other public
notification systems is to communicate information to the public about the relative risk or
safety of eating in the establishment. An FHD on-line survey, included in the
Department's "Assessing Risk" materials, seems to confirm that consumers regard the
grades as providing important information, to wit: 66% reported that they perceived
restaurants as the source of recent foodborne illness; and 70% stated that they look for the
grade placard before choosing a restaurant. However, displaying an "A" may not
27
completely convey the severity or triviality of risk conditions in the establishment. For
example, in one file review, the panel found that an establishment had been cited for
"improper cooling techniques" and "improper reheating techniques." These are very
serious discrepancies that carry a high degree of risk; yet, because the numerical score
fell above the arbitrary threshold (below or above 90%) for de-grading, the "A" remained
in force. Thus, the public reports that they depend on the "A" placard to assure safe
conditions (or at least lowered risks), but that assurance may be misplaced or misleading.
Conversely, the public may perceive a downgraded "B" to mean that it is "unsafe" to eat
there, again borne out by the DEH survey in which 74% of respondents report that they
would NOT eat at a restaurant that does not display an "A".
The potential problem with this system is that in fact, it may be safe to eat at a
restaurant with either an “A” or a “B” score. In both cases, risk factors are corrected
during the inspection. Does the difference between a score of 89 and 90 really mean safe
or unsafe? If a place is thought to be an unsafe restaurant at which to eat, should it be
open? If a “B” restaurant is open, should it be considered unsafe? Is the risk messaging
accurate? Additionally, since food establishment inspections show a single point in time
on a single day of the year, is it logical to say the restaurant is an “A” establishment or a
“B” establishment on any other day than the one day it was inspected?
A final point of consideration is the effect that the grading system may have on
individual environmental health specialists, establishment operators, and their
relationships. FHD proudly (and rightly so!) urges that environmental health specialists
adopt an educational aspect to help operators recognize and control risk factors, while
correctly reserving the employment of enforcement protocols when necessary. During the
panel's limited observations of inspections, they noted more than once that the decision to
"downgrade" was difficult and disturbing to both inspector and operator. In more than
one case, environmental health specialists struggled with how to mark certain violations
that could result in downgrading or not. In the end, environmental health specialists
appeared to follow the "Marking" guidelines and produced reports that correctly
described risk conditions in the establishment, but it was obvious that this was an
understandably stressful situation for all parties.
Given the historical pride and familiarity that accompanies this grading system, it
is unlikely that management, elected officials, or the public will readily agree to

28
completely dismantle the system or significantly change it. However, these are questions
that should be asked and evaluated as the discussion continues on the best way to ensure
public food safety, and on the best method to communicate the actuality of risk factors to
the public.
3. Recommendations
A-B-C Grading system
The panel recommends that FHD review the A-B-C Grading System to determine
if the public health message of relative risk conveyed by the present placard system is
accurately understood by the public, and if not, how those public communications can be
improved. While it is acknowledged the current system has been in place for decades and
both consumers and industry are very familiar with it, the panel wonders how well the
current system communicates actual levels of risk, a stated objective of the Food Safety
Program.
In addition to the possibility of conveying inaccurate public messages, the panel
is concerned that the emphasis on maintaining an "A" rating may unduly interfere with
educational relationships between inspector and operator.
The panel recommends a fresh look at the positive and negative aspects of the
current grading system and the public health messages that are conveyed by the “A-B-C”
grades. To that end, the panel recommends that DEH evaluate public information systems
used in other jurisdictions to look for best practices and determine if they should adopt
some concepts of these programs that can strengthen the public’s understanding or the
actual risk levels associated with an “A” or “B” grade.
Section B Communicating Food Safety Risks
1. Description of Existing Program Component
Through program materials and presentations, the panel members learned that
FHD has an objective to increase stakeholder knowledge of food safety issues. It is hoped
that the outcome of this communication will naturally continue to lead to improved food
preparation practices which will in turn lead to reduced foodborne illnesses. The methods
used to increase knowledge and establish convenient communication methods include:

29
o establishing partnerships in a stakeholder advisory council, the Food Safety Advisory
council (FSAC);
o developing workshops such as the risk factor and intervention workshops that were
attended by approximately 5000 people;
o enhancing a comprehensive plan review guideline and process for food facility
planners;
o taking the lead to share information on national, state, and local levels;
o developing an interactive Web site that is available 24 hours a day that allows
searches for relevant resources; and,
o conducting outreach to the public using print, radio, and television media events.
Originally established to gather input for long range planning, the Food Safety
Advisory Council (FSAC), an organized group of stakeholders, helped with the
development of the TEAM Excellence system (2001-2002), and the retail food facility
operator’s guide (2003). According to the materials provided, FHD has also developed
educational programs with FSAC for stakeholders on topics such as procedures for food
security, food handling and safe food sources, employee health and hygiene, self-
reporting, risk factors and the updated inspection report, FDA legislation, agroterrorism,
the National Incident Management System, and the recently implemented California
Retail Food Code (CalCode). This group which includes FHD staff is comprised of retail
food industry stakeholders, food handler training schools, the San Diego State University
Graduate School of Public Health, the Farm and Home Advisor, epidemiologists, public
health nurses.
Recognition and Awards
As previously noted, the San Diego County Food Safety Program has received
national recognition with the Samuel J. Crumbine Consumer Protection Award in 2005,
in addition to a Model Practice Designation by the National Association of City and
County Health Officials (NACCHO) in 2006, and the National Association of Counties
award in 2007. FHD staff is also active in participating in developing and training the
National Environmental Health Association’s Epi-Ready Course which brings public
health professionals together to identify and investigate foodborne illnesses using a team
approach (See Appendix D - Team Excellence, Executive Summary, p 25).
30
Department of Health and Human Services (HHSA)
DEH management explained that weekly FHD and HHSA meetings help to
streamline investigations and data tracking for outbreaks. The department has ongoing
and proactive team building with epidemiologists, laboratory microbiologists, public,
industry etc. and communication is two ways. In addition, FHD staff is linked to federal
and state notification systems to receive information regarding food product recalls.
Industry receives notification through e-mail distribution lists, and a web-based system
called “Constant Contact” is in place to send alerts to subscribers.
Unlicensed Operations
San Diego County has experienced some large communicable disease outbreaks
due to the sale of unlicensed food, such as problems with illegal cheese brought in from
Mexico. The panel learned that DEH has already implemented steps to deal with
unlicensed operations. For example, DEH has established partnerships with local, state
and federal agencies who are working together to address the issue.
DEH management explained that there have been no reported outbreaks of illness
from illegal vending since 2004 when there was an outbreak of illness related to cheese
from Mexico and a Border Task Force was established. This task force continues to be
active. According to DEH, they have developed outreach materials, maintained
partnerships and worked together on enforcement and compliance issues. In addition,
samples have been collected at the border to help support a need for change at the Federal
level regarding what is allowed to be transported across the border for personal use.
2. Discussion
Communicating identified risks to the food industry and the public is another
critical step in the risk-based food safety. It is arguably the most important component of
the risk-based food safety system in that it “operationalizes” food safety risk factors into
an understanding of the knowledge and skills necessary to change the behavior of food
service owners, managers, and food handlers. This occurs through educational outreach
and training programs.
31
Partnerships with Industry and the Community
Based on discussions with stakeholders, panel members noted that the food
industry is very supportive of the San Diego food program. The regular training to
industry stakeholders is an effective way to increase knowledge of food safety practices.
This practice also provides an atmosphere of teamwork and ownership of the program.
Program strength is also seen in the development of collaborative relationships with the
public as demonstrated by the department’s strong focus on community outreach
activities and community training. This is a critical departure from the command and
control approach that was often found in regulatory organizations.
Ongoing partnerships include the California Restaurant Association, Food and
Beverage Association, Grocer’s Association, Neighborhood Market Association, and the
Hotel/Motel Association. Meetings and training events are open to anyone to attend. This
practice facilitates openness and fosters continuing communication between DEH/FHD
and the stakeholder community. This is also an excellent way to reach and receive
feedback from all facilities if they attend, versus selecting a few who might be always in
agreement with department policies. In fact, the stakeholders cited during interviews with
the panel members that the biggest asset of DEH/FHD is positive communication.
FHD communicates information about training, task forces, and FSAC meetings
through email and through the stakeholder groups and their websites. Stakeholders have
responded to invitations to participate on task force groups such as Epi-ready training,
and on the CalCode committee. As FHD developed the risk-based inspection program,
stakeholders were given opportunities to comment and make suggestions on the format
and language of the inspection report form. Stakeholders indicated during interviews with
the panel members that response from DEH/FHD was always timely and that DEH did
make several changes in response to their recommendations.
When the new CalCode and inspection format was introduced, stakeholders
accompanied environmental health specialists to learn more about the risk-based
approach. DEH provided training for nearly 1500 stakeholders on the requirements of the
new food code. The stakeholders that the panel members interviewed felt that they were
able to complain freely without fear of retaliation; they felt that this was not always true
in other jurisdictions.
32
The panel commented favorably that “Constant Contact,” an email notification list
initiated by DEH, is an effective system for providing new or urgent information to the
food operators. Recently FHD began posting inspection information on their Web site. In
this way, the public can stay informed. Anyone can look up food establishments and see
limited information about the most recent inspections. DEH/FHD also extends a
partnership with the military by taking military personnel into the field for training.
Furthermore, DEH also has a good relationship with the police department and Federal
border authorities for enforcement problems, such as closing illegal cheese vendors in
2007. This kind of partnership within the county serves to strengthen the public health
mission.
Partnership/Collaboration with the Health and Human Services Staff
The panel members were very impressed with the collaboration process that
demonstrates a solid relationship with the San Diego Health and Human Services Agency
(HHSA). The Interdepartmental Protocol for the Coordination of Foodborne Illness and
Outbreak Investigation and Control was established in April, 2003 between DEH/FHD
and HHSA. This department under the leadership of Michele Ginsberg, MD, provides
access to an excellent epidemiology program, real-time disease surveillance systems, and
outbreak investigation. The HHSA epidemiology group has excellent surveillance,
laboratory identification, and investigation protocols.
HHSA’s s work with community reporting should also be noted as outstanding.
This is a very strong component of the overall food protection program. An
Environmental Health Specialist III works at HHSA and receives, documents, and
processes all foodborne illness complaints from the public, industry, HHSA, and the
medical community. (Procedure for Foodborne Illness Investigation & Response, County
of San Diego Department of Environmental Health, Food & Housing Division) DEH
staff meets weekly with HHSA staff to discuss issues of importance. The epidemiologists
analyze what is happening in the community and create reports as needed to assist DEH
in tracking foodborne illness in the community. The GIS mapping capability of cases of
communicable disease is very useful.
The panel was also impressed with the partnerships that Dr. Ginsberg and HHSA
have made with hospitals in San Diego County. Hospital emergency rooms communicate

33
daily with the epidemiology group within HHSA and public schools report daily health
visits to nurses. In reverse, the Emergency Medical Alert Network (EMAN) is used by
HHSA to inform the medical community of a developing public health emergency.
FHD has a well documented protocol for investigation of foodborne illness
complaints; the protocol is also a training tool that defines responsibilities and actions of
all participants from receiving the illness complaint to writing the final report.
FHD staff also takes an active role in food recalls and collaborates closely with the
California Department of Public Health. On its own initiative, FHD, along with many
other local food safety programs, proactively pursues recall effectiveness checks in San
Diego County. Responsibilities may include (1) monitoring recalls, (2) performing
surveillance during routine inspections, (3) implementing product “remove from sale”
orders or directives, and (4) assisting in tampering investigations. Recalls can often
require extensive time commitments from staff for verification.
Unlicensed Operations
Although the Food Safety Program has an excellent epidemiology connection
with the Public Health Department that is able to track cases of foodborne illness, and
although most foodborne outbreaks do not come from licensed establishments, more
attention may be needed to prevent future outbreaks from unlicensed food vendors.
3. Recommendations
Unlicensed Establishments
The panel recommends reconsidering the FHD food safety program’s broad goal
of reducing foodborne illness in cases over which they have no control. Instead, the goal
could be more realistically defined to reduce the number of foodborne illnesses to
licensed food establishments. DEH could also reconsider the practice of using county-
wide incidence of Salmonella/Campylobacter as an indicator of program success.
Introduction of cross-border infections makes this an inherently suspect metric, and may
open the program to unnecessary and invalid criticism. This metric is further weakened
by the growing incidence of norovirus foodborne illness, and the county is at risk for this
pathogen due in part to the large numbers of cruise ships that dock in the nearby bay.
34
In place of using general illness incidence as a measure of success, the program
could continue and even increase public education on the importance of "risk factors" in
and of themselves, and track the occurrence of those factors to measure program success.
Additional work could focus on identifying ways to assure all food vendors that should
be licensed are licensed.
Section C Managing Food Safety Risks
1. Description of Existing Program Component
Managing risks requires the development of a methodology for the food safety
inspection program. FHD’s focus is on prioritizing inspections and investigations
based on relative degree of risk. Their methodology also deals with providing
consistent, uniform processes and a way to monitor the process to ensure the
intervention strategies and resources are effective in reducing occurrences of risk
factor violations.
The FDA National Retail Food Program Standards Recommendation from
2004 provided a basis for the revision of San Diego’s inspection reports in 2004.
These recommended standards (which were updated in 2007) provide guidelines for a
risk factor and intervention methodology that is being adopted across the nation in
local health department jurisdictions. All panel members were familiar with this
methodology and had direct experience with implementing a risk based system within
their own jurisdictions.
The new inspection report which was developed with input from each of the
retail food industry groups in San Diego County provided new ways to record
inspection data and a way to record and acknowledge positive behaviors as well as a
way to identify risk factor violations. In this way, relative compliance can be
determined and the relative risk of a food facility’s operation can be assessed.
Managing risk cannot be accomplished without a measurement system. Before
risk-based systems were implemented, many programs simply measured the number
of inspections that were conducted at the high-risk facilities (e.g. full-service food
preparation). While maintaining the appropriate frequency of inspections is
important, FHD also considers it important to measure and balance the outcomes
against the number of inspections, the number of environmental investigations,

35
outreach, training, complaint investigations, follow-up inspections and the like. To
achieve this balance, FHD prioritized their activities and resources to focus on areas
of highest risk. Foodborne illness outbreaks are the highest priority, followed by full
service food facilities without HACCP plans, meat markets/deli’s, full service food
facilities with a HACCP plan, and limited food preparation food facilities.
Prepackaged food facilities are the lowest in this priority.
Data Collection and Management
Measuring output and outcomes requires a system for data collection and
tracking risk factor violations. FHD uses a system called KIVA which was modified
to capture inspection data in 2002 according to the program documentation.
TELEForms is software that provides the capability for scanning inspection reports.
This was added in 2005. Recently the department has used Geographic Information
Systems (GIS) to identify the distribution of illnesses associated with outbreaks of
Salmonella and Campylobacter related illnesses.
According to FHD documentation, various preprogrammed reports can be
generated from the KIVA data that most staff has access to. This includes overdue
inspections, route book, route sheets, list of routes, degrade history, degrade list,
delinquent permit, inspector activity, no annual, plan check review activity and plan
check submittals. A variety of additional data queries are also run to ensure the
quality of inspection data.
From the long-range plan status report in the “Managing Risk” materials (Tab
4), a large number of improvements have already been made to the overall system,
especially in its interfaces with the public and FHD personnel. For example, the access
to the system data is available now through a web interface, a reverse 911 directory
has been implemented, and the public and stakeholders can receive alerts via bulk
email campaigns.
Other improvements (in progress) include: making the permit processing
information available to the public via the web, notifying permit owners when
inspections/renewals are due, moving complaint data from desktop MS Access system
to KIVA, creating new KIVA reports (such as Performance Measures dashboard),

36
refining existing reports, and researching new technologies to replace obsolete or
inefficient applications.
The effective management of risks is tested in emergencies and disasters.
Preparing for a natural disaster or willful attack that affects the food supply is another
aspect of managing risk. FHD planned for a potential public health crisis after the
attacks on September 11, 2001 by conducting tabletop exercises and implementing
equipment upgrades, training field staff, creating guidance materials for retail food
facilities, developing a risk control plan for wholesale food warehouses, updating
procedures, especially for food recalls, a foodborne illness emergency response team,
a Department Operations Center for emergencies, and creating a web presence to
facilitate access to guidelines and information during emergencies. These new
procedures were successfully “tested” during the wildfires, most recently in the fall of
2007.
Enforcement and Compliance
A risk management system also includes a consistent enforcement and
compliance process. FHD’s goal with this aspect of managing risk is to ensure that
major violations are immediately corrected or a suitable alternative is implemented
until the violation is corrected. FHD management related to the panel members that a
more consistent and uniform enforcement and compliance process had been
implemented after gaps in this area were identified in the initial baseline report. A
system was implemented to provide guidelines, tools and sample model risk control
procedures (which are part of the Active Managerial Control) to help facility
operators gain control of food safety risks. Education is provided with consultative
inspections that are done with new food facility operators. However, if a food facility
continues to have repeated major risk factor violations or if there are repeated
downgrades of the facility or repeat closures, the enforcement/compliance system has
a process for an administrative hearing that could lead to modification, suspension or
revocation of a food permit. According to the program documentation, this enhanced
enforcement/compliance process has been effective in contributing to the downward
trend in major risk factor violations (See Appendix D - TEAM Excellence, Executive
Summary, p 33).
37
Charts included with the presentation materials show a decrease in the trends
of the tracked risk factors observed over the period from the baseline assessment in
Jan-March 2004 to mid-2007. There was also a decrease in the number of food
facilities reviewed due to confirmed reports of Salmonella (51 in 2003 to 30 in 2006)
or Campylobacter illnesses (44 in 2003 to 12 in 2006).
There was a slight increase in food facility closures and slightly more “B”
grades were issued in 2007. FHD indicated that enforcement activities are becoming
stronger in the Food Safety Program. However, the reason for the increase in closures
was due in large part to the many food facility closures that resulted from an unsafe
water supply during the Firestorm in the Fall of 2007. The slight increase in the
number of B grades was also due to the implementation of a new food law on July 1,
2007. On July 1, 2007, the FHD revised their inspection report to comply with the
new food law. The new inspection report contains more data fields and a different
point value system (100 points vs. 200 points prior to July 1, 2007). The new data
fields and associated point value deductions are in line with the recommended State
of California standardized inspection data fields and model grading system. It is
expected that this trend will continue throughout 2008.
2. Discussion
The management of risk is essentially concerned with devising better risk
management techniques or technologies which can be applied to reducing risk factors.
Risk management can answer the question of whether or not an inspection
methodology or the addition of new technologies can contribute to reducing the risk
of foodborne illness. Another way to examine the process of managing risk is to
understand that it allows management to identify and implement measures which may
be able to reduce the risk of foodborne illness to an acceptable level.
The reality of the overall problem of minimizing the risk of foodborne illness
to a population is confronted by management in this component. Theoretically, it is
impossible for any food safety program to eliminate foodborne illness in a population.
Additionally, there is no such thing as a “zero risk.” No food safety program can
control all the factors that contribute to foodborne illness, including human behavior.
The Department of Environmental Health manages risks by “promoting an
inspection methodology that prioritizes inspections and investigations based on
38
relative degree of risk.” They accomplish this by using “intervention strategies and
resources which are prioritized in critical areas.” The focus of this evaluation must be
on the process employed by the program to reduce the risk factors related to the
transmission in foodborne illness in licensed food establishments.
Data Collection and Management
The present data collection and management system is used primarily to
provide useful information to manage the program and identify potential problem
areas. Only descriptive data analysis is being conducted by staff. The database can be
used additionally to answer some of the more challenging questions concerning the
program that would be of value to program management. For instance, one can
measure the effect of various factors on foodborne illness or determine which factors
are a more valid measure of program effectiveness or which factor (violation) is more
likely to result in a facility being degraded. However, the key point is that most
agencies gather data and under utilize it.
The FHD staff has an understanding of the value and importance of the
potential information in their database; however, they could gain greater value in
working with those trained in data analysis to gain an understanding of the
information that can be developed for use in the management of the program.
DEH explained to the panel that San Diego County requires the use of the
KIVA inspection management software for all county agencies and that it was known
that there are significant technical challenges in looking at options for computerized
field inspection systems that could interface with the KIVA system. According to the
long-range plan status in the “Managing Risk” materials (tab 4), hand held computers
for the field specialists are in the future plan to support their inspections and
investigations. Currently, the current field inspection system still uses manual hand-
written reports. The panel learned that improvements have been made over the last 6
years to introduce scanning and storage of standardized inspection reports. After
receiving the daily reports, the supervisors scan each one into the TELEForms
software system. This system can send data to the Documentum software that creates
an electronic image of the inspection sheet. TELEForms also interfaces with the
KIVA system. The panel members generally found this to be an improvement but still
39
a cumbersome process. Interviews with the staff revealed a general consensus the
manual inspection form was challenging to complete and process in a timely manner,
and that portable inspection field devices, if they worked as described, would be a
definite improvement.
The panel conducted a cursory review of the data collected in the data
management systems. Several panel members noted instances where the coding
methods do not appear to cover the full details of an inspection and thus could cause
confusion in later analysis of the data. This could be especially noticeable when the
general public tries to analyze posted results on the Web site. For example, in one
restaurant file that was reviewed, two inspections conducted within two months of
each other were both marked as “routine.” Panel members found similar examples in
an online search of the county inspection database. The panel members wondered
how two inspections two months apart could be considered routine when this case
typically, in their experience, would not be a routine visit but more likely a re-
inspection or complaint inspection for the second inspection. While this coding may
not pose a problem for staff specialists that know the details of the inspection, it was
noted that instances like these lead to questions in interpretation by the casual
observer (just as it did for the review panel) now that the data is available to the
public via the Web site.
Panel members were able to observe the efficiency and effectiveness of the
hand-written report when they accompanied an inspector on a couple of routine
inspections. Based on their own experiences, panel observers uniformly agreed that
the manual hand-written system is inefficient, lacks uniformity, can be time
consuming and results in lengthy handwritten reports. The panel members noted that
as can be expected from a manual system, the inspection report language was not
consistent from inspector to inspector and some reports are more legible than others
which can lead to data inconsistencies in the system.
Another area that the panel was able to observe during the ride-along
inspections was the average length of time it took for an inspection. File reviews and
discussions with staff indicated that inspections take about an hour. All panel
members observed the inspections to be taking longer than the average. A report with
significant violations could take even longer.
40
The panel members acknowledged that a database system, especially one that
incorporates a legacy system is always on an evolving continuum and that it can never
be a perfect system with zero inconsistencies.
During the very brief introduction to the KIVA system, the panel members
reported a general impression that the system overall was time consuming, not very
user friendly and could present a challenge to obtain meaningful information. From
discussions with the FHD staff and queries to view various types of reports the system
can generate, the panel found that summary report data from the computerized system
overall was limited and that from their perspective it was lacking important features,
data and reports that help to support on-going program evaluation.
The expectation for a system that provides support for the field inspection
staff, supervisors and managers is that it is an easily manipulated system that can print
out individual inspector reports showing total specific violations called, indicate total
inspections completed in a queried period of time, and have the ability to upload
recent inspections on a particular facility so that an inspector can identify repeat
violations. The current system can provide this information; however, the panel found
it to be very time consuming.
Another example that led to this observation was the difficulty in being able to
view two inspection records from the same facility for side-by-side comparison
viewing. It was done eventually when the panel requested it, but it took at least 10
minutes of trial and error. It didn't appear to be something supervisors could easily do.
Additionally, during interviews with the field staff, the panel learned that some staff
members have created their own methods to keep track of inspections completed (e.g.
it was reported they could not always count on the report for overdue establishments
to be accurate.) While it is acknowledged that data accuracy is a factor with any
computerized system (e.g. if incorrect data is entered or an inspection is done after the
report is run), this situation has led to some staff maintaining duplicate paper records
to document disputes with the reported data. The panel members found this practice, if
it is widespread, to be a non-productive use of a specialist’s time.
Various panel members provided information about their own experience with
the computerization of large food programs. Two studies, which are attached in
Appendix E, have been provided as an example of what other jurisdictions have

41
concluded after upgrading and evaluating their own systems. The first one deals with
food service inspections conducted in Tacoma-Pierce County, Washington from 2000-
2002; the second cited reference deals with assisted living facility inspections
conducted in 2004 by the Baltimore County Health Department in Maryland. The
studies cite improved standardization and efficiency benefits with a technology
upgrade to automate the manual inspection reports. The panel members are aware that
this is data about one software provider and that more research will be needed by San
Diego to evaluate the options for their own particular conditions.
Enforcement and Compliance
The panel found that a strength of the risk-based program was its three-tiered
enforcement system, which includes immediate corrective action, assisting operators
with implementing long-term control systems by using risk control plans (RCP’s),
and formal enforcement action if the first two do not work. However, the review team
was unable to comprehensively evaluate the effectiveness of the enforcement
procedures during the site visit.
An extensive staff training program exists that includes an excellent "Marking
Guide" Handbook that the panel members consider a very well-done tool and very
useful to help standardize the staff. In addition, the panel noted that FHD is in the
process of working on many new initiatives to improve the existing inspection system
and to provide more services for operators, such as consultative inspections.
3. Recommendations
Three general recommendations were made by the panel in regards to
technology improvements to support the ongoing efforts of managing risk. While it is
understood that a study of best practices is beyond the scope of this evaluation, these
recommendations support the continued study and research that DEH staff are already
doing in regards to building the most efficient and useful system to support the food
safety program. The first recommendation deals with automating the manual field
inspection forms. The second recommendation focuses on reducing dependency on
the KIVA system. The third recommendation deals with staffing in the IT area.
42
A. Automating the Manual Inspection Forms
Continued research into how an automated field system can be integrated
within the current KIVA system is strongly recommended to support the current food
program. It is noted that ability to scan reformatted inspection forms into the system
is already a great improvement over keying data manually. Based on experience and
the referenced studies in Baltimore and Tacoma (see appendix E), it has been
demonstrated in many areas of the country in jurisdictions that follow the same risk-
based inspection philosophy that such a system could result in many improvements to
the field inspection process, not only for the person conducting the inspection but also
the food facility operators. From the panel members who currently work with
automated systems, it was noted that management also benefits from having timely
information available to monitor the activities of staff and the conditions of licensed
establishments.
As shown in the studies, one of the expected and possibly most important
savings gained from using an automated field device (whether PDA, laptop, pen-
based tablet computer or other type of device) will be in the time and efficiency for
the staff to complete an inspection. It was directly observed that a substantial amount
of time for every inspection was for the writing and preparation of the inspection
report. If this time could be reduced perhaps more facilities could be inspected.
While there are many solutions being marketed to automating manual
inspection reports, based on their own experiences with such systems, panel members
recommend that FHD continue to review the feasibility of using portable device that
can be pre-programmed with code citations and violation descriptions. In their own
experience, panel members reported that this standardization of coding and
descriptions (which is already done manually for many scenarios) would result in less
inspector time spent hand writing violations, consistent violation descriptions
between environmental health specialists, automatic calculation of violation points,
and easier to read inspection sheets that could be printed off onsite or downloaded
into the establishment computer for paperless inspections.
More expected benefits include the ability to download data to the centralized
data base as needed, ability to create reports on every item entered on the inspection
sheet to make data analysis easier, automatic capture of inspection times, and field

43
access to past inspection reports. The comprehensive use of various data queries as
management tools would be a major enhancement to the program. Standard reporting
queries could be maintained directly from the database and ad hoc queries as needed
for new information could be developed by program supervisors as needed.
Additionally, educational documents and handouts pertaining to food safety in
English, Chinese and Spanish could be stored on the portable device and printed or
transmitted as needed, eliminating the need for each environmental health specialist
to carry hard copies of all the inspection and related documents. If a tablet computer
is chosen, it could also be used in the office with a docking station so that no
additional office computers would be needed.
It was also recognized by the panel members who have had experience with
the computerization of large food safety programs, that there is a significant leaning
curve associated with the introduction of automated field devices and that the learning
curve may be lengthy, depending upon the adaptability and technological skill level of
present staff. During the period of the learning curve, it is expected that effectiveness
and efficiency will suffer. It is the strong conviction of the panel members, based upon
their experience, that once the learning curve is in the rear view mirror, effectiveness,
efficiency, and consistency are greatly improved with an automated field inspection
system.
B. Reducing Dependency on the KIVA System
Currently, the KIVA system dictates the types of reports that can be generated
and the format of the data that is needed for the integrated county system. The
Documentum system with its use of TELEForms solves some of the data input
challenge. To solve the problem of getting the data that is needed in the format that is
needed by FHD, the panel recommends researching the feasibility of developing a
separate system with all the features needed to manage and evaluate the FHD
program that can interface with the KIVA system to give it what it needs. While it is
understood that KIVA is a mandated system and a wholesale replacement is not likely
given the interdependence of other county offices, maintaining program records
independent of KIVA and developing the capability of providing an automated way

44
to interface with KIVA may give the department the flexibility and enhanced data
that it needs while still maintaining the required KIVA system.
During discussions with staff, panel members received the impression that the
KIVA system was not fully meeting the data processing needs of FHD. It is
acknowledged that the current system supporting data management in the County
makes this very difficult to accomplish; however, if basic data from field computers
can be uploaded to the KIVA system then field computers may be a feasible and cost
effective solution to melding two systems and providing further relief from a time-
consuming and inefficient manual process.
The panel recommends continuing the research that led to the TELEForms
system to determine feasibility of using a wholly automated interface between a field
device and the Kiva system to standardize even further the department’s data
collection and interpretation capabilities. While this could lead to a customized
system because of the legacy KIVA system, there are off-the-shelf software products
presently in use across the nation that may be utilized with minor modifications to
interface an automated field device with the KIVA system. The panel does not
recommend a specific system but to continue the path already begun by DEH to
replace the manual inspection forms.
It is the experience of the panel members who work with these systems that
the continued efforts at standardization of the data could have the added benefit of
providing a more comprehensive reporting of food establishment conditions for
consumers on the department’s Web site.
C. IT Staffing Resources
The third recommendation in regards to data management is to provide
additional IT staff for adequate technical support, maintenance of database, and
preparing management reports. The panel members felt that for such a large program
to have only one skilled technical support staff was a weakness and a potential
problem. Although, DEH had just recently hired another person to help support the IT
staff, the new hire is not a full-time position.
The current IT staff support person is a highly skilled individual with an
advanced degree in public health/epidemiology. This individual has the ability to
45
utilize advanced statistical software to run statistical tests and query the data to
answer program and performance questions. However, FHD staff will have to work
more closely with the IT staff so they will gain an understanding of the capabilities of
the present database to provide information of value to management.
It should be noted that the County of San Diego has contracted out all IT
technical services regarding hardware and some software issues. The principle duties
of the IT person are to run all of the reports on the food safety program required by
management. If the current person leaves the program for any reason, technical
support will suffer until replacement personnel can get up to speed.
Section D Verifying Quality of Service
1. Description of Existing Program Component
Maintaining and improving the quality of service is an important aspect of the
food safety program. Behind excellent service one will find there are a consistent and
uniform operations, sufficient resources and training, and means to verify the quality of
service. FHD staff developed a program called “Excellence in Service” that utilizes
quality assurance guidance in the FDA National Retail Food Program Standards
Recommendations.
According to program documentation, the Food Safety Program ensures
consistent focus on reducing risk through a comprehensive field evaluation and
standardization process. All field staff, supervisors, including the chief of the FHD is
standardized on risk factor and intervention based inspections. Customer service is
evaluated through a random annual customer satisfaction survey of facilities inspected.
Throughout the year, a mystery shopper randomly tests the quality of FHD services.
According to the documentation, customer satisfaction scores have achieved an average
of 96%.
DEH produces dashboard reports for management and stakeholders which allow
them to step back from the details and view key trends that impact the risk based
management food safety system
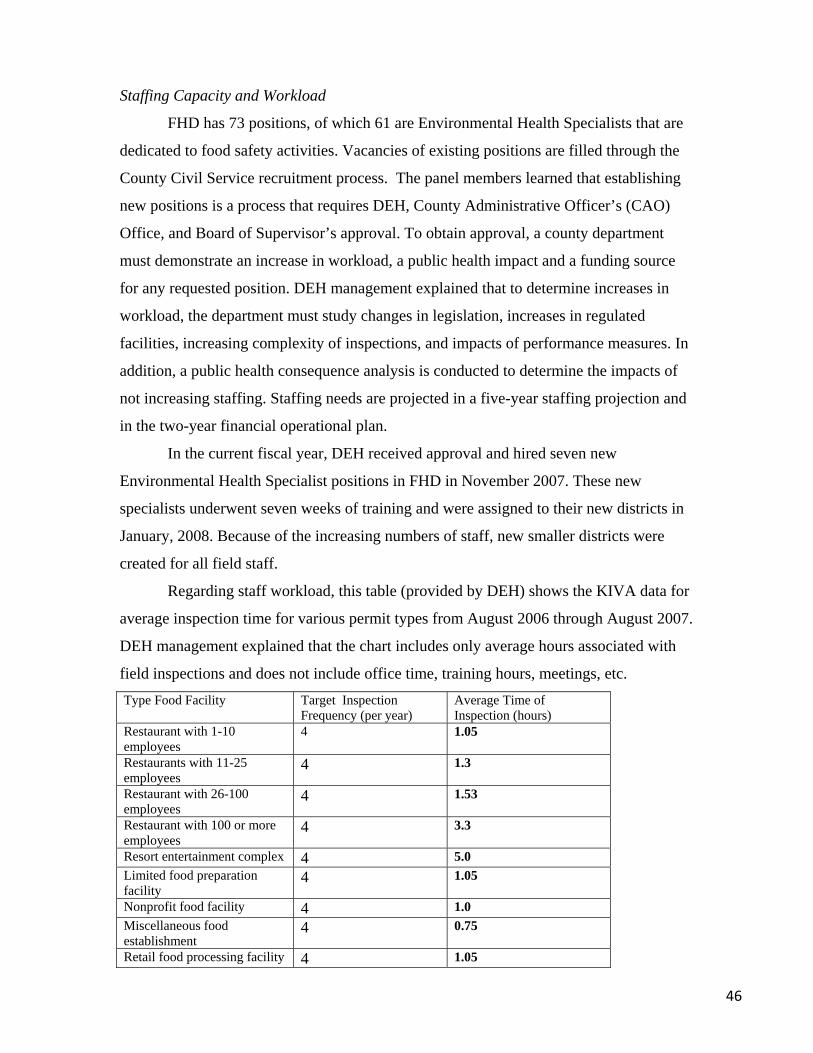
46
Staffing Capacity and Workload
FHD has 73 positions, of which 61 are Environmental Health Specialists that are
dedicated to food safety activities. Vacancies of existing positions are filled through the
County Civil Service recruitment process. The panel members learned that establishing
new positions is a process that requires DEH, County Administrative Officer’s (CAO)
Office, and Board of Supervisor’s approval. To obtain approval, a county department
must demonstrate an increase in workload, a public health impact and a funding source
for any requested position. DEH management explained that to determine increases in
workload, the department must study changes in legislation, increases in regulated
facilities, increasing complexity of inspections, and impacts of performance measures. In
addition, a public health consequence analysis is conducted to determine the impacts of
not increasing staffing. Staffing needs are projected in a five-year staffing projection and
in the two-year financial operational plan.
In the current fiscal year, DEH received approval and hired seven new
Environmental Health Specialist positions in FHD in November 2007. These new
specialists underwent seven weeks of training and were assigned to their new districts in
January, 2008. Because of the increasing numbers of staff, new smaller districts were
created for all field staff.
Regarding staff workload, this table (provided by DEH) shows the KIVA data for
average inspection time for various permit types from August 2006 through August 2007.
DEH management explained that the chart includes only average hours associated with
field inspections and does not include office time, training hours, meetings, etc. Type Food Facility Target Inspection
Frequency (per year) Average Time of Inspection (hours)
Restaurant with 1-10 employees
4 1.05
Restaurants with 11-25 employees
4 1.3
Restaurant with 26-100 employees
4 1.53
Restaurant with 100 or more employees
4 3.3
Resort entertainment complex 4 5.0 Limited food preparation facility
4 1.05
Nonprofit food facility 4 1.0 Miscellaneous food establishment
4 0.75
Retail food processing facility 4 1.05

47
The chart below from the same time period shows additional activities that are not
factored into inspection time but are important to the successful implementation of a food
safety program. Additional Activities Total Time Time per Activity Outbreaks/Recalls (Field)
528 0.35
Complaints 1848 1.23Enforcement (Degrades, Hearings)
440 0.29
Re‐inspection/Follow‐up 2068 1.38
DEH also explained that average routine inspection time is reviewed on a regular
basis to calculate workload as part of the output measures policy. An important point to
note is the averages do not reflect a limitation on time needed to conduct an inspection.
The department has plans to review output measures later in 2008 to determine the
impact from implementation of the new CalCode on inspection time and will made
adjustments as necessary.
Performance Recognition Measures Program
In 1990 the San Diego County Board of Supervisors adopted an Employee
Recognition Program (Ordinance No. 6967; County of San Diego Compensation
Ordinance Article 5.11) that DEH has actively supported. This policy recognizes
employees “for their exemplary performance in a variety of areas, including exceptional
productivity, work on special assignments, development of new ideas and procedures,
exceptional customer service and other areas of professional excellence.” (Department of
Environmental Health Policy and Procedure Manual, Policy No: P30) Awards may
include cash awards, commendations, gift certificates, tickets, lunches, dinners, plaques
and employee recognition leave.
Additionally, the County of San Diego Department of Human Resources has a
Suggestion Award Program (Do-it-Better-By-Suggestion) for “ideas that improve
efficiency of a procedure, program or department; eliminate unnecessary procedures of
duplication of effort; save time, money or materials; improve productivity, reduce costs;
generate revenue; or provide a service that is more effective to the public.”
48
Food Safety Program Funding
The program operates on a full-cost-recovery fee-based system. The permit fees
are structured to generate sufficient revenues to fund the food safety program as a whole.
DEH management explained that activities that support the Food Safety Program include:
industry outreach, staff and industry training, program planning, staff meetings,
regulatory liaison with other local, state and federal agencies; stakeholder input through
participation in local, state and federal stakeholder groups; legislative analysis and
commentary that supports practice programs for the food service industry; development
of guideline documents and providing those documents in multiple formats and
languages for the regulated industry; emergency preparedness activities; illness outbreak
investigation; and information technology development. A one-time fee-credit system
was implemented in 2005-2006. Revenues exceeded program costs in 2006 and rebates
were issued to the owners of licensed food facilities in 2007.
2. Discussion
Verifying quality of service is a component that focuses on ensuring that the
program has a consistent focus on reducing risk through a comprehensive view of the
valuation and standardization process and by evaluating the level of customer service
provided by the program. In other words, is the program working as stated by program
management?
Leadership and Staff
The panel found the management team to be positive, accessible and transparent.
It is one that encourages staff training, participation and feedback. Managers are also
recognized statewide leaders in food safety in California. Of the staff observed (about
10%), they were well-trained, enthusiastic and demonstrated a priority in educating
operators during the inspection. A strength that serves to standardize the workforce is that
all environmental health specialists are required to be California Registered
Environmental Health Specialists (REHS) by state law.
The staff reported that communication is open at all levels of the food safety
division. They also said the strongest components of their program were (1) a consistent
goal, (2) ongoing staff training, (3) outreach to stakeholders, (4) risk-based inspections,
49
and (5) thinking about what they’re trying to do in regards to the reduction of foodborne
illness.
During interviews with the staff, the panel found that all were intelligent,
knowledgeable and wholly supportive of the program. Various staff members indicated
there have been a large number of positive changes in the food program in recent years.
They were universally supportive of management and supervisors.
Staff Training
The staff training manual and program are very impressive. In fact, several
members of the panel asked for a copy of the manual to use as a model for their own food
programs. On a ride-along inspection with a new employee, one panel member remarked
that the new inspector had excellent communication skills, knew the code very well, and
appeared comfortable speaking with food service staff. The panel member attributed this
to the excellent training program. Older staff—in terms of years of service—expressed an
interest in going through the training as well.
Staff is trained to be educator/consultants. They ask operators and line employees
what they do and how they do it. The focus is understanding the operation, assuring that
food is handled safely and compliance with major risk factors, rather than on tangential
physical conditions.
Staffing Capacity and Workload
The workload for environmental health specialists is calculated by hours (1450
per year, per staff person). DEH explained to the panel that this calculates out to about
310 food establishments, plus housing and pools equaling about 400 facilities per
inspector. The developed portion of the county is divided into districts with a number of
routes in each district. The remote areas of the county are called the “Back Country” and
the environmental health professionals assigned to those areas conduct a generalized
program.
The panel found through a limited random selection of about 30 file reviews that
inspections definitely are not reaching the four annual inspections per facility the
program proposes for high-risk establishments. Furthermore, based on the file review, it
appeared that less extensive operations had more inspections than more extensive
50
facilities. Most of the files reviewed showed inspections only once (or not at all) since
June-July 2007. This may have been due to time constraints and number expectations.
Also, the panel acknowledged the impacts due to the major firestorms, recent food recalls
and the work that went into implementing the new CalCode. (It is noteworthy that staff
told the panel that there was inconsistent interpretation of what categories the
establishments fall into: simple, moderate or complex establishments).
The panel found some of the inspection reports in the file review showed a
similarity in inspection times; almost all inspections were recorded as one hour, plus or
minus a few minutes. The panel questioned this similarity in inspection times, especially
in the case of large facilities. Furthermore, panel members have doubts that a thorough
inspection can be completed in one hour. Even with factoring in extra time because of a
ride-along observer, several inspections that were observed by the panel were much
longer than an hour.
Every employee interviewed talked about the stress everyone has been under for a
prolonged period of time. One person mentioned feeling overwhelmed. They mentioned
the fires, the unlicensed vendor problem, the new CalCode, recalls, and training of new
staff to replace retirements.
The panel was unable to completely evaluate the workload requirements of the
staff, although all panel members spent time with environmental health specialists in the
field observing their duties. It appears to the panel that environmental health specialists
have very large workloads considering that there is weekend work and other additional
work to do, as well as multiple inspections expected on establishments. Generally,
environmental health specialists reported that they are performing an average of 8-10
inspections per day (for those working a four day/ten hour schedule), which includes
about three re-inspections and about seven regular inspections per day. It seems as if the
potential for burnout could be high and that there would be minimally sufficient time to
spend talking to operators at this pace. Although there is a system for examining hours
worked, the expectations of this work group seem very high and it was hard for the panel
to observe staff staying on top of the pace expected of them—in fact, the panel believes
they are not.
Although the panel accompanied only six field environmental health specialists
for a total of about 12 inspections observed, there seemed to be a fairly consistent sense

51
of time pressure expressed by the staff. This further supports the finding that overall,
workload appears to be excessive. The panel noted that due to the frequent unexpected
issues that arise in the course of doing environmental health inspection work, there will
always be things, such as the fires and recalls that prevent staff from completing expected
work. Staff reported strong belief that things will improve when the newly hired
employees are assigned to the field.
The panel also noted that recently there was at least a three-year delay in filling
needed positions and recently seven new environmental health specialists had been hired
and trained. All the FHD supervisors agreed that this delay had caused a lot of stress on
everyone and that they are still trying to get on top of many issues. The panel also learned
that although there is an excellent training program for new employees, there is no
program to groom or develop employees for future promotional positions.
Based on file reviews, the panel noted that most inspections reviewed were
recorded as taking approximately an hour, including write up. Additionally, during the
field observations, one panel member noted that the inspector deposited coins in the
parking meter for one hour before entering to do the inspection. The panel also noted a
department goal to inspect complex establishments four times per year. The review panel
questioned both of these expectations and was unable to find clarification in the file
reviews or in discussions with employees. The panel did not understand how such a
limited inspection time would allow for travel delays, adequate menu review in complex
facilities, adequate observation of food handling procedures and hand washing, or
adequate time to discuss issues with the operator. However, the panel understood that the
statistic of “an average time of inspection” is determined solely for the practical purpose
of developing program costs for supporting program fees. The panel noted that the
inspections were performed with a clear focus on completing the risk based inspections
without regard to time limitations when there were definite risk concerns observed in a
facility by the environmental health specialist.
3. Recommendations
Staffing Capacity and Training
The panel recommends considering a more efficient system to fill staff vacancies
which includes making recommendations to the County for budgeting new positions.
52
Under the current system it can take a very long time to hire additional staff when
increases in workload indicate a need for additional staff. Although the County has a very
reasonable process for controlling the approval of new budgeted items for staff, the panel
recommends that DEH review the budget planning process so that new employees can be
hired in a timely manner.
The panel suggests that a data-based review of the expectations for the number of
inspections done per day/per year be undertaken and that adjustments be made to reflect
what is actually consistently achievable regarding staffing levels. An adjustment in these
expectations could also result in decreased stress on staff. Also, it may be prudent to re-
evaluate the classified risk level of facilities overseen by the program with an eye towards
reducing the number of inspections required for less risky facilities, which will allow
more time devoted to complex operations where the risk of foodborne illness is higher.
Training modules presently in place for staff members aspiring for supervisory
positions should be encouraged and if warranted, enhanced.
VI. CONCLUSION
Overall, the panel found that the San Diego Food Safety Program is an excellent
program; however, there are a few program areas that warrant further consideration and
attention by management. It is important to note that virtually every area of concern that
the panel found has already been identified and discussed by DEH/FHD management. In
most cases improvements had already began to be implemented by management and
staff. The recommendations presented in this program review must be considered in this
context. The Food Program operates in a very dynamic environment and the challenge
that DEH/FHD has excelled in is its ability to adapt to and effectively manage their
resources to meet new challenges under some difficult conditions. This was demonstrated
during the countywide firestorms of 2007.
SUMMARY OF RECOMMENDATIONS Recommendation I: A-B-C Grading system - It is recommended that the FHD review the
A-B-C Grading System to determine if the public health messages communicating risk
53
that are conveyed by the present placard system are accurately understood by the public,
and if not, how those public communications can be improved.
Recommendation II: Unlicensed Establishments – It is recommended that the FHD
reconsider the food safety program’s broad goal of reducing foodborne illness to a more
realistically defined goal of reducing the number of Salmonella and Campylobacter cases
or outbreaks in “licensed” facilities.
Recommendation III: Re-examine Food Establishment Classifications – It is
recommended that the FHD re-examine establishment classifications to reduce the
number of "full-service" facilities that actually pose minimal risk.
Recommendation IV: Automating the Manual Inspection Forms and the Field Inspection
System – It is recommended that the DEH/FHD continue to research how an automated
field inspection system can be integrated within the current KIVA system to support the
current food program.
Recommendation V: Need for a Separate Data Management System –It is recommended
that the DEH/FHD research the feasibility of developing a separate system with all the
features needed to manage and evaluate the FHD program that can interface with the
KIVA system.
Recommendation VI: Additional IT Staff – It is recommended that DEH/FHD provide
additional IT staff for adequate technical support, maintenance of database, and preparing
management reports.
Recommendation VII: Staff Capacity –It is recommended that DEH review the budget
planning process and implement changes, if possible, so that new employees can be hired
in a timely manner.
Recommendation VIII: Expected Workloads for Field Staff –It is recommended that
DEH/FHD review the data to determine if the expectations for the number of inspections

54
conducted per day/per year for field staff is reasonable and that adjustments be made in
staffing levels, if necessary, to reflect consistently achievable inspection objectives by
staff.

55
REFERENCES Annex 5 of the 2005 FDA Retail Food Code, Conducting Risk-based Inspections. Department of Environmental Health Policy and Procedure Manual, Policy No: P30 FDA National Retail Food Program Standards Recommendation (created 2004 and updated 2007). Foodhandler’s Guide to Food Safety Food Inspections Data Fields Marking Guideline Procedure for Foodborne Illness Investigation & Response Ordinance No. 6967; County of San Diego Compensation Ordinance Article 5.11 Retail Food Facility Operator’s Guide Team Excellence Risk-Based Food Safety System –San Diego County, Department of Environmental Health, Food and Housing Division
1. Risk-Based Food Safety System (Executive Summary) 2. Communicating Risk 3. Assessing Risk 4. Managing Risk 5. Verifying Quality of Service
Wisconsin Program Standards Evaluation Tool 2007, Agent Self-Assessment Form
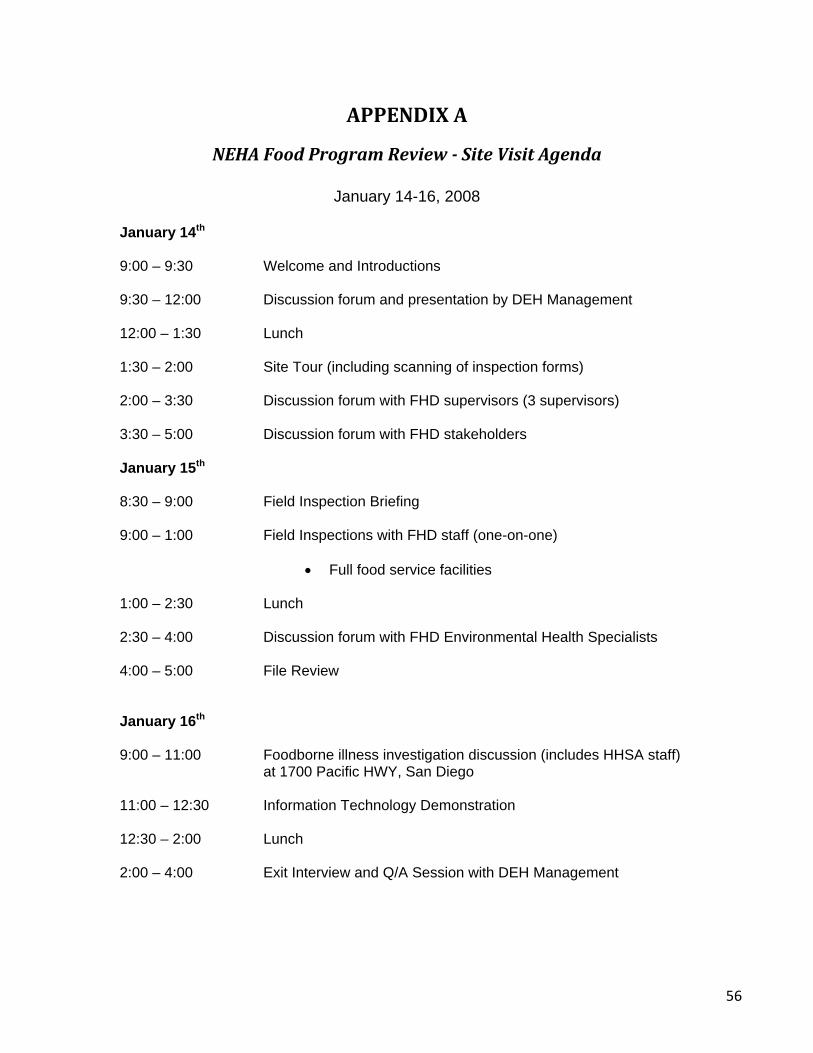
56
APPENDIX A
NEHA Food Program Review Site Visit Agenda
January 14-16, 2008
January 14th 9:00 – 9:30 Welcome and Introductions 9:30 – 12:00 Discussion forum and presentation by DEH Management 12:00 – 1:30 Lunch 1:30 – 2:00 Site Tour (including scanning of inspection forms) 2:00 – 3:30 Discussion forum with FHD supervisors (3 supervisors) 3:30 – 5:00 Discussion forum with FHD stakeholders January 15th 8:30 – 9:00 Field Inspection Briefing 9:00 – 1:00 Field Inspections with FHD staff (one-on-one)
• Full food service facilities 1:00 – 2:30 Lunch 2:30 – 4:00 Discussion forum with FHD Environmental Health Specialists 4:00 – 5:00 File Review January 16th 9:00 – 11:00 Foodborne illness investigation discussion (includes HHSA staff)
at 1700 Pacific HWY, San Diego 11:00 – 12:30 Information Technology Demonstration 12:30 – 2:00 Lunch 2:00 – 4:00 Exit Interview and Q/A Session with DEH Management
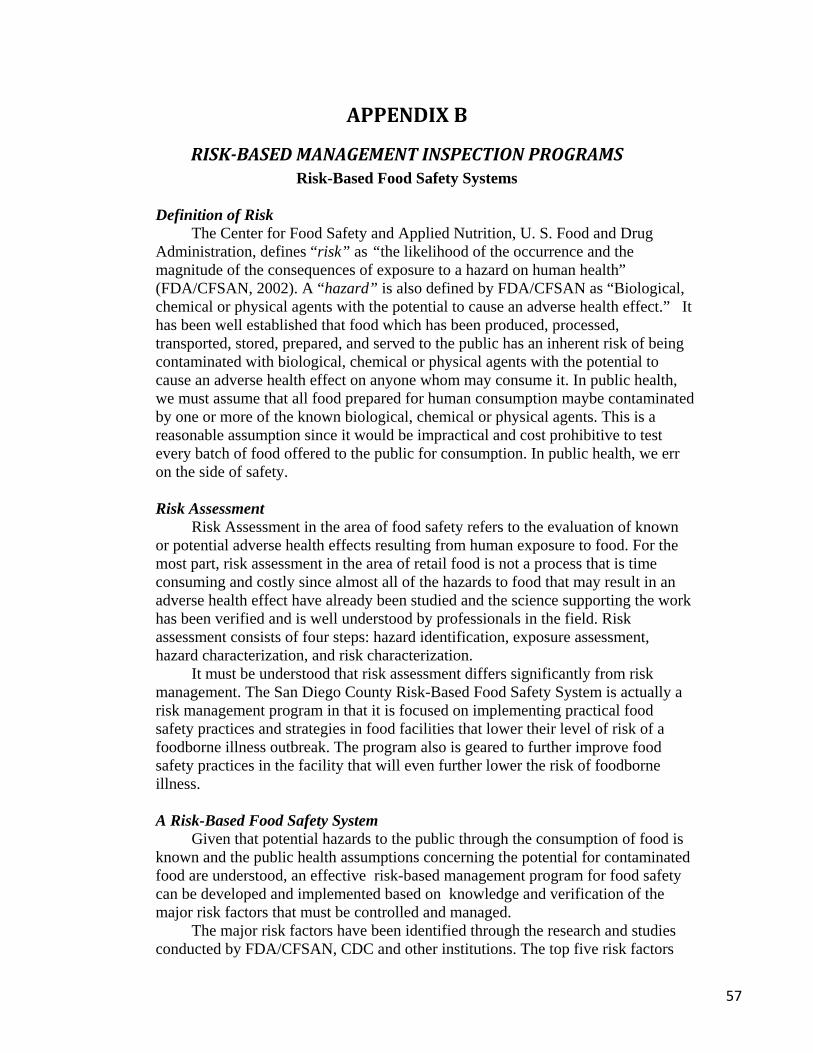
57
APPENDIX B
RISKBASED MANAGEMENT INSPECTION PROGRAMS Risk-Based Food Safety Systems
Definition of Risk
The Center for Food Safety and Applied Nutrition, U. S. Food and Drug Administration, defines “risk” as “the likelihood of the occurrence and the magnitude of the consequences of exposure to a hazard on human health” (FDA/CFSAN, 2002). A “hazard” is also defined by FDA/CFSAN as “Biological, chemical or physical agents with the potential to cause an adverse health effect.” It has been well established that food which has been produced, processed, transported, stored, prepared, and served to the public has an inherent risk of being contaminated with biological, chemical or physical agents with the potential to cause an adverse health effect on anyone whom may consume it. In public health, we must assume that all food prepared for human consumption maybe contaminated by one or more of the known biological, chemical or physical agents. This is a reasonable assumption since it would be impractical and cost prohibitive to test every batch of food offered to the public for consumption. In public health, we err on the side of safety. Risk Assessment
Risk Assessment in the area of food safety refers to the evaluation of known or potential adverse health effects resulting from human exposure to food. For the most part, risk assessment in the area of retail food is not a process that is time consuming and costly since almost all of the hazards to food that may result in an adverse health effect have already been studied and the science supporting the work has been verified and is well understood by professionals in the field. Risk assessment consists of four steps: hazard identification, exposure assessment, hazard characterization, and risk characterization.
It must be understood that risk assessment differs significantly from risk management. The San Diego County Risk-Based Food Safety System is actually a risk management program in that it is focused on implementing practical food safety practices and strategies in food facilities that lower their level of risk of a foodborne illness outbreak. The program also is geared to further improve food safety practices in the facility that will even further lower the risk of foodborne illness.
A Risk-Based Food Safety System
Given that potential hazards to the public through the consumption of food is known and the public health assumptions concerning the potential for contaminated food are understood, an effective risk-based management program for food safety can be developed and implemented based on knowledge and verification of the major risk factors that must be controlled and managed.
The major risk factors have been identified through the research and studies conducted by FDA/CFSAN, CDC and other institutions. The top five risk factors

58
for foodborne illness around which the San Diego Risk-Based Food Safety System is based are:
1) Food from unsafe sources; 2) Improper holding temperatures; 3) Inadequate cooking; 4) Contaminated equipment; and, 5) Poor personal hygiene When these risk factors are operationalized as specific risk factors observed
during inspections they are defined as follows: 1) Food temperature not < 41oF; 2) Food temperature not > 135oF; 3) Improper Cooling; 4) Employee Hygiene; 5) Heating/Cooking; Source; 6) Contact Surface; and, 7) Cross Contamination The San Diego Risk-Based Food Safety System is just that, a “system.” The
components of the system are Assessing Risk, Communicating Risk, Managing Risk, and Verifying Quality of Service.
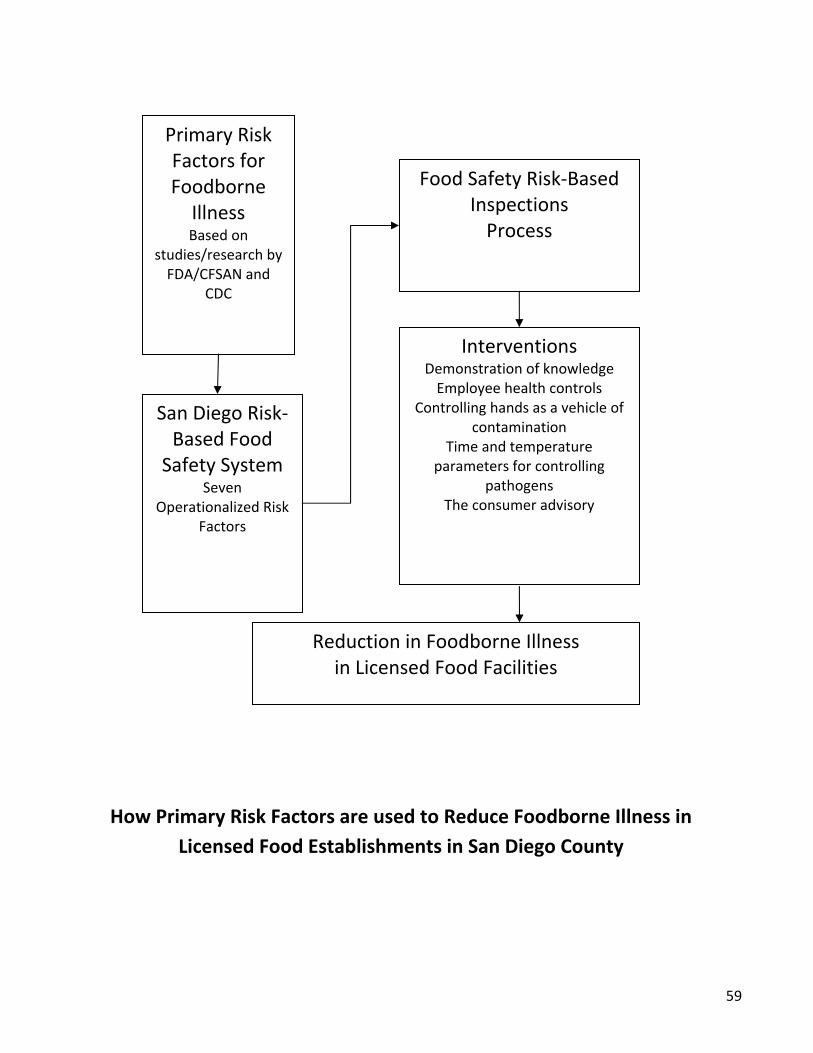
59
Primary Risk Factors for Foodborne Illness Based on
studies/research by FDA/CFSAN and
CDC
San Diego Risk‐Based Food Safety System
Seven Operationalized Risk
Factors
Food Safety Risk‐Based Inspections Process
Interventions Demonstration of knowledge Employee health controls
Controlling hands as a vehicle of contamination
Time and temperature parameters for controlling
pathogens The consumer advisory
Reduction in Foodborne Illness in Licensed Food Facilities
How Primary Risk Factors are used to Reduce Foodborne Illness in Licensed Food Establishments in San Diego County
60
APPENDIX C
[Wisconsin] Program Standards Evaluation Tool 2007,
Agent SelfAssessment Form This document contains data that was supplied by the San Diego County Department of Environmental Health, Food and Housing Division.

Program Standards Evaluation Tool
2007 Agent Self-Assessment Form
Date Prepared: January 7, 2008 Agent Health Department: San Diego County Department of Environmental Health Director: Gary W. Erbeck, MPH, REHS Chief: Liz Pozzebon, MS, REHS
INTRODUCTION: The agent self-assessment form is a measurement tool designed to help measure your performance and status. It is also an excellent tool for you to use in evaluating your own program. Combined with periodic field evaluations, standardization, and paperwork audits, this enables the agencies, to chart the course for consistent and uniform inspection programs. Instructions:
• Supporting documentation should be current, on file in your department, and easily verifiable. • Please answer the following questions for each of the standards and provide the required
documentation.
PROGRAM GOAL 1: PROGRAM FOUNDATION
Nothing has changed since last year - go to Goal #2 This goal applies to the regulatory foundation used by a retail food program. Regulatory foundation includes any statute, regulation, rule, ordinance, or other prevailing set of regulatory requirements that governs the operation of a retail food establishment.
The desired outcome of this standard is the adoption of a sound, science-based regulatory foundation for the public health program and the uniform regulation of industry.
Table 1 Regulatory Foundations
Component Yes No A copy of the local ordinance describing your inspection and enforcement program:
X
A written plan of action to ensure cooperation with federal, state, and local agencies in the event of a natural disaster or similar emergency
X
Written procedures for the investigation and follow-up of reports of suspected food (water) borne illness
X
Written procedures for the investigation and follow-up of citizen complaints [other than food (water) borne illness] regarding licensed facilities
X
A current list of licensing fees X A written compliance program X Current State policies and interpretations are available to Inspection staff X Copy of the California Retail Food Code X

Page 2 of 17
Do you have other written policies and procedures for your program other than those discussed above? If yes, please list them. FHD Staff Bulletins, these bulletins provide guidance for specific issues or situation that commonly occurs.
PROGRAM GOAL 2: TRAINED REGULATORY STAFF
This goal applies to the essential elements of a training program for regulatory staff. The regulatory staff shall have the knowledge, skills, and ability to adequately perform their required duties. The agencies strongly encourage participation on the various committees. We have found a strong correlation between the amount of training and the effectiveness of the inspection program.
The desired outcome of this standard is a trained regulatory staff with the skills and knowledge necessary to conduct quality inspections.
For each of your staff, fill in the following table and answer the remaining questions.
Table 2A - Staff Training
SEE STAFF TRAINING LOG
Name Highest Degree
Attained-
RS or REHS
(check if yes)
Standardized by State or
Local? (S=State,
L=local, N= not standardized
yet)
Other Relevant Degrees or Certifications
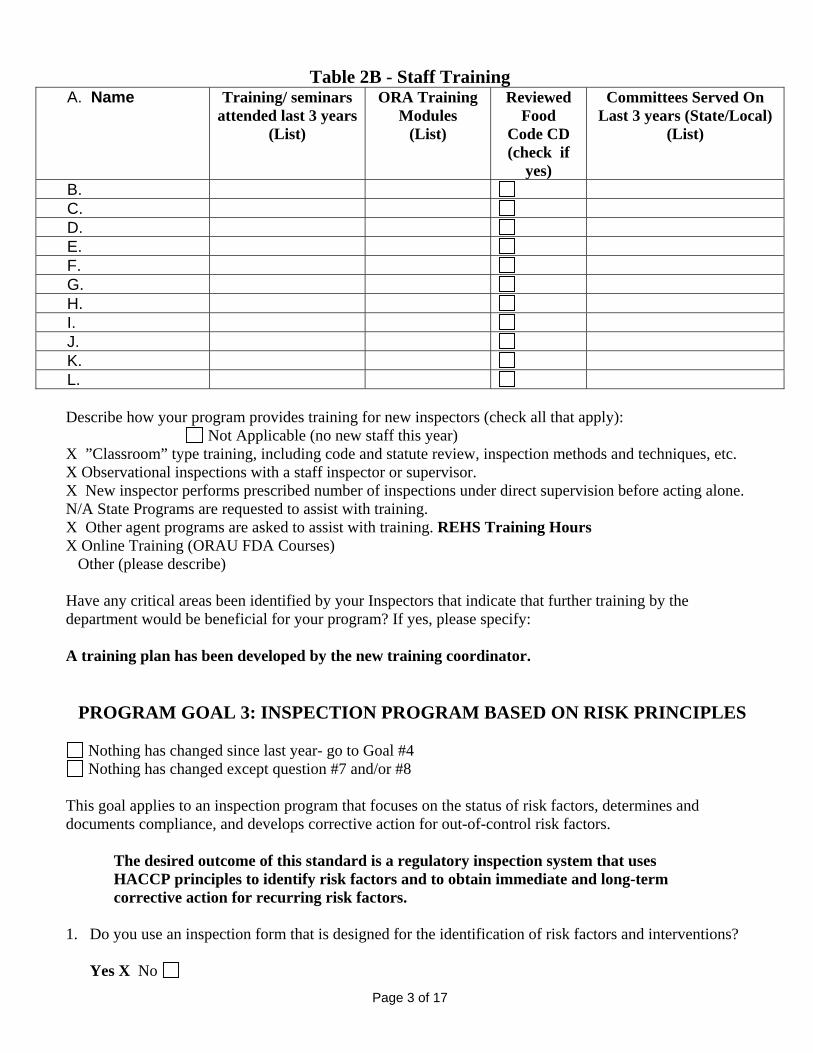
Page 3 of 17
Table 2B - Staff Training A. Name Training/ seminars
attended last 3 years(List)
ORA Training Modules
(List)
Reviewed Food
Code CD (check if
yes)
Committees Served On Last 3 years (State/Local)
(List)
B. C. D. E. F. G. H. I. J. K. L. Describe how your program provides training for new inspectors (check all that apply): Not Applicable (no new staff this year) X ”Classroom” type training, including code and statute review, inspection methods and techniques, etc. X Observational inspections with a staff inspector or supervisor. X New inspector performs prescribed number of inspections under direct supervision before acting alone. N/A State Programs are requested to assist with training. X Other agent programs are asked to assist with training. REHS Training Hours X Online Training (ORAU FDA Courses) Other (please describe) Have any critical areas been identified by your Inspectors that indicate that further training by the department would be beneficial for your program? If yes, please specify: A training plan has been developed by the new training coordinator. PROGRAM GOAL 3: INSPECTION PROGRAM BASED ON RISK PRINCIPLES
Nothing has changed since last year- go to Goal #4 Nothing has changed except question #7 and/or #8
This goal applies to an inspection program that focuses on the status of risk factors, determines and documents compliance, and develops corrective action for out-of-control risk factors.
The desired outcome of this standard is a regulatory inspection system that uses HACCP principles to identify risk factors and to obtain immediate and long-term corrective action for recurring risk factors.
1. Do you use an inspection form that is designed for the identification of risk factors and interventions?
Yes X No

Page 4 of 17
2. Have you developed a process that organizes food establishments into categories based on potential and
inherent food safety risks?
Yes X No
If yes, what model did you use? (If other than State model, please submit a copy) Our own design X Other
Describe: Full service, Limited food service, and prepackaged
3. Do you assign inspection frequency based on the risk categories to focus program resources on food
operations with the greatest food safety risk?
Yes X No 4. Have you developed and implemented a written program policy that requires:
A. On-site corrective actions* as appropriate to the type of violation Yes X No B. Discussion of long-term control** of risk factor options Yes X No
C. Follow-up activities such as re-inspections Yes X No
If you do not do inspections based on CDC risk factors, then briefly describe your program (attach a page). 5. What percentage of inspections are pre-arranged or performed by appointment? Not Tracked % We conduct scheduled plan review inspections. An operational consultative inspection process using Appendix C of the Operators Guide is planned for 2009. 6. How many HACCP plans are in place in your jurisdiction? Not Tracked
How often are they verified? Verification of mandatory HACCP Plans is conducted at the State level, and not at the local level.
*Note: On-site corrective action as appropriate to the violation would include such things as: • Destruction of foods that have been adulterated or experienced extreme temperature abuse; • Embargo or destruction of foods from unapproved sources; • Accelerated cooling of foods when cooling time limits can still be met; • Reheating when small deviations from hot holding have occurred; • Continued cooking when proper cooking temperatures have not been met; • Initiated use of gloves, tongs, or utensils to prevent hand contact with ready-to-eat foods, or

Page 5 of 17
• Required hand washing when potential contamination is observed. **Note: Risk control plans, standard operating procedures, buyer specifications, menu modification, HACCP plans and equipment or facility modification may be discussed as options to achieve the long-term control of risk factors
PROGRAM GOAL 4: UNIFORM INSPECTION PROGRAM
Nothing has changed since last year- go to Goal #5 This goal applies to the jurisdiction's internal policies and procedures established to ensure uniformity among regulatory staff in the interpretation of regulatory requirements, program policies and compliance / enforcement procedures. Program management implements an on-going quality assurance program that evaluates inspection uniformity to ensure inspection quality, inspection frequency and uniformity among the regulatory staff. The role of the supervisor is stressed in this Goal.
The desired outcome of this standard is that a quality assurance program exists that ensures uniform, high quality inspections.
Part I: (complete only if your program has been state-standardized) 1. Which public health inspector was standardized by the state? All field inspectors have been standardized except 9 new staff. The new staff is still in their training process.
Date Standardized? See attached table
Dates of re-standardization (maintenance exercises?) See attached table
2. Have all your public health inspectors involved with food been standardized by your certified sanitarian? Yes X No Except as specified in #1 above. (Registered Environmental Health Specialist)
3. Fill out the following table for each inspector internally standardized.
Table 3 Standardization (Internal) SEE STANDARDIZATION DOCUMENTATION Standard: Establishment #1 Establishment #2 Establishment #3 Establishment #4
Date: Candidate's Name
Facility Name Total

Page 6 of 17
Risk Based Inspection
Good Retail Practices Standard: Establishment #1 Establishment #2 Establishment #3 Establishment #4
Date: Candidate's Name
Facility Name TotalRisk Based Inspection
Good Retail Practices
Standard: Establishment #1 Establishment #2 Establishment #3 Establishment #4
Date: Candidate's Name
Facility Name TotalRisk Based Inspection
Good Retail Practices Standard: Establishment #1 Establishment #2 Establishment #3 Establishment #4
Date: Candidate's Name
Facility Name TotalRisk Based Inspection
Good Retail Practices Standard: Establishment #1 Establishment #2 Establishment #3 Establishment #4
Date: Candidate's Name
Facility Name TotalRisk Based Inspection
Good Retail Practices Standard: Establishment #1 Establishment #2 Establishment #3 Establishment #4
Date: Candidate's Name
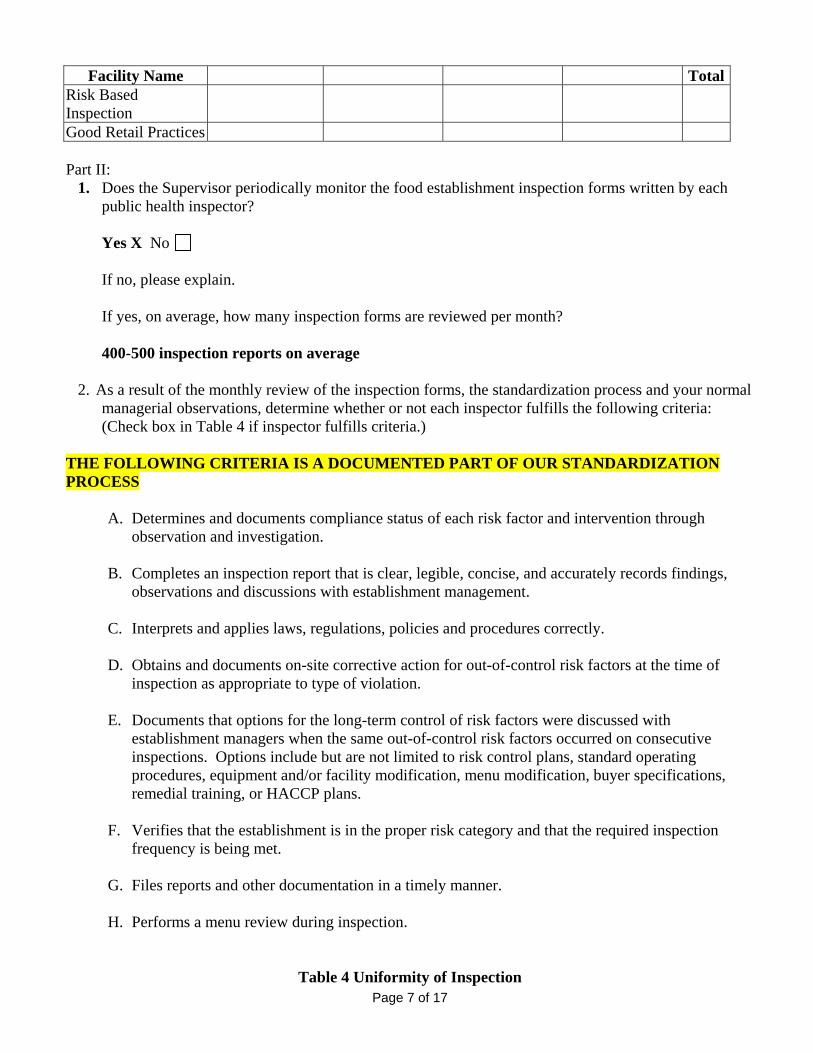
Page 7 of 17
Facility Name TotalRisk Based Inspection
Good Retail Practices Part II:
1. Does the Supervisor periodically monitor the food establishment inspection forms written by each public health inspector?
Yes X No If no, please explain.
If yes, on average, how many inspection forms are reviewed per month? 400-500 inspection reports on average
2. As a result of the monthly review of the inspection forms, the standardization process and your normal
managerial observations, determine whether or not each inspector fulfills the following criteria: (Check box in Table 4 if inspector fulfills criteria.)
THE FOLLOWING CRITERIA IS A DOCUMENTED PART OF OUR STANDARDIZATION PROCESS
A. Determines and documents compliance status of each risk factor and intervention through observation and investigation.
B. Completes an inspection report that is clear, legible, concise, and accurately records findings,
observations and discussions with establishment management.
C. Interprets and applies laws, regulations, policies and procedures correctly.
D. Obtains and documents on-site corrective action for out-of-control risk factors at the time of inspection as appropriate to type of violation.
E. Documents that options for the long-term control of risk factors were discussed with
establishment managers when the same out-of-control risk factors occurred on consecutive inspections. Options include but are not limited to risk control plans, standard operating procedures, equipment and/or facility modification, menu modification, buyer specifications, remedial training, or HACCP plans.
F. Verifies that the establishment is in the proper risk category and that the required inspection
frequency is being met.
G. Files reports and other documentation in a timely manner.
H. Performs a menu review during inspection.
Table 4 Uniformity of Inspection

Page 8 of 17
Criteria from above A B C D E F G H Inspector:
PROGRAM GOAL 5: FOOD-BORNE ILLNESS This goal applies to the investigation and subsequent review of alleged food-borne illness incidents and outbreaks. The program has an established system to collect and investigate complaints of food-related illness and injury; and investigate food-borne disease outbreaks. Excellent data collection will help us to relate behaviors and activities to these negative outcomes.
The desired outcome of this standard is that a food regulatory program has a systematic approach for the investigation, documentation and analysis of alleged food-related illness and injury.
1. How many food-borne illness complaints were received in the last licensing year?
650 2. How many were confirmed (i.e., an investigation revealed statistically significant evidence of the
occurrence of a food-borne illness)?
Analysis still under way
If none of the remaining questions have changed since last year- go to Goal #6 3. How do you track food-borne illness cases, confirmed or not (i.e., do you keep a log)?
FBI Reports 4. Do you have documentation on file for any confirmed food-borne illnesses? Yes X No NA 5. Please identify and describe any laboratory support for illness or injury investigations for follow-up
sampling and surveillance activities related to foodborne illness investigation.
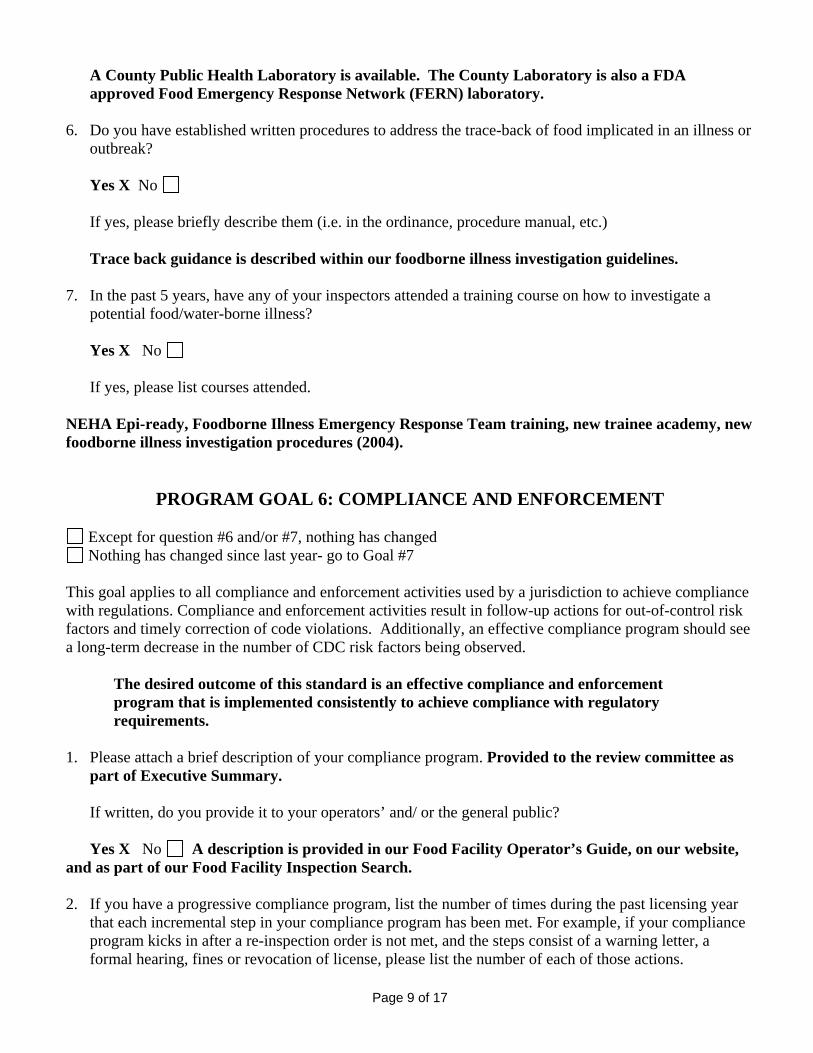
Page 9 of 17
A County Public Health Laboratory is available. The County Laboratory is also a FDA approved Food Emergency Response Network (FERN) laboratory.
6. Do you have established written procedures to address the trace-back of food implicated in an illness or
outbreak?
Yes X No
If yes, please briefly describe them (i.e. in the ordinance, procedure manual, etc.) Trace back guidance is described within our foodborne illness investigation guidelines.
7. In the past 5 years, have any of your inspectors attended a training course on how to investigate a
potential food/water-borne illness?
Yes X No If yes, please list courses attended.
NEHA Epi-ready, Foodborne Illness Emergency Response Team training, new trainee academy, new foodborne illness investigation procedures (2004).
PROGRAM GOAL 6: COMPLIANCE AND ENFORCEMENT
Except for question #6 and/or #7, nothing has changed Nothing has changed since last year- go to Goal #7
This goal applies to all compliance and enforcement activities used by a jurisdiction to achieve compliance with regulations. Compliance and enforcement activities result in follow-up actions for out-of-control risk factors and timely correction of code violations. Additionally, an effective compliance program should see a long-term decrease in the number of CDC risk factors being observed.
The desired outcome of this standard is an effective compliance and enforcement program that is implemented consistently to achieve compliance with regulatory requirements.
1. Please attach a brief description of your compliance program. Provided to the review committee as
part of Executive Summary. If written, do you provide it to your operators’ and/ or the general public? Yes X No A description is provided in our Food Facility Operator’s Guide, on our website,
and as part of our Food Facility Inspection Search. 2. If you have a progressive compliance program, list the number of times during the past licensing year
that each incremental step in your compliance program has been met. For example, if your compliance program kicks in after a re-inspection order is not met, and the steps consist of a warning letter, a formal hearing, fines or revocation of license, please list the number of each of those actions.

Page 10 of 17
Describe: Informal Hearings = At least 43 Permit Suspension/Revocation Hearings = 2
3. Is there a system in place that ensures those facilities requiring re-inspection is followed up in a timely
fashion?
Yes X No Describe: Supervisors and field staff track the facilities that require follow up inspection to ensure the re-inspections (notice follow ups) are completed. 4. How does your program determine when a re-inspection should be performed?
We have a formula that is followed, (i.e., if violation X exists, a re-inspection is always performed, etc). If a formula is followed, please attach a description.
It is up to the individual inspector to decide if a re-inspection will be performed.
X Other (please describe)
Guidance is provided for field staff to use through our compliance and enforcement procedures
a. Is there a fee associated with a reinspection?
Yes X No b. What is the amount of the fee?
$115.00 c. If a fee is charged, is it a one-time fee or is the fee assessed per re-inspection? X
The first re-inspection after every routine inspection is covered in the cost of the permit fee.
5. Is there a system in place that focuses on recurring critical violations and establishes interventions?
Yes X No
If yes, please describe: Repeat major violations result in some type of intervention.
6. How many establishments were closed for non-compliance (temporarily)? 127 in 2007 7. How many establishments were closed for non-compliance (permanently) 0 in 2007 8. Do you evaluate the impact of your program efforts towards the reduction of CDC risk factors and
other factors responsible for FBI’s? Yes X No Describe: Major violations are tracked in a dashboard report.
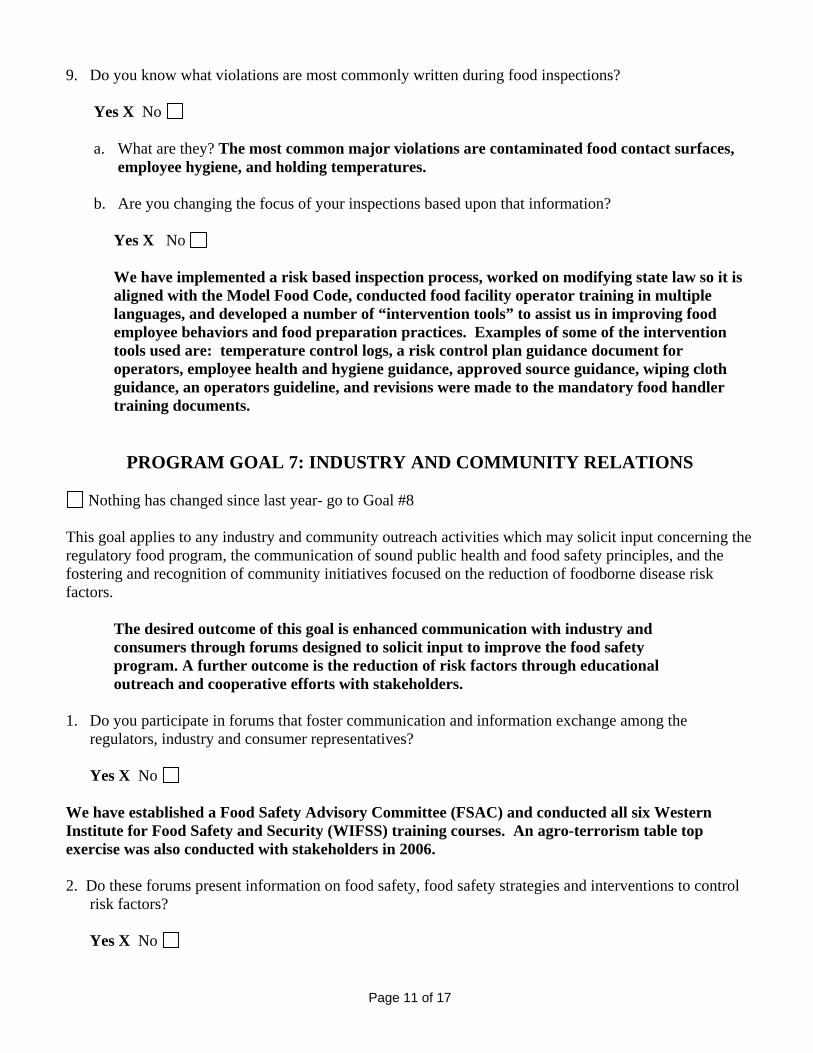
Page 11 of 17
9. Do you know what violations are most commonly written during food inspections? Yes X No a. What are they? The most common major violations are contaminated food contact surfaces,
employee hygiene, and holding temperatures. b. Are you changing the focus of your inspections based upon that information?
Yes X No We have implemented a risk based inspection process, worked on modifying state law so it is aligned with the Model Food Code, conducted food facility operator training in multiple languages, and developed a number of “intervention tools” to assist us in improving food employee behaviors and food preparation practices. Examples of some of the intervention tools used are: temperature control logs, a risk control plan guidance document for operators, employee health and hygiene guidance, approved source guidance, wiping cloth guidance, an operators guideline, and revisions were made to the mandatory food handler training documents.
PROGRAM GOAL 7: INDUSTRY AND COMMUNITY RELATIONS
Nothing has changed since last year- go to Goal #8 This goal applies to any industry and community outreach activities which may solicit input concerning the regulatory food program, the communication of sound public health and food safety principles, and the fostering and recognition of community initiatives focused on the reduction of foodborne disease risk factors.
The desired outcome of this goal is enhanced communication with industry and consumers through forums designed to solicit input to improve the food safety program. A further outcome is the reduction of risk factors through educational outreach and cooperative efforts with stakeholders.
1. Do you participate in forums that foster communication and information exchange among the
regulators, industry and consumer representatives?
Yes X No
We have established a Food Safety Advisory Committee (FSAC) and conducted all six Western Institute for Food Safety and Security (WIFSS) training courses. An agro-terrorism table top exercise was also conducted with stakeholders in 2006. 2. Do these forums present information on food safety, food safety strategies and interventions to control
risk factors?
Yes X No
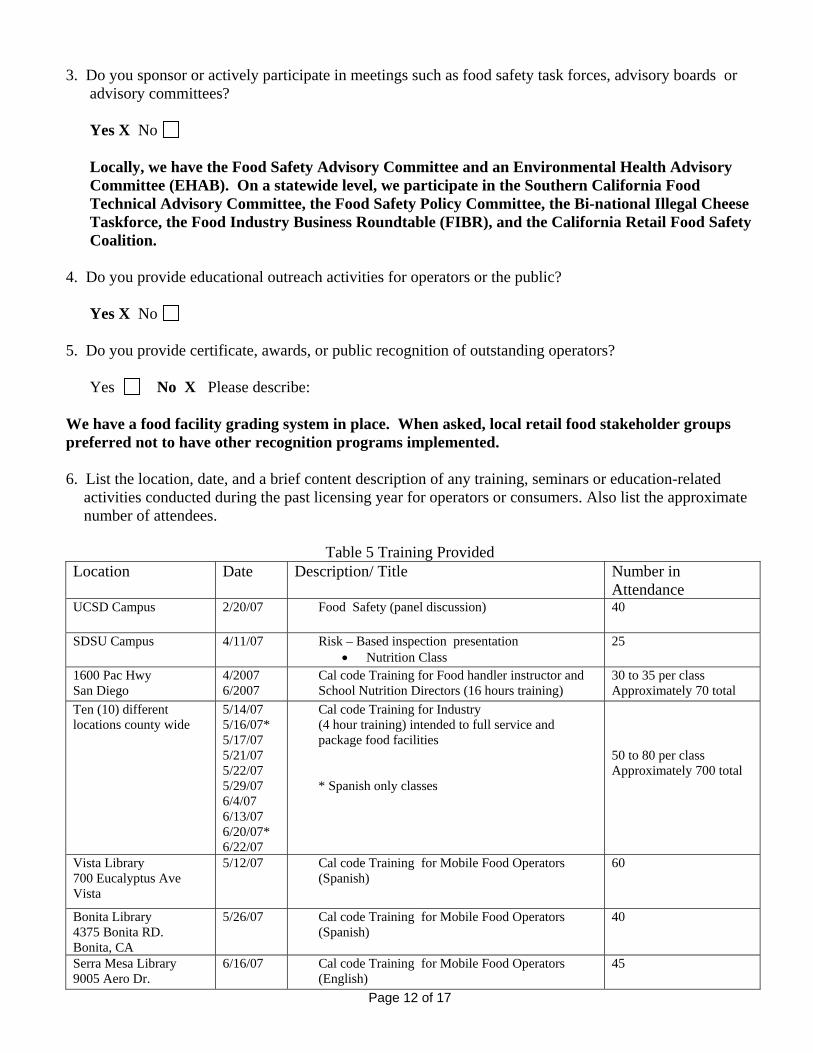
Page 12 of 17
3. Do you sponsor or actively participate in meetings such as food safety task forces, advisory boards or advisory committees?
Yes X No Locally, we have the Food Safety Advisory Committee and an Environmental Health Advisory Committee (EHAB). On a statewide level, we participate in the Southern California Food Technical Advisory Committee, the Food Safety Policy Committee, the Bi-national Illegal Cheese Taskforce, the Food Industry Business Roundtable (FIBR), and the California Retail Food Safety Coalition.
4. Do you provide educational outreach activities for operators or the public?
Yes X No
5. Do you provide certificate, awards, or public recognition of outstanding operators? Yes No X Please describe: We have a food facility grading system in place. When asked, local retail food stakeholder groups preferred not to have other recognition programs implemented. 6. List the location, date, and a brief content description of any training, seminars or education-related
activities conducted during the past licensing year for operators or consumers. Also list the approximate number of attendees.
Table 5 Training Provided
Location Date Description/ Title Number in Attendance
UCSD Campus 2/20/07 Food Safety (panel discussion) 40
SDSU Campus 4/11/07 Risk – Based inspection presentation • Nutrition Class
25
1600 Pac Hwy San Diego
4/2007 6/2007
Cal code Training for Food handler instructor and School Nutrition Directors (16 hours training)
30 to 35 per class Approximately 70 total
Ten (10) different locations county wide
5/14/07 5/16/07* 5/17/07 5/21/07 5/22/07 5/29/07 6/4/07 6/13/07 6/20/07* 6/22/07
Cal code Training for Industry (4 hour training) intended to full service and package food facilities * Spanish only classes
50 to 80 per class Approximately 700 total
Vista Library 700 Eucalyptus Ave Vista
5/12/07 Cal code Training for Mobile Food Operators (Spanish)
60
Bonita Library 4375 Bonita RD. Bonita, CA
5/26/07 Cal code Training for Mobile Food Operators (Spanish)
40
Serra Mesa Library 9005 Aero Dr.
6/16/07 Cal code Training for Mobile Food Operators (English)
45
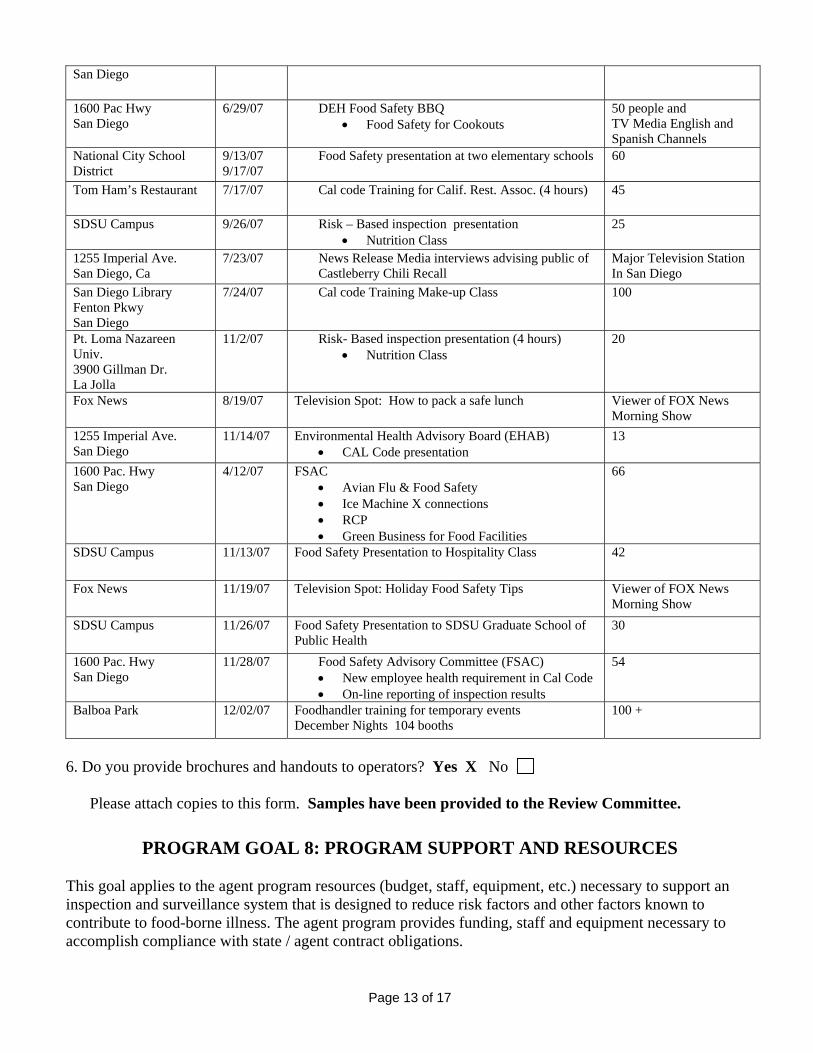
Page 13 of 17
San Diego 1600 Pac Hwy San Diego
6/29/07 DEH Food Safety BBQ • Food Safety for Cookouts
50 people and TV Media English and Spanish Channels
National City School District
9/13/07 9/17/07
Food Safety presentation at two elementary schools 60
Tom Ham’s Restaurant 7/17/07 Cal code Training for Calif. Rest. Assoc. (4 hours) 45
SDSU Campus 9/26/07 Risk – Based inspection presentation • Nutrition Class
25
1255 Imperial Ave. San Diego, Ca
7/23/07 News Release Media interviews advising public of Castleberry Chili Recall
Major Television Station In San Diego
San Diego Library Fenton Pkwy San Diego
7/24/07 Cal code Training Make-up Class 100
Pt. Loma Nazareen Univ. 3900 Gillman Dr. La Jolla
11/2/07 Risk- Based inspection presentation (4 hours) • Nutrition Class
20
Fox News 8/19/07 Television Spot: How to pack a safe lunch
Viewer of FOX News Morning Show
1255 Imperial Ave. San Diego
11/14/07 Environmental Health Advisory Board (EHAB) • CAL Code presentation
13
1600 Pac. Hwy San Diego
4/12/07 FSAC • Avian Flu & Food Safety • Ice Machine X connections • RCP • Green Business for Food Facilities
66
SDSU Campus 11/13/07 Food Safety Presentation to Hospitality Class 42
Fox News 11/19/07 Television Spot: Holiday Food Safety Tips
Viewer of FOX News Morning Show
SDSU Campus 11/26/07 Food Safety Presentation to SDSU Graduate School of Public Health
30
1600 Pac. Hwy San Diego
11/28/07 Food Safety Advisory Committee (FSAC) • New employee health requirement in Cal Code • On-line reporting of inspection results
54
Balboa Park 12/02/07 Foodhandler training for temporary events December Nights 104 booths
100 +
6. Do you provide brochures and handouts to operators? Yes X No Please attach copies to this form. Samples have been provided to the Review Committee.
PROGRAM GOAL 8: PROGRAM SUPPORT AND RESOURCES
This goal applies to the agent program resources (budget, staff, equipment, etc.) necessary to support an inspection and surveillance system that is designed to reduce risk factors and other factors known to contribute to food-borne illness. The agent program provides funding, staff and equipment necessary to accomplish compliance with state / agent contract obligations.
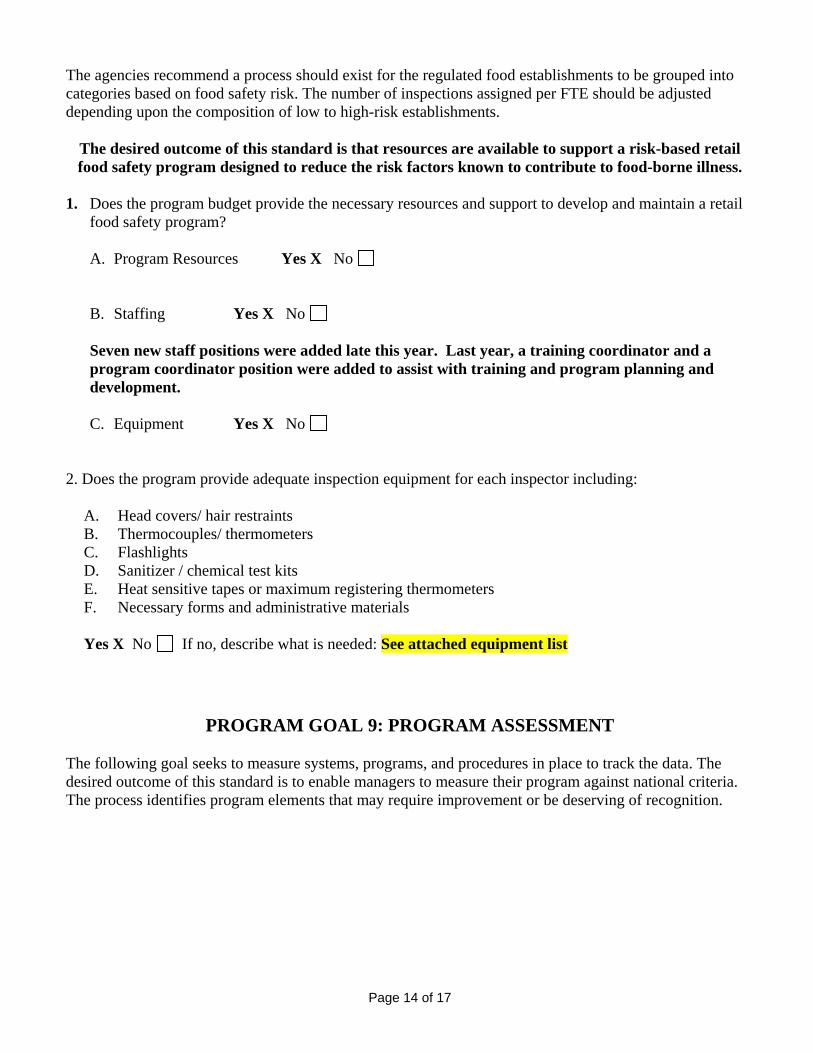
Page 14 of 17
The agencies recommend a process should exist for the regulated food establishments to be grouped into categories based on food safety risk. The number of inspections assigned per FTE should be adjusted depending upon the composition of low to high-risk establishments.
The desired outcome of this standard is that resources are available to support a risk-based retail food safety program designed to reduce the risk factors known to contribute to food-borne illness.
1. Does the program budget provide the necessary resources and support to develop and maintain a retail
food safety program?
A. Program Resources Yes X No B. Staffing Yes X No Seven new staff positions were added late this year. Last year, a training coordinator and a program coordinator position were added to assist with training and program planning and development. C. Equipment Yes X No
2. Does the program provide adequate inspection equipment for each inspector including:
A. Head covers/ hair restraints B. Thermocouples/ thermometers C. Flashlights D. Sanitizer / chemical test kits E. Heat sensitive tapes or maximum registering thermometers F. Necessary forms and administrative materials Yes X No If no, describe what is needed: See attached equipment list
PROGRAM GOAL 9: PROGRAM ASSESSMENT The following goal seeks to measure systems, programs, and procedures in place to track the data. The desired outcome of this standard is to enable managers to measure their program against national criteria. The process identifies program elements that may require improvement or be deserving of recognition.

Page 15 of 17
Part I: Inspection Profile:
1. Fill out the following table based on the previous licensing year. Major events impacting inspections conducted include Firestorm 2007, CalCode implementation (comprehensive staff training, industry outreach, and implementation inspections), 27 food product recall effectiveness checks (triple the number conducted in 2006), a new staff training academy, and 7 vacancies (5 were retirements).
Table 7 - Inspection Profile Type of Establishment Number of
Establishments
Number of Routine
Inspections
Freq. Number of Pre-
Inspections
Number of Initial
Re-inspections
(excludes 6FNONE and 6FINACTIVE)
707 New Food Facilities 152 Remodels 80 Mobile Food Units
We were unable to track this prior to July 2007 when we developed a new inspection report form.
Restaurant (FA00) 6615 16917 2.56 859 Restaurant (FA04) 92 527 5.73 Limited Food Prep (FA05) 686 1357 1.98 Non –Profit (FA06) 183 240 1.31 Miscellaneous (FA07) 1112 939 0.84 Food Processing (FA08) 69 162 2.35 School (processing) (FA17) 240 585 2.44 School (Satellite) (FA18) 321 819 2.55 Market (FA50) 1303 1822 1.40 Market w/Food prep (FA55) 1194 2965 2.48 Temp Event (FA6*)
1660* 1691 1.02
Mobile Food Prep (FB*) 1325 1771 1.34 80 TOTALS 14800 29795 939
2. Has every licensed facility been inspected?
Yes X No All facilities that are required to have a health permit are inspected.
3. Describe the system you use to track the facilities that need to be inspected and those that have been
inspected.
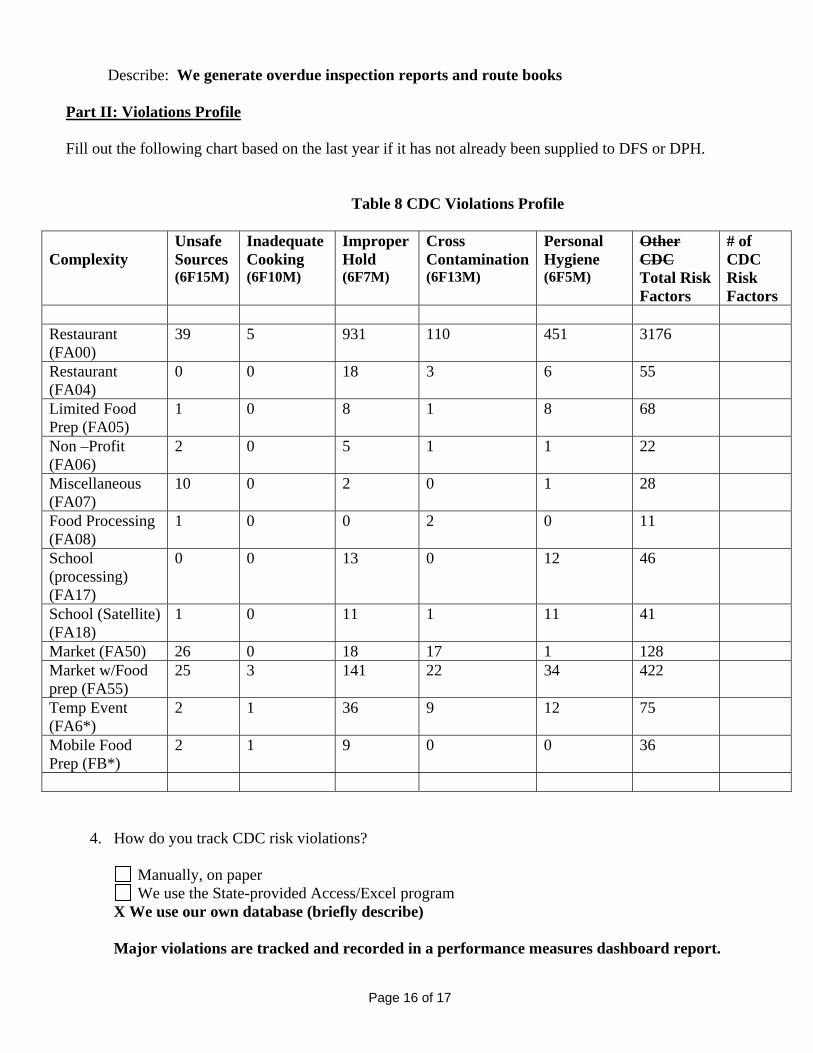
Page 16 of 17
Describe: We generate overdue inspection reports and route books Part II: Violations Profile Fill out the following chart based on the last year if it has not already been supplied to DFS or DPH.
Table 8 CDC Violations Profile
Complexity
Unsafe Sources (6F15M)
Inadequate Cooking (6F10M)
Improper Hold (6F7M)
Cross Contamination(6F13M)
Personal Hygiene (6F5M)
Other CDC Total Risk Factors
# of CDC Risk Factors
Restaurant (FA00)
39 5 931 110 451 3176
Restaurant (FA04)
0 0 18 3 6 55
Limited Food Prep (FA05)
1 0 8 1 8 68
Non –Profit (FA06)
2 0 5 1 1 22
Miscellaneous (FA07)
10 0 2 0 1 28
Food Processing (FA08)
1 0 0 2 0 11
School (processing) (FA17)
0 0 13 0 12 46
School (Satellite) (FA18)
1 0 11 1 11 41
Market (FA50) 26 0 18 17 1 128 Market w/Food prep (FA55)
25 3 141 22 34 422
Temp Event (FA6*)
2 1 36 9 12 75
Mobile Food Prep (FB*)
2 1 9 0 0 36
4. How do you track CDC risk violations?
Manually, on paper We use the State-provided Access/Excel program
X We use our own database (briefly describe) Major violations are tracked and recorded in a performance measures dashboard report.
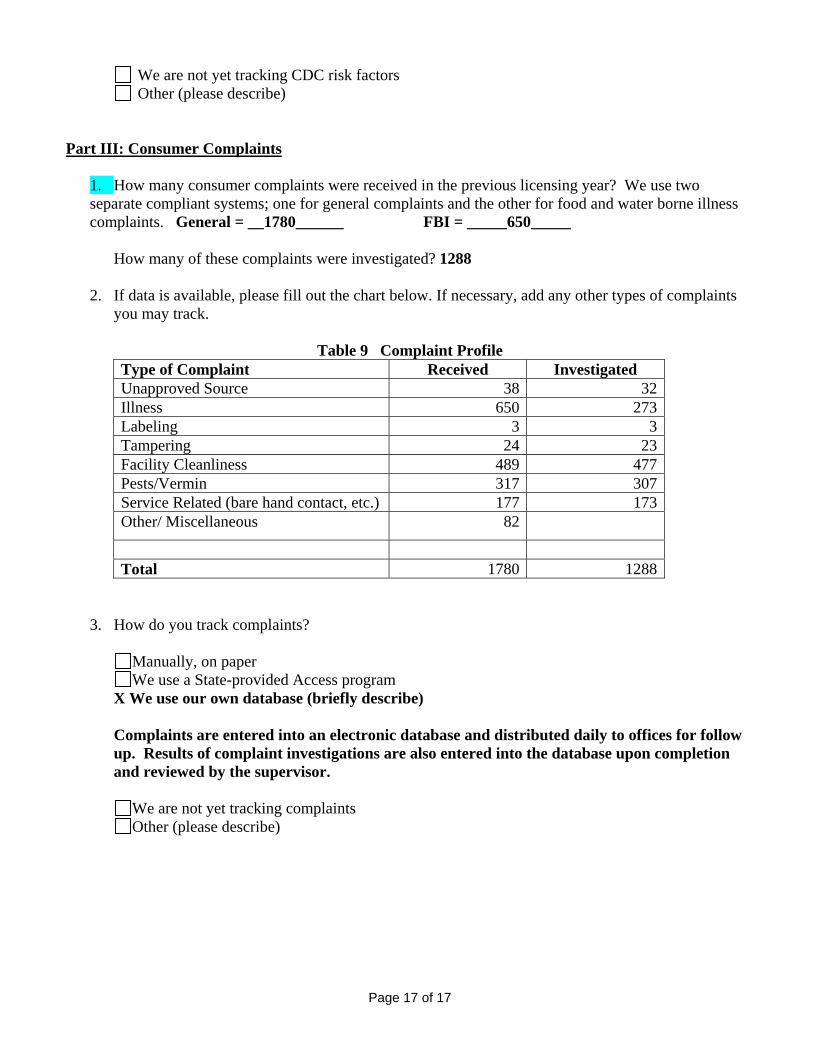
Page 17 of 17
We are not yet tracking CDC risk factors Other (please describe)
Part III: Consumer Complaints
1. How many consumer complaints were received in the previous licensing year? We use two separate compliant systems; one for general complaints and the other for food and water borne illness complaints. General = __1780______ FBI = _____650_____
How many of these complaints were investigated? 1288
2. If data is available, please fill out the chart below. If necessary, add any other types of complaints
you may track.
Table 9 Complaint Profile Type of Complaint Received Investigated Unapproved Source 38 32Illness 650 273Labeling 3 3Tampering 24 23Facility Cleanliness 489 477Pests/Vermin 317 307Service Related (bare hand contact, etc.) 177 173Other/ Miscellaneous 82 Total 1780 1288
3. How do you track complaints?
Manually, on paper We use a State-provided Access program
X We use our own database (briefly describe) Complaints are entered into an electronic database and distributed daily to offices for follow up. Results of complaint investigations are also entered into the database upon completion and reviewed by the supervisor.
We are not yet tracking complaints Other (please describe)
61
APPENDIX D
Dashboard Report -2005-2007 and
TEAM Excellence Risk-Based Food Safety System Executive Summary These documents, created by the San Diego County Department of Environmental Health, Food and Housing Division, summarize the system and materials that were provided to the review panel. A full list of materials used for this report can be found in the References section.

4/24/2008
Department of Environmental Health
Food & Housing Division
Analysis of Risk-Based Food Facility Inspections
2005-2007
Figure 1. Chart displays the number of food facilities who received three or more of the same major risk factor within the indicated year.
Figure 2. Chart displays the number of food facilities that were ordered to cease and desist operations within the indicated year.
Figure 3. Chart displays the distribution of grades assigned to facilities during a food facility inspection within the indicated year.
Figure 4. Chart displays the distribution of grades assigned to facilities who received two major risk factors during a food facility inspection within the indicated year.
Facilities with Three or More of the Same Major Risk Factor Within Calendar Year
48
2026
0
10
20
30
40
50
60
2005 2006 2007
Year
Num
ber o
f Fac
ilitie
s
Food Facility Closures by Year
110 109
278
0
50
100
150
200
250
300
2005 2006 2007
Year
Num
ber o
f Foo
d Fa
cilit
y C
losu
res
28287
38326
27143
38227
22646450
45
22000
23000
24000
25000
26000
27000
28000
29000
Num
ber o
f Ins
pect
ions
2005 2006 2007
Year
Total Inspections Conducted by Grade
C
B
A
Resulting Grades from Inspectionswith Two Major Risk Factors
255
206
110 105
153
7 8 13
235
0
50
100
150
200
250
300
2005 2006 2007
Year
Num
ber o
f Ins
pect
ions
A
B
C

- 1 -
TEAM EXCELLENCE PERFORMANCE MEASUREMENT SYSTEM “Together Everyone Accomplishes More”
County of San Diego Department of Environmental Health
Food Safety Program San Diego, California
December 2007
The San Diego County Department of Environmental Health (DEH) Food and Housing Division
(FHD) is pleased to submit this food safety program summary that demonstrates leadership, achievement,
and commitment to public health and food safety for review by the NEHA advisory committee. Together
with our stakeholders, we have implemented risk-based intervention strategies that have resulted in
decreasing trends in major risk factor violations1 in retail food facilities, improved food employee
behaviors and food preparation practices2, and enhanced foodborne illness surveillance methods that have
identified other food safety risks in the community.
Our program’s goal is to reduce foodborne illness by promoting an inspection methodology that
focuses food facility inspection and education efforts on the risk factors identified by the Centers for
Disease Control and Prevention (CDC) as the most prevalent contributing factors to foodborne illness or
injury. The concepts of our risk-based food safety program are embedded in our model TEAM
Excellence Performance Measurement System. These concepts utilize a framework of assessing risk,
communicating risk, managing risk, and verifying quality of service as key tools in establishing effective
intervention strategies aimed at reducing food safety risks. It is from these concepts that we developed
and implemented our most successful intervention strategy: a well-trained retail food industry and FHD
inspection staff equipped with an innovative intervention and risk-based inspection process that directly
impacts, and has reduced, trends in the occurrence of major risk factor violations in retail food facilities. 1 The risk factors include: food from unsafe sources, improper holding temperatures, inadequate cooking, contaminated equipment, and poor personal hygiene. 2 Healthy People 2010 objective.
EXECUTIVE SUMMARY
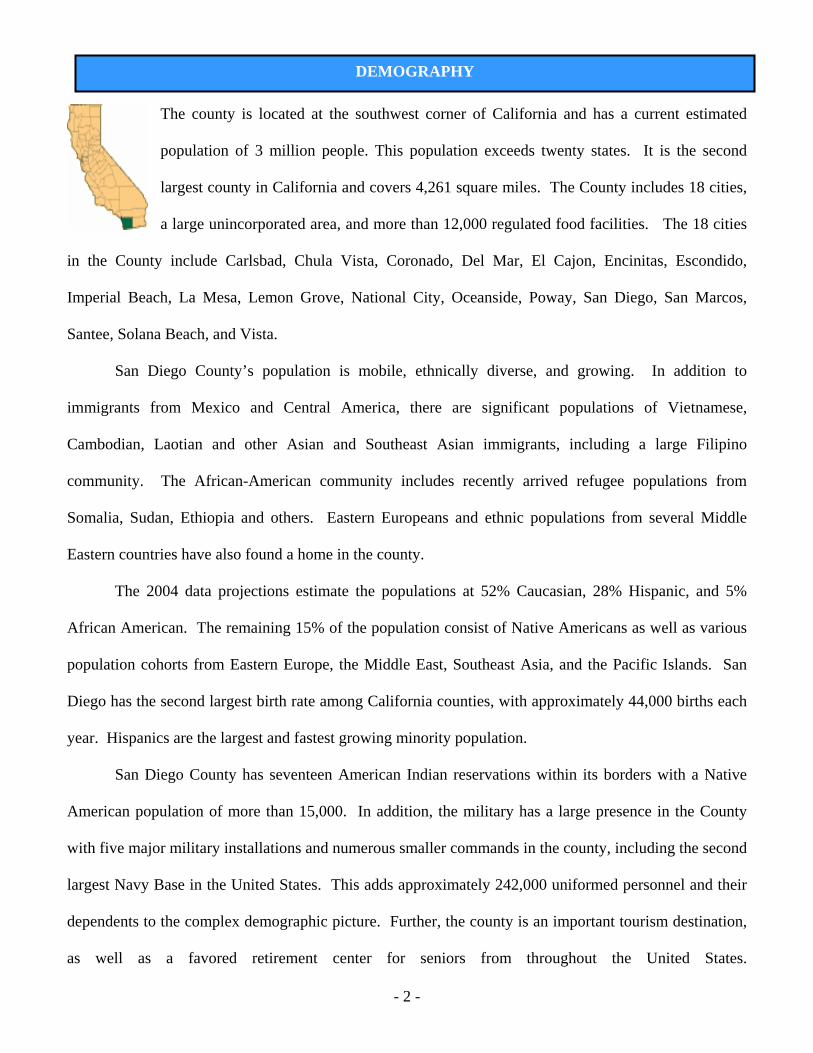
- 2 -
The county is located at the southwest corner of California and has a current estimated
population of 3 million people. This population exceeds twenty states. It is the second
largest county in California and covers 4,261 square miles. The County includes 18 cities,
a large unincorporated area, and more than 12,000 regulated food facilities. The 18 cities
in the County include Carlsbad, Chula Vista, Coronado, Del Mar, El Cajon, Encinitas, Escondido,
Imperial Beach, La Mesa, Lemon Grove, National City, Oceanside, Poway, San Diego, San Marcos,
Santee, Solana Beach, and Vista.
San Diego County’s population is mobile, ethnically diverse, and growing. In addition to
immigrants from Mexico and Central America, there are significant populations of Vietnamese,
Cambodian, Laotian and other Asian and Southeast Asian immigrants, including a large Filipino
community. The African-American community includes recently arrived refugee populations from
Somalia, Sudan, Ethiopia and others. Eastern Europeans and ethnic populations from several Middle
Eastern countries have also found a home in the county.
The 2004 data projections estimate the populations at 52% Caucasian, 28% Hispanic, and 5%
African American. The remaining 15% of the population consist of Native Americans as well as various
population cohorts from Eastern Europe, the Middle East, Southeast Asia, and the Pacific Islands. San
Diego has the second largest birth rate among California counties, with approximately 44,000 births each
year. Hispanics are the largest and fastest growing minority population.
San Diego County has seventeen American Indian reservations within its borders with a Native
American population of more than 15,000. In addition, the military has a large presence in the County
with five major military installations and numerous smaller commands in the county, including the second
largest Navy Base in the United States. This adds approximately 242,000 uniformed personnel and their
dependents to the complex demographic picture. Further, the county is an important tourism destination,
as well as a favored retirement center for seniors from throughout the United States.
DEMOGRAPHY
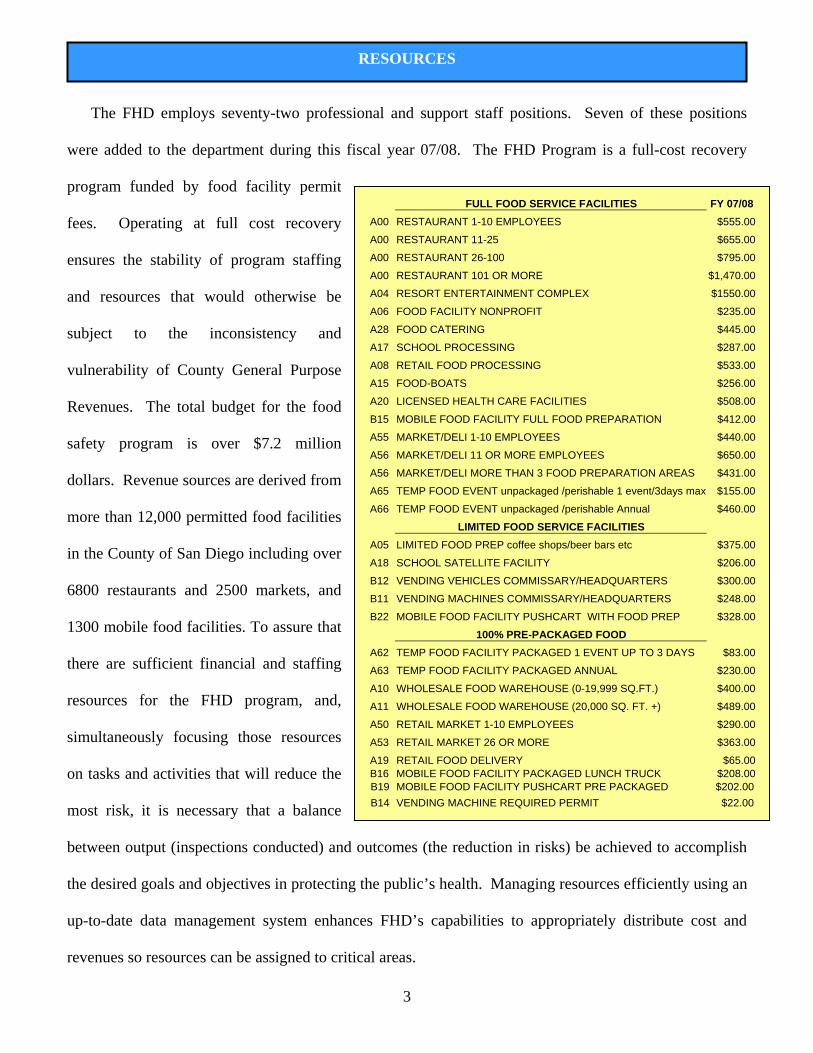
3
FULL FOOD SERVICE FACILITIES FY 07/08A00 RESTAURANT 1-10 EMPLOYEES $555.00
A00 RESTAURANT 11-25 $655.00
A00 RESTAURANT 26-100 $795.00
A00 RESTAURANT 101 OR MORE $1,470.00
A04 RESORT ENTERTAINMENT COMPLEX $1550.00
A06 FOOD FACILITY NONPROFIT $235.00
A28 FOOD CATERING $445.00
A17 SCHOOL PROCESSING $287.00
A08 RETAIL FOOD PROCESSING $533.00
A15 FOOD-BOATS $256.00
A20 LICENSED HEALTH CARE FACILITIES $508.00
B15 MOBILE FOOD FACILITY FULL FOOD PREPARATION $412.00
A55 MARKET/DELI 1-10 EMPLOYEES $440.00
A56 MARKET/DELI 11 OR MORE EMPLOYEES $650.00
A56 MARKET/DELI MORE THAN 3 FOOD PREPARATION AREAS $431.00
A65 TEMP FOOD EVENT unpackaged /perishable 1 event/3days max $155.00
A66 TEMP FOOD EVENT unpackaged /perishable Annual $460.00
LIMITED FOOD SERVICE FACILITIES
A05 LIMITED FOOD PREP coffee shops/beer bars etc $375.00
A18 SCHOOL SATELLITE FACILITY $206.00
B12 VENDING VEHICLES COMMISSARY/HEADQUARTERS $300.00
B11 VENDING MACHINES COMMISSARY/HEADQUARTERS $248.00
B22 MOBILE FOOD FACILITY PUSHCART WITH FOOD PREP $328.00
100% PRE-PACKAGED FOOD A62 TEMP FOOD FACILITY PACKAGED 1 EVENT UP TO 3 DAYS $83.00
A63 TEMP FOOD FACILITY PACKAGED ANNUAL $230.00
A10 WHOLESALE FOOD WAREHOUSE (0-19,999 SQ.FT.) $400.00
A11 WHOLESALE FOOD WAREHOUSE (20,000 SQ. FT. +) $489.00
A50 RETAIL MARKET 1-10 EMPLOYEES $290.00
A53 RETAIL MARKET 26 OR MORE $363.00
A19 RETAIL FOOD DELIVERY $65.00B16 MOBILE FOOD FACILITY PACKAGED LUNCH TRUCK $208.00 B19 MOBILE FOOD FACILITY PUSHCART PRE PACKAGED $202.00 B14 VENDING MACHINE REQUIRED PERMIT $22.00
The FHD employs seventy-two professional and support staff positions. Seven of these positions
were added to the department during this fiscal year 07/08. The FHD Program is a full-cost recovery
program funded by food facility permit
fees. Operating at full cost recovery
ensures the stability of program staffing
and resources that would otherwise be
subject to the inconsistency and
vulnerability of County General Purpose
Revenues. The total budget for the food
safety program is over $7.2 million
dollars. Revenue sources are derived from
more than 12,000 permitted food facilities
in the County of San Diego including over
6800 restaurants and 2500 markets, and
1300 mobile food facilities. To assure that
there are sufficient financial and staffing
resources for the FHD program, and,
simultaneously focusing those resources
on tasks and activities that will reduce the
most risk, it is necessary that a balance
between output (inspections conducted) and outcomes (the reduction in risks) be achieved to accomplish
the desired goals and objectives in protecting the public’s health. Managing resources efficiently using an
up-to-date data management system enhances FHD’s capabilities to appropriately distribute cost and
revenues so resources can be assigned to critical areas.
RESOURCES
4
Basing inspection frequencies on relative degree of risk, FHD developed and implemented multi-year
fee packages in 2002 and 2007 with support from the regulated industry. FHD staff meets annually with
industry stakeholder groups such as the California Grocers Association, the San Diego Food and
Beverage Association, the Neighborhood Market Association (formerly the California Independent
Grocers and Convenience Stores), and the San Diego Chapter of the California Restaurant Association to
ensure goals and objectives are on track and costs are at full recovery. This process provides a forum for
input as well as a buy-in by stakeholders in terms of value associated with long-range goals and
objectives.
PROGRAM PLANNING
Vision, Goals and Objectives: Our vision is “Environmental and public health through leadership,
partnership and science”. Reducing foodborne illness in San Diego County is a primary goal of the FHD
and is embedded in one of the County’s Strategic Initiatives: “Ensuring Safe and Livable Communities”.
In order to reach this goal, our food safety program is focused on achieving positive public health
outcomes, measuring performance, and maintaining and improving quality of service. Working together
with our stakeholders from the retail food industry, academia, and other public health professionals in
2001 and 2002, we developed a long-range TEAM Excellence Performance Measurement System plan.
The plan includes strategies for assessing risk, communicating risk, managing risk, and verifying the
quality of service. The following FHD goals and objectives were established in our long-range plan:
• Reduce the number of foodborne illnesses caused by key pathogens in San Diego County food
facilities.
• Reduce major food safety risk factor violations in retail food facilities.
• Improve food employee behaviors and food preparation practices.
• Decrease plan review cycle time for new plans to ten working days or less.
BASELINE AND PROGRAM ASSESSMENT
5
Risk Orientation: To assure that our goals and objectives are valid, and as effective as possible, we
continue to look globally along with looking on the national, state, and local levels. Globally, San Diego
County borders Mexico, which has resulted in binational food safety issues that have impacted local
public health. Outreach efforts by FHD with government officials from Mexico and state and federal
agencies have improved communication, response, and enforcement. On a national level, we are working
toward implementing all of the Food and Drug Administration (FDA) National Retail Food Program
Standards and have adopted the Healthy People 2010 objectives of improving food employee behaviors
and food preparation practices, and reducing foodborne illness caused by key pathogens. On the State
level, the FHD program Chief and DEH Director had leading roles in rewriting California’s food law by
applying the FDA’s Model Food Code and in developing statewide model procedures. On the local level,
risk assessments are conducted to assess food employee knowledge of risk factors and to identify trends
in the occurrence of risk factor violations observed during inspections and foodborne illness
investigations. With this data, we are able to better direct the implementation of our long-range plan based
on relative degree of risk.
Self-Evaluation: An assessment of the food safety program began in 2001. It initially revealed the need
to update and revise the focus of the food facility inspection process and the inspection report used by
staff. There was, in fact, a need to replace the “sanitation” based inspection process with a “risk factor
and intervention” based program. Our goals and objectives require that assessment of the food safety
program be ongoing in order to identify risks and trends in the community. In 2003, an assessment of
two years of previous risk factor violations revealed that trends in risk factor violations were consistent
from year to year. An assessment of food employee knowledge of risk factors conducted in April 2003,
revealed a need to increase knowledge in hot holding and cooking temperatures. It also concluded that
what people know and what people do are often two different things. Information from our assessments
assists us in creating and implementing interventions that have positive public health outcomes.
6
Staff Positions, Qualifications, and Participation: The elements of our TEAM Excellence Performance
Measurement System plan have been created using active working groups of staff at all levels. Using this
approach has contributed to the success of our program enhancements because staff has taken ownership
of our program. Our motto is “Together Everyone Accomplishes More” (TEAM).
There are sixty-one Registered Environmental Health Specialists (REHSs) and eleven support
staff within the FHD. REHSs must earn a science-based degree and pass a comprehensive state
examination in order to conduct food safety inspections. To promote our profession, FHD offers
internship opportunities for students. A career ladder has also been established within the department to
encourage support staff to continue their education to become a REHS. A 5% pay differential was
implemented in 2002 for those who have earned the REHS within the department. Additionally, two new
classifications were added, Environmental Health Specialist Trainee and Environmental Health
Technician. Trainees and support staff are encouraged to become a REHS with tuition reimbursement as
an incentive. Since 2001, sixteen members of FHD staff have utilized the Department’s career ladder to
become Environmental Health Technicians or Environmental Health Trainees. Of these, five have
become state Registered Environmental Health Specialists.
Leadership training has also been provided to the FHD Chief and Supervisors through attendance
at comprehensive six-day leadership-training academies. In addition, San Diego County is one of the most
awarded Counties by the California Environmental Health Association (CEHA) since 2000 including
three FHD staff as “REHS of the Year”, two for the “Distinguished Service Award”, two members of
industry for the “Mark C. Nottingham Award”, two for the “Stuart E. Richardson, Sr. Award” for
training, one for “Legislator of the Year”, and one for the coveted “Vince Dunham Memorial Award” for
exceptional career performance. DEH staff is often sought after for conducting both training and
professional presentations. Further, since implementing our program changes, FHD staff conducted
training workshops and professional presentations at the CEHA Annual Educational Symposium, the
National Environmental Health Association (NEHA) Annual Educational Conference and Epi-ready
7
training workshops, the Food and Drug Administration’s Pacific Region Seminar, the National
Association of City and County Health Officials (model practice designation award recipient and poster
presentation), and the American Public Health Association (poster presentation).
PROGRAM MANAGEMENT
Active Managerial Control: Active Managerial Control or AMC is a concept that the FHD has been
using for over 25 years with the implementation of the mandatory food handler training program. The
food handler training program requires all food employees that handle unpackaged foods be trained and
pass a standardized test in order to handle food in a retail food facility. On a statewide level, one
employee with a food safety certification is required in each food facility.
The concept has been expanded by FHD since 2001 by developing simple tools for food facilities
to use in order to assist them in monitoring and controlling their own food safety practices when the
inspector is not in the facility. The simple tools include such things as:
a model temperature control log with instructions and procedures for
thermometer calibration on the back; a self-inspection report;
procedures for excluding or restricting ill food employees; procedures
for using wiping cloths; and guidelines for determining approved food
sources. All these tools have been provided to our food facilities in
order to assist them in controlling the occurrence of risk factor
violations within their food facilities. In addition, FHD has developed a
comprehensive Operators Guide that includes information on safe food practices, a unique “Risk Control
Plan Workbook” to help operators develop their own food safety procedures, and disaster response
guidelines including how to manage fires as well as interruptions in utility services.
Epidemiological Capability: The FHD foodborne and waterborne illness complaint process is a five
step procedure. This includes active and passive surveillance; environmental assessments;
communication; evaluation and management of the data; and quality assurance/training.
8
SURVEILLANCE: The FHD Epidemiology (FHD-EPI) section evaluates all foodborne and waterborne
illness reports (suspected and confirmed), especially those linked to a retail food facility through active
and passive methods. Centralized collection of the reports/complaints allows for a singular evaluation and
control center. Through a Memorandum of Understanding with the county health department, known as
the Health and Human Services Agency (HHSA), reports of foodborne illness are copied to FHD-EPI for
action. FHD-EPI will be the lead interviewer when there are less than five ill people with suspect
foodborne illness. There is also a trained foodborne illness emergency response team to respond if
needed. The benefits of establishing this team was quickly realized when they were deployed to respond
to a regional boil water order emergency in northeast portion of the City of San Diego in 2006, which
affected over 270 food facilities.
A successful element of the epidemiological program was the
implementation of a self-reporting process. This was a voluntary process in
which industry notified FHD of foodborne illness complaints to facilitate
investigation and resolution of the matter. The industry was provided a prompt
and fair investigation, they agreed to implement any necessary corrective actions, and the public’s health
was protected. Credibility and trust were essential for this type of program to succeed. The industry
knows the goal is to prevent further foodborne illness. Because of the success of the self-reporting
process, San Diego County took a leading role in efforts by the California Retail Food Safety Coalition
(CRFSC) to make the self-reporting process an integral part of state law beginning July 1, 2007. Local
community involvement and outreach activities also supplement the active component in the surveillance
program, since under reporting is a common problem.
ENVIRONMENTAL ASSESSMENTS: Field investigations are conducted by an REHS. A designated
senior staff member serves as the lead investigator in large outbreak investigations. The objective of the
investigation is to identify potential problems and risk factors in the preparation or handling of the suspect
food, document code violations, and provide education on corrective actions. This also helps the public
9
and industry by determining the most likely source of illness, which may or may not be, the last place
they ate. A hazard analysis is completed in an effort to recreate the conditions at the time the implicated
food was prepared. An evaluation of current operations and contributing factors observed at the facility
provides a snapshot of ongoing conditions. The REHS will also work with Public Health Nurses and
Epidemiologists to evaluate the work practices of any potentially ill food handlers and issue food handler
removal notices as required.
COMMUNICATION: Advance team building efforts with epidemiologists, laboratory microbiologists,
public health nurses, industry, law enforcement and other health care providers facilitate a positive
working relationship during the critical times. In addition to outbreak specific meetings, weekly staff
meetings allow the FHD and the HHSA to collaborate on streamlined investigations and data tracking for
outbreaks. This reduces duplication and speeds up investigation results. Outbreaks that are cross
jurisdictional, or have involved a processed food product, have been coordinated with state and federal
agencies to ensure timely and effective response in removing an adulterated food product from
distribution and sale. Industry also receives notification through e-mail distribution lists or they can sign
up for on our newly implemented web-based “Constant Contact” system that sends alerts to subscribers.
FHD staff also sign up/participate in federal and state notification systems to receive information
regarding food product recalls. When a class I recall identifies a food product that has been distributed in
San Diego County, FHD staff follows up with stakeholders and conducts effectiveness checks and issues
press releases when necessary.
DATA MANAGEMENT: Successful identification of foodborne illness outbreaks is a product of timely
reporting, surveillance, and staff investigative expertise. Data and trend analyses are conducted each year
with a focus on Salmonella and Campylobacter since they are leading indicators of foodborne illness
nationwide. The number of food facilities reviewed due to Salmonella and Campylobacter related
illnesses (meaning the person ate out during the exposure period, not that the food facility was responsible
for the illness) has decreased since 2003. Total reported Campylobacter cases countywide have decreased

10
since 2003. Total reported Salmonella cases countywide have increased since 2003. Food from
unlicensed food sources has been a significant factor in the increase. The trends in total reported
Salmonella and Campylobacter cases reported countywide also follow statewide trends suggesting that
retail food facilities in San Diego County are not likely significant contributors to total reported
Salmonella and Campylobacter related illness.
QUALITY ASSURANCE/TRAINING: The cooperative working partnership that the FHD staff has
developed with HHSA, state and federal agencies, the medical community, the regulated industry, and the
public have contributed to decreasing trends in risk factor violations and heightened awareness by the
public of food safety. Working together, these components resulted in rapid reporting and response to a
multi-jurisdictional outbreak of E. coli 0157:H7 caused by pre-washed lettuce in October 2003. Within
48 hours, an adulterated food product was identified and removed from sale and distribution in multiple
counties, saving lives and minimizing the impact to the public’s health and safety.
Data Management and Utilization: Our department has made significant investments in technology.
These include new computer software applications and hardware, internet accessibility and use, and
communication equipment that are essential to providing program services, assessing program activities,
supporting staff, and measuring improvements. Our website is
utilized to provide further public outreach and to increase
community and industry awareness about current environmental
health issues including the new
California Retail Food Code and
the performance measures dashboard report. Inspection results for food
facility inspections will also soon be available to the public online.
Computer database systems like our land-based KIVA system provide
the food facility inspection program an integrated permitting and inspection data collection tool. The
KIVA system is shared not only among other divisions within our own department, but also with other
11
county departments, maximizing the system's utility and efficiency. KIVA produces a multitude of
reports that assist in monitoring inspection frequencies, risk factor violations, and statistical trends.
Additional reports are being developed to assist in implementing an ongoing data quality management
process.
FHD has also implemented a new method for data input into the KIVA system by utilizing scanners to
capture data from specially designed paper-based inspection reports. This innovation relieves FHD staff
from manual data entry of inspection data. The scanning system also allows more data to be collected
from the inspection reports than the previous paper-based system, which provides more comprehensive
information and identification of trends. In addition, “Documentum”, a document management system,
retains an electronic copy of each scanned inspection report and will eventually allow FHD to discontinue
the hard-copy storage of inspection reports. It also allows FHD staff electronic access to all inspection
reports from any county office. The next phase in development will include evaluation of mobile
computing options for field inspections. Digital cameras, cellular telephones, and BlackBerry devices that
are provided to each staff member further enhance FHD staff’s ability to communicate from the field
during inspections and emergencies.
Analysis of outcomes: Trends in the occurrence of major risk factor violations found during inspections
and environmental investigations related to foodborne illness outbreaks can identify training needs or
other intervention strategies to reduce risks. A quarterly report that displays performance measures
related to major risk factor violations found in retail food facilities (outcome measure), number of high
risk food facility inspections (output measure), plan review cycle times (customer service measure), and
non-emergency customer complaint investigation response times (complaints that are an imminent health
hazard are investigated the same day) has been developed and shared with stakeholders. The quarterly
report is also posted under the Department’s performance measure tab on our website. A sample of the
dashboard report for fiscal year 06/07 follows:
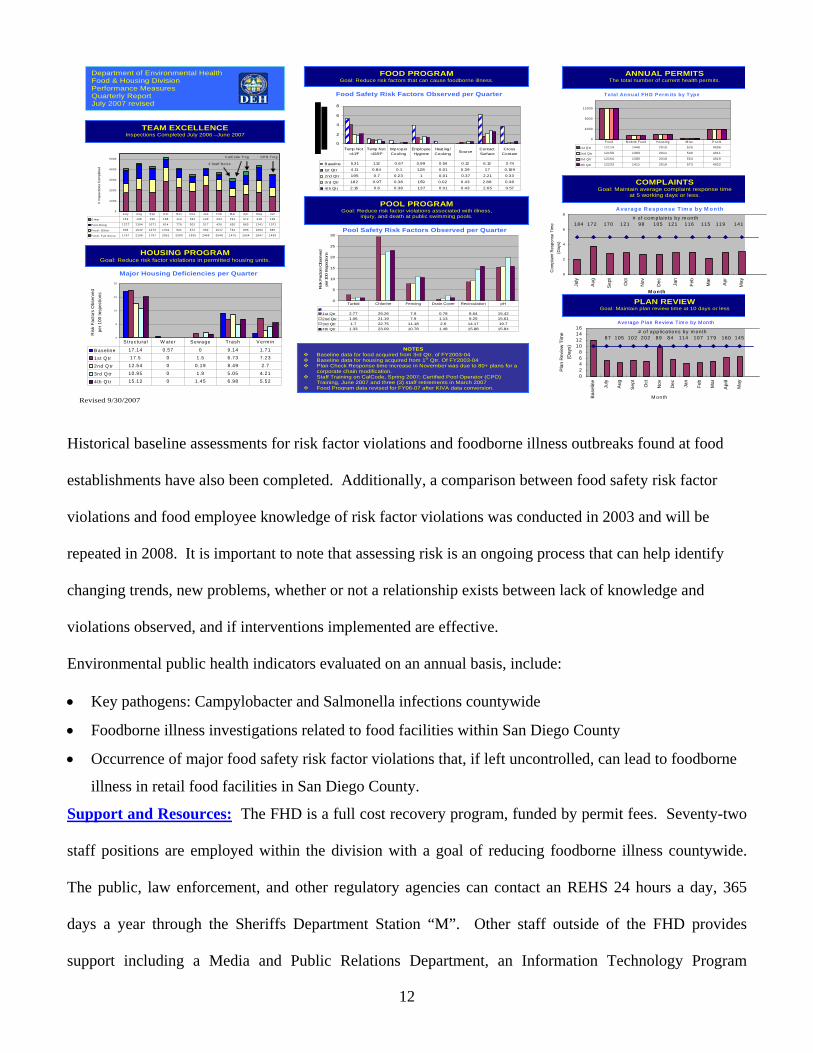
12
Revised 9/30/2007
Average P lan R eview T im e by M onth
02468
10121416
Bas
elin
e
July
Aug
Sep
t
Oct
Nov
Dec Jan
Feb
Mar
Apr
il
May
M onth
Pla
n R
evie
w T
ime
(Day
s)
# o f app lica tions by m onth87 105 102 202 89 84 114 107 179 160 145
0
5
10
15
20
25
30
Ris
k Fa
ctor
s O
bser
ved
per 1
00 In
spec
tions
1st Qtr 2.77 29.26 7.9 0.78 8.64 15.422nd Qtr 1.06 21.19 7.9 1.13 9.25 15.613rd Qtr 1.7 22.75 11.18 2.6 14.17 19.74th Qtr 1.33 23.09 10.78 1.48 15.88 15.84
Turbid Chlorine Fencing Drain Cover Recirculation pH
POOL PROGRAM Goal: Reduce risk factor violations associated with illness,
injury, and death at public swimming pools.
Department of Environmental Health Food & Housing Division Performance Measures Quarterly Report July 2007 revised
HOUSING PROGRAM Goal: Reduce risk factor violations in permitted housing units.
PLAN REVIEW Goal: Maintain plan review time at 10 days or less
Tota l Annu al FH D P erm its by Type
0
4000
8000
12000
1st Q tr 12114 1445 2015 526 4006
2nd Q tr 12159 1383 2011 540 4011
3rd Q tr 12164 1385 2018 554 4019
4th Q tr 12233 1411 2019 573 4022
Food M ob ile Food H ousing M isc. P oo ls
FOOD PROGRAM Goal: Reduce risk factors that can cause foodborne illness.
COMPLAINTS Goal: Maintain average complaint response time
at 5 working days or less.
ANNUAL PERMITSThe total number of current health permits.
Average R esponse T im e b y M o nth
0
2
4
6
8
July
Aug
Sep
t
Oct
Nov
Dec Jan
Feb
Mar
Apr
May
M onth
Com
plai
nt R
espo
nse
Tim
e (D
ays)
# of com pla ints by m onth184 172 170 121 98 105 121 116 115 119 141
0
5
10
15
20
Ris
k Fa
ctor
s O
bser
ved
per 1
00 In
spec
tions
B aseline 17.14 0 .57 0 9.14 1.71
1st Q tr 17 .5 0 1 .5 6 .73 7 .23
2nd Q tr 12 .54 0 0.19 8.49 2 .7
3rd Q tr 10 .95 0 1.9 5 .05 4 .21
4 th Q tr 15 .12 0 1.45 6.98 5 .52
Struc tu ra l W ater Sew age Trash V erm in
Pool Safety Risk Factors Observed per Quarter
Food Safety Risk Factors Observed per Quarter
Major Housing Deficiencies per Quarter
0
1000
2000
3000
4000
5000
# In
spec
tions
Com
plet
ed
O ther 152 138 190 1 86 11 3 184 129 234 291 37 2 218 138
P ool-H sn g 122 7 1304 1071 8 14 77 6 503 517 426 630 86 5 124 1 1071
F ood- O ther 938 1042 1270 1 331 92 1 872 992 1017 762 89 6 108 2 880
F ood- Fu ll S erve 176 7 2108 1797 2 851 23 00 193 5 2469 2048 1 475 16 54 184 7 1439
July Aug S ep O ct N ov D ec Jan Feb M ar A pr M ay Jun
C a lC ode Trng C PO Trng
3 S ta ff R etire
NOTES Baseline data for food acquired from 3rd Qtr. of FY2003-04 Baseline data for housing acquired from 1st Qtr. Of FY2003-04 Plan Check Response time increase in November was due to 80+ plans for a
corporate chain modification. Staff Training on CalCode, Spring 2007; Certified Pool Operator (CPO)
Training, June 2007 and three (3) staff retirements in March 2007 Food Program data revised for FY06-07 after KIVA data conversion.
TEAM EXCELLENCE Inspections Completed July 2006 –June 2007
0
2
4
6
8
Baseline 5.31 1.12 0.67 3.99 0.54 0.12 6.12 3.74
1st Qtr 4.11 0.84 0.1 1.28 0.01 0.39 1.7 0.169
2nd Qtr 1.95 0.7 0.23 1 0.01 0.37 2.21 0.33
3rd Qtr 1.82 0.97 0.38 1.59 0.02 0.43 2.88 0.38
4th Qtr 2.16 0.6 0.38 1.37 0.01 0.43 2.65 0.57
Temp Not <41°F
Temp Not >135°F
Improper Cooling
Employee Hygiene
Heating/ Cooking Source
Contact Surface
Cross Contam
Historical baseline assessments for risk factor violations and foodborne illness outbreaks found at food
establishments have also been completed. Additionally, a comparison between food safety risk factor
violations and food employee knowledge of risk factor violations was conducted in 2003 and will be
repeated in 2008. It is important to note that assessing risk is an ongoing process that can help identify
changing trends, new problems, whether or not a relationship exists between lack of knowledge and
violations observed, and if interventions implemented are effective.
Environmental public health indicators evaluated on an annual basis, include:
• Key pathogens: Campylobacter and Salmonella infections countywide
• Foodborne illness investigations related to food facilities within San Diego County
• Occurrence of major food safety risk factor violations that, if left uncontrolled, can lead to foodborne
illness in retail food facilities in San Diego County.
Support and Resources: The FHD is a full cost recovery program, funded by permit fees. Seventy-two
staff positions are employed within the division with a goal of reducing foodborne illness countywide.
The public, law enforcement, and other regulatory agencies can contact an REHS 24 hours a day, 365
days a year through the Sheriffs Department Station “M”. Other staff outside of the FHD provides
support including a Media and Public Relations Department, an Information Technology Program
13
Manager, a Geographic Information System (GIS) specialist, Epidemiologists, Public Health Nurses, a
Public Health Laboratory, and a Deputy County Counsel (designated in 2002). Each staff member has
access to desktop computers, e-mail, and the Internet. Thermometers, thermocouples, holding
thermometers, infrared thermometers, safety boots, and disaster preparedness kits, food sampling kits,
chemical test kits, pH meters, vehicles, digital cameras, black lights, flash lights, Nextel radio cellular
phones, and pagers are all standard equipment for field inspectors. Audiovisual equipment includes
laptop computers, LCD projection units for presentations, screens, VCR, television, training videos, and
video teleconferencing equipment. The HHSA Public Health lab is available for microbiological and
chemical analysis. Computerized systems are used for permit billing/tracking, recording inspection
results, complaints, foodborne illness interview information, and timekeeping. The county web site
(www.sdcdeh.org) has extensive food safety information and guidelines available for the public and for
the regulated industry with more than 9,000 documents downloaded each month.
EXTERNAL INVOLVEMENT
Industry & Consumer Interaction: A key feature of the FHD
program is the focus on interaction with industry and consumers to
increase food safety participation, knowledge and education. A sound knowledge base is the first step in
ensuring environmental public health and safety. Maintaining excellence in customer service is an
important component to an effective program. Outreach to the retail food industry continues to be
essential to the success of the program. Educational outreach materials were, and continue to be,
developed and distributed to food facility operators. In addition, training workshops, attended by several
thousand people were conducted for the retail food industry throughout the County regarding food safety
risk factors and interventions, a new inspection process in 2004, and the new California Retail Food Code
in 2007. Additionally, the San Diego Food Safety Advisory Council (FSAC) played a major role in:
drafting, piloting, and surveying the new risk-based inspection process; and in developing a wholesale
food warehouse ordinance, training, and inspection program. The FSAC continues to be important in

14
ensuring success of the FHD by providing a forum for communication and input for various program
areas. The FSAC is comprised of representatives from the retail food industry including the San Diego
Chapter of the California Restaurant Association, the San Diego Food and Beverage Association, the
California Grocers Association, the Neighborhood Market Association, the San Diego State University
Graduate School of Public Health, the San Diego County Food Handler Training Schools, the San Diego
County Department of Environmental Health, the San Diego County Farm and Home Advisor, and the
San Diego County Community Epidemiology Division. An annual countywide customer service survey is
also conducted to evaluate customer service levels. Another unique service provided is a public
information duty specialist and an epidemiology liaison that are available each workday to answer
questions by the public and by the regulated industry.
Community Educational Outreach: FHD is committed and extensively involved in many different
facets of the community to ensure they are informed about food safety practices. Through intense public
outreach using brochures, mass mailings, media events, health fairs, etc., FHD has filled a great demand
for expertise concerning food safety and safe food handling practices. FHD’s approach is teaching
principles of prevention of foodborne illness and giving the public skills to make informed decisions. The
hallmark of this philosophy is the long-standing program in San Diego County of restaurant grading.
Some of the other highlights of our outreach activities include:
GUEST SPEAKERS AT EDUCATIONAL INSTITUTIONS: The FHD provides REHSs as guest speakers at high
schools and universities to promote the field of environmental public health. Ride-a-long inspections are
offered to Nursing and Nutrition students from San Diego State University, doctors from the Camp
Pendleton Marine Base, and Preventive Medicine Intern students who have an interest in the
environmental health field or need to meet an educational requirement within their major field of study.
FHD also conducts food safety presentations for school nutrition directors, communicates important food
safety information through an e-mail distribution list, and has developed model HACCP guidelines with
the National School District.
15
COMMUNITY FOOD SAFETY PRESENTATIONS: Food safety presentations are made at
organized community events to promote and educate the public on safe food handling and
to prevent foodborne illness. “Fight Bac,” is an ongoing national food safety campaign
that FHD continues to promote. Each year, FHD partners with the San Diego County Food Safety
Advisory Council to host a summer July 4th food safety barbeque media event to educate the public on the
precautions that may prevent foodborne illness. September, as National Food Safety Education Month, is
another annual event that we use to focus in on kids throughout our county. Other major events have been
the Miramar Air Show and the San Diego County Fair.
MEDIA: Press releases regarding food recalls, food safety during the holidays, and otherwise providing
precautions or warnings to the public, are the norm. Recent events that prompted press releases include
recalls involving canned chili product due to botulism concern, E.coli 0157:H7 concerns in raw beef, the
consumption of raw oysters and Vibrio parahaemolyticus, and the consumption of illegal raw milk queso
fresco (fresh cheese) purchased from street vendors. Other major events in the county since 2001 that
resulted in press releases include: a multi-jurisdictional E. coli
0157:H7 outbreak related to pre-washed lettuce; a Shigella outbreak
associated with a popular restaurant in 2006; and devastating
Firestorms in 2003 and 2007 that ravaged the county, destroying
thousands of structures and resulting in loss of life.
Manager/Food Employee Training Partnerships: The FHD has long been aware of the importance of
food handler training and certification. The San Diego County Code of Regulatory Ordinances was
changed in 1980 to require that every person who handles food in a retail food facility be educated and
pass an examination demonstrating knowledge of microorganisms, foodborne diseases and transmission,
food protection, temperature control, washing and sanitization of food contact surfaces, and health and
hygiene of food handlers. Over 1200 new food handlers are trained and pass a food handler renewal
examination every month.

16
THE FOOD HANDLER TRAINING PROGRAM SURVIVES NEW STATE LEGISLATION: In
January 2000, the State of California made it mandatory to have one
person in each food facility trained to pass a comprehensive food safety
certification examination. A special exemption was granted to San
Diego County recognizing the success and experience of the FHD food
handler training program. This exemption allowed the existing mandatory food handler training program
to continue within the county. Later in July 2007, the state’s food law was replaced by the new California
Retail Food Code. This change in law prompted all food handler training instructors to go through a re-
certification process that includes 16 hours of training and passing an examination. New food handler
training materials were also developed and distributed to all food handler training instructors and food
facilities that train food employees “in house”.
PROGRAM IMPLEMENTATION
Grade Card System: San Diego County is unique because it is one of only a few counties in California
that has a public awareness food facility grading system. San Diego County was the first
county in California to implement the restaurant grading system in 1947. The inspection
system has evolved over the years and is based on food safety risk.
Establishments with open food preparation receive a grade card,
while those that carry and sell only pre-packaged food items are not
graded. Points deducted on an inspection report are weighted toward
risk factor violations and public health interventions. Upon completion of the inspection, a numerical
score is given and the corresponding letter grade card (A, B, or C) is prominently displayed near the
public entrance at all times.
An “A” grade means the facility scored between 90 and 100 points and is in substantial compliance with
the state law. More than 90% of food facilities each year score a grade “A”. A facility that earns a “B”
grade means the facility scored between 80 and 89 points. The “B” grade alerts the public that the facility

17
needs significant improvement in operations and/or structure. A “C” grade means the facility earned a
score of 79 points or less and is a failing grade. Failure by a food facility to improve their score within 30
days will result in suspension of the health permit. Less than 1% of all food facilities within the county
each year score a “C” grade. It should be noted that major risk factor violations require immediate
corrective action, suitable alternative, or ceasing operation of the impacted area until the violation is
corrected. Our local consumers and visitors quickly learn the usefulness of the grade in selecting a place
to dine.
Enforcement: When conducting our baseline assessment for risk factor violations found during 2001-
2003, we found that enforcement and compliance procedures were inconsistently applied when risk factor
violations were repeated. In many cases, we found that compliance measures were taken to correct risk
factor violations by the food facility at the re-inspection, only to be repeated again at subsequent routine
inspections. Two things were lacking in these cases, adequate risk control procedures implemented by the
food facility and FHD’s ability to easily identify repeat violations. It also was not clear on the inspection
report whether or not a major risk factor violation was immediately corrected at the time of inspection.
Subsequently, we revised our inspection process and inspection report in 2004 to ensure that risk factors
and interventions are prominent both during the inspection and on the report. Additional details are
provided in the Issue/Challenges sections for “Manages Risk”. Data management reports also assist
Environmental Health Specialists in determining whether a food facility has repeated major risk factor
violations in a 12 to 18 month period, whether the facility scores less than 90 points (less than a grade
“A”), or whether the facility has repeat closures. In cases where major risk factor violations are repeated,
or the facility repeatedly scores less than 90 points, a review of the inspection history is conducted to
identify intervention strategies that may assist the facility in achieving long term compliance (Active
Managerial Control). These can include an informal administrative hearing/office conference to discuss
compliance measures, implementation of a risk control plan or sanitation operating procedures, equipment
change or layout, or modification of a recipe or menu item. During informal administrative

18
hearings/office conferences, problem areas are identified and long term intervention strategies are
discussed. Additional training or re-training may be required for food handlers. After the hearing, if
violations continue to be repeated, or the facility continues to score less than 90 points, a permit
suspension/revocation hearing is scheduled. A permit suspension/revocation hearing is a formal process,
where inspection history is reviewed to determine whether or not a permit should be modified, suspended,
or revoked. A variety of options have been discussed and agreed to by food facility operators, including,
but not limited to, modifying a permit to require the use of a full Hazard Analysis Critical Control Point
(HACCP) plan and retaining a consultant, more training, and more frequent inspections. This process
ensures that a comprehensive risk-based process has been initiated to assist the facility in implementing
appropriate food safety practices. If the facility continuously fails to meet Health and Safety standards,
their permit is revoked. In more serious cases, court action has also been pursued through the District
Attorney’s offices.
Formal Staff Training Program: FHD Environmental Health Specialists (EHS) are trained with an
emphasis on standardization and risk reduction. New EHSs are required to complete a comprehensive
six-week training program covering major topic areas. They also have to earn their certification as a
Registered Environmental Health Specialist (REHS). Additionally, all EHSs receive ongoing training
each year and are re-standardized to ensure consistency and uniformity in inspection and interpretation of
the state retail food law.
Internal Quality Assurance: An “Excellence in Service” program that is designed to assess and verify a
quality inspection program is an important component to our TEAM Excellence Performance Measures
System. This new program is aligned with the FDA National Retail Food Program Standards and was
implemented in November 2004. It includes an evaluation process, annual standardization, and customer
service surveys. Prior to the Excellence in Service program, EHSs went through an extensive sixteen-
hour statewide standardization training course and were required to be field standardized by a statewide
standard every three years. Supervisors also review inspection reports issued by staff daily. Computerized

19
ISSUES AND CHALLENGES
Assessing Risk
CommunicatingRisk
Managing Risk
Verifying Qualityof Service
reports are also generated to identify food establishments with recurring major risk factor violations,
multiple down grades (scoring below 90 points), repeat closures, and those overdue for inspection. A
mystery shopper also shops every two months by e-mail, telephone, and in person to evaluate our
customer service.
In 2001, together with our stakeholders, we
initiated work on creating a long-range goals and
objectives plan. Our primary goal was and is to
reduce foodborne illness. Our plan’s major
objectives focus on public health interventions
designed to reduce risk of foodborne illness. To
help achieve our goals and objectives, we
designed and incorporated a comprehensive TEAM Excellence Performance Measurement System that is
built on a foundation with a conceptual risk analysis framework of assessing risk, communicating risk,
managing risk, and verifying quality of service. It is from these concepts that planned interventions were
developed and implemented in order to achieve our long-range goals and objectives.

20
Issue/Challenge: ASSESSING FOOD SAFETY RISKS THAT CAN BE CONTRIBUTING
FACTORS TO FOODBORNE ILLNESS.
Objective: Establish a baseline of food employee knowledge and food safety risk factor violations
observed during inspections. The baseline trends have identified training and other intervention
strategies needed to reduce risk. The implementation of these strategies has resulted in decreasing
trends in the occurrence of food safety risk factors countywide.
Methods:
Historical baseline survey conducted of risk factor violations in retail food facilities. A historical
baseline study of risk factor violations was conducted by reviewing inspection reports from January 2001
through December 2002. The sample size used was derived using FDA recommendations.
Assess risk factor knowledge of food employees. In March/April 2003, more than twelve hundred one-
page surveys in English and Spanish were administered during routine food facility inspections to food
employees that prepare or handle unpackaged foods. The purpose of this survey was two-fold: to assess
knowledge of food employees in several types of food facilities in San Diego County and to compare the
effectiveness of three types of food handler training programs.
Six questions were asked to assess the
food handlers’ knowledge of food safety. These
questions pertained to risk factors associated
with and implicated in causing foodborne
illness, according to studies conducted by the
Centers for Disease Control and Prevention.
Minimizing these risk factors is part of FHD’s goals and objectives.
Number of Persons AnsweringEach Question Correctly
991 954
151
1,202
907714
71%74%12%94%56%77%0
200
400600
8001,000
1,2001,400
Num
ber o
f Cor
rect
Res
pons
es
Total Persons (#) 991 714 1,202 151 954 907
Percentage (%) 77% 56% 94% 12% 74% 71%
Question # 1: Cold Holding
Question # 2: Hot Holding
Question #3: Handwashing
Question #4: Cooking
Temperature
Question #5: Approved Source
Question #6: Manual
Dishwashing
21
Question 1 asked the respondent to choose the proper cold-storage temperature for meat, poultry, and
seafood. Seventy-seven percent selected the correct answer, 41°F. Eighteen percent (235 persons)
believed 32°F was the correct answer.
Question 2 related to the minimum hot-holding temperature of perishable foods at steam tables.
Approximately half (56%) of those surveyed selected the correct answer, 140°F. One quarter (25%)
thought the answer was 160°F. Selecting 160°F as the hot holding temperature, while technically
incorrect, would still result in a safely held food product. Based on the responses, if the two answers were
combined, eighty-one percent (81%) would hold foods properly at or above 140°F as required.
Question 3 was about personal hygiene and asked when hands should be washed after certain activities,
such as using the toilet, smoking, etc. An overwhelming majority (94%) answered this question about
hand washing correctly. The correct answer was hands should be washed after all of the listed activities.
Question 4 asked what the minimum cooking temperature of hamburgers and other ground meats was.
This was the most frequently incorrectly answered question. Only 12% (151 persons) of respondents
correctly selected 157°F as the answer. Sixty-six percent (843 persons) selected 165°F as the answer.
Erring on the side of safety, 78% of respondents would have cooked the hamburger to at least 157°F, a
minimum level of safety. If anything, the result would be an overcooked, but safe, product.
Question 5 related to the definition of safe food sources/ approved source. Seventy-four percent answered
the question correctly, selecting all of the above as the answer. Some (17%) believed the definition of
approved source was that the food item was manufactured under sanitary conditions, omitting the other
two choices such as safe ingredients and labeling requirements.
Question 6 questioned the correct order of manual dishwashing steps. More than two-thirds (71%)
identified the proper sequence of steps. Respondents that answered incorrectly (17%) believed that the
proper order was: wash-sanitize-rinse-air dry.
Continuous assessment of risk factor violations. Risk factor violations observed during inspections are
stored in a computerized database. A dashboard report that monitors the occurrence of risk factor

22
S. typhimurium Reported Casesand
Illegal Cheese InterventionsSan Diego County 2004-2005
0
2
4
6
8
10
12
14
16
J F M A M J J A S O N D J F
Month
# C
ases
PFGE Pattern Q
Non-Q Pattern
July 2004One Illegal
Vendor Cited(North County)
Press Release
Nov-Dec 2004Two Illegal
Vendors Cited(East County)
Feb 2005One Illegal
Vendor Cited(South County)
Press Conference
2nd Press Release
PFGE Pattern Q is related to cheese
Multi-AgencyInvestigation Ongoing
May 2004Market
with Illegal
Cheese
Salmonellatyphimurium
cases
violations at food facilities was developed in 2003 and is maintained and reviewed each month.
Assessing risk is an ongoing process that has helped identify: changing trends; new problems; whether or
not a relationship exists between lack of knowledge and violations observed; and if interventions
implemented are effective.
Contributing factors of foodborne illness outbreaks are reviewed. Annual assessments of risk factors
found during investigation of foodborne illnesses were conducted for calendar years 2003, 2004, 2005 and
2006. Reported Salmonella and Campylobacter illnesses where people ate out during the exposure period
are also evaluated (whether or not they were related to a cluster of illnesses or whether or not the facility
was the source of the illness) during the same time frame. FHD also reviews countywide reports of
Salmonella and Campylobacter cases on a weekly basis to identify whether or not an outbreak may be
emerging. This assessment process was important in identifying a cluster of illnesses found sporadically
throughout the county that were linked to the consumption of illegal raw milk queso fresco (fresh cheese)
sold by street vendors. The assessment led to field surveillance and sampling that positively linked the
illegal cheese sold by street vendors with the illnesses through laboratory PFGE analysis. The following
chart illustrates an assessment of total Salmonella typhimurium cases reported and the subsequent impact
of illegal cheese interventions implemented.
23
Measurable Outcomes and Achievements: Our risk assessments revealed that the three top risk factor
violations found consistently during inspections and foodborne illness investigations include: improper
cold holding temperatures, poor employee hygiene, and improper cleaning and sanitization of food
contact surfaces. The assessments also revealed that there is a need to improve practices in wholesale
food warehouses that distribute food to retail food facilities. With this assessment information,
interventions were developed and implemented. These included: leading the statewide charge to develop
and implement a more modern food safety law that includes more responsibility for the Person in Charge
at food facilities to restrict or exclude ill food employees; use of risk control plans; a new risk-based
inspection process; a wholesale food warehouse inspection and education program; an operator’s guide in
multiple languages; risk control plan workbooks for both retail and wholesale food facilities; and
guidance materials associated with obtaining food from approved food sources, use of wiping cloths,
temperature control logs and calibration procedures; and outreach workshops. This has resulted in
decreasing trends in major risk factor violations. Our food employee knowledge survey revealed that
there is a lack of food employee knowledge regarding two risk factors: proper cooking and hot holding
temperatures. A direct relationship between lack of knowledge and most frequent risk factor violations
found during inspections could not be associated. One can assume that usually, what people know and
what people do are often two different things. To reverse this human tendency, we strengthened our
enforcement and compliance procedures. Other trends in the data from the survey revealed that
respondents who took the survey in English scored higher than those in Spanish; those with food safety
certification scored much higher than those with classroom or in-house training; and finally, respondents
at facilities with the largest number of employees scored slightly higher than facilities with fewer
employees. The food employee knowledge survey will be repeated in 2008 to identify whether or not
there has been an improvement in food safety knowledge.

24
Issues/Challenge: COMMUNICATING FOOD SAFETY RISKS THROUGH EDUCATIONAL
OUTREACH AND TRAINING PROGRAMS.
Objective: Increase stakeholder knowledge of food safety issues through partnerships and convenient
communication methods. Improving knowledge of food safety risks is an important step leading to
improved food preparation practices that can directly relate to foodborne illness. This approach will
continue to result in educating more stakeholders on the national, state, and local levels.
Methods:
Established a forum to partner with stakeholders to interact, provide information, receive input,
and educate. In 2001, San Diego County established a Food Safety Advisory Council (FSAC) as a
forum to obtain input for long term planning purposes. The FSAC is comprised of retail food industry
stakeholders, San Diego County food handler training schools, the San Diego State University Graduate
School of Public Health, the Farm and Home Advisor, epidemiologists, public health nurses, and the
FHD. The FSAC is focused on information sharing, input regarding program planning, and educating our
stakeholders. A number of educational presentations are also provided to interested stakeholders,
including topics such as food security, preventing cross contamination of food contact surfaces, employee
health and hygiene, foodborne illness procedures and self-reporting, how to ensure food is from safe food
sources, the FDA Bioterrorism Act, Agroterrorism, the National Incident Management System (NIMS),
and the new California Retail Food Code. A plan review subcommittee comprised of interested
stakeholders was also formed to address plan review issues and to develop construction guidelines for
food facilities. A new wholesale food warehouse inspection and education program was created in 2002
through the efforts of the FSAC and representatives from the wholesale food industry. The program was
initiated because our risk assessment identified food safety concerns associated with wholesale food
warehouses. Further, beginning in the spring of 2004, comprehensive training on risk factors and
interventions and the new risk-based inspection report were conducted through workshops held
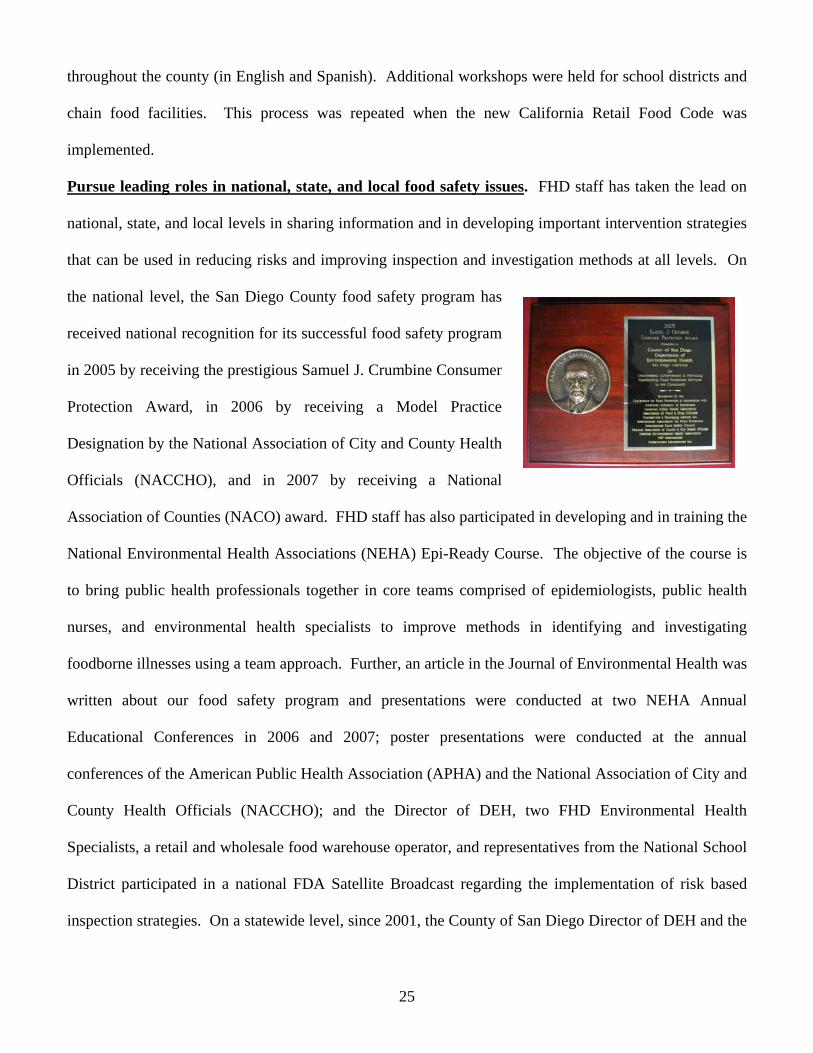
25
throughout the county (in English and Spanish). Additional workshops were held for school districts and
chain food facilities. This process was repeated when the new California Retail Food Code was
implemented.
Pursue leading roles in national, state, and local food safety issues. FHD staff has taken the lead on
national, state, and local levels in sharing information and in developing important intervention strategies
that can be used in reducing risks and improving inspection and investigation methods at all levels. On
the national level, the San Diego County food safety program has
received national recognition for its successful food safety program
in 2005 by receiving the prestigious Samuel J. Crumbine Consumer
Protection Award, in 2006 by receiving a Model Practice
Designation by the National Association of City and County Health
Officials (NACCHO), and in 2007 by receiving a National
Association of Counties (NACO) award. FHD staff has also participated in developing and in training the
National Environmental Health Associations (NEHA) Epi-Ready Course. The objective of the course is
to bring public health professionals together in core teams comprised of epidemiologists, public health
nurses, and environmental health specialists to improve methods in identifying and investigating
foodborne illnesses using a team approach. Further, an article in the Journal of Environmental Health was
written about our food safety program and presentations were conducted at two NEHA Annual
Educational Conferences in 2006 and 2007; poster presentations were conducted at the annual
conferences of the American Public Health Association (APHA) and the National Association of City and
County Health Officials (NACCHO); and the Director of DEH, two FHD Environmental Health
Specialists, a retail and wholesale food warehouse operator, and representatives from the National School
District participated in a national FDA Satellite Broadcast regarding the implementation of risk based
inspection strategies. On a statewide level, since 2001, the County of San Diego Director of DEH and the

26
Chief of FHD, representing local jurisdictions on the California Retail Food Safety Coalition3, have taken
leading roles in rewriting the California Uniform Retail Food Facilities Law so it will be modeled after
the FDA Model Food Code. Countless hours of effort both on and off the clock has been poured into this
effort in order to improve public health in California. Governor Arnold Swartzennegar signed the bill, SB
144 that established the California Retail Food Code (CalCode) in 2006. CalCode became effective on
July 1, 2007. The Director of DEH and the FHD Chief also took leading roles in developing a statewide
training curriculum, a model inspection report form and a corresponding marking guidelines document,
and a model guide guideline for implementing a risk based food safety program. In addition, the Director
of DEH lead the state’s Food Safety Policy Committee and helped persuade the State Department of
Public Health to enact regulations that restrict the sale of oysters harvested from the Gulf of Mexico
during warmer months (April–October) in order to prevent deaths associated with Vibrio vulnificus. FHD
Environmental Health Specialists, Chief, and DEH Director are frequently invited to conduct numerous
training courses for the California Environmental Health Association’s educational conferences. On a
local level, FHD has facilitated the Epi-Ready course in San Diego County so neighboring local
jurisdictions and industry could receive training in order to improve response to foodborne illness
outbreaks on a local level in Southern California. FHD has also taken the lead in establishing the FSAC,
educating the industry and the public through guidance and outreach, and reducing major risk factor
violations through interventions. In addition, FHD staff has participated as Chair and Vice-Chair of the
Southern California Food Technical Advisory Committee and in the Food Industry Business Roundtable,
a wholesale food industry business group.
Increase stakeholder knowledge of food safety risks through efficient and convenient
communication methods. FHD developed, implemented, and continually updates its interactive website.
The department first developed and launched a rudimentary website in 1999 that listed basic information
3 The California Retail Food Safety Coalition (CRFSC) is an informal, voluntary coalition of representatives in the State of California from the retail food service industry and local, state, and federal regulatory agencies.

27
regarding programs and services. In 2003, the website went through a major overhaul to make navigation
through the site more user-friendly and included a wider variety of information and resources available
electronically to website visitors countywide (in fact, worldwide) on demand. It also became a major
portal for guideline information pertaining to environmental public health issues resulting from
Firestorms 2003 and 2007. During this process, website content was re-arranged and reformatted, all the
while keeping a customer-focused design approach and minimizing time needed to locate required
content. Previously, the public had to initiate contact with FHD during business hours to ask questions,
report complaints, or request educational information or publications. Along with accessing basic data
about our program, visitors are now able to do many things such as locate a county-authorized food
handler school, sign up for an e-mail subscription service, download resources (laws, regulations,
workbooks, guides, and self-inspection checklists), find out what's new on the site or within our program,
determine contact names and phone numbers, send an email to our public information desk, report
complaints that are within our jurisdiction, or find referral information. Soon, food facility inspection
results will also be available online. FHD also regularly conducts outreach to the public using print, radio,
and television media. Annual media events include a Fourth of July food safety barbecue event to assist
the public in having safe summer barbecues, a holiday food safety press release, and food safety education
month targeted to kids in the community. Other media coverage since 2001 includes “How to have a safe
tailgate party” (when the Super Bowl was held in San Diego County in 2003), annual media coverage on
food facility inspections and safe food practices in the home on major television stations and the County
Television Network, participation in a 30 minute local broadcast on the “San Diego People” show about
food recalls, and a national FDA satellite broadcast about risk based food safety programs. Special issues
resulting in media coverage since 2001 include foodborne illnesses linked to the consumption of illegal
queso fresco (fresh cheese), consumption of raw Gulf Coast oysters, a Shigella outbreak at a popular
restaurant, food recalls, and a foodborne illness outbreak associated with pre-washed lettuce. Several
Spanish language interviews were also conducted to reach a larger audience.
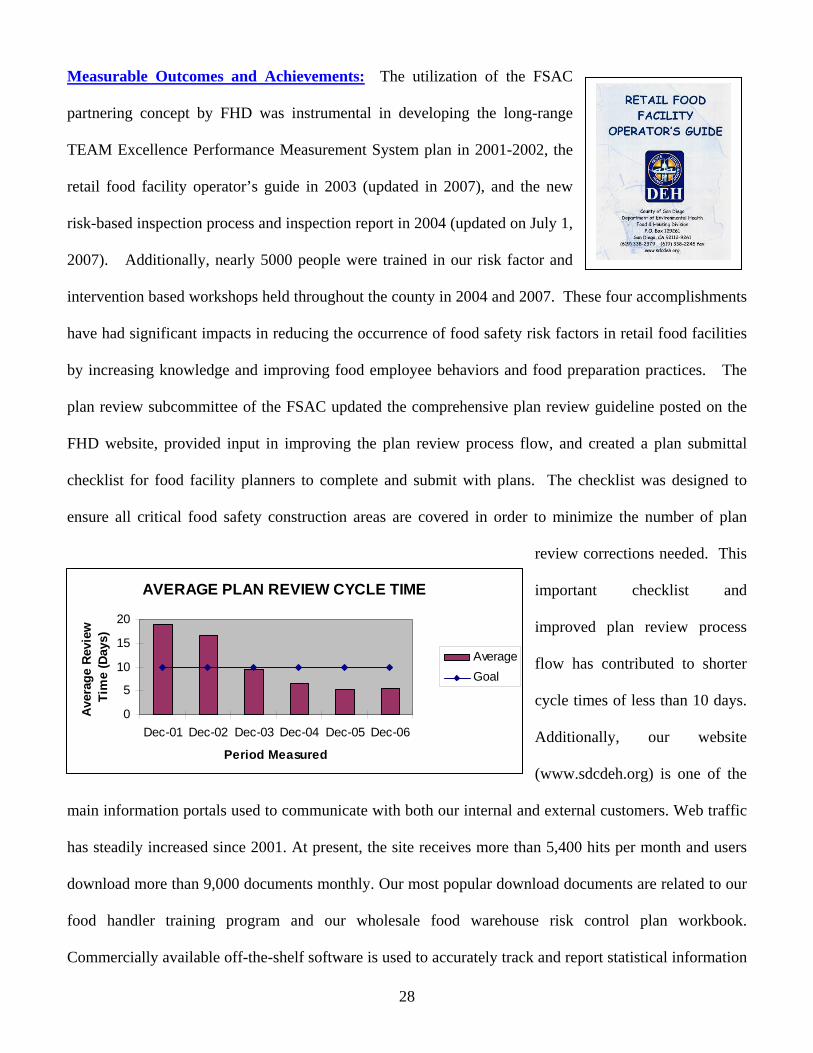
28
Measurable Outcomes and Achievements: The utilization of the FSAC
partnering concept by FHD was instrumental in developing the long-range
TEAM Excellence Performance Measurement System plan in 2001-2002, the
retail food facility operator’s guide in 2003 (updated in 2007), and the new
risk-based inspection process and inspection report in 2004 (updated on July 1,
2007). Additionally, nearly 5000 people were trained in our risk factor and
intervention based workshops held throughout the county in 2004 and 2007. These four accomplishments
have had significant impacts in reducing the occurrence of food safety risk factors in retail food facilities
by increasing knowledge and improving food employee behaviors and food preparation practices. The
plan review subcommittee of the FSAC updated the comprehensive plan review guideline posted on the
FHD website, provided input in improving the plan review process flow, and created a plan submittal
checklist for food facility planners to complete and submit with plans. The checklist was designed to
ensure all critical food safety construction areas are covered in order to minimize the number of plan
review corrections needed. This
important checklist and
improved plan review process
flow has contributed to shorter
cycle times of less than 10 days.
Additionally, our website
(www.sdcdeh.org) is one of the
main information portals used to communicate with both our internal and external customers. Web traffic
has steadily increased since 2001. At present, the site receives more than 5,400 hits per month and users
download more than 9,000 documents monthly. Our most popular download documents are related to our
food handler training program and our wholesale food warehouse risk control plan workbook.
Commercially available off-the-shelf software is used to accurately track and report statistical information
AVERAGE PLAN REVIEW CYCLE TIME
0
5
10
15
20
Dec-01 Dec-02 Dec-03 Dec-04 Dec-05 Dec-06
Period Measured
Aver
age
Revi
ew
Tim
e (D
ays)
AverageGoal
29
about website visitors. This information is used to customize and improve the website content and
delivery. Other website enhancements include: using a consumer food safety knowledge survey to collect
data about the public's knowledge, attitudes, and beliefs regarding environmental health topics; and
implementing a “Constant Contact” subscription service for any member of the public to receive e-mail
from FHD regarding important food safety topics. Making inspection results available online and a
broader consumer food safety knowledge survey media campaign is planned for later this year as part of
the planning process for further program development.
Methods:
Develop and implement a risk-based food facility inspection report. To appropriately manage risks
found during the inspection process, the food establishment inspection process and inspection report was
revised to be consistent with the FDA National Retail Food Program Standards recommendations in 2004
and updated in 2007. Inspection items that relate directly to risk factors and interventions became more
conspicuous and prominent during inspections and on the inspection report. A comprehensive marking
instructions guidebook was created to ensure consistency in interpretation and application of the report.
In January 2004, a workgroup of FHD staff and representatives from each of the retail food industry
Issues/Challenge: MANAGE RISKS BY PROMOTING AN INSPECTION METHODOLOGY
THAT PRIORITIZES INSPECTIONS AND INVESTIGATIONS BASED ON RELATIVE
DEGREE OF RISK.
Objectives: Implement methods to balance outcome and output measure components to ensure overall
prioritization and distribution of inspections and investigations are appropriate, consistent and uniform.
Monitor these components to ensure intervention strategies and resources are prioritized in critical
areas. The successful implementation and integration of these components will contribute to an
effective performance measurement system aimed at reducing the occurrences of risk factor violations.

30
groups represented in San Diego County provided input and piloted the new risk-based food facility
inspection report. By May 2004, the old inspection report were
replaced by the new “risk factor and intervention” based process. To
implement the new inspection process in the field, workshops were
held around the County and FHD staff conducted consultative
inspections the first time they used the new inspection report in a
facility. This provided an opportunity to educate the food facility
operator about the new report. Risk factor items are a prominent part
of the inspection process and are conspicuously located on the
inspection report because compliance with these items is vital to
prevention of illness, injury or death. Point values for risk factors and intervention type violations are
also weighted higher on the new report. Major risk factor violations are noted separately to assist in the
collection and evaluation of data and to identify trends in the occurrence of major risk factor violations.
Trends in the occurrence of major risk factor violations can assist in identifying training needs or other
intervention strategies needed to reduce risks in the community. Inspection items that relate directly to
interventions are also prominent during the inspection process and on the inspection report since
incorporating these procedures into a facility’s management practices will help protect the consumer’s
health. Definitions of major risk factor violations and relevant code sections from the California Health
and Safety Code are clearly noted on the back of each inspection report. It is important that information
on what is expected of an owner or operator of a food facility is clearly defined and consistently enforced.
The report also uses positive reinforcement by documenting when a facility is in compliance with items
related to the risk factors and interventions. Owners and operators can see items being documented “In
Compliance” (IN), “Out of Compliance” (OUT), “Not Observed” (NO), “Not Applicable” (NA) or
“Corrected-On-Site” (COS). A chart where temperatures, that are both in and out of compliance, are also
recorded on the new report. By acknowledging the good along with the bad and, identifying and

31
acknowledging the positive behaviors and actions in food establishment, employees will be inclined to
continue positive actions and behaviors. This shifts the focus of the inspection to determining relative
‘compliance’ rather than only identifying violations as traditionally done. The inspection report became a
risk-based inspection process that assesses the risks of a food facility’s operations. The risk assessment
process embedded in the inspection report combined with the marking instructions guideline was the most
effective intervention implemented and has since become the statewide model when the CalCode became
effective in 2007.
Revise output measures to ensure overall prioritization and distribution of inspections is consistent
and uniform. Prior to the implementation of the TEAM Excellence Performance Measurement System,
only output measures related to the number of high-risk (full service food preparation) food facility
inspections conducted were measured. The number of inspections alone does not measure relative degree
of risk. However, it is essential that a balance between output measures and outcome measures be
achieved in order to accomplish desired goals and objectives. Assessment of risk factors found in
various types of food facilities provided the basis for an effective risk-based output measures system. A
team approach to prioritize inspections, environmental investigations, outreach, training, complaint
investigations, follow up inspections, and special projects are components of the output measures system.
Environmental investigations related to complaints of foodborne illness outbreaks are the highest priority
inspection followed by full service food facilities without HACCP Plans, Meat Markets/Deli’s, full
service food facilities with a HACCP Plan, limited food preparation food facilities, and prepackaged food
facilities.
Enhance information technology as a data collection system for tracking risk factor violations.
Implementing an information technology system to track risk
factor violationsng inspections was challenging. Our KIVA
system was modified found duri to capture inspection data in
2002. New software, TELEForms, implemented in November

32
2005, is now able to capture inspection information by scanning inspection reports. Recent use of
Geographic Information Systems (GIS) has been effective in
identifying trends in relation to distribution of illnesses associated
with Salmonella and Campylobacter. It has also assisted in
surveillance of illegal vending of raw milk queso fresco (fresh
cheese) that was linked, through epidemiology and laboratory
confirmation, to over 50 illnesses associated with Salmonella
Typhimurium. During our investigation, we obtained the vendor’s
route book and used GIS to map the route and home addresses of
the reported ill cases.
Enhance disaster preparedness procedures. The unfortunate events of September 11, 2001 led to new
concerns related to food safety and security. FHD took a five-prong approach to disaster preparedness by:
preparing field staff with new equipment and training; conducting training
and distributing a two page guidance document on food safety and security to
our retail food facilities; developing a risk control plan workbook and training
for wholesale food warehouses on risk control and food recall procedures;
updating foodborne illness investigation and food recall procedures;
establishing a foodborne illness emergency response team; conducting
tabletop exercises on the local level and the state level; developing an emergency contact wallet card for
both public officials and our stakeholders; establishing a Department Operations Center (DOC) for
emergencies; and posting guideline information on our website and in our operator’s guideline document.
San Diego County was also the first county in California to complete a series of six training courses on
Agroterrorism provided by the Western Institute for Food Safety and Security. Stakeholders from
multiple agencies and the food industry attended the course and the subsequent table top exercise,
increasing knowledge and preparedness in the community.
33
Develop a consistent enforcement and compliance process to ensure that major violations are
immediately corrected or a suitable alternative implemented until the violation is corrected. During
the baseline risk factor assessment process, gaps in consistent enforcement and
compliance methods were identified. Since that time, a consistent and uniform
enforcement and compliance process has been implemented. This ensures that
major violations are immediately corrected or a suitable alternative is
temporarily implemented until the violation is corrected. When a major
violation cannot be immediately corrected, or a suitable alternative initiated,
the food facility may be subject to closure in the impacted areas until the
violation is corrected. A model risk control plan guideline was also created to
assist field staff in providing assistance to operators with recurring risk factor
violations. The risk control plan process assists food facility operators in
implementing simple model procedures to gain control of their food safety
risks. The risk control plan is part of the FHD approach to Active Managerial Control. Other tools
provided to food facility operators include a model temperature control log, procedures for implementing
employee health practices, guidelines for determining approved food sources, procedures for cleaning and
sanitizing equipment when using wiping cloths, and a risk control plan workbook. These tools, in
addition to a consultative inspection, are also provided to new food facility operators in a tool kit
distributed by the plan check unit when a new food facility opens for business. Food facilities that
continue to have repeated major risk factor violations, repeat downgrades of the facility, or repeat closures
are subject to further administrative action, up to and including modification of a permit or suspension or
revocation of a permit to operate the food facility. This approach has also been effective in contributing
to the downward trend in major risk factor violations.
Measurable Outcomes and Achievements: The new risk-based food facility inspection report; use of
active managerial control concepts; consistent enforcement and compliance procedures; and food handler
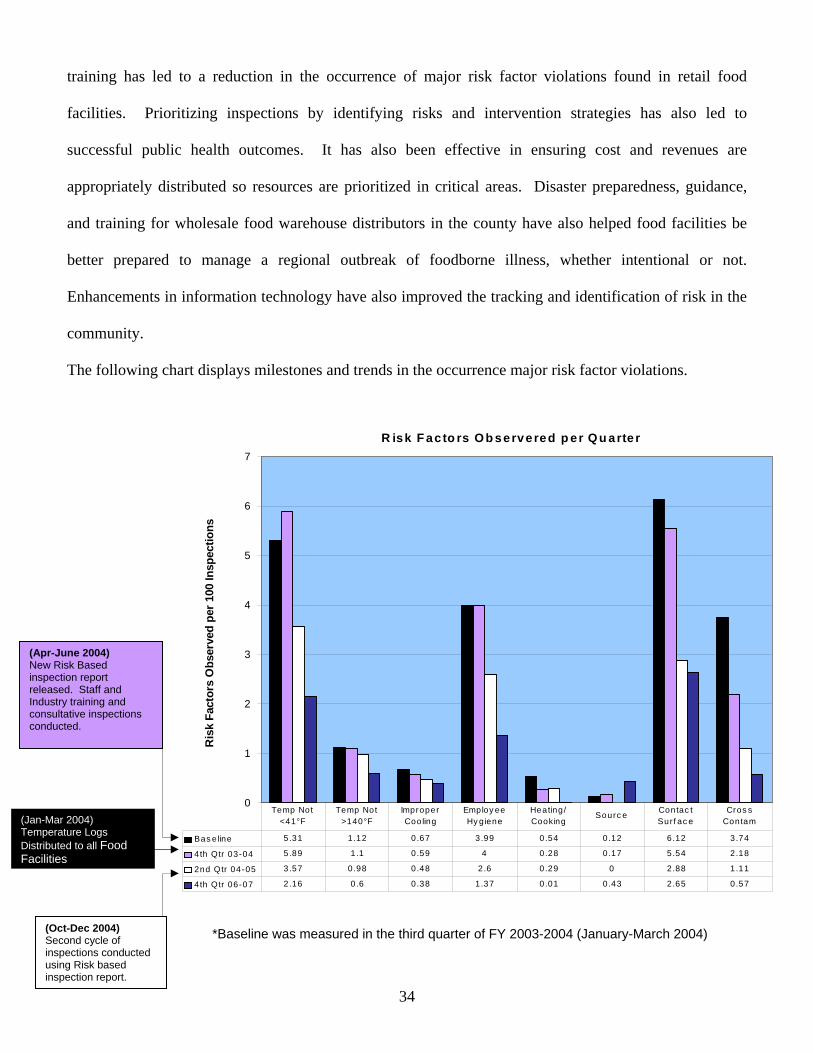
34
training has led to a reduction in the occurrence of major risk factor violations found in retail food
facilities. Prioritizing inspections by identifying risks and intervention strategies has also led to
successful public health outcomes. It has also been effective in ensuring cost and revenues are
appropriately distributed so resources are prioritized in critical areas. Disaster preparedness, guidance,
and training for wholesale food warehouse distributors in the county have also helped food facilities be
better prepared to manage a regional outbreak of foodborne illness, whether intentional or not.
Enhancements in information technology have also improved the tracking and identification of risk in the
community.
The following chart displays milestones and trends in the occurrence major risk factor violations.
n the second quarter of FY 2003-2004 (January – March 2004)
R isk F ac to rs O b servered p er Q u arte r
0
1
2
3
4
5
6
7
Ris
k Fa
ctor
s O
bser
ved
per 1
00 In
spec
tions
Bas eline 5.31 1.12 0.67 3.99 0.54 0.12 6.12 3.74
4th Qtr 03-04 5.89 1.1 0.59 4 0.28 0.17 5.54 2.18
2nd Qtr 04-05 3.57 0.98 0.48 2.6 0.29 0 2.88 1.11
4th Qtr 06-07 2.16 0.6 0.38 1.37 0.01 0.43 2.65 0.57
Temp Not <41°F
Temp Not >140°F
Improper Cooling
Employ ee Hy giene
Heating/ Cooking
Sourc e Contac t Sur f ac e
Cros s Contam
(Apr-June 2004) New Risk Based inspection report released. Staff and Industry training and consultative inspections conducted.
(Oct-Dec 2004) Second cycle of inspections conducted using Risk based inspection report.
(Jan-Mar 2004) Temperature Logs Distributed to all Food Facilities
*Baseline was measured in the third quarter of FY 2003-2004 (January-March 2004)

35
Issues/Challenge: VERIFYING THE QUALITY OF SERVICE, CONSISTENCY AND
UNIFORMITY OF OPERATIONS, AND IDENTIFYING RESOURCE NEEDS AND TRAINING
FOR STAFF ARE IMPORTANT COMPONENTS OF A PROGRAM TO ENSURE EXCELLENCE.
Objective: Implement an Excellence in Service program that is designed to assess and verify a quality
inspection program. The intent of the Excellence in Service program is to ensure safe and livable
communities by applying a consistent focus on reducing risk and exceeding our customer’s expectations.
Number of Food Facilities Reviewed Due to Salmonella & Campylobacter Cases
0
20
40
60
SALMONELLA 51 26 24 30
CAMPYLOBACTER 44 17 12 13
2003 2004 2005 2006
The following illustrates the decrease in number of food facilities reviewed due to confirmed reports of
Salmonella or Campylobacter illnesses (whether or not the facility was responsible for the illness):
Methods: The Excellence in Service program was developed by a team of staff members from all levels
of FHD from Trainee to Chief. The concepts within the program are modeled after the quality assurance
guidance in the FDA National Retail Food Program standards. The program has two integral parts
including: methods for ensuring consistent focus on reducing risk through a comprehensive field
evaluation and standardization process and evaluating the customer service provided by the division by
conducting a random annual customer satisfaction survey of facilities inspected. Additionally, a mystery
36
shopper randomly shops FHD services and personnel by e-mail, telephone, and in person throughout the
year.
Measurable Outcomes and Achievements: The Excellence in Service program is the final component of
the TEAM Excellence Performance Measurement System. It has resulted in all field staff, supervisors,
and the Chief of the FHD being standardized on risk factor and intervention based inspections. It has also
resulted in identifying training needs for field staff and average customer satisfaction scores of 96%.
FHD is similar to many successful organizations that are geared toward achieving positive outcomes,
measuring performance, and maintaining and improving the quality of service. However, FHD has
achieved additional accomplishments by partnering with our stakeholders to develop and implement the
model TEAM Excellence Performance Measures System for the San Diego County food safety program.
This system, built on a foundation that utilizes the risk analysis concepts of assessing risk, communicating
risk, managing risk, and verifying quality of service will continue to evolve and serve the community in a
proactive manner well into the future. A tremendous amount of time and commitment by FHD staff and
stakeholders have contributed to the success of our program in enhancing the quality of life for 3 million
residents and 14.7 million overnight guests that visit the county each year. When the regulated industry,
schools, academia, consumers, epidemiologists, public health nurses, and the regulators are interested in
partnering to ensure the public’s health and safety, we all win! In light of these tremendous efforts and
resulting positive outcomes, we respectfully submit this summary for evaluation of the San Diego County
Food Safety Program.
Environmental Public Health through Leadership, Partnership, & Science OWLEDGEMENTS
SUMMARY
62
APPENDIX E
Technology Upgrade Studies by:
1. TacomaPierce County Health Department
2. Baltimore County Health Department

Decade Software Company, LLC Case Studies
Tacoma-Pierce County Health Department Mr. Mike Davis 3629 South D Street Tacoma, WA 98418 253.798.6464 [email protected] Date Live on Envision: 2000 Services Provided: • Data conversion from legacy system (Tidemark) • Software implementation services for the following Decade solutions:
Envision Field Inspection System Envision Press Agent (Currently being deployed) Envision Connect Rollout (Spring 2004)
• Training, Report Customization and Workflow Design • Custom Programming • Technical Support • Software Enhancements and Maintenance ROI Example: TPCHD phased in the deployment of Decade’s Envision in 2000 and field automation in 2001 with 10 full time inspectors in the Food and Community Safety Program. In 2001, the inspectors utilized a desktop version of the Envision Field Inspection System to familiarize themselves with the tool. They were still conducting their inspections manually in the field, but entered in their own work into the computer. In 2002, TPCHD deployed the Field Inspection System on pen-enabled laptop computers in the field Over 800 more routine inspections were done in 2001 than in 2000 without increasing the number of inspectors. In 2002, over 700 more inspections were accomplished in just six months. The result, productivity has increased by the equivalency of adding 2 Full Time inspectors. Prior to 2000, TPCHD was planning to increase clerical staff from 4 to 5 Full Time employees to keep up with the workflow. In addition, an intern was hired. After deploying Decade’s software, TPCHD was able to keep clerical staff at 4 Full Time equivalents and no longer required a full-time intern.
0
500
1000
1500
2000
2500
3000
3500
4000
2000 2001 2002
RoutineInspectionsconductedduring 1st sixmonths.
EIRS - New System 12 Month Evaluation
Project Objectives:
• Provide a reliable, stable application that can collect information gathered during several types of inspections.
Was this objective met? - Yes
Why/Why Not: - The software solution has provided a reliable, stable environment with very little down time. Down time was isolated to a single laptop at any given time, thus allowing other sanitarians to continue working. Sanitarians inspect health related facilities in four major areas: dietary, environmental, complaints and plan reviews, the application captures information on inspections in all four major areas. The software also provides for the collection of non-inspection related activities such as staff meetings, office time and the tracking of related facility applications.
• Enable the Health Department to maximize the collection of revenues associated with inspection fees. Fees can’t be
collected for inspections not done.
Was this objective met? - No
Why/Why Not: - While more physical inspections were completed during FY 2004 fewer Assisted Living Facilities and Related Facilities were inspected. The reduction in these areas of inspections stemmed from the following: Related Facilities – (Foster Homes, Group Homes, Homes for Adopted Children and Residential Services for Mentally Retarded or Developmentally Disabled Individuals) Inspections for these types of facilities are assessed a fee of $75. Inspections are scheduled upon the request of the approximately 30 placement agencies in Baltimore County. Request for inspections has been lower this year then in past years. Assisted Living Facilities – ALFs are a sub-set of the Health Care Facilities. These facilities provide services to residents who are unable to live on their own, but who do not require comprehensive care. Assisted Living Facilities consist of facilities as small as one resident in a home to several hundred residents in a building. Due to recent legislation defining stricter regulations and the cost of $350 for the inspection (this is a flat fee without consideration for size) seems to have caused many of the small facilities to “go under ground” and thus they are not available for inspection. Unfortunately this leaves the residents of these facilities “at risk”. During FY 2004 116 Assisted Living Inspections were completed in 114 facilities this is down from 157 ALF inspections during FY 2003, however 38 of this years inspections were in new facilities. The additional inspections that were completed in the area of dietary inspections, which are tied to food permit fees, therefore no additional revenue was generated.
• Reduce or eliminate the public health risks associated with the inability to conduct facilities inspections in a timely manner.
Was this objective met? - Yes
Why/Why Not: - The greatest health risks, to the residents of health care facilities, are from food contamination.
For the first time in about 8 years the sanitarians were able to complete the mandated number of dietary inspections. The number of inspections mandated in Baltimore County Code is dependent upon the level of food preparation performed at a facility. Inspections range from 1 inspection a year to 3 inspections. The additional 101 inspections completed by the sanitarians is in fact the number of high priority (3 inspections per year) facilities. The ability to complete these inspections reduces the health risks to the residents of these facilities. During the dietary inspections a total of 26 critical violations, those infractions considered to pose immediate heath risks, were sited. This number is down from 37 during FY 2003.
• Provide accessibility to the central database from the main office, a home office, or even from the field, further increasing productivity.
Was this objective met? - Yes
Why/Why Not: - The solution installed provides the sanitarians with replicated databases on their notebook
computers. The staff can access these databases at any time from any location. When a sanitarian returns to the office he/she docks their notebook and any updates to their database is replicated to the central database and changes to the central database made by other sanitarians or administrative staff is replicated to their notebook.
• Any solution to replace the current system must, at a minimum, provide all of the functionality now available to
inspectors in the current system.
Was this objective met? – Yes Why/Why Not: - The Envision back end software along with the Field Inspection System software from Decade as
provided, the staff of Department of Health – Medical Environmental Health, with all of the function that existed in the ERIS system. Additional features and functions have allowed MEH to review and revise their workflows thus allowing the sanitarians to complete more inspections.
• Modernizing and standardizing the hardware and operating systems that will support the new software. This will help to increase reliability and reduce support costs.
Was this objective met? - Yes
Why/Why Not: - As part of this project all notebook and desktop computers as well as portable and office printers
were replaced. The new equipment had allowed for standardization among the sanitarians. The new equipment has assisted in providing reductions in support costs.
Benefits Realized: 101.1 Travel Time Saved (Additional Days/Year available for Inspections) - (((((A * B) * C ) * D) / E) * F)
Estimated A = hours saved 2 hrs. per day B = number of sanitarians 5 in year 1 C = days per week hrs would be saved - assuming 2 D = weeks worked per year - assuming 40 E = hours divisor to obtain days - assuming 7 F = fee for Assisted Living Facility inspection - assuming $350 For year 1 we are assuming that we will see 25% of the total estimated benefit. Year 1 - 9,975 Actual A = hours saved .5 hrs. per day B = number of sanitarians 5 in year 1 C = days per week hrs would be saved - assuming 3 D = weeks worked per year - assuming 40 E = hours divisor to obtain days - assuming 7 Year 1 – 43 hours per week No monetary benefit was recognized from this time savings due to the fact that the hours saved were used to complete additional dietary inspections and were not used to inspect Assisted Living Facilities. 101.2 Document Handling Time Saved - (Additional Days/Year available for Inspections) - (((((A * B) / C) / D) *E) * F) Estimated A = number of documents - assuming 9,931 B = time to manually process - assuming 5 minutes per document C = minutes divisor to obtain hours - 60 D = hours divisor to obtain days - assuming 7 E = divisor for sanitarians vs. office staff assume 50% E = fee for Assisted Living Facility inspection - assuming $350 For year 1 we are assuming that we will see 25% of the total estimated benefit. Year 1 5,162 Actual This benefit was not realized. We have not implemented any electronic document storage or handling.
This is primarily due to the fact that the inspection reports must contain a signature. The equipment currently in place does not allow the sanitarian or the facility representative to electronically sign the inspection reports.
103.1 County Support Staff Savings - Health - (((A * B) * C) * D) Estimated A = current effort of 6.5hr/wk B = increase in effort factor (Y1=1, Y2=1.5, Y3=2.25, Y4=3.375, Y5 - Y7=5.0625 C = hourly salary - assuming $50/hr D = weeks worked per year - assuming 52 Year 1 16,900
Actual Year 1 – 1,000
The Health Department Support Staff estimated the actual benefit. The savings was minimal because the type of support provided never consisted of application support but of hardware connectivity and standard County software support. The time saved (20 hrs/yr) is the savings recognized by the reduction of coordination necessary to deal with software issues.
103.2 County Support Staff Savings - OIT - (((A * B) * C) * D) Estimated A = current effort of 3hr/wk B = increase in effort factor (Y1=1, Y2=1.5, Y3=2.25, Y4=3.375, Y5 - Y7=5.0625" C = hourly salary - assuming $50/hr D = weeks worked per year - assuming 52 Year 1 - 7,800 Actual Hour savings (outside installation support) is approximately 100 hours during the first year. This savings
is not large when looked at as a monetary figure it did however provide the County OIT Support Staff 100 hours that could be expended assisting another agency. Year 1 - 5,000

63
APPENDIX F
Evaluation Team – Food Safety Profiles Bette Packer Number of years in Environmental Health: 24
NEHA Board Member, Regional Vice President Current: Bette Packer & Associates, Food Safety Consulting Previous: Supervisor, Assistant Mgr, Minneapolis Environmental Health Minnesota Food Code Committee Minnesota Food Leadership Program Various state level food safety committees
Bob Harrington Number of years in Environmental Health: 34 1974 - 1980. El Paso County, Colorado General sanitarian to Senior Supervisor, founding member- Government Food Safety Advisory, NEHA Registered Sanitarian. 1980 - 1985. West Region Quality Assurance Manager, AMTRAK. Responsible for all food safety operations in 11 western states---onboard, 5 commissaries, vendor-contractor compliance and crew training. California Registered Sanitarian. 1985. - 1997. VP, Public Health, National Restaurant Association -- contributor to Servesafe, Liaison to FDA, USDA, founding member of Conference for Food Protection, author of several articles, Diplomate American Academy of Sanitarians, member AFDO. 1997 - present. Dept director, Casper-Natrona County Health Dept, Founding member task force to draft the Wyoming Food and Drug Cosmetic Safety Act and Regulations, founding member Wyoming Government Food Safety Council. Member NACCHO, APHA, NEHA, WEHA and WPHA.
Frank Gomez Team Chairperson
Years in Environmental Health: 36 Years as Training Coordinator, Los Angeles County: 18 Years heading EIR Unit: 9 Currently, Professor, TUI University He has been a subject matter expert for the Certified Food Safety Professional Examination, Experior Certified Professional Food Manager Certification Program, and the Foodservice Operator’s Training Achievement Program (TAP), Premier Distributors of America, Inc. and Chimera Multimedia. He was also a Food Safety Instructor for several Food Safety Training Programs. He was also an Appointed Member to the Sanitarian Registration Certification Committee (Environmental Health Specialist Registration Committee) for the State of California.
He has been awarded the Stuart E. Richardson, Sr. Award, California Environmental Health Association, and the Past Presidents Award,
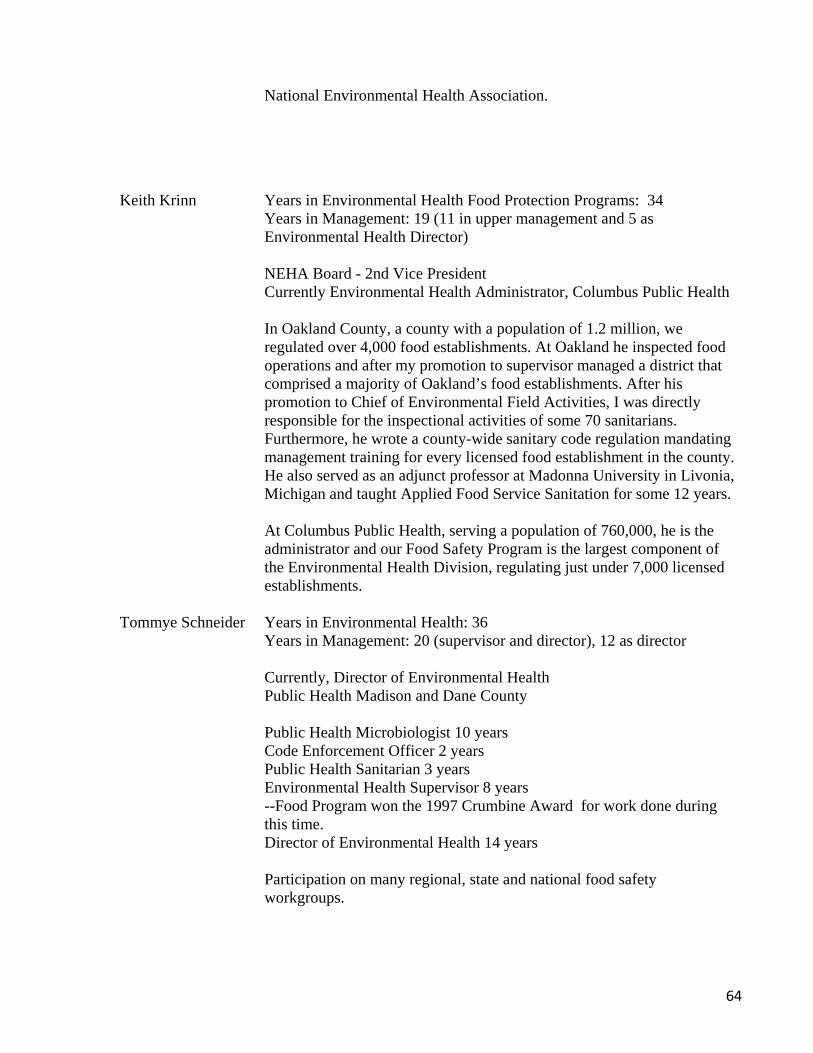
64
National Environmental Health Association.
Keith Krinn Years in Environmental Health Food Protection Programs: 34 Years in Management: 19 (11 in upper management and 5 as Environmental Health Director) NEHA Board - 2nd Vice President Currently Environmental Health Administrator, Columbus Public Health In Oakland County, a county with a population of 1.2 million, we regulated over 4,000 food establishments. At Oakland he inspected food operations and after my promotion to supervisor managed a district that comprised a majority of Oakland’s food establishments. After his promotion to Chief of Environmental Field Activities, I was directly responsible for the inspectional activities of some 70 sanitarians. Furthermore, he wrote a county-wide sanitary code regulation mandating management training for every licensed food establishment in the county. He also served as an adjunct professor at Madonna University in Livonia, Michigan and taught Applied Food Service Sanitation for some 12 years. At Columbus Public Health, serving a population of 760,000, he is the administrator and our Food Safety Program is the largest component of the Environmental Health Division, regulating just under 7,000 licensed establishments.
Tommye Schneider Years in Environmental Health: 36 Years in Management: 20 (supervisor and director), 12 as director Currently, Director of Environmental Health Public Health Madison and Dane County Public Health Microbiologist 10 years Code Enforcement Officer 2 years Public Health Sanitarian 3 years Environmental Health Supervisor 8 years --Food Program won the 1997 Crumbine Award for work done during this time. Director of Environmental Health 14 years Participation on many regional, state and national food safety workgroups.

65


