
RESIDUAL RADIATION MONITORING BY BEAM LOSS MONITORS AT
THE J-PARC MAIN RING*
T. Toyama, H. Kuboki, H. Nakamura, K. Satou, M. Shirakata, and B. Yee-Rendon
KEK, Tsukuba, Ibaraki, Japan
Abstract
At J-PARC (the Japan Proton Accelerator Research
Complex), high intensity proton accelerator, controlling
and localizing beam losses and residual radiations are key
issue, because the residual radiation limits maintenance
work in efficiency and working hours, and then limits
machine availability. We are accumulating continuous
measurement data of residual radiation after the beam
stopped using beam loss monitors in the Main Ring (MR).
The wire cylinder gaseous radiation detectors are used in
a proportional counting region. The heads are DC-
connected and have a gain as large as 30000 with a bias
of -2 kV. We switch the DAQ trigger, change the ADC
sampling rate, and raise the gain when the accelerator
operation ends. The offsets are measured with zero bias
voltage. Identification of radionuclides has been
performed with time decay analysis, with assistance of
energy spectrum measurements with the Gamma Ray
Spectrometer.
INTRODUCTION
In the high intensity proton accelerators the residual
radiation limits the available time and procedure of
maintenance works. Monitoring the residual radiation
level without entering the accelerator tunnel after the
beam stopped has been tried at the KEK-PS [1]. Recently
at the J-PARC MR using a proportional counter type
BLM (pBLM), residual radiation was measured at the hot
spots [2]. Such a continuous measurement is to be
extended to all pBLMs along the MR. The system
configuration, initial results and radionuclide
identification are reported.
pBLM SYSTEM
The detector used for residual radiation measurement
comprises an inner wire and double coaxial conductors.
The inner wire is connected to the inner conductor of a
coaxial cable, inner cylinder to the high potential of a HV
power supply as a bias and outer cylinder to the ground of
the coaxial cable (Figure 1). The pBLMs are set on the
quadrupole magnets (Figure 2). Iron cylinder of 3 mm
thick covers the detector to shield magnetic fields from
the neighboring electromagnets.
At a low radioactive level such as exposed only by
cosmic ray, the linearity is good [3]. On the other hand at
highly radioactive circumstances, the output is saturated.
The condition of saturation was estimated in [3]. When to
use the pBLM as a beam loss monitor, -1.3 kV is set at
the hot spots such as the MR collimator section and slow
extraction section, and -1.6 kV at the other locations. For
residual radiation measurements, bias HVs for the
detectors are changed to -1.8 kV for hot spots and -2.0 kV
for the others.
The block diagram of the system is shown in Fig. 3.
The signal is sent to the local control room (LCR) via
coaxial cables DC-connected to the pBLM detectors in
the tunnel. In the processing circuits at the LCR the signal
is divided into two ways, one way for machine protection
system and another way for beam loss record and display.
The signals are integrated within the gate time and
digitized in the PLC modules. The sampling interval is
input from the control terminal, 16 ms in this case. For
the beam loss record and display, the gate is triggered
with the “beam trigger” (TYPE B or C) [4]. For residual
radiation measurements the gate trigger is changed to “no
beam trigger” (TYPE A) [4].
Figure 1: “Proportional counter” type beam loss monitor.
Figure 2: BLM setting on the quadrupole magnets.
Steering magnet
Bending magnet
Quadrupole magnet
Beam Loss Monitor
____________________________________________
Proceedings of IPAC2016, Busan, Korea WEPOR021
06 Beam Instrumentation, Controls, Feedback and Operational Aspects
T18 Radiation Monitoring and Safety
ISBN 978-3-95450-147-2
2715 Cop
yrig
ht©
2016
CC
-BY-
3.0
and
byth
ere
spec
tive
auth
ors

Figure 3: Block diagram of the MR pBLM system.
OFFSET CORRECTION
Obtained signal contains charges produced by
environmental radiation (gamma rays and electrons), ones
produced by the activated detector itself and leakage
currents in the processing circuit. In the integration circuit
a small leakage current is accumulated and yields a
sizable offset at the output. Subtracting the zero bias data
from the raw data yields the desired signal (Figs. 4 and 5).
An object to be measured is the environmental radiation
level at each detector. Although the detector itself emits
gamma rays and electrons, and the above procedure
doesn’t subtract this contaminated detector effect,
considering that the detector, magnets and peripherals
have been exposed similarly to the beam losses and that
their main element is iron, the above subtraction
procedure may reflect the environmental radiation.
The plot in Fig. 4 is enlarged and divided into three
parts in Fig. 5. The bias HVs are set -1.8 kV at address
#213-#216, #1-#20, and -2.0 kV at the other BLMs. This
data are taken 8 hours 30 minutes later after beam stopped
in Dec. 22, 2014. The MR has a three-fold symmetry. In
each super-period fifteen BLMs at the left side are located
at an insertion section: from top to bottom, injection (#1-
#15), slow extraction (#72-#87) and fast extraction
section (#144-#159). The peak at #6 - #11 corresponds to
the MR collimators. The peak around #80 corresponds to
the slow extraction septa. The peak around #155
corresponds to the fast extraction septa. Even though an
insufficiently collimated halo at the upstream collimators
is suspected as a source, the reason of the peak at #37 is
not yet clear.
For the maintenance and developing, staff enters the
tunnel after the beam stopped. Unless the residual
radiation is surveyed by the staff of the radiation safety
office, other staff cannot enter the tunnel. Therefore direct
radiation measurement in the tunnel is impossible just
after the beam stopped. But the method adopted here
enables us to carry out such measurement [5]. Caution
should be taken for a few pBLMs. Indicated radiations by
these are too small comparing to the practical radiation
level measured on contact and at one-foot distance from
the beam ducts, which is considered to be casued by
radiation shielding effect due to magnet cores and under
investigation [6].
Figure 4: Residual radiation measured with the pBLM.
Figure 5: Residual radiation measured with the pBLM.
The MR is divided into three parts. The abscissa is the
pBLM number (address #), which is almost proportional
to the beam path length along the ring.
FIT OF THE DECAY CURVE
Continuous decay curves of the pBLMs signals at the
MR collimator section (#6, #7, #8, #9, #10) are depicted
in Fig. 6. The data were taken after Dec. 22, 2014 in
which the winter machine shutdown began. The abscissa
is the time (hour) after the beam stopped. The ordinate is
the residual radiation (µSv/h) normalized the pBLM
signal counts by the dose at #6 and #7 pBLMs measured
with a calibrated dosimeter [7]. Gain variation of pBLMs
is not corrected here.
Approximating the residual radiation decay by three
components of radioactive nuclides as
N(t) = c1 e−t /τ1+ c2 e
−t /τ 2+ c3 e−t /τ3 , (1)
the data in Fig. 6 are fitted. The results are also shown
with black curves in Fig. 6 and their parameters are
tabulated in Table 1.
WEPOR021 Proceedings of IPAC2016, Busan, Korea
ISBN 978-3-95450-147-2
2716Cop
yrig
ht©
2016
CC
-BY-
3.0
and
byth
ere
spec
tive
auth
ors
06 Beam Instrumentation, Controls, Feedback and Operational Aspects
T18 Radiation Monitoring and Safety
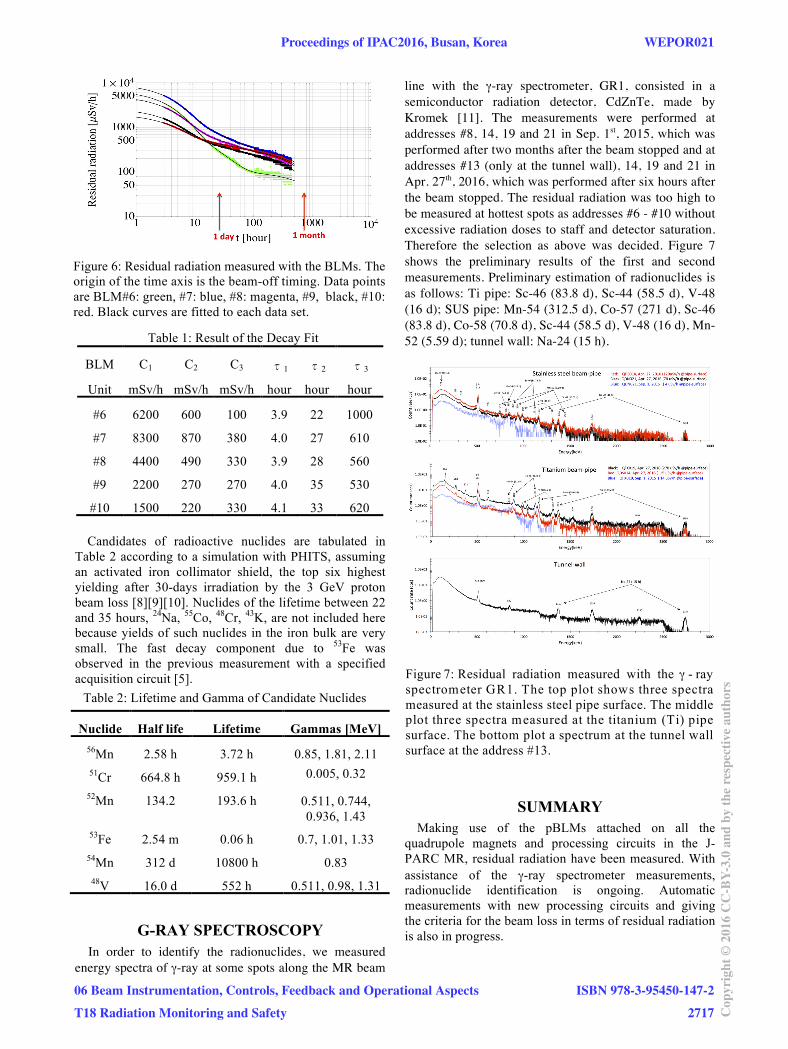
Figure 6: Residual radiation measured with the BLMs. The
origin of the time axis is the beam-off timing. Data points
are BLM#6: green, #7: blue, #8: magenta, #9, black, #10:
red. Black curves are fitted to each data set.
Table 1: Result of the Decay Fit
BLM C1 C2 C3 τ1 τ2 τ3
Unit mSv/h mSv/h mSv/h hour hour hour
#6 6200 600 100 3.9 22 1000
#7 8300 870 380 4.0 27 610
#8 4400 490 330 3.9 28 560
#9 2200 270 270 4.0 35 530
#10 1500 220 330 4.1 33 620
Candidates of radioactive nuclides are tabulated in
Table 2 according to a simulation with PHITS, assuming
an activated iron collimator shield, the top six highest
yielding after 30-days irradiation by the 3 GeV proton
beam loss [8][9][10]. Nuclides of the lifetime between 22
and 35 hours, 24
Na, 55
Co, 48
Cr, 43
K, are not included here
because yields of such nuclides in the iron bulk are very
small. The fast decay component due to 53
Fe was
observed in the previous measurement with a specified
acquisition circuit [5].
Table 2: Lifetime and Gamma of Candidate Nuclides
Nuclide Half life Lifetime Gammas [MeV]
56Mn 2.58 h 3.72 h 0.85, 1.81, 2.11
51Cr 664.8 h 959.1 h 0.005, 0.32
52Mn 134.2 193.6 h 0.511, 0.744,
0.936, 1.43
53Fe 2.54 m 0.06 h 0.7, 1.01, 1.33
54Mn
312 d 10800 h 0.83
48V
16.0 d 552 h 0.511, 0.98, 1.31
G-RAY SPECTROSCOPY
In order to identify the radionuclides, we measured
energy spectra of γ-ray at some spots along the MR beam
line with the γ-ray spectrometer, GR1, consisted in a
semiconductor radiation detector, CdZnTe, made by
Kromek [11]. The measurements were performed at
addresses #8, 14, 19 and 21 in Sep. 1st, 2015, which was
performed after two months after the beam stopped and at
addresses #13 (only at the tunnel wall), 14, 19 and 21 in
Apr. 27th, 2016, which was performed after six hours after
the beam stopped. The residual radiation was too high to
be measured at hottest spots as addresses #6 - #10 without
excessive radiation doses to staff and detector saturation.
Therefore the selection as above was decided. Figure 7
shows the preliminary results of the first and second
measurements. Preliminary estimation of radionuclides is
as follows: Ti pipe: Sc-46 (83.8 d), Sc-44 (58.5 d), V-48
(16 d); SUS pipe: Mn-54 (312.5 d), Co-57 (271 d), Sc-46
(83.8 d), Co-58 (70.8 d), Sc-44 (58.5 d), V-48 (16 d), Mn-
52 (5.59 d); tunnel wall: Na-24 (15 h).
Figure 7: Residual radiation measured with the γ - ray
spectrometer GR1. The top plot shows three spectra
measured at the stainless steel pipe surface. The middle
plot three spectra measured at the titanium (Ti) pipe
surface. The bottom plot a spectrum at the tunnel wall
surface at the address #13.
SUMMARY
Making use of the pBLMs attached on all the
quadrupole magnets and processing circuits in the J-
PARC MR, residual radiation have been measured. With
assistance of the γ-ray spectrometer measurements,
radionuclide identification is ongoing. Automatic
measurements with new processing circuits and giving
the criteria for the beam loss in terms of residual radiation
is also in progress.
Proceedings of IPAC2016, Busan, Korea WEPOR021
06 Beam Instrumentation, Controls, Feedback and Operational Aspects
T18 Radiation Monitoring and Safety
ISBN 978-3-95450-147-2
2717 Cop
yrig
ht©
2016
CC
-BY-
3.0
and
byth
ere
spec
tive
auth
ors

REFERENCES
[1] H.Nakagawa, S. Shibata, S.Hiramatsu, K.Uchino and
T.Takashima, NIM174(1980)401-409.
[2] K.Satou and T.Toyama, Proc. of 8th Ann. Meeting of
PASJ (2011) 424.
[3] T.Toyama, S.Lee, K.Sato, A.Akiyama, Y.Hashimoto,
H.Nakagawa, J.Odagiri, T.Suzuki, M.Tejima,
N.Yamamoto, N. Hayashi, and K. Yamamoto, proc.
of HB2008, p.450.
[4] http://www-cont.j-
parc.jp/mediawiki/index.php/Timing
[5] K. Satou and T. Toyama, Proceedings of IPAC2012,
New Orleans, Louisiana, USA , p.837.
[6] B. Y-Rendon, T.Toyama, H.Kuboki, Y.Sato, M.Uota,
and M.Shirakata, in these proceedings.
[7] CAMBERRA RADIAGEM2000.
[8] K.Satou, Y.Sato, M.Uota, M.Shirakata and M.Yoshii,
Proc. of 10th Ann. Meeting of PASJ (2013) 688.
[9] K.Satou, Y.Sato, M.Uota, M.Shirakata and M.Yoshii,
Proc. of 2nd Intern. Symp. on Sci. at J-PARC 2014.
[10] M.Shirakata, private communication, Dec. 2014.
[11] Kromek Group plc, NETPark, Thomas Wright Way,
Sedgefield, Country Durham TS21 3FD UK,
http://www.kromek.com/index.php/products/
WEPOR021 Proceedings of IPAC2016, Busan, Korea
ISBN 978-3-95450-147-2
2718Cop
yrig
ht©
2016
CC
-BY-
3.0
and
byth
ere
spec
tive
auth
ors
06 Beam Instrumentation, Controls, Feedback and Operational Aspects
T18 Radiation Monitoring and Safety


