
PROFILE INFORMATION
2016-17
Haviland – USD #474
School Finance Kansas State Department of Education Landon State Office Building 900 SW Jackson Street, Suite 356 Topeka, Kansas 66612-1212 www.ksde.org

i
• Budget General Information (characteristics of district)
• Supplemental Information for Tables in Summary of Expenditures
• KSDE Website Information Available
• Summary of Expenditures (Sumexpen.xlsx)

1
2016-17 Budget General Information USD #474:
Introduction The students of USD 474 Haviland Schools are provided a high quality, well-balanced educational experience. Providing this quality educational experience has always been a priority for the community of Haviland. The board has selected: Quality Education, A Community Tradition, for their brand. Traditional instruction, rightly balanced with progressive instructional practice infused with technology, is the standard in our school. We feel this gives our students the skills which are potentially needed for success in life as well as increase their career readiness. The community support is evidenced by the participation of parents and patrons at all school activities and functions. The overall success of the Haviland school district can be measured by the consistently above average scores on state and national tests as well as the success our students find in their post school experience. The district has successfully worked cooperatively with Kiowa County High School to offer the 9-12 students a quality high school learning opportunity.
Board Members Diane Thompson, President 602 N. Topeka, Haviland, KS Jean Jones 414 E. Poplar, Haviland, KS Rosie Troyer 405 N. Main, Haviland, KS Lori Larsh 706 N. Main, Haviland, KS Aaron Stokes 605 E Chestnut, Haviland, KS Brady Thompson 21169 45th Ave, Haviland, KS Adam Weseloh 602 E Chestnut, Haviland, KS
Key Staff Superintendent: Dr. Glen Davis Principal: Mark Clodfelter Treasurer/Superintendent’s Secretary: June Hickey Clerk of the Board/Accounts Payable: Ronda Brown Grade School Secretary: Megan Shanley
The District’s Accomplishments and Challenges Accomplishments: Accomplishments: Haviland Schools prepares each student to be confident and successful in life. USD 474 continues to score above average in all areas of state testing. Haviland Grade School continues to receive numerous academic awards of excellence. Among these is our recognition as a “Governors Achievement” award winner for three years in a row. Challenges: The loss of state funding with the block grant is a concern for the district as well as the loss of weightings that support the education of students that cost more to educate. We are also finding it challenging to hire quality staff.

2
Supplemental Information for the Following Tables 1. Summary of Total Expenditures by Function (All Funds) 2. Summary of General Fund Expenditures by Function 3. Summary of Supplemental General Fund Expenditures by Function 4. Summary of General and Supplemental General Fund Expenditures by Function 5. Summary of Special Education Fund by Function 6. Instruction Expenditures (1000) 7. Student Support Expenditures (2100)
8. Instructional Support Expenditures (2200) 9. General Administration Expenditures (2300) 10. School Administration Expenditures (2400)
11. Central Services Expenditures (2500) 12. Operations and Maintenance Expenditures (2600)
13. Transportation Expenditures (2700) 14. Other Support Services Expenditures (2900)
15. Food Service Expenditures (3100)
16. Community Services Operations (3300) 17. Capital Improvements (4000) 18. Debt Services (5100)
19. Miscellaneous Information – Transfers (5200) 20. Miscellaneous Information Unencumbered Cash Balance by Fund 21. Reserve Funds Unencumbered Cash Balance 22. Other Information – Enrollment Information 23. Miscellaneous Information Mill Rates by Fund 24. Other Information – Assessed Valuation and Bonded Indebtedness

3
Note: The FTE (full time equivalency) used in this report to calculate the “Amount Per Pupil” is defined as follows: Enrollment (FTE) includes the current year enrollment on September 20, February 20, 4 yr old at-risk, and virtual. It does not include non-funded preschool or full-day kindergarten not on an IEP. KSDE Website Information Available K-12 Statistics (Building, District or State Totals) website below: http://svapp15586.ksde.org/k12/k12.aspx
• Attendance / Enrollment Reports • Staff Reports • Graduates / Dropouts Reports • Crime / Violence Reports
School Finance Reports and Publications website below: http://www.ksde.org/Agency/Fiscal-and-Administrative-Services/School-Finance/Reports-and-Publications
• Assessed Valuation • Cash Balances • Headcount Enrollment • Mill Levies • Personnel (Certified/Non-Certified) • Salary Reports
Kansas Building Report Card website below: http://ksreportcard.ksde.org/
• Attendance Rate • Graduation Rate • Dropout Rate • School Violence • Assessments
o Reading o Mathematics o Writing
• Graduates Passing Adv. Science Courses • Graduates Passing Adv. Math Courses
USD# 474
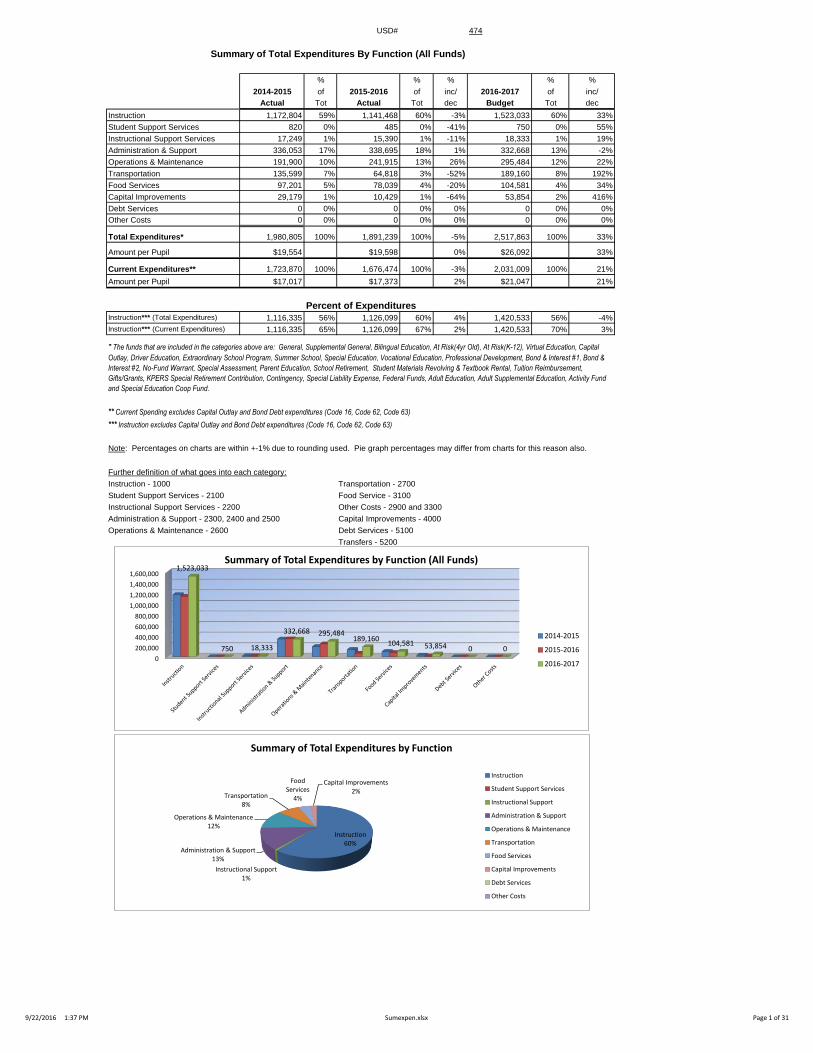
Summary of Total Expenditures By Function (All Funds)
% % % % %2014-2015 of 2015-2016 of inc/ 2016-2017 of inc/
Actual Tot Actual Tot dec Budget Tot decInstruction 1,172,804 59% 1,141,468 60% -3% 1,523,033 60% 33%Student Support Services 820 0% 485 0% -41% 750 0% 55%Instructional Support Services 17,249 1% 15,390 1% -11% 18,333 1% 19%Administration & Support 336,053 17% 338,695 18% 1% 332,668 13% -2%Operations & Maintenance 191,900 10% 241,915 13% 26% 295,484 12% 22%Transportation 135,599 7% 64,818 3% -52% 189,160 8% 192%Food Services 97,201 5% 78,039 4% -20% 104,581 4% 34%Capital Improvements 29,179 1% 10,429 1% -64% 53,854 2% 416%Debt Services 0 0% 0 0% 0% 0 0% 0%Other Costs 0 0% 0 0% 0% 0 0% 0%
Total Expenditures* 1,980,805 100% 1,891,239 100% -5% 2,517,863 100% 33%
Amount per Pupil $19,554 $19,598 0% $26,092 33%
Current Expenditures** 1,723,870 100% 1,676,474 100% -3% 2,031,009 100% 21%Amount per Pupil $17,017 $17,373 2% $21,047 21%
Instruction*** (Total Expenditures) 1,116,335 56% 1,126,099 60% 4% 1,420,533 56% -4%Instruction*** (Current Expenditures) 1,116,335 65% 1,126,099 67% 2% 1,420,533 70% 3%
Note: Percentages on charts are within +-1% due to rounding used. Pie graph percentages may differ from charts for this reason also.
Further definition of what goes into each category:Instruction - 1000 Transportation - 2700Student Support Services - 2100 Food Service - 3100Instructional Support Services - 2200 Other Costs - 2900 and 3300Administration & Support - 2300, 2400 and 2500 Capital Improvements - 4000Operations & Maintenance - 2600 Debt Services - 5100
Transfers - 5200
Percent of Expenditures
* The funds that are included in the categories above are: General, Supplemental General, Bilingual Education, At Risk(4yr Old), At Risk(K-12), Virtual Education, Capital
Outlay, Driver Education, Extraordinary School Program, Summer School, Special Education, Vocational Education, Professional Development, Bond & Interest #1, Bond &
Interest #2, No-Fund Warrant, Special Assessment, Parent Education, School Retirement, Student Materials Revolving & Textbook Rental, Tuition Reimbursement,
Gifts/Grants, KPERS Special Retirement Contribution, Contingency, Special Liability Expense, Federal Funds, Adult Education, Adult Supplemental Education, Activity Fund
and Special Education Coop Fund.
*** Instruction excludes Capital Outlay and Bond Debt expenditures (Code 16, Code 62, Code 63)
** Current Spending excludes Capital Outlay and Bond Debt expenditures (Code 16, Code 62, Code 63)
0
200,000
400,000
600,000
800,000
1,000,000
1,200,000
1,400,000
1,600,0001,523,033
750 18,333
332,668 295,484189,160
104,581 53,854 0 0
Summary of Total Expenditures by Function (All Funds)
2014-2015
2015-2016
2016-2017
Instruction60%
Instructional Support1%
Administration & Support13%
Operations & Maintenance12%
Transportation8%
Food Services
4%
Capital Improvements2%
Summary of Total Expenditures by Function
Instruction
Student Support Services
Instructional Support
Administration & Support
Operations & Maintenance
Transportation
Food Services
Capital Improvements
Debt Services
Other Costs
9/22/2016 1:37 PM Sumexpen.xlsx Page 1 of 31

USD# 474
Summary of General Fund Expendituresby Function
% % % % %2014-2015 of 2015-2016 of inc/ 2016-2017 of inc/
Actual Tot Actual Tot dec Budget Tot dec
Instruction 584,300 57% 534,951 55% -8% 520,142 55% -3%
Student Support 570 0% 235 0% -59% 500 0% 113%
Instructional Support 13,475 1% 13,456 1% 0% 14,115 1% 5%
Administration & Support 313,812 30% 317,703 33% 1% 293,550 31% -8%
Operations & Maintenance 64,756 6% 59,787 6% -8% 71,500 7% 20%
Transportation 56,473 5% 44,384 5% -21% 54,300 6% 22%
Capital Improvements 0 0% 0 0% 0% 0 0% 0%
Other Costs 0 0% 0 0% 0% 0 0% 0%
Total Expenditures 1,033,386 100% 970,516 100% -6% 954,107 100% -2%
Amount per Pupil $10,201 $10,057 -1% $9,887 -2%
The Summary of General Fund Expenditures chart information comes from pages 6-13 and only uses the 'General Fund' line items.
0
100,000
200,000
300,000
400,000
500,000
600,000
Instruction StudentSupport
InstructionalSupport
Administration& Support
Operations &Maintenance
Transportation CapitalImprovements
Other Costs
520,142
50014,115
293,550
71,50054,300
0 0
Summary of General Fund Expenditures
2014-2015
2015-2016
2016-2017
Instruction55%
Instructional Support1%
Administration & Support
31%
Operations & Maintenance7%
Transportation6%
Summary of General Fund Expenditures by Function
Instruction
Student Support
Instructional Support
Administration & Support
Operations & Maintenance
Transportation
Capital Improvements
Other Costs
9/22/2016 1:37 PM Sumexpen.xlsx Page 2 of 31

USD# 474
Summary of Supplemental General Fund Expendituresby Function
% % % % %2014-2015 of 2015-2016 of inc/ 2016-2017 of inc/
Actual Tot Actual Tot dec Budget Tot dec
Instruction 107,375 76% 107,286 97% 0% 109,415 96% 2%
Student Support 250 0% 250 0% 0% 250 0% 0%
Instructional Support 115 0% 0 0% -100% 0 0% 0%
Administration & Support 3,453 2% 3,271 3% -5% 3,500 3% 7%
Operations & Maintenance 29,824 21% 289 0% -99% 250 0% -13%
Transportation 0 0% 0 0% 0% 0 0% 0%
Capital Improvements 0 0% 0 0% 0% 0 0% 0%
Other Costs 0 0% 0 0% 0% 0 0% 0%
Total Expenditures 141,017 100% 111,096 100% -21% 113,415 100% 2%
Amount per Pupil $1,392 $1,151 -17% $1,175 2%
The Summary of Supplemental General Fund Expenditures chart information comes from pages 6-13 and only uses the 'Supplemental
General Fund' line items.
0
20,000
40,000
60,000
80,000
100,000
120,000
Instruction StudentSupport
InstructionalSupport
Administration& Support
Operations &Maintenance
Transportation CapitalImprovements
Other Costs
109,415
250 03,500
250 0 0 0
Summary of Supplemental General Expenditures by Function
2014-2015
2015-2016
2016-2017
Instruction97%
Administration & Support3%
Summary of Supplemental General Fund Expenditures by Function
Instruction
Student Support
Instructional Support
Administration & Support
Operations & Maintenance
Transportation
Capital Improvements
Other Costs
9/22/2016 1:37 PM Sumexpen.xlsx Page 3 of 31

USD# 474Summary of General and Supplemental General Fund
Expenditures by Function
% % % % %2014-2015 of 2015-2016 of inc/ 2016-2017 of inc/
Actual Tot Actual Tot dec Budget Tot dec
Instruction 691,675 59% 642,237 59% -7% 629,557 59% -2%
Student Support 820 0% 485 0% -41% 750 0% 55%
Instructional Support 13,590 1% 13,456 1% -1% 14,115 1% 5%
Administration & Support 317,265 27% 320,974 30% 1% 297,050 28% -7%
Operations & Maintenance 94,580 8% 60,076 6% -36% 71,750 7% 19%
Transportation 56,473 5% 44,384 4% -21% 54,300 5% 22%
Capital Improvements 0 0% 0 0% 0% 0 0% 0%
Other Costs 0 0% 0 0% 0% 0 0% 0%
Total Expenditures 1,174,403 100% 1,081,612 100% -8% 1,067,522 100% -1%
Amount per Pupil $11,593 $11,208 -3% $11,062 -1%
The Summary of General and Supplemental General Fund Expenditures chart information comes from pages 6-13 of the Sumexpen
and adds together the 'General Fund' and 'Supplemental General Fund' line items.
0
100,000
200,000
300,000
400,000
500,000
600,000
700,000
Instruction StudentSupport
InstructionalSupport
Administration& Support
Operations &Maintenance
Transportation CapitalImprovements
Other Costs
69
1,6
75
82
0
13
,59
0
31
7,2
65
94
,58
0
56
,47
3
0 0
64
2,2
37
48
5
13
,45
6
32
0,9
74
60
,07
6
44
,38
4
0 0
62
9,5
57
75
0
14
,11
5
29
7,0
50
71
,75
0
54
,30
0
0 0
Summary of General and Supplemental General FundExpenditures by Function
2014-2015
2015-2016
2016-2017
Instruction59%
Instructional Support1%
Administration & Support
28%
Operations & Maintenance7%
Transportation5%
Summary of General and Supplemental General Fund Expenditures by Function
Instruction
Student Support
Instructional Support
Administration & Support
Operations & Maintenance
Transportation
Capital Improvements
Other Costs
9/22/2016 1:37 PM Sumexpen.xlsx Page 4 of 31

USD# 474
Summary of Special Education Fundby Function
% % % % %2014-2015 of 2015-2016 of inc/ 2016-2017 of inc/
Actual Tot Actual Tot dec Budget Tot dec
Instruction 178,990 100% 186,265 96% 4% 376,297 95% 102%
Student Support 0 0% 0 0% 0% 0 0% 0%
Instructional Support 0 0% 0 0% 0% 0 0% 0%
Administraton & Support 0 0% 0 0% 0% 0 0% 0%
Operations & Maintenance 0 0% 0 0% 0% 0 0% 0%
Transportation 0 0% 8,123 4% 0% 20,000 5% 146%
Capital Improvements 0 0% 0 0% 0% 0 0% 0%
Other Costs 0 0% 0 0% 0% 0 0% 0%
Total Expenditures 178,990 100% 194,388 100% 9% 396,297 100% 104%
Amount per Pupil $1,767 $2,014 14% $4,107 104%
The Summary of Special Education Fund Expenditures chart information comes from pages 6-13 and only uses the 'Special Education Fund'
line items. (Total expenditures excludes Special Ed Coop Fund because it would include expenditures for all schools participating in the Coop.)
0
50,000
100,000
150,000
200,000
250,000
300,000
350,000
400,000
Instruction StudentSupport
InstructionalSupport
Administraton& Support
Operations &Maintenance
Transportation CapitalImprovements
Other Costs
17
8,9
90
0 0 0 0 0 0 0
18
6,2
65
0 0 0 0 8,1
23
0 0
37
6,2
97
0 0 0 0
20
,00
0
0 0
Summary of Special Education Fund Expenditures by Function
2014-2015
2015-2016
2016-2017
Instruction95%
Transportation5%
Summary of Special Education Fund by Function
Instruction
Student Support
Instructional Support
Administraton & Support
Operations & Maintenance
Transportation
Capital Improvements
Other Costs
9/22/2016 1:37 PM Sumexpen.xlsx Page 5 of 31

USD# 474Instruction Expenditures (1000)
% %2014-2015 2015-2016 inc/ 2016-2017 inc/
Actual Actual dec Budget dec
General 584,300 534,951 -8% 520,142 -3%Federal Funds 37,592 51,669 37% 47,836 -7%Supplemental General 107,375 107,286 0% 109,415 2%At Risk (4yr Old) 0 0 0% 0 0%At Risk (K-12) 158,350 203,201 28% 315,007 55%Bilingual Education 0 0 0% 0 0%Virtual Education 0 0 0% 0 0%Capital Outlay 56,469 15,369 -73% 102,500 567%Driver Education 0 0 0% 0 0%Declining Enrollment 0 0 0% 0 0%Extraordinary School Program 0 0 0% 0 0%Food Service 0 0 0% 0 0%Professional Development 0 0 0% 0 0%Parent Education Program 0 0 0% 0 0%Summer School 0 0 0% 0 0%Special Education 178,990 186,265 4% 376,297 102%Cost of Living 0 0 0% 0 0%Vocational Education 7,319 5,500 -25% 5,500 0%Gifts/Grants 0 0 0% 0 0%Special Liability 0 0 0% 0 0%School Retirement 0 0 0% 0 0%Extraordinary Growth Facilities 0 0 0% 0 0%Special Reserve 0 0 0%KPERS Spec. Ret. Contribution 40,904 30,999 -24% 46,336 49%Contingency Reserve 0 0 0%Text Book & Student Material 266 4,728 1677%Activity Fund 1,239 1,500 21%Bond and Interest #1 0 0 0% 0 0%Bond and Interest #2 0 0 0% 0 0%No-Fund Warrant 0 0 0% 0 0%Special Assessment 0 0 0% 0 0%Temporary Note 0 0 0% 0 0%
SUBTOTAL 1,172,804 1,141,468 -3% 1,523,033 33%Enrollment (FTE)* 101.3 96.5 -5% 96.5 0%Amount per Pupil 11,578 11,829 2% 15,783 33%
Adult Education 0 0 0% 0 0%Adult Supplemental Education 0 0 0% 0 0%Tuition Reimbursement 0 0 0% 0 0%Special Education Coop 0 0 0% 0 0%TOTAL 1,172,804 1,141,468 -3% 1,523,033 33%
NOTE: Gifts/Grants includes private grants and grants from nonfederal sources.
Amount per pupil excludes the following funds: Adult Education, Adult Supplemental Education, Special Education Coopand Tuition Reimbursement.
* Enrollment (FTE) includes the current year enrollment on September 20, February 20, 4 yr old at-risk, and virtual. It does not include non-funded preschool or full-day kindergarten not on an IEP.
0
100,000
200,000
300,000
400,000
500,000
600,000
2014-2015 2015-2016 2016-2017
584,300534,951 520,142
107,375 107,286 109,415178,990 186,265
376,297
Instruction Expenditures
GeneralSupplemental GeneralSpecial Education
0
200,000
400,000
600,000
800,000
1,000,000
1,200,000
1,400,000
1,600,000
2014-2015 2015-2016 2016-2017
1,172,804 1,141,468
1,523,033
Instruction Expenditures
9/22/2016 1:37 PM Sumexpen.xlsx Page 6 of 31

USD# 474
Student Support Expenditures (2100)
% %2014-2015 2015-2016 inc/ 2016-2017 inc/
Actual Actual dec Budget dec
General 570 235 -59% 500 113%Federal Funds 0 0 0% 0 0%Supplemental General 250 250 0% 250 0%At Risk (4yr Old) 0 0 0% 0 0%At Risk (K-12) 0 0 0% 0 0%Bilingual Education 0 0 0% 0 0%Virtual Education 0 0 0% 0 0%Capital Outlay 0 0 0% 0 0%Driver Training 0 0 0% 0 0%Declining Enrollment 0 0 0% 0 0%Extraordinary School Program 0 0 0% 0 0%Food Service 0 0 0% 0 0%Professional Development 0 0 0% 0 0%Parent Education Program 0 0 0% 0 0%Summer School 0 0 0% 0 0%Special Education 0 0 0% 0 0%Cost of Living 0 0 0% 0 0%Vocational Education 0 0 0% 0 0%Gifts/Grants 0 0 0% 0 0%Special Liability 0 0 0% 0 0%School Retirement 0 0 0% 0 0%Extraordinary Growth Facilities 0 0 0% 0 0%Special Reserve 0 0 0%KPERS Spec. Ret. Contribution 0 0 0% 0 0%Contingency Reserve 0 0 0%Text Book & Student Material 0 0 0%Activity Fund 0 0 0%Bond and Interest #1 0 0 0% 0 0%Bond and Interest #2 0 0 0% 0 0%No-Fund Warrant 0 0 0% 0 0%Special Assessment 0 0 0% 0 0%Temporary Note 0 0 0% 0 0%
SUBTOTAL 820 485 -41% 750 55%Enrollment (FTE)* 101.3 96.5 -5% 96.5 0%Amount per Pupil 8 5 -38% 8 55%
Adult Education 0 0 0% 0 0%Adult Supplemental Education 0 0 0% 0 0%Tuition Reimbursement 0 0 0% 0 0%Special Education Coop 0 0 0% 0 0%TOTAL 820 485 -41% 750 55%
NOTE: Gifts/Grants includes private grants and grants from nonfederal sources.
Amount per pupil excludes the following funds: Adult Education, Adult Supplemental Education, Special Education Coopand Tuition Reimbursement.
* Enrollment (FTE) includes the current year enrollment on September 20, February 20, 4 yr old at-risk, and virtual. It does not include non-funded preschool or full-day kindergarten not on an IEP.
0
100
200
300
400
500
600
700
800
900
2014-2015 2015-2016 2016-2017
820
485
750
Student Support Expenditures
9/22/2016 1:37 PM Sumexpen.xlsx Page 7 of 31

USD# 474
Instructional Support Expenditures (2200)
% %2014-2015 2015-2016 inc/ 2016-2017 inc/
Actual Actual dec Budget dec
General 13,475 13,456 0% 14,115 5%Federal Funds 0 0 0% 0 0%Supplemental General 115 0 -100% 0 0%At Risk (4yr Old) 0 0 0% 0 0%At Risk (K-12) 0 0 0% 0 0%Bilingual Education 0 0 0% 0 0%Virtual Education 0 0 0% 0 0%Capital Outlay 0 0 0% 0 0%Driver Training 0 0 0% 0 0%Declining Enrollment 0 0 0% 0 0%Extraordinary School Program 0 0 0% 0 0%Food Service 0 0 0% 0 0%Professional Development 3,153 1,934 -39% 2,585 34%Parent Education Program 0 0 0% 0 0%Summer School 0 0 0% 0 0%Special Education 0 0 0% 0 0%Cost of Living 0 0 0% 0 0%Vocational Education 0 0 0% 0 0%Gifts/Grants 0 0 0% 0 0%Special Liability 0 0 0% 0 0%School Retirement 0 0 0% 0 0%Extraordinary Growth Facilities 0 0 0% 0 0%Special Reserve 0 0 0%KPERS Spec. Ret. Contribution 506 0 -100% 1,633 0%Contingency Reserve 0 0 0%Text Book & Student Material 0 0 0%Activity Fund 0 0 0%Bond and Interest #1 0 0 0% 0 0%Bond and Interest #2 0 0 0% 0 0%No-Fund Warrant 0 0 0% 0 0%Special Assessment 0 0 0% 0 0%Temporary Note 0 0 0% 0 0%
SUBTOTAL 17,249 15,390 -11% 18,333 19%Enrollment (FTE)* 101.3 96.5 -5% 96.5 0%Amount per Pupil 170 159 -6% 190 19%
Adult Education 0 0 0% 0 0%Adult Supplemental Education 0 0 0% 0 0%Tuition Reimbursement 0 0 0% 0 0%Special Education Coop 0 0 0% 0 0%TOTAL 17,249 15,390 -11% 18,333 19%
NOTE: Gifts/Grants includes private grants and grants from nonfederal sources.
Amount per pupil excludes the following funds: Adult Education, Adult Supplemental Education, Special Education Coopand Tuition Reimbursement.
* Enrollment (FTE) includes the current year enrollment on September 20, February 20, 4 yr old at-risk, and virtual. It does not include non-funded preschool or full-day kindergarten not on an IEP.
13,500
14,000
14,500
15,000
15,500
16,000
16,500
17,000
17,500
18,000
18,500
2014-2015 2015-2016 2016-2017
17,249
15,390
18,333
Instructional Support Expenditures
9/22/2016 1:37 PM Sumexpen.xlsx Page 8 of 31

USD# 474
General Administration Expenditures (2300)
% %2014-2015 2015-2016 inc/ 2016-2017 inc/
Actual Actual dec Budget dec
General 201,155 211,374 5% 193,500 -8%Federal Funds 0 0 0% 0 0%Supplemental General 3,453 3,271 -5% 3,500 7%At Risk (4yr Old) 0 0 0% 0 0%At Risk (K-12) 0 0 0% 0 0%Bilingual Education 0 0 0% 0 0%Virtual Education 0 0 0% 0 0%Capital Outlay 2,990 3,893 30% 4,000 3%Driver Training 0 0 0% 0 0%Declining Enrollment 0 0 0% 0 0%Extraordinary School Program 0 0 0% 0 0%Food Service 0 0 0% 0 0%Professional Development 0 0 0% 0 0%Parent Education Program 0 0 0% 0 0%Summer School 0 0 0% 0 0%Special Education 0 0 0% 0 0%Cost of Living 0 0 0% 0 0%Vocational Education 0 0 0% 0 0%Gifts/Grants 0 0 0% 0 0%Special Liability Expense 0 0 0% 0 0%School Retirement 0 0 0% 0 0%Extraordinary Growth Facilities 0 0 0% 0 0%Special Reserve 0 0 0%KPERS Spec. Ret. Contribution 6,871 4,895 -29% 11,709 139%Contingency Reserve 0 0 0%Text Book & Student Material 0 0 0%Activity Fund 0 0 0%Bond and Interest #1 0 0 0% 0 0%Bond and Interest #2 0 0 0% 0 0%No-Fund Warrant 0 0 0% 0 0%Special Assessment 0 0 0% 0 0%Temporary Note 0 0 0% 0 0%
SUBTOTAL 214,469 223,433 4% 212,709 -5%Enrollment (FTE)* 101.3 96.5 -5% 96.5 0%Amount per Pupil 2,117 2,315 9% 2,204 -5%
Adult Education 0 0 0% 0 0%Adult Supplemental Education 0 0 0% 0 0%Tuition Reimbursement 0 0 0% 0 0%Special Education Coop 0 0 0% 0 0%TOTAL 214,469 223,433 4% 212,709 -5%
NOTE: Gifts/Grants includes private grants and grants from nonfederal sources.
Amount per pupil excludes the following funds: Adult Education, Adult Supplemental Education, Special Education Coopand Tuition Reimbursement.
* Enrollment (FTE) includes the current year enrollment on September 20, February 20, 4 yr old at-risk, and virtual. It does not include non-funded preschool or full-day kindergarten not on an IEP.
206,000
208,000
210,000
212,000
214,000
216,000
218,000
220,000
222,000
224,000
2014-2015 2015-2016 2016-2017
214,469
223,433
212,709
General Administration Expenditures
9/22/2016 1:37 PM Sumexpen.xlsx Page 9 of 31

USD# 474
School Administration Expenditures (2400)
% %2014-2015 2015-2016 inc/ 2016-2017 inc/
Actual Actual dec Budget dec
General 112,657 106,329 -6% 100,050 -6%Federal Funds 0 0 0% 0 0%Supplemental General 0 0 0% 0 0%At Risk (4yr Old) 0 0 0% 0 0%At Risk (K-12) 0 0 0% 0 0%Bilingual Education 0 0 0% 0 0%Virtual Education 0 0 0% 0 0%Capital Outlay 751 0 -100% 0 0%Driver Training 0 0 0% 0 0%Declining Enrollment 0 0 0% 0 0%Extraordinary School Program 0 0 0% 0 0%Food Service 0 0 0% 0 0%Professional Development 0 0 0% 0 0%Parent Education Program 0 0 0% 0 0%Summer School 0 0 0% 0 0%Special Education 0 0 0% 0 0%Cost of Living 0 0 0% 0 0%Vocational Education 0 0 0% 0 0%Gifts/Grants 0 0 0% 0 0%Special Liability Expense 0 0 0% 0 0%School Retirement 0 0 0% 0 0%Extraordinary Growth Facilities 0 0 0% 0 0%Special Reserve 0 0 0%KPERS Spec. Ret. Contribution 5,538 6,526 18% 8,903 36%Contingency Reserve 0 0 0%Text Book & Student Material 0 0 0%Activity Fund 0 0 0%Bond and Interest #1 0 0 0% 0 0%Bond and Interest #2 0 0 0% 0 0%No-Fund Warrant 0 0 0% 0 0%Special Assessment 0 0 0% 0 0%Temporary Note 0 0 0% 0 0%
SUBTOTAL 118,946 112,855 -5% 108,953 -3%Enrollment (FTE)* 101.3 96.5 -5% 96.5 0%Amount per Pupil 1,174 1,169 0% 1,129 -3%
Adult Education 0 0 0% 0 0%Adult Supplemental Education 0 0 0% 0 0%Tuition Reimbursement 0 0 0% 0 0%Special Education Coop 0 0 0% 0 0%TOTAL 118,946 112,855 -5% 108,953 -3%
NOTE: Gifts/Grants includes private grants and grants from nonfederal sources.
Amount per pupil excludes the following funds: Adult Education, Adult Supplemental Education, Special Education Coopand Tuition Reimbursement.
* Enrollment (FTE) includes the current year enrollment on September 20, February 20, 4 yr old at-risk, and virtual. It does not include non-funded preschool or full-day kindergarten not on an IEP.
102,000
104,000
106,000
108,000
110,000
112,000
114,000
116,000
118,000
120,000
2014-2015 2015-2016 2016-2017
118,946
112,855
108,953
School Administration Expenditures
9/22/2016 1:37 PM Sumexpen.xlsx Page 10 of 31

USD# 474
Central Services Expenditures (2500)
% %2014-2015 2015-2016 inc/ 2016-2017 inc/
Actual Actual dec Budget dec
General 0 0 0% 0 0%Federal Funds 0 0 0% 0 0%Supplemental General 0 0 0% 0 0%At Risk (4yr Old) 0 0 0% 0 0%At Risk (K-12) 0 0 0% 0 0%Bilingual Education 0 0 0% 0 0%Virtual Education 0 0 0% 0 0%Capital Outlay 0 0 0% 0 0%Driver Training 0 0 0% 0 0%Declining Enrollment 0 0 0% 0 0%Extraordinary School Program 0 0 0% 0 0%Food Service 0 0 0% 0 0%Professional Development 2,638 2,407 -9% 11,006 357%Parent Education Program 0 0 0% 0 0%Summer School 0 0 0% 0 0%Special Education 0 0 0% 0 0%Cost of Living 0 0 0% 0 0%Vocational Education 0 0 0% 0 0%Gifts/Grants 0 0 0% 0 0%Special Liability 0 0 0% 0 0%School Retirement 0 0 0% 0 0%Extraordinary Growth Facilities 0 0 0% 0 0%Special Reserve 0 0 0%KPERS Spec. Ret. Contribution 0 0 0% 0 0%Contingency Reserve 0 0 0%Text Book & Student Material 0 0 0%Activity Fund 0 0 0%Bond & Interest #1 0 0 0% 0 0%Bond & Interest #2 0 0 0% 0 0%No-Fund Warrant 0 0 0% 0 0%Special Assessment 0 0 0% 0 0%Temporary Note 0 0 0% 0 0%
SUBTOTAL 2,638 2,407 -9% 11,006 357%Enrollment (FTE)* 101.3 96.5 -5% 96.5 0%Amount per Pupil 26 25 -4% 114 357%
Adult Education 0 0 0% 0 0%Adult Supplemental Education 0 0 0% 0 0%Tuition Reimbursement 0 0 0% 0 0%Special Education Coop 0 0 0% 0 0%TOTAL 2,638 2,407 -9% 11,006 357%
NOTE: Gifts/Grants includes private grants and grants from nonfederal sources.
Amount per pupil excludes the following funds: Adult Education, Adult Supplemental Education, Special Education Coopand Tuition Reimbursement.
* Enrollment (FTE) includes the current year enrollment on September 20, February 20, 4 yr old at-risk, and virtual. It does not include non-funded preschool or full-day kindergarten not on an IEP.
0
2,000
4,000
6,000
8,000
10,000
12,000
2014-2015 2015-2016 2016-2017
2,638 2,407
11,006
Central Services Expenditures
9/22/2016 1:37 PM Sumexpen.xlsx Page 11 of 31

USD# 474
Operations and Maintenance Expenditures (2600)
% %2014-2015 2015-2016 inc/ 2016-2017 inc/
Actual Actual dec Budget dec
General 64,756 59,787 -8% 71,500 20%Federal Funds 0 0 0% 0 0%Supplemental General 29,824 289 -99% 250 -13%At Risk (4yr Old) 0 0 0% 0 0%At Risk (K-12) 0 0 0% 0 0%Bilingual Education 0 0 0% 0 0%Virtual Education 0 0 0% 0 0%Capital Outlay 91,422 175,482 92% 216,500 23%Driver Training 0 0 0% 0 0%Declining Enrollment 0 0 0% 0 0%Extraordinary School Program 0 0 0% 0 0%Food Service 0 375 0% 0 -100%Professional Development 0 0 0% 0 0%Parent Education Program 0 0 0% 0 0%Summer School 0 0 0% 0 0%Special Education 0 0 0% 0 0%Cost of Living 0 0 0% 0 0%Vocational Education 0 0 0% 0 0%Gifts/Grants 0 0 0% 0 0%Special Liability 0 0 0% 0 0%School Retirement 0 0 0% 0 0%Extraordinary Growth Facilities 0 0 0% 0 0%Special Reserve 0 0 0%KPERS Spec. Ret. Contribution 5,898 5,982 1% 7,234 21%Contingency Reserve 0 0 0%Text Book & Student Material 0 0 0%Activity Fund 0 0 0%Bond and Interest #1 0 0 0% 0 0%Bond and Interest #2 0 0 0% 0 0%No-Fund Warrant 0 0 0% 0 0%Special Assessment 0 0 0% 0 0%Temporary Note 0 0 0% 0 0%
SUBTOTAL 191,900 241,915 26% 295,484 22%Enrollment (FTE)* 101.3 96.5 -5% 96.5 0%Amount per Pupil 1,894 2,507 32% 3,062 22%
Adult Education 0 0 0% 0 0%Adult Supplemental Education 0 0 0% 0 0%Tuition Reimbursement 0 0 0% 0 0%Special Education Coop 0 0 0% 0 0%TOTAL 191,900 241,915 26% 295,484 22%
NOTE: Gifts/Grants includes private grants and grants from nonfederal sources.
Amount per pupil excludes the following funds: Adult Education, Adult Supplemental Education, Special Education Coopand Tuition Reimbursement.
* Enrollment (FTE) includes the current year enrollment on September 20, February 20, 4 yr old at-risk, and virtual. It does not include non-funded preschool or full-day kindergarten not on an IEP.
0
50,000
100,000
150,000
200,000
250,000
300,000
2014-2015 2015-2016 2016-2017
191,900
241,915
295,484
Operations and Maintenance Expenditures
9/22/2016 1:37 PM Sumexpen.xlsx Page 12 of 31

USD# 474
Transportation Expenditures (2700)
% %2014-2015 2015-2016 inc/ 2016-2017 inc/
Actual Actual dec Budget dec
General 56,473 44,384 -21% 54,300 22%Federal Funds 0 0 0% 0 0%Supplemental General 0 0 0% 0 0%At Risk (4yr Old) 0 0 0% 0 0%At Risk (K-12) 0 0 0% 0 0%Bilingual Education 0 0 0% 0 0%Virtual Education 0 0 0% 0 0%Capital Outlay 76,124 9,592 -87% 110,000 1047%Driver Training 0 0 0% 0 0%Declining Enrollment 0 0 0% 0 0%Extraordinary School Program 0 0 0% 0 0%Food Service 0 0 0% 0 0%Professional Development 0 0 0% 0 0%Parent Education Program 0 0 0% 0 0%Summer School 0 0 0% 0 0%Special Education 0 8,123 0% 20,000 146%Cost of Living 0 0 0% 0 0%Vocational Education 0 0 0% 0 0%Gifts/Grants 0 0 0% 0 0%Special Liability 0 0 0% 0 0%School Retirement 0 0 0% 0 0%Extraordinary Growth Facilities 0 0 0% 0 0%Special Reserve 0 0 0%KPERS Spec. Ret. Contribution 3,002 2,719 -9% 4,860 79%Contingency Reserve 0 0 0%Text Book & Student Material 0 0 0%Activity Fund 0 0 0%Bond and Interest #1 0 0 0% 0 0%Bond and Interest #2 0 0 0% 0 0%No-Fund Warrant 0 0 0% 0 0%Special Assessment 0 0 0% 0 0%Temporary Note 0 0 0% 0 0%
SUBTOTAL 135,599 64,818 -52% 189,160 192%Enrollment (FTE)* 101.3 96.5 -5% 96.5 0%Amount per Pupil 1,339 672 -50% 1,960 192%
Adult Education 0 0 0% 0 0%Adult Supplemental Education 0 0 0% 0 0%Tuition Reimbursement 0 0 0% 0 0%Special Education Coop 0 0 0% 0 0%TOTAL 135,599 64,818 -52% 189,160 192%
NOTE: Gifts/Grants includes private grants and grants from nonfederal sources.
Amount per pupil excludes the following funds: Adult Education, Adult Supplemental Education, Special Education Coopand Tuition Reimbursement.
* Enrollment (FTE) includes the current year enrollment on September 20, February 20, 4 yr old at-risk, and virtual. It does not include non-funded preschool or full-day kindergarten not on an IEP.
0
20,000
40,000
60,000
80,000
100,000
120,000
140,000
160,000
180,000
200,000
2014-2015 2015-2016 2016-2017
135,599
64,818
189,160
Transportation Expenditures
9/22/2016 1:37 PM Sumexpen.xlsx Page 13 of 31

USD# 474
Other Support Services Expenditures (2900)
% %2014-2015 2015-2016 inc/ 2016-2017 inc/
Actual Actual dec Budget dec
General 0 0 0% 0 0%Federal Funds 0 0 0% 0 0%Supplemental General 0 0 0% 0 0%At Risk (4yr Old) 0 0 0% 0 0%At Risk (K-12) 0 0 0% 0 0%Bilingual Education 0 0 0% 0 0%Virtual Education 0 0 0% 0 0%Capital Outlay 0 0 0% 0 0%Driver Training 0 0 0% 0 0%Declining Enrollment 0 0 0% 0 0%Extraordinary School Program 0 0 0% 0 0%Food Service 0 0 0% 0 0%Professional Development 0 0 0% 0 0%Parent Education Program 0 0 0% 0 0%Summer School 0 0 0% 0 0%Special Education 0 0 0% 0 0%Cost of Living 0 0 0% 0 0%Vocational Education 0 0 0% 0 0%Gifts/Grants 0 0 0% 0 0%Special Liability 0 0 0% 0 0%School Retirement 0 0 0% 0 0%Extraordinary Growth Facilities 0 0 0% 0 0%Special Reserve 0 0 0%KPERS Spec. Ret. Contribution 0 0 0% 0 0%Contingency Reserve 0 0 0%Text Book & Student Material 0 0 0%Activity Fund 0 0 0%Bond and Interest #1 0 0 0% 0 0%Bond and Interest #2 0 0 0% 0 0%No-Fund Warrant 0 0 0% 0 0%Special Assessment 0 0 0% 0 0%Temporary Note 0 0 0% 0 0%
SUBTOTAL 0 0 0% 0 0%Enrollment (FTE)* 101.3 96.5 -5% 96.5 0%Amount per Pupil 0 0 0% 0 0%
Adult Education 0 0 0% 0 0%Adult Supplemental Education 0 0 0% 0 0%Tuition Reimbursement 0 0 0% 0 0%Special Education Coop 0 0 0% 0 0%TOTAL 0 0 0% 0 0%
NOTE: Gifts/Grants includes private grants and grants from nonfederal sources.
Amount per pupil excludes the following funds: Adult Education, Adult Supplemental Education, Special Education Coopand Tuition Reimbursement.
* Enrollment (FTE) includes the current year enrollment on September 20, February 20, 4 yr old at-risk, and virtual. It does not include non-funded preschool or full-day kindergarten not on an IEP.
0
0
0
0
0
1
1
1
1
1
1
2014-2015 2015-2016 2016-2017
0 0 0
Other Support Services Expenditures
9/22/2016 1:37 PM Sumexpen.xlsx Page 14 of 31

USD# 474
Food Services Expenditures (3100)
% %2014-2015 2015-2016 inc/ 2016-2017 inc/
Actual Actual dec Budget dec
General 0 0 0% 0 0%Federal Funds 0 0 0% 0 0%Supplemental General 0 0 0% 0 0%At Risk (4yr Old) 0 0 0% 0 0%At Risk (K-12) 0 0 0% 0 0%Bilingual Education 0 0 0% 0 0%Virtual Education 0 0 0% 0 0%Capital Outlay 0 0 0% 0 0%Driver Training 0 0 0% 0 0%Declining Enrollment 0 0 0% 0 0%Extraordinary School Program 0 0 0% 0 0%Food Service 94,811 74,776 -21% 100,790 35%Professional Development 0 0 0% 0 0%Parent Education Program 0 0 0% 0 0%Summer School 0 0 0% 0 0%Special Education 0 0 0% 0 0%Cost of Living 0 0 0% 0 0%Vocational Education 0 0 0% 0 0%Gifts/Grants 0 0 0% 0 0%Special Liability 0 0 0% 0 0%School Retirement 0 0 0% 0 0%Extraordinary Growth Facilities 0 0 0% 0 0%Special Reserve 0 0 0%KPERS Spec. Ret. Contribution 2,390 3,263 37% 3,791 16%Contingency Reserve 0 0 0%Text Book & Student Material 0 0 0%Activity Fund 0 0 0%Bond and Interest #1 0 0 0% 0 0%Bond and Interest #2 0 0 0% 0 0%No-Fund Warrant 0 0 0% 0 0%Special Assessment 0 0 0% 0 0%Temporary Note 0 0 0% 0 0%
SUBTOTAL 97,201 78,039 -20% 104,581 34%Enrollment (FTE)* 101.3 96.5 -5% 96.5 0%Amount per Pupil 960 809 -16% 1,084 34%
Adult Education 0 0 0% 0 0%Adult Supplemental Education 0 0 0% 0 0%Tuition Reimbursement 0 0 0% 0 0%Special Education Coop 0 0 0% 0 0%TOTAL 97,201 78,039 -20% 104,581 34%
NOTE: Gifts/Grants includes private grants and grants from nonfederal sources.
Amount per pupil excludes the following funds: Adult Education, Adult Supplemental Education, Special Education Coopand Tuition Reimbursement.
* Enrollment (FTE) includes the current year enrollment on September 20, February 20, 4 yr old at-risk, and virtual. It does not include non-funded preschool or full-day kindergarten not on an IEP.
0
20,000
40,000
60,000
80,000
100,000
120,000
2014-2015 2015-2016 2016-2017
97,201
78,039
104,581
Food Service Expenditures
9/22/2016 1:37 PM Sumexpen.xlsx Page 15 of 31

USD# 474
Community Services Operations (3300)
% %2014-2015 2015-2016 inc/ 2016-2017 inc/
Actual Actual dec Budget dec
General 0 0 0% 0 0%Federal Funds 0 0 0% 0 0%Supplemental General 0 0 0% 0 0%At Risk (4yr Old) 0 0 0% 0 0%At Risk (K-12) 0 0 0% 0 0%Bilingual Education 0 0 0% 0 0%Virtual Education 0 0 0% 0 0%Capital Outlay 0 0 0% 0 0%Driver Training 0 0 0% 0 0%Declining Enrollment 0 0 0% 0 0%Extraordinary School Program 0 0 0% 0 0%Food Service 0 0 0% 0 0%Professional Development 0 0 0% 0 0%Parent Education Program 0 0 0% 0 0%Summer School 0 0 0% 0 0%Special Education 0 0 0% 0 0%Cost of Living 0 0 0% 0 0%Vocational Education 0 0 0% 0 0%Gifts/Grants 0 0 0% 0 0%Special Liability 0 0 0% 0 0%School Retirement 0 0 0% 0 0%Extraordinary Growth Facilities 0 0 0% 0 0%Special Reserve 0 0 0%KPERS Spec. Ret. Contribution 0 0 0% 0 0%Contingency Reserve 0 0 0%Text Book & Student Material 0 0 0%Activity Fund 0 0 0%Bond and Interest #1 0 0 0% 0 0%Bond and Interest #2 0 0 0% 0 0%No-Fund Warrant 0 0 0% 0 0%Special Assessment 0 0 0% 0 0%Temporary Note 0 0 0% 0 0%
SUBTOTAL 0 0 0% 0 0%Enrollment (FTE)* 101.3 96.5 -5% 96.5 0%Amount per Pupil 0 0 0% 0 0%
Adult Education 0 0 0% 0 0%Adult Supplemental Education 0 0 0% 0 0%Tuition Reimbursement 0 0 0% 0 0%Special Education Coop 0 0 0% 0 0%TOTAL 0 0 0% 0 0%
NOTE: Gifts/Grants includes private grants and grants from nonfederal sources.
Amount per pupil excludes the following funds: Adult Education, Adult Supplemental Education, Special Education Coopand Tuition Reimbursement.
* Enrollment (FTE) includes the current year enrollment on September 20, February 20, 4 yr old at-risk, and virtual. It does not include non-funded preschool or full-day kindergarten not on an IEP.
0
0
0
0
0
1
1
1
1
1
1
2014-2015 2015-2016 2016-2017
0 0 0
Community Services Operations (3300)
9/22/2016 1:37 PM Sumexpen.xlsx Page 16 of 31

USD# 474
Capital Improvements Expenditures (4000)
% %2014-2015 2015-2016 inc/ 2016-2017 inc/
Actual Actual dec Budget dec
General 0 0 0% 0 0%Federal Funds 0 0 0% 0 0%Supplemental General 0 0 0% 0 0%At Risk (4yr Old) 0 0 0% 0 0%At Risk (K-12) 0 0 0% 0 0%Bilingual Education 0 0 0% 0 0%Virtual Education 0 0 0% 0 0%Capital Outlay 29,179 10,429 -64% 53,854 416%Driver Training 0 0 0% 0 0%Declining Enrollment 0 0 0% 0 0%Extraordinary School Program 0 0 0% 0 0%Food Service 0 0 0% 0 0%Professional Development 0 0 0% 0 0%Parent Education Program 0 0 0% 0 0%Summer School 0 0 0% 0 0%Special Education 0 0 0% 0 0%Cost of Living 0 0 0% 0 0%Vocational Education 0 0 0% 0 0%Gifts/Grants 0 0 0% 0 0%Special Liability 0 0 0% 0 0%School Retirement 0 0 0% 0 0%Extraordinary Growth Facilities 0 0 0% 0 0%Special Reserve 0 0 0%KPERS Spec. Ret. Contribution 0 0 0% 0 0%Contingency Reserve 0 0 0%Text Book & Student Material 0 0 0%Activity Fund 0 0 0%Bond and Interest #1 0 0 0% 0 0%Bond and Interest #2 0 0 0% 0 0%No-Fund Warrant 0 0 0% 0 0%Special Assessment 0 0 0% 0 0%Temporary Note 0 0 0% 0 0%
SUBTOTAL 29,179 10,429 -64% 53,854 416%Enrollment (FTE)* 101.3 96.5 -5% 96.5 0%Amount per Pupil 288 108 -62% 558 416%
Adult Education 0 0 0% 0 0%Adult Supplemental Education 0 0 0% 0 0%Tuition Reimbursement 0 0 0% 0 0%Special Education Coop 0 0 0% 0 0%TOTAL 29,179 10,429 -64% 53,854 416%
NOTE: Gifts/Grants includes private grants and grants from nonfederal sources.
Amount per pupil excludes the following funds: Adult Education, Adult Supplemental Education, Special Education Coopand Tuition Reimbursement.
* Enrollment (FTE) includes the current year enrollment on September 20, February 20, 4 yr old at-risk, and virtual. It does not include non-funded preschool or full-day kindergarten not on an IEP.
0
10,000
20,000
30,000
40,000
50,000
60,000
2014-2015 2015-2016 2016-2017
29,179
10,429
53,854
Capital Improvements (4000)
9/22/2016 1:37 PM Sumexpen.xlsx Page 17 of 31

USD# 474
Debt Services Expenditures (5100)
% %2014-2015 2015-2016 inc/ 2016-2017 inc/
Actual Actual dec Budget dec
General 0 0 0% 0 0%Federal Funds 0 0 0% 0 0%Supplemental General 0 0 0% 0 0%At Risk (4yr Old) 0 0 0% 0 0%At Risk (K-12) 0 0 0% 0 0%Bilingual Education 0 0 0% 0 0%Virtual Education 0 0 0% 0 0%Capital Outlay 0 0 0% 0 0%Driver Training 0 0 0% 0 0%Declining Enrollment 0 0 0% 0 0%Extraordinary School Program 0 0 0% 0 0%Food Service 0 0 0% 0 0%Professional Development 0 0 0% 0 0%Parent Education Program 0 0 0% 0 0%Summer School 0 0 0% 0 0%Special Education 0 0 0% 0 0%Cost of Living 0 0 0% 0 0%Vocational Education 0 0 0% 0 0%Gifts/Grants 0 0 0% 0 0%Special Liability 0 0 0% 0 0%School Retirement 0 0 0% 0 0%Extraordinary Growth Facilities 0 0 0% 0 0%Special Reserve 0 0 0%KPERS Spec. Ret. Contribution 0 0 0% 0 0%Contingency Reserve 0 0 0%Text Book & Student Material 0 0 0%Activity Fund 0 0 0%Bond and Interest #1 0 0 0% 0 0%Bond and Interest #2 0 0 0% 0 0%No-Fund Warrant 0 0 0% 0 0%Special Assessment 0 0 0% 0 0%Temporary Note 0 0 0% 0 0%
SUBTOTAL 0 0 0% 0 0%Enrollment (FTE)* 101.3 96.5 -5% 96.5 0%Amount per Pupil 0 0 0% 0 0%
Adult Education 0 0 0% 0 0%Adult Supplemental Education 0 0 0% 0 0%Tuition Reimbursement 0 0 0% 0 0%Special Education Coop 0 0 0% 0 0%TOTAL 0 0 0% 0 0%
NOTE: Gifts/Grants includes private grants and grants from nonfederal sources.
Amount per pupil excludes the following funds: Adult Education, Adult Supplemental Education, Special Education Coopand Tuition Reimbursement.
* Enrollment (FTE) includes the current year enrollment on September 20, February 20, 4 yr old at-risk, and virtual. It does not include non-funded preschool or full-day kindergarten not on an IEP.
0
0
0
0
0
1
1
1
1
1
1
2014-2015 2015-2016 2016-2017
0 0 0
Debt Services (5100)
9/22/2016 1:37 PM Sumexpen.xlsx Page 18 of 31

USD# 474
Transfers (5200)
% %2014-2015 2015-2016 inc/ 2016-2017 inc/
Actual Actual dec Budget dec
General 151,541 258,170 70% 241,466 -6%Federal Funds 0 0 0% 0 0%Supplemental General 245,000 268,851 10% 266,532 -1%At Risk (4yr Old) 0 0 0% 0 0%At Risk (K-12) 0 0 0% 0 0%Bilingual Education 0 0 0% 0 0%Virtual Education 0 0 0% 0 0%Capital OutlayDriver Training 0 0 0% 0 0%Declining Enrollment 0 0 0% 0 0%Extraordinary School Program 0 0 0% 0 0%Food Service 0 0 0% 0 0%Professional Development 0 0 0% 0 0%Parent Education Program 0 0 0% 0 0%Summer School 0 0 0% 0 0%Special Education 0 0 0% 0 0%Cost of Living 0 0 0% 0 0%Vocational Education 0 0 0% 0 0%Gifts/Grants 0 0 0% 0 0%Special Liability 0 0 0% 0 0%School Retirement 0 0 0% 0 0%Extraordinary Growth Facilities 0 0 0% 0 0%Special Reserve 0 0 0% 0 0%KPERS Spec. Ret. Contribution 0 0 0% 0 0%Contingency Reserve 0 0 0% 0 0%Text Book & Student Material 0 0 0% 0 0%Activity Fund 0 0 0% 0 0%Bond and Interest #1 0 0 0% 0 0%Bond and Interest #2 0 0 0% 0 0%No-Fund Warrant 0 0 0% 0 0%Special Assessment 0 0 0% 0 0%Temporary Note 0 0 0% 0 0%
SUBTOTAL 396,541 527,021 33% 507,998 -4%Enrollment (FTE)* 101.3 96.5 -5% 96.5 0%Amount per Pupil 3,915 5,461 40% 5,264 -4%
Adult Education 0 0 0% 0 0%Adult Supplemental Education 0 0 0% 0 0%Tuition Reimbursement 0 0 0% 0 0%Special Education Coop 0 0 0% 0 0%TOTAL 396,541 527,021 33% 507,998 -4%
NOTE: Gifts/Grants includes private grants and grants from nonfederal sources.
Amount per pupil excludes the following funds: Adult Education, Adult Supplemental Education, Special Education Coopand Tuition Reimbursement.
* Enrollment (FTE) includes the current year enrollment on September 20, February 20, 4 yr old at-risk, and virtual. It does not include non-funded preschool or full-day kindergarten not on an IEP.
0
100,000
200,000
300,000
400,000
500,000
600,000
2014-2015 2015-2016 2016-2017
396,541
527,021507,998
Transfers (5200)
9/22/2016 1:37 PM Sumexpen.xlsx Page 19 of 31

USD# 474Miscellaneous Information
Unencumbered Cash Balance by Fund
July 1, 2014 July 1, 2015 July 1, 2016General 0 0 0Federal Funds 3,878 6,900 3,377Supplemental General 42,738 68,259 49,266At Risk (4yr Old) 0 0 0At Risk (K-12) 118,188 122,951 121,007Bilingual Education 0 0 0Virtual Education 0 0 0Capital Outlay 549,923 397,400 366,071Driver Training 0 0 0Declining Enrollment 0 0 0Extraordinary School Program 0 0 0Food Service 30,285 31,199 24,491Professional Development 18,720 12,932 8,591Parent Education Program 0 0 0Summer School 0 0 0Special Education 200,046 201,575 203,265Cost of Living 0 0 0Vocational Education 0 0 0Gifts/Grants 0 0 0Special Liability 0 0 0School Retirement 0 0 0Extraordinary Growth Facilities 0 0 0Special Reserve 0 0 0KPERS Spec. Ret. Contribution 0 0 0Contingency Reserve 153,491 172,194 172,194Text Book & Student Material 12,777 14,420 11,297Activity Fund 872 1,519 2,019Bond and Interest #1 0 0 0Bond and Interest #2 0 0 0No Fund Warrant 0 0 0Special Assessment 0 0 0Temporary Note 0 0 0
SUBTOTAL 1,130,918 1,029,349 961,578Enrollment (FTE)* 101.3 96.5 96.5Amount per Pupil 11,164 10,667 9,965
Adult Education 0 0 0Adult Supplemental Education 0 0 0Tuition Reimbursement 0 0 0Special Education Coop 0 0 0TOTAL 1,130,918 1,029,349 961,578
NOTE: Gifts/Grants includes private grants and grants from nonfederal sources.
Amount per pupil excludes the following funds: Adult Education, Adult Supplemental Education, Special Education Coopand Tuition Reimbursement.
* Enrollment (FTE) includes the current year enrollment on September 20, February 20, 4 yr old at-risk, and virtual. It does not include non-funded preschool or full-day kindergarten not on an IEP.
0
200,000
400,000
600,000
800,000
1,000,000
1,200,000
July 1, 2014 July 1, 2015 July 1, 2016
1,130,918
1,029,349961,578
Unencumbered Cash Balances by Fund
9/22/2016 1:37 PM Sumexpen.xlsx Page 20 of 31

USD# 474
Reserve FundsUnencumbered Cash Balance
July 1, 2014 July 1, 2015 July 1, 2016Special Reserve 0 0 0TOTAL OTHER 0 0 0Amount per Pupil $0 $0 $0
*School districts are authorized by law to self insure rather than purchase insurance for the following categories: Worker's Comp,Health Insurance, Life Insurance, Property and Casualty (Risk Management) and Disability Income Insurance. Monies are placedin the Self Insured Fund to pay for claims which may arise from the categories listed above.
0
0
0
0
0
1
1
1
1
1
1
July 1, 2014 July 1, 2015 July 1, 2016
0 0 0
Unencumbered Cash Balances by Fund (Reserve Funds Only)
9/22/2016 1:37 PM Sumexpen.xlsx Page 21 of 31

USD# 474
2012-2013 2013-2014 % 2014-2015 % 2015-2016 % 2016-2017 %Actual Actual inc/ Actual inc/ Actual inc/ Budget inc/
dec dec dec dec
Enrollment (FTE)* 118.0 105.0 -11% 101.3 -4% 96.5 -5% 96.5 0%
Enrollment (FTE)** 118.0 105.0 -11% 101.3 -4% 96.5 -5% 96.5 0%Number of Students - Free Meals 36 29 -19% 21 -28% 21 0% 21 0%Number of Students - Reduced Meals 18 13 -28% 23 77% 25 9% 15 -40%
*FTE for state aid and budget authority purposes for general fund (excludes 4 yr old at-risk).
** Enrollment (FTE) includes the current year enrollment on September 20, February 20, 4 yr old at-risk, and virtual. It does not include non-funded preschool or full-day kindergarten not on an IEP.
Enrollment Information
0.0
20.0
40.0
60.0
80.0
100.0
120.0
2012-2013 2013-2014 2014-2015 2015-2016 2016-2017
118.0
105.0 101.396.5 96.5
Enrollment (FTE)** Used for Calculating "Amount per Pupil"
0
5
10
15
20
25
30
35
40
2012-2013 2013-2014 2014-2015 2015-2016 2016-2017
36
29
21 21 2118
13
2325
15
Low Income Students
Free Meals
Reduced Meals
0.0
20.0
40.0
60.0
80.0
100.0
120.0
2012-2013 2013-2014 2014-2015 2015-2016 2016-2017
118.0
105.0 101.396.5 96.5
FTE Enrollment for Budget Authority
9/22/2016 1:37 PM Sumexpen.xlsx Page 22 of 31

USD# 474
Miscellaneous InformationMill Rates by Fund
2014-2015 2015-2016 2016-2017Actual Actual Budget
General 20.000 20.000 20.000Supplemental General 19.769 18.636 19.000Adult Education 0.000 0.000 0.000Capital Outlay 4.000 6.000 6.000Declining Enrollment 0.000 0.000 0.000Cost of Living 0.000 0.000 0.000Special Liability 0.000 0.000 0.000School Retirement 0.000 0.000 0.000Extraordinary Growth Facilities 0.000 0.000 0.000Bond and Interest #1 0.000 0.000 0.000Bond and Interest #2 0.000 0.000 0.000No Fund Warrant 0.000 0.000 0.000Special Assessment 0.000 0.000 0.000Temporary Note 0.000 0.000 0.000TOTAL USD 43.769 44.636 45.000Historical Museum 0.000 0.000 0.000Public Library Board 0.000 0.000 0.000Public Library Brd & Emp Benf 0.000 0.000 0.000Recreation Commission 2.000 2.000 2.000
Rec Comm Employee Bnfts 0.000 0.000 0.000TOTAL OTHER 2.000 2.000 2.000
0.000
10.000
20.000
30.000
40.000
50.000
60.000
70.000
80.000
2014-2015 2015-2016 2016-2017
43.769 44.636 45.000
Total USD Mill Rates
General45%
Supplemental General42%
Capital Outlay13%
Miscellaneous Information Mill Rates by Fund (Total USD)
General
Supplemental General
Adult Education
Capital Outlay
Special Liability
School Retirement
Declining Enrollment
Cost of Living
Bond and Interest #1
Bond and Interest #2
Extraordinary Growth Facilities
No Fund Warrant
Special Assessment
Temporary Note
9/22/2016 1:37 PM Sumexpen.xlsx Page 23 of 31

USD# 474Other Information
2014-2015 2015-2016 2016-2017Actual Actual Budget
Assessed Valuation $19,896,118 $19,033,433 $18,494,558
Total USD Debt $0 $0 $0
$17,500,000
$18,000,000
$18,500,000
$19,000,000
$19,500,000
$20,000,000
2014-2015 2015-2016 2016-2017
$19,896,118
$19,033,433
$18,494,558
Assessed Valuation
$0
$0
$0
$0
$0
$1
$1
$1
$1
$1
$1
2014-2015 2015-2016 2016-2017
$0 $0 $0
Total USD Debt
9/22/2016 1:37 PM Sumexpen.xlsx Page 24 of 31

USD 474
2016-17 Estimated Sources of Revenue--2016-17 Estimated
Amount July 1, 2016 State Federal Local July 1, 2017
Fund Budgeted Cash Balance Interest Transfers Other Cash Balance
General 1,195,573 0 1,178,573 0 5,000 0 12,000 0
Supplemental General 379,947 49,266 0 0 330,681 XXXXXXXX
Adult Education 0 0 0 0 xxxxxxxxxxxx 0 0 0
At Risk (4yr Old) 0 0 0 xxxxxxxxxxxx 0 0 0
Adult Supplemental Education 0 0 xxxxxxxxxxxx 0 0 0
At Risk (K-12) 315,007 121,007 0 xxxxxxxxxxxx 179,000 15,000 0
Bilingual Education 0 0 0 xxxxxxxxxxxx 0 0 0
Virtual Education 0 0 0 0 0 0
Capital Outlay 486,854 366,071 0 0 0 120,783 0
Driver Training 0 0 0 0 xxxxxxxxxxxx 0 0 0
Declining Enrollment 0 0 0 0 XXXXXXXX
Extraordinary School Program 0 0 0 xxxxxxxxxxxx 0 0 0
Food Service 100,790 24,491 305 18,398 0 41,000 16,596 0
Professional Development 13,591 8,591 0 xxxxxxxxxxxx 5,000 0 0
Parent Education Program 0 0 0 0 xxxxxxxxxxxx 0 0 0
Summer School 0 0 0 xxxxxxxxxxxx 0 0 0
Special Education 396,297 203,265 0 0 xxxxxxxxxxxx 193,032 0 0
Vocational Education 5,500 0 0 0 xxxxxxxxxxxx 5,500 0 0
Special Liability Expense Fund 0 0 0 0 0 0
Special Reserve Fund 0 XXXXXXXX
Gifts and Grants 0 0 0 0
Textbook & Student Materials Revolving 11,297 XXXXXXXX
School Retirement 0 0 xxxxxxxxxxxx 0 0
Extraordinary Growth Facilities 0 0 0 0 XXXXXXXXX
KPERS Special Retirement Contribution 84,466 0 84,466 XXXXXXXXX
Contingency Reserve 172,194 XXXXXXXXX
Activity Funds 2,019 XXXXXXXXX
Tuition Reimbursement 0 0 0 0 0
Bond and Interest #1 0 0 0 0 0 0 0
Bond and Interest #2 0 0 0 0 0 0 0
No Fund Warrant 0 0 0 0
Special Assessment 0 0 0 0
Temporary Note 0 0 xxxxxxxxxxxx 0 0
Coop Special Education 0 0 0 0 0 0 0
Federal Funds 47,836 3,377 xxxxxxxxxxx 44,459 xxxxxxxxxxxx xxxxxxxxxxxx xxxxxxxxxxx 0
Cost of Living 0 0 xxxxxxxxxxx xxxxxxxxxxx xxxxxxxxxxxx 0 0 XXXXXXXXX
SUBTOTAL 3,025,861 961,578 1,178,878 62,857 5,000 507,998 495,060 0
Less Transfers 507,998
TOTAL Budget Expenditures $2,517,863
2014-2015 2015-2016 2016-2017State Revenues 1,137,140 1,117,569 1,178,878
Federal Revenues 59,885 66,696 62,857Local Revenues* 682,211 638,321 500,060Total Revenues 1,879,236 1,822,586 1,741,795
Revenues Per Pupil 18,551 18,887 18,050
*Excludes "Transfers" to avoid duplication of revenue.
Sources of Revenue and Proposed Budget for 2016-17
Sources of Revenue - - State, Federal, Local
Effective July 1, 2014 (2014-15 school year) KSA 72-6431 states proceeds from the
Ad Valorem taxes levied for the General Fund shall be remitted to the
State Treasurer. Such remittance shall be redistributed as state general aid.
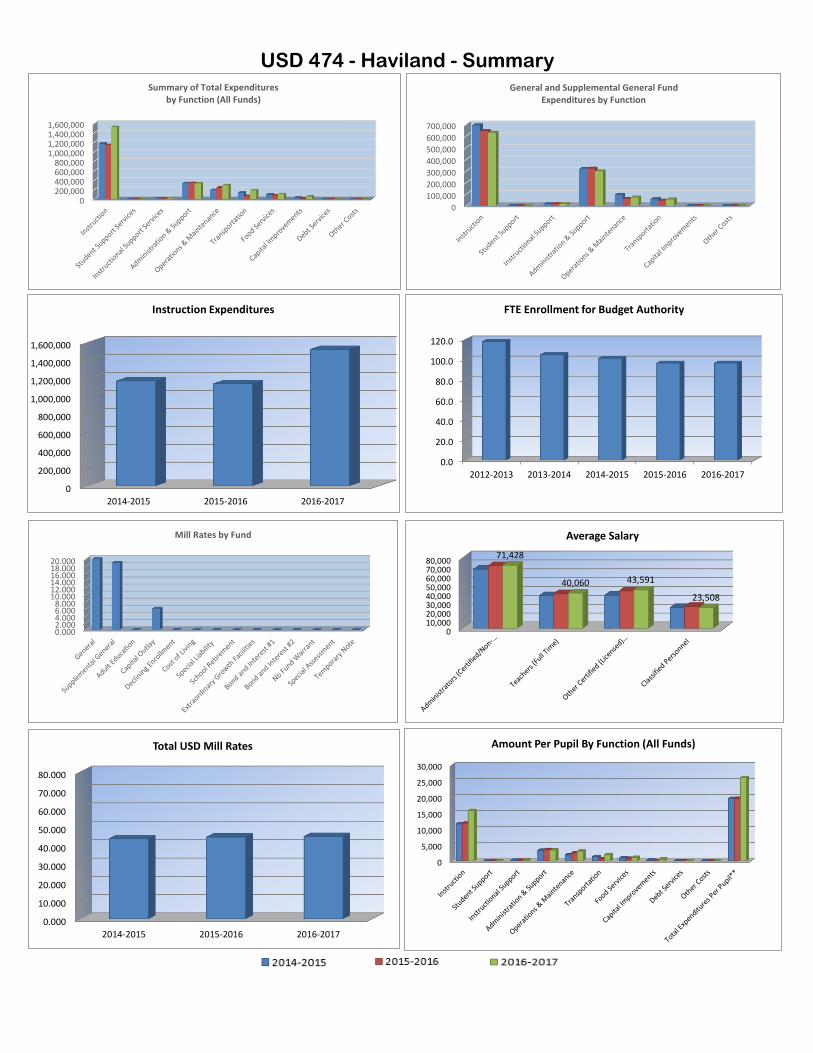
USD 474 - Haviland - Summary
0
200,000
400,000
600,000
800,000
1,000,000
1,200,000
1,400,000
1,600,000
2014-2015 2015-2016 2016-2017
Instruction Expenditures
0.0
20.0
40.0
60.0
80.0
100.0
120.0
2012-2013 2013-2014 2014-2015 2015-2016 2016-2017
FTE Enrollment for Budget Authority
0.000
10.000
20.000
30.000
40.000
50.000
60.000
70.000
80.000
2014-2015 2015-2016 2016-2017
Total USD Mill Rates
0
5,000
10,000
15,000
20,000
25,000
30,000
Amount Per Pupil By Function (All Funds)
010,00020,00030,00040,00050,00060,00070,00080,000
71,428
40,060 43,591
23,508
Average Salary
0200,000400,000600,000800,000
1,000,0001,200,0001,400,0001,600,000
Summary of Total Expendituresby Function (All Funds)
0
100,000
200,000
300,000
400,000
500,000
600,000
700,000
General and Supplemental General FundExpenditures by Function
0.0002.0004.0006.0008.000
10.00012.00014.00016.00018.00020.000
Mill Rates by Fund

Intentionally left blank

Intentionally left blank

Intentionally left blank

Intentionally left blank

Intentionally left blank


