
Journal of NEICSSR, Vol.-20, No.2, 1996, pp. 1-18.
1
ECONOMIC-DEMOGRAPHIC CHANGES IN THE TRIBAL SOCIETIES OF TRIPURA
P.R. Bhattacharjee, P. Nayak and P. Saha*
INTRODUCTION
Interaction between socio-economic and demographic factors of change is an
important and interesting topic of study in respect of any society. Such a study assumes
overwhelming importance in the case of tribal societies known for their backwardness
and extremely slow process of socio-economic change.
Although the tribal people are known to have some distinct demographic features
and these features have important implications for their socio-economic development,
very little attempt has been made to analyse them and relate them to their problems. In
Tripura and other North Eastern States, the concern for dealing with the problem posed
by immigration of non-tribal has diverted the attention of the researchers from the
analysis of demographic changes in the tribal societies of Tripura and their relation with
economic development of these social groups. The present paper is a humble step to
bridge this gap.
METHODOLOGY
The approach in the present paper has been a mixed one in respect of
methodology. We have studied economic-demographic situation of the tribal people as a
whole and at the same time analysed the disaggregated data for different tribal groups
with a view to understanding the interaction between demographic and other socio-
economic factors through cross-section comparison. For this we have totally depended on
census data and obviously non-availability of disaggregated demographic data at the level
of specific tribes has imposed limitations on our analysis.
----------------------------------------------------------------------------------------------------------
* Dr. P.R. Bhattacharjee and Dr. P. Nayak, Department of Economics, Assam University, Silchar, Assam.
Ms. P. Saha, Department of Analytical & Applied Economics, Tripura University, Agartala, Tripura,
India.
Journal of NEICSSR, Vol.-20, No.2, 1996, pp. 1-18.
2
There are as many as 19 scheduled tribes in Tripura. They are: (1) Tripuri or
Tripura, (2) Riang, (3) Jamatia, (4) Chakma, (5) Halam, (6) Noatia, (7) Mog, (8) Kuki,
(9) Garo, (10) Munda, (11) Orang, (12) Lushai, (13) Santal, (14) Uchai, (15) Khasia, (16)
Bhil, (17) Lepcha, (18) Bhutia and (19) Chaimal.
Only the 11 tribes mentioned above had population exceeding 5000 according to
1981 Census. Therefore, for comparative study of economic-demographic features we
have selected the first 11 tribes for separate analytical treatment and clubbed the rest of
the tribes together under the group-name of “Other tribes”. This has been done in view of
the fact that too small figures do not yield meaningful results when their covariation is
studied.
DYNAMICS OF TRIBAL DEMOGRAPHY
In almost all socio-economic studies of Tripura it is emphasized that owing to
continuous immigration on non-tribal population (speeded up spectacularly after the
partition of India) the proportion of tribal population to total population has fallen
drastically since 1931 reducing them to the minority position. Table 1 shows that the
proportion of tribal population to total population in Tripura was as high as 56.37 percent
in 1921 and it came down to 28.44 percent in 1981. Curiously the Census of 1991 shows
an increase in the proportion of tribal population to 30.55 percent (perhaps owing to the
influx of the Chakma refugees in recent years).
Immigration of non-tribal population has created a number of problems of
adjustment. The demographic marginalization of the tribal population in Tripura has also
been accompanied with socio-economic marginalization owing to their inability to have
adequate participation in the process of economic development (Bhattacharjee and
Ganguly, 1993). This has given rise to social tension manifest in its extreme form in the
riots of 1980 and in the chronic problem of tribal insurgency in the State.
Side by side the exogenous factor bringing about qualitative (compositional)
change in the demography of Tripura. The indigenous factor of change in the quantum
and structure of tribal population is also of great importance in view of the fact that this
has contributed to the change in land-man ration, shortening of the jhum cycle in the

Journal of NEICSSR, Vol.-20, No.2, 1996, pp. 1-18.
3
tribal economy and consequent crisis of rising population in a stagnant occupational
setup. Moreover, changes in the proportion of different tribes within the broad social
group known as the tribal are also significant in so far as they indicate demographic
features of different tribes and their relative positions.
Table 1 show that tribal population in Tripura has been increasing at a very high
rate since 1911. During the decades of 1911-21, 1951-61, and 1981-91 the decadal
growth rates have been 54.13, 51.31 and 46.14 percent respectively. The decline in the
tribal population during 1941-51 has been ascribed by experts to errors of enumeration
(Ganguly, 1990).
The gap between the decadal growth rates of tribal population and total
population has been narrowed down since 1961 when immigration into the State started
getting slowed down. This narrowing gap between the population growth rates suggests
that the natural rates of growth of tribal and non-tribal populations in Tripura are not
greatly different. This similarity of natural demographic change between the tribal and
non-tribal combined with the known dissimilarity between their economic participation
has greatly contributed to inequality between the two social groups with all its adverse
socio-political consequences ((Bhattacharjee and Ganguly, 1993).
INTER-TRIBE COMPARATIVE DEMOGRAPHIC GROWTH RATES
Table 2 present population figures for different tribes of Tripura and their
proportions to total tribal population during 1961-81. As is well-known the Tripuris
occupy the dominant position in the tribal demography of Tripura constituting more than
50 percent of the said population. Moreover, their proportion to total tribal population has
been increasing from one census year to another, it being 52.71 percent in 1961 and 56.66
percent in 1981. At the other extreme are Noatias whose proportion to total tribal
population has suffered a steady decline from 4.45 percent in 1961 to 1.23 percent in
1981.
On the face of it, one may suggest that the Tripuri being the dominant tribal
group, are also the most advanced of all the tribes in Tripura and it is natural that they
being in the second stage of demographic change will experience higher natural rate of
growth in comparison with other less developed tribes. But decline in the Noatia
population cannot be explained in the same way. Ganguly ascribes the decrease in

Journal of NEICSSR, Vol.-20, No.2, 1996, pp. 1-18.
4
population of the Noatias to the fact that owing to the operation of the force of
realignment in the tribal society many of the Noatias have declared themselves as the
Tripuris.
The Reang constitute the second largest tribal population in the State, their
proportion being around 15 percent. The gap between the first and the second largest
group is remarkable. Although the population of the Reang has been increasing, their
proportion to total tribal population has declined slightly from 15.72 percent in 1961 to
14.3 percent in 1981.
The third tribal group, the Jamatia however, attained a steady increase in their
proportion from 6.76 to 7.62 percent. The Chakma and Mog are the two tribes affected by
waves of international migration. But it is significant that while the population proportion
of the Chakma is fluctuating around 6 percent that of the Mog has registered steady
increase from 2.92 percent in 1961 to 3.12 percent in 1981. Perhaps this implies that
while the populations of the Chakma are still influenced by immigration the factor of
emigration does not work in the case of the Mog.
The proportions of all other tribes are below 2 percent and owing to smallness of
their number and proportion, the percentage variation in proportion does not carry much
meaning. Still the fall in the proportion of the Kuki population from 1.54 percent in 1961
to 0.94 percent in 1981 and that of the Garo from 1.52 to 1.25 percent during the same
period are remarkable.
Thus it is found that while the tribal population in Tripura has registered steady
and rather rapid increase during the last few decades, its inter-tribe composition has been
undergoing significant changes. The dominant factor in this qualitative change may be
the ‘flux in social boundaries’ in the terminology of B.K. Roy Barman (Barman, 1970).
Table 3 provides a device of looking at the same phenomenon in another way i.e.,
the way of viewing the growth rates of different tribes of Tripura in order to understand
their relative contribution to the growth in total population. The overwhelmingly
dominant tribe, Tripuri is found to have decadal growth rate exceeding 30 percent both in
1961-71 and 1971-81 while the second largest tribe, Reang registered comparatively
moderate decadal growth rates of 14.36 percent and 29.79 percent respectively during
these two decades.

Journal of NEICSSR, Vol.-20, No.2, 1996, pp. 1-18.
5
In conformity with sharp decline in their proportion to the total tribal population,
the Noatias have registered spectacularly negative demographic growth rates during both
the decades and the Kukis have shown similar trend during 1971-81.
The Mundas and the Orangs known as the ‘tea-plantation tribes’ of Tripura
experienced high decadal growth rates of 49.48 and 52.19 percent respectively during
1971-81. The indigenous tribe, Halam also showed high decadal growth rate of 51.87
percent. The decadal growth rate of the Garos, however, are found to be surprisingly low
i.e., 1.37 percent during 1961-71.
While some of the extreme variations may be ascribed to ‘under enumeration’ in
one census year and ‘correction’ in the other or to ‘flux in social boundaries’ there is no
doubt that rates of demographic changes for the tribes of Tripura have been significantly
unequal.
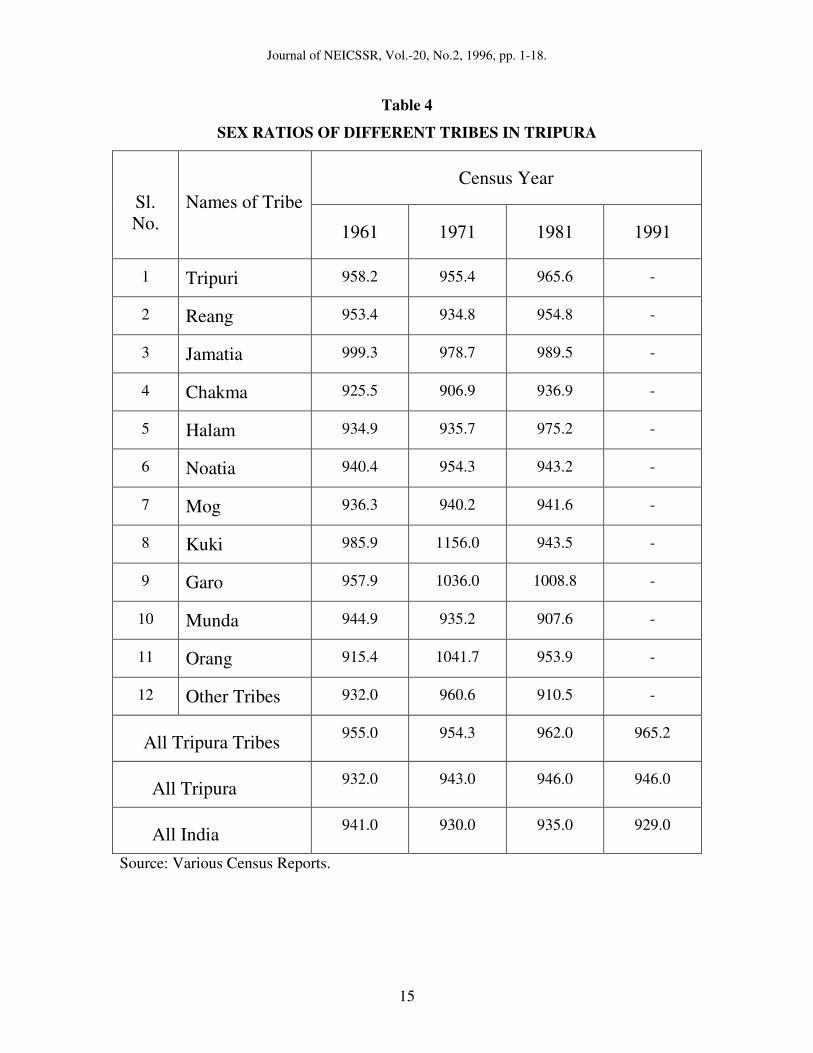
SEX RATIO Female deficiency has been a striking characteristic of Indian population
throughout the period of the regular census history (Sinha and Zacharia, 1984). This
deficiency is reflected in the sex ratio which shows the number of females per one
thousand males. The death rate among females compared to that of males should be low
because of biological reasons enabling females to resist diseases more effectively than
males. Therefore, adverse sex ratio is an indicator of lower social status of women
reflecting scanty regard shown by the society to their wellbeing. On the other hand,
favourable (higher) sex ratio indicates better social status of women in the society
concerned.
Table 4 shows that the tribes in Tripura have better sex ratio than people in
general both in Tripura and in India as a whole. In 1991 the sex ratio of the tribal in
Tripura was as high as 965.2 whereas it was 946 for all Tripura and only 929 for all India.
It is also found that the sex ratio among the tribes in totality has registered an
improvement from 955 in 1961 to 965.2 in 1991. This may be owing to either an
improvement in the status of tribal women or a fuller enumeration of them in the census
or both.
If we make an inter-tribe comparison it is found that in 1961 the Jamatias had the
highest sex ratio (999.3) followed by the Kukis (985.9) and the Tripuris (958.3). The

Journal of NEICSSR, Vol.-20, No.2, 1996, pp. 1-18.
6
Orangs had the lowest sex ratio (915.4). But the comparative position of the tribes in
respect of sex ratio has undergone change greatly over the last three decades. In 1971 the
pride of place went to the Kukis (1156) followed by the Orangs (1041.7) and the Garos
(1036). In that year the Chakmas had the lowest sex ratio of 906.9.
In 1981 the Garos (1008.8) came to the forefront in this respect followed by the
Jamatias (989.5) and the Halams (975.2). The lowest position went to the Mundas
(907.6). Thus great fluctuations are found in the sex ratios of the tribes and no firm
conclusion can be drawn about the comparative position of different tribes so far as the
sex ratio is concerned.
WORK PARTICIPATION
Rate and pattern of work participation are important indicators of economic
characteristics of a community. While rate of work participation indicate the extent of use
of the available human resource and the burden of dependants per earner, the pattern of
work participation or the occupational distribution of the workers show the stage of
economic development attained.
Although there are some variations in the definition of workers in various
censuses of India, the work participation rate are roughly comparable if we add together
the main and marginal workers and define the work participation as the ratio of total
workers (main and marginal) to total population. The variations in time reference type of
work etc may be ignored while trying to find the broad trend.
Table 5 shows that percentage of workers in the tribal societies in Tripura as a
whole has declined from 51.59 percent in 1961 to 31.55 percent in 1971 and then it has
registered an improvement to reach the figure of 41.25 percent in 1981. The overall trend
in work participation is definitely a falling one.
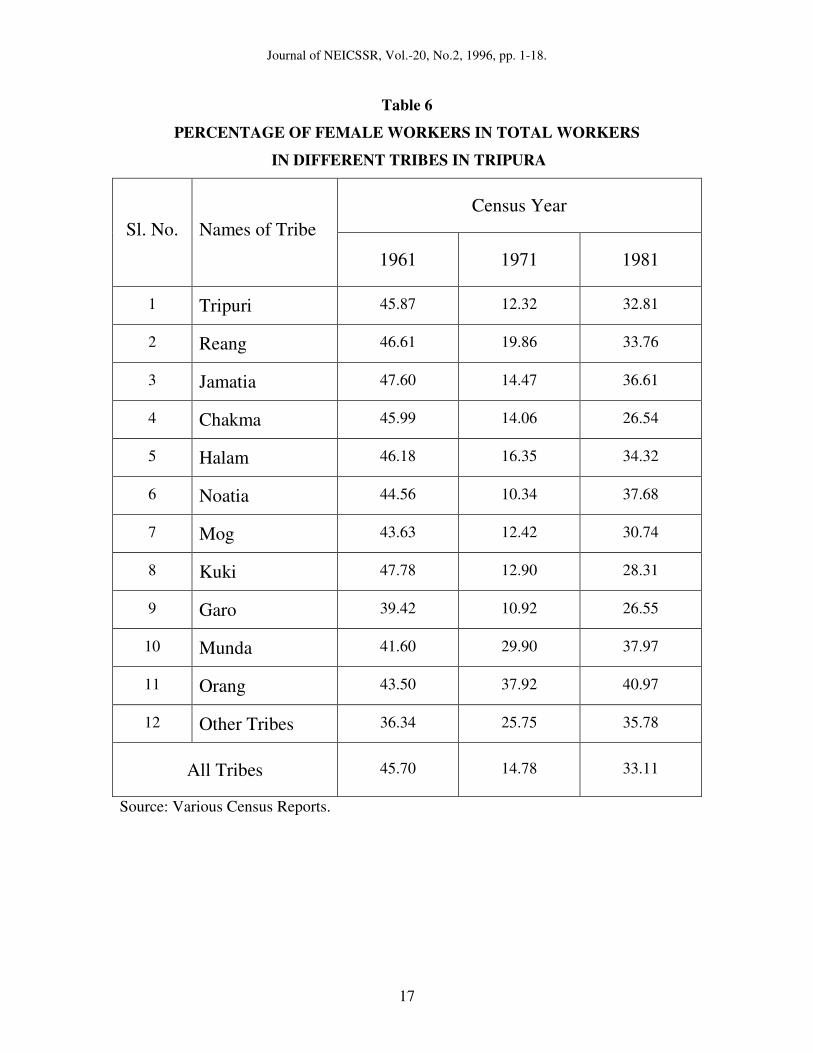
The falling trend in the work participation rate of the tribes in Tripura between
1961 and 1971 can mainly be explained by the exclusion of many women from the
category of workers. This is confirmed by Table 6 which shows that the tribal female
participation rate fell from 45.70 percent in 1961 to 14.78 percent in 19971. This drastic
fall cannot wholly owe to change in the definition of work. One may point out that with
the peasantisation of the tribal economy i.e., switchover from shifting cultivation to
settled peasant farming, the role of the female workers in agricultural operations has lost

Journal of NEICSSR, Vol.-20, No.2, 1996, pp. 1-18.
7
much of its importance. Moreover, falling female participation rate may be indicative of
(1) displacement of women at a higher rate in the face of declining work opportunity for
both the sexes and (2) withdrawal of females from labour force in the first stage of socio-
economic development when the women are not educated enough to join the tertiary
sector activities.
Table 5 shows that the ‘other tribes’ has the highest rate of work participation
(62.69%) followed by the Reang (56.2%) and the Orang (55.16%). In 1971 the Reang
tribe lost their position in respect of work participation and the Orang ranked first
(42.39%) while the Munda occupied the second place (40.66%). Now, the Reang have
been identified in Tripura as a primitive tribe being hardcore Jhumia practicing shifting
cultivation in protected and reserve forest areas. They have been the chief beneficiaries of
the Primitive Group programme for settlement of Jhumia (Dept. of A&A Economics,
1988). This explains fall in their work participation rate as they made switchover from
shifting cultivation. On the other hand, the Orang and Munda are ‘tea-plantation’ tribes
and their status as tea garden workers has not undergone any substantial change.
Therefore, in their case the fall in the work participation rate has been less. It is also to be
noted that these two tribes maintained their eminence in work participation in 1981.
Table 6 shows that in 1961 the Kuki had the highest female work participation
rate (47.78%) closely followed by the Jamatia (47.6%) and the Reang (46.61%). In 1971
with fall in participation rate the first three ranks in this respect were occupied by the
Orang (37.92%), Munda (29.9%) and the ‘other tribes’ (25.75%). The Tripuri, the
dominant group suffered a great decline in the female work participation rate from 45.87
to 12.32 percent between 1961 and 1971. This may be owing to impact of development
on them. The Noatia are observed to have the lowest female participation rate of 10.34
percent in 1971.
In 1981 the Orang (40.97%) and Munda (37.97%) are seen to have maintained
their relative position followed by the Noatia (37.68%) in the third rank. The Chakma are
observed to have the lowest rate of female participation (26.54%) closely in precedence
by the Garo (26.55%).
It is difficult to explain the changes in the relative position of different tribes in respect of
female work participation as portrayed in the census figures by any set of formula. But it

Journal of NEICSSR, Vol.-20, No.2, 1996, pp. 1-18.
8
is noteworthy that in 1961 and 1981 the differences in the rates of female participation in
work between different tribes were much less than those in 1971.
Proportion of workers in the non-primary sector is an important indicator of
economic development. Table 7 shows that this proportion for the tribal people as a
whole fell from 7.87 percent in 1961 to 3.26 percent in 1971 and then increased to 5.65
percent in 1981. The fall in this proportion between 1961 and 1981 is noteworthy. If we
are to rely in census data the conclusion is inevitable that the tribal societies in Tripura
have suffered a structural retrogression. On the one hand the household industries like
loin looms and handicrafts have suffered decay and on the other the tribal people have
not been able to make any significant progress in respect of participation in trade, service
etc. The fresh addition to the labour force consequent upon population growth has been
absorbed in the primary sector alone.
In 1961 the Munda had the highest proportion of workers (19.16%) in the non-
primary sector followed by the ‘other tribes’ (13.2%), Garo (12.01%) and the Mog
(11.24%).
In 1971 the Orang occupied the first rank (20.16%) in this respect followed by
‘other tribes’ (9.51%) and Garo (7.75%). While the higher proportion of non-primary
workers in the case of the ‘plantation-tribes’ is understandable, change in their relative
positions especially the drastic fall in the proportion of the Munda workers in the non-
primary sectors from 19.16 percent in 1961 to 2.57 percent in 1971 is difficult to explain.
In 1981 the Orang again occupied the first position (33.6%) followed by the
‘other tribes’ (16.39%) and the Garo (14.02%).
The increase of the proportion of the Orang workers in the non-primary sectors
from 6.24 percent in 1961 to 20.16 percent in 1971 and 33.6 percent in 1981 defies the
easy explanation. While tribes like the Reang, the Noatia and the Mog suffered great
decline in the proportion of workers in the non-primary sectors the Tripuri suffered less
on this account, their proportion having fallen from 8.49 percent in 1961 to 6.44 percent
in 1981.
The analysis of the figures relating to the percentage of tribal workers in the non-
primary sectors leads us to apprehend that census figures in respect of some tribes
suffered from limitations although on the average the picture of falling trend in the total
Journal of NEICSSR, Vol.-20, No.2, 1996, pp. 1-18.
9
rate of work participation and proportion of workers in the non-primary sectors seems to
be true.
LITERACY
One of the important features of backwardness of the tribes is low literacy rate.
But it is heartening to note that the tribal people in Tripura have made significant
progress in literacy during the last few decades. As Table 8 shows, the literacy rate of the
tribal people as a whole increased from 10.01 percent in 1961 to 15.03 percent in 1971
and 23.09 percent in 1981. During the same period, the female literacy rate rose from2.31
to 6.04 and then to 12.27 percent.
Even then the difference between the tribal and non-tribal in respect of literacy
persists to be substantial. This is reflected in the fact that the total rate of literacy in
Tripura in 1981 was 42.12 percent against the tribal literacy rate of 23.09 percent. The
gap in female literacy is greater as it is observed that in 1981 when overall female literacy
rate in Tripura was 32 percent that of tribal remained as low as 12.27 percent.
If we look at the literacy scenario tribe-wise, ‘other tribes’ had the highest literacy
rate in all the census years of 1961, 1971 and 1981. The greatest contribution to this has
perhaps been made by Lushai tribe known for their great progress in education under the
influence of the Christian Missionaries.
Contrary to popular belief the Tripuri who happen to be the tribe of the erstwhile
Tripura princes does not rank first in literacy although the literacy rate has always been
higher than the average rate of the tribal in Tripura. In 1961 ‘other tribes’ ranked first
with the literacy rate of 23.94 percent followed by the Garo (13.84%) while the Tripuri
(12.68%) ranked third.
In 1971 also the three groups mentioned above occupied first, second and third
positions with literacy of 36.96, 20.31 and 17.78 percent respectively. Significantly
enough the small tribal groups clubbed as ‘other tribes’ attained a literacy rate of 36.96
percent which exceeded the literacy rate for Tripura as a whole (30.9%) in 1971.
In 1981 there were small changes in the literacy ranks of the tribal groups. While
‘other tribes’ maintained the first rank with the literacy rate of 40.1 percent the second
position was occupied by the Kuki (35.9%) with the Garo (32.76%) relegated to the third

Journal of NEICSSR, Vol.-20, No.2, 1996, pp. 1-18.
10
position. The Tripuri (27.13%) now occupied only the 4th place in respect of literacy
among the tribal groups.
In 1981 Munda had the lowest literacy rate of 7.97 percent. The position of the
Orang (9.89%), the Mog (11.71%), the Noatia (12.27%) and the Reang (12.67%) were
also very much backward and far below the average tribal literacy rate of 23.09 percent.
The gap between the male and female literacy rates is wide in the case of many
tribes. Low literacy rates for the females have significantly contributed to the relative
backwardness of tribes in education. Even in 1981 the female literacy rate for the Orang
was as low as 2.08 percent and those of the Munda, Noatia and Reang were 2.79, 3.87
and 4.34 percent respectively.
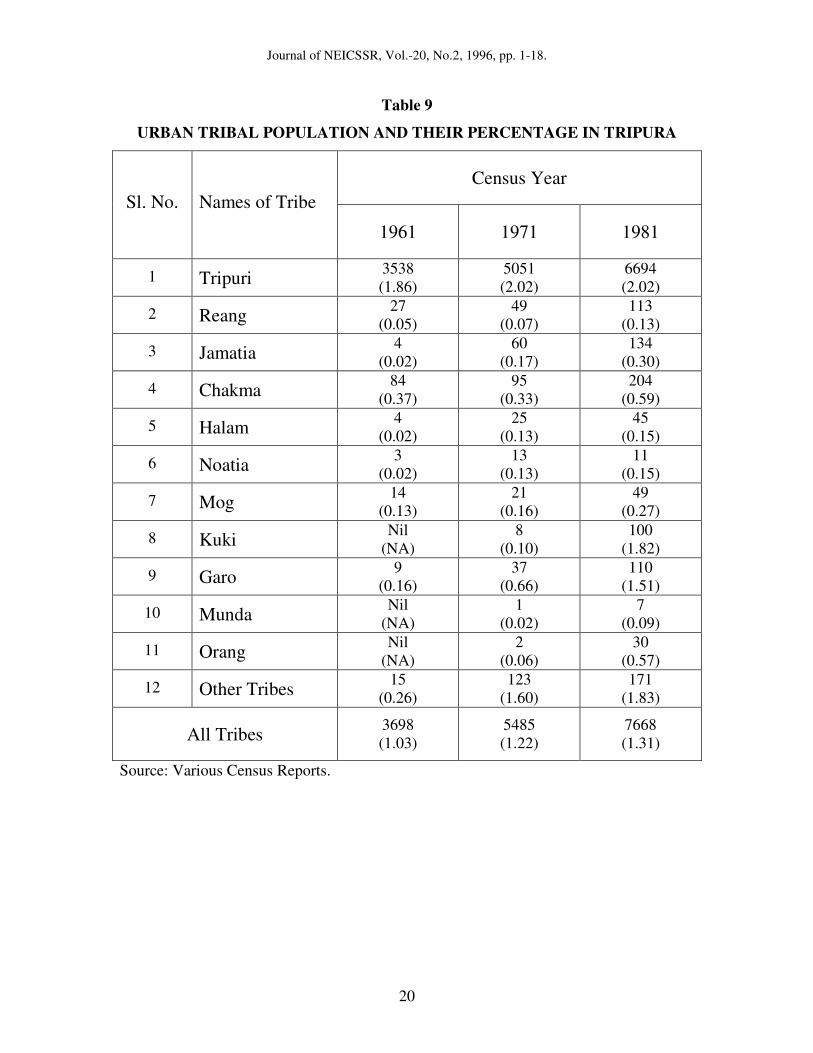
URBANIZATION Extent of urbanization is known to be positively correlated with the degree of
economic development. As is well known all tribes of Tripura not only predominantly
rural in residential characteristics they mainly live in the inaccessible hilly hamlets many
of which are located in protected or even reserve forest areas. Therefore, the extent of
urbanization of the tribal societies is naturally extremely small. Table 9 shows that
proportion of the tribal people in Tripura living in the urban areas has increased very
slowly from 1.03 percent in 1961 to 1.31 percent in 1981.
Being the tribe of the erstwhile princely rulers of Tripura the Tripuri are naturally
the most urbanized of all the tribal groups. But even in its case the proportion of urban
population has been only 2.02 percent in 1981. Next to the Tripuri are ranked ‘other
tribes’ (1.83%), the Kuki (1.82%) and the Garo (1.51%). The proportion of urban
population is much below 1 percent in the cases of all other tribes. The Munda (0.09%)
are the least urbanized tribe closely in precedence by the Reang (0.13%), Halam (0.15%)
and Noatia (0.15%).
INTERACTION BETWEEN DEMOGRAPHIC AND SOCIO-ECONOMIC FACTORS
To examine the interaction between demographic changes and socio-economic
factors of development we have selected six indices of development viz. total literacy
rate, female literacy rate, extent of urbanization, proportion of female and proportion of
workers in the non-primary sectors.

Journal of NEICSSR, Vol.-20, No.2, 1996, pp. 1-18.
11
It is generally expected that literacy especially female literacy would be
negatively correlated with the rate of population growth. But Table 10 shows that during
1961-71 both total literacy and female literacy has been positively correlated with the rate
of population growth although the coefficient of correlation is below 40 percent. Of
course negative correlation between these variables is found during 1971-81.
It may be said that improvement in literacy has not been substantial enough to
have definite impact on the population growth rate in the tribal societies.
The correlation between the extent of urbanization and population growth rate has
been observed to be similar to that between population growth and literacy. Here also it
may be said that extent of urbanization is too small to have a definite impact. But even
then the negative relation between urbanization and population growth has manifested
itself in 1971-81.
Contrary to rational expectation population growth has been positively correlated
with both the proportion of female workers and the proportion of workers in the non-
primary sectors in the tribal societies. This may be because of the fact that higher
percentage of female workers is not associated with industrialization or urbanization or
educational progress in the case of the tribal people of Tripura at the present stage of
development. Rather it is found that the tribes involved more deeply in a primitive
occupation like shifting cultivation have higher rates of female work participation.
Participation in non-primary activities on the part of the tribal people is confined
mainly to rural industries or tea plantations. This has not helped create an urban culture
favorable to small family norm. Rather higher income resulting from participation in the
non-primary sectors has perhaps reduced death rates among the tribes and consequently
positive correlation has been found between population growth and percentage of
workers in the non-primary sectors.

Journal of NEICSSR, Vol.-20, No.2, 1996, pp. 1-18.
12
APPENDIX
Table 1
GROWTH OF TRIBAL POPULATION IN TRIPURA
% Decadal Variation of
Year
Tribal Population
Total Population
% of Tribal
Population Tribal Population
Total Population
1901 91,679 1,73,325 52.89 - -
1911 1,11,303 2,29,613 48.47 21.40 32.47
1921 1,71,610 3,04,437 56.37 54.13 32.59
1931 2,03,327 3,82,450 53.16 18.48 25.62
1941 2,56,991 5,13,010 50.09 26.39 34.14
1951 2,37,953 6,45,707 36.85 -7.40 25.87
1961 3,60,070 11,42,005 31.53 51.31 76.86
1971 4,50,544 15,56,342 28.95 25.12 36.28
1981 5,83,920 20,53,058 28.44 29.60 31.91
1991 8,53,345 27,57,205 30.95 46.14 34.30
Source: Various Census Reports.

Journal of NEICSSR, Vol.-20, No.2, 1996, pp. 1-18.
13
Table 2
TRIBE-WISE POPULATION IN TRIPURA AND THEIR PERCENTAGE
Census Year Sl. No.
Names of Tribe 1961 1971 1981 1991
1 Tripuri 1,89,799 (52.71)
2,50,545 (55.61)
3,30,872 (56.66)
-
2 Reang 56,597 (15.72)
64,722 (14.36)
84,004 (14.39)
-
3 Jamatia 24,359 (6.76)
34,192 (7.59)
44,501 (7.62)
-
4 Chakma 22,386 (6.17)
28,662 (6.36)
34,797 (5.96)
-
5 Halam 16,298 (4.53)
19,076 (4.23)
28,970 (4.96)
-
6 Noatia 16,010 (4.45)
10,297 (2.28)
7,182 (1.23)
-
7 Mog 10,524 (2.92)
13,273 (2.94)
18,230 (3.12)
-
8 Kuki 5,531 (1.54)
7,775 (1.72)
5,502 (0.94)
-
9 Garo 5,484 (1.52)
5,559 (1.23)
7,298 (1.25)
-
10 Munda 4,409 (1.22)
5,347 (1.19)
7,993 (1.37)
-
11 Orang 2,875 (0.80)
3,428 (0.76)
5,217 (0.89)
-
12 Other Tribes 5,798 (1.61)
7,668 (1.70)
9,354 (1.60)
-
All Tribes 3,60,070 (100.00)
4,50,544 (100.00)
5,83,920 (100.00)
8,53,345 (100.00)
Source: Various Census Reports. Note: Figures in the parentheses denote percentages.

Journal of NEICSSR, Vol.-20, No.2, 1996, pp. 1-18.
14
Table 3
TRIBE-WISE DECADAL POPULATION GROWTH IN TRIPURA
Census Year Sl. No.
Names of Tribe
1961-71 1971-81 1961-81 1981-91
1 Tripuri 32.00 32.06 74.33 -
2 Reang 14.36 29.79 48.42 -
3 Jamatia 40.37 30.15 82.69 -
4 Chakma 28.03 21.40 55.44 -
5 Halam 17.04 51.87 77.75 -
6 Noatia -5.68 -30.25 -55.14 -
7 Mog 26.12 37.35 73.22 -
8 Kuki 40.57 -29.23 -0.52 -
9 Garo 1.37 31.28 33.08 -
10 Munda 21.27 49.48 81.29 -
11 Orang 19.23 52.19 81.46 -
12 Other Tribes 32.25 21.99 61.33 -
All Tribes 25.12 29.60 62.17 46.14
Source: Various Census Reports.
Journal of NEICSSR, Vol.-20, No.2, 1996, pp. 1-18.
15
Table 4
SEX RATIOS OF DIFFERENT TRIBES IN TRIPURA
Census Year Sl. No.
Names of Tribe
1961 1971 1981 1991
1 Tripuri 958.2 955.4 965.6 -
2 Reang 953.4 934.8 954.8 -
3 Jamatia 999.3 978.7 989.5 -
4 Chakma 925.5 906.9 936.9 -
5 Halam 934.9 935.7 975.2 -
6 Noatia 940.4 954.3 943.2 -
7 Mog 936.3 940.2 941.6 -
8 Kuki 985.9 1156.0 943.5 -
9 Garo 957.9 1036.0 1008.8 -
10 Munda 944.9 935.2 907.6 -
11 Orang 915.4 1041.7 953.9 -
12 Other Tribes 932.0 960.6 910.5 -
All Tripura Tribes 955.0 954.3 962.0 965.2
All Tripura 932.0 943.0 946.0 946.0
All India 941.0 930.0 935.0 929.0
Source: Various Census Reports.

Journal of NEICSSR, Vol.-20, No.2, 1996, pp. 1-18.
16
Table 5
WORKERS AS PERCENTAGE OF POPULATION
IN DIFFERENT TRIBES IN TRIPURA
Census Year Sl. No. Names of Tribe
1961 1971 1981
1 Tripuri 49.35 29.59 40.10
2 Reang 56.20 37.29 44.68
3 Jamatia 51.72 30.76 41.34
4 Chakma 52.45 32.44 37.63
5 Halam 54.27 33.40 43.39
6 Noatia 54.37 32.11 43.72
7 Mog 52.76 32.38 42.06
8 Kuki 53.66 29.41 36.41
9 Garo 44.64 28.30 35.09
10 Munda 49.83 40.66 49.32
11 Orang 55.16 42.39 53.57
12 Other Tribes 62.69 33.72 44.91
All Tribes 51.59 31.55 41.25
Source: Various Census Reports.
Journal of NEICSSR, Vol.-20, No.2, 1996, pp. 1-18.
17
Table 6
PERCENTAGE OF FEMALE WORKERS IN TOTAL WORKERS
IN DIFFERENT TRIBES IN TRIPURA
Census Year Sl. No. Names of Tribe
1961 1971 1981
1 Tripuri 45.87 12.32 32.81
2 Reang 46.61 19.86 33.76
3 Jamatia 47.60 14.47 36.61
4 Chakma 45.99 14.06 26.54
5 Halam 46.18 16.35 34.32
6 Noatia 44.56 10.34 37.68
7 Mog 43.63 12.42 30.74
8 Kuki 47.78 12.90 28.31
9 Garo 39.42 10.92 26.55
10 Munda 41.60 29.90 37.97
11 Orang 43.50 37.92 40.97
12 Other Tribes 36.34 25.75 35.78
All Tribes 45.70 14.78 33.11
Source: Various Census Reports.

Journal of NEICSSR, Vol.-20, No.2, 1996, pp. 1-18.
18
Table 7
PERCENTAGE OF WORKERS IN NON-PRIMARY SECTOR TO
TOTAL WORKERS IN DIFFERENT TRIBES IN TRIPURA
Census Year Sl. No. Names of Tribe
1961 1971 1981
1 Tripuri 8.49 4.08 6.44
2 Reang 6.66 1.03 2.04
3 Jamatia 2.73 1.36 1.83
4 Chakma 7.90 1.74 4.29
5 Halam 4.73 1.41 3.75
6 Noatia 8.89 1.51 2.32
7 Mog 11.24 3.16 3.34
8 Kuki 7.07 2.88 8.44
9 Garo 12.01 7.75 14.02
10 Munda 19.16 2.57 10.86
11 Orang 6.24 20.16 33.60
12 Other Tribes 13.20 9.51 16.39
All Tribes 7.87 3.26 5.65
Source: Various Census Reports.

Journal of NEICSSR, Vol.-20, No.2, 1996, pp. 1-18.
19
Table 8
LITERACY PERCENTAGE AMONG DIFFERENT TRIBES IN TRIPURA
Census Year Sl. No. Names of Tribe 1961 1971 1981
1 Tripuri M 21.85 F 03.12 T 12.68
27.52 07.58 07.78
38.73 15.12 27.13
2 Reang M 06.99 F 00.36 T 03.76
13.30 01.88 07.78
20.63 04.34 12.67
3 Jamatia M 19.50 F 00.80 T 10.16
25.32 04.06 14.81
34.91 10.64 22.84
4 Chakma M 14.14 F 01.03 T 07.84
21.05 03.55 12.73
28.38 08.25 18.64
5 Halam M 12.18 F 00.99 T 06.77
15.91 02.66 09.50
28.25 09.10 18.80
6 Noatia M 06.18 F 00.14 T 03.25
10.97 00.58 05.89
20.18 03.87 12.27
7 Mog M 18.56 F 01.89 T 10.50
19.06 02.95 11.25
17.93 05.10 11.71
8 Kuki M 14.61 F 03.64 T 09.17
22.85 06.93 14.31
44.01 27.29 35.90
9 Garo M 22.53 F 04.77 T 13.84
30.00 10.96 20.31
42.61 23.00 32.76
10 Munda M 04.81 F 00.23 T 02.58
07.35 00.46 04.02
12.67 02.79 07.97
11 Orang M 08.26 F 00.22 T 04.42
11.26 00.69 05.86
17.34 02.08 09.89
12 Other Tribes M 31.72 F 15.59 T 23.94
42.75 30.93 36.96
47.96 31.47 40.10
All Tribes M 17.37 F 02.31 T 10.01
23.60 06.04 15.03
33.49 12.27 23.09
All Tripura M 29.61 F 10.19 T 20.20
40.20 21.19 30.90
51.70 32.00 42.12
Source: Various Census Reports. Note: M and F refer to male and female respectively.
Journal of NEICSSR, Vol.-20, No.2, 1996, pp. 1-18.
20
Table 9
URBAN TRIBAL POPULATION AND THEIR PERCENTAGE IN TRIPURA
Census Year Sl. No. Names of Tribe
1961 1971 1981
1 Tripuri 3538 (1.86)
5051 (2.02)
6694 (2.02)
2 Reang 27 (0.05)
49 (0.07)
113 (0.13)
3 Jamatia 4 (0.02)
60 (0.17)
134 (0.30)
4 Chakma 84 (0.37)
95 (0.33)
204 (0.59)
5 Halam 4 (0.02)
25 (0.13)
45 (0.15)
6 Noatia 3 (0.02)
13 (0.13)
11 (0.15)
7 Mog 14 (0.13)
21 (0.16)
49 (0.27)
8 Kuki Nil (NA)
8 (0.10)
100 (1.82)
9 Garo 9 (0.16)
37 (0.66)
110 (1.51)
10 Munda Nil (NA)
1 (0.02)
7 (0.09)
11 Orang Nil (NA)
2 (0.06)
30 (0.57)
12 Other Tribes 15 (0.26)
123 (1.60)
171 (1.83)
All Tribes 3698 (1.03)
5485 (1.22)
7668 (1.31)
Source: Various Census Reports.

Journal of NEICSSR, Vol.-20, No.2, 1996, pp. 1-18.
21
Table 10 CORRELATION COEFFICIENTS BETWEEN
POPULATION GROWTH RATE AND OTHER SOCIO-ECONOMIC VARIABLES
Correlation Coefficients between Population Growth Rate and
Period Total
Literacy Female Literacy
Urbanization Female Workers
Workers in Non-Primary
Sector
1961-71 0.3421 0.2627 0.2276 0.1690 0.0393
1971-81 -0.3281 -0.3381 -0.2655 0.2381 0.3029
1961-81 -0.1287 -0.1517 -0.0848 0.1620 0.2330
REFERENCES
1. Bhattacharjee, P.R. and Ganguly, J.B. (1993): “Relative Economic Status of
Social Groups in Tripura: A Study in Inequality”, Journal of NEICSSR, Vol. 17,
No. 2, pp. 13-23.
2. Department of Analytical and Applied Economics (1988): Evaluation of Jhumia
Rehabilitation Schemes in Tripura, Tripura University, Agartala.
3. Ganguly, J.B. (1990): “Pattern and Occupational Structure of Tribal Population in
Tripura”, in Ashish Bose et al (eds.) Tribal Demography and Development in
North-east India, B.R. Publishing Corporation, Delhi.
4. Roy Barman, B.K. (1970): Demographic and Socio-Economic Profiles of the Hill
Areas of North-East India, Census of India 1961.
-----------0----------


