Population GeographyPopulation Geography
A Look at MigrationA Look at Migration
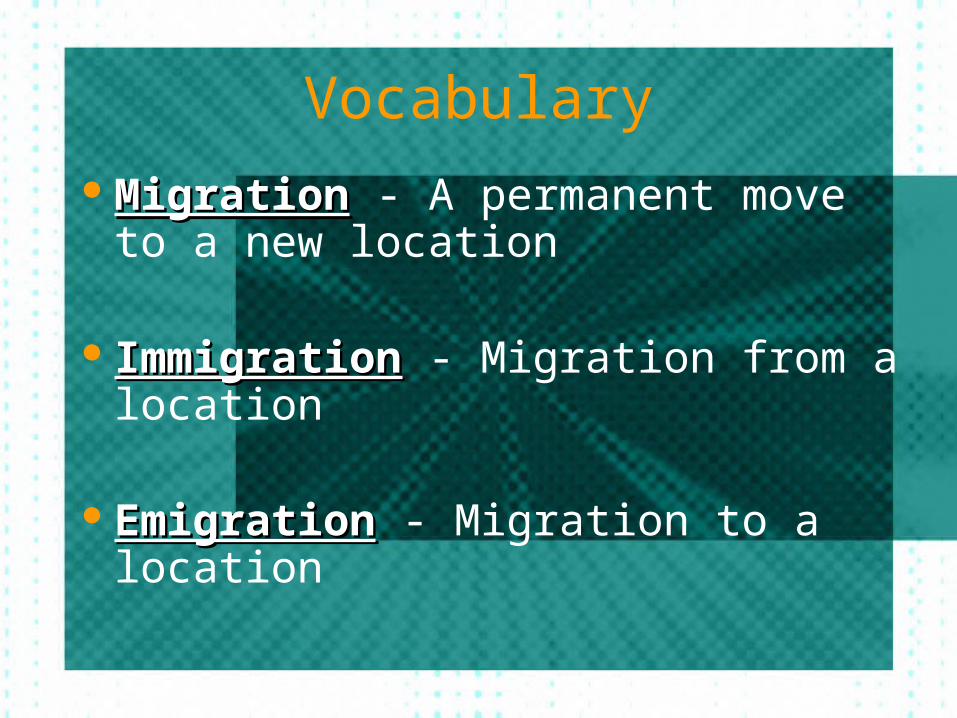
Vocabulary
MigrationMigration - A permanent move to a new location
ImmigrationImmigration - Migration from a location
EmigrationEmigration - Migration to a location
Reasons for Migration Three general reasons: economic,
cultural, & environmental All reasons relate to push and pull
factors People view current residence so
negatively that they moved People view another place so attractively
that they move to it EXAMPLES???????
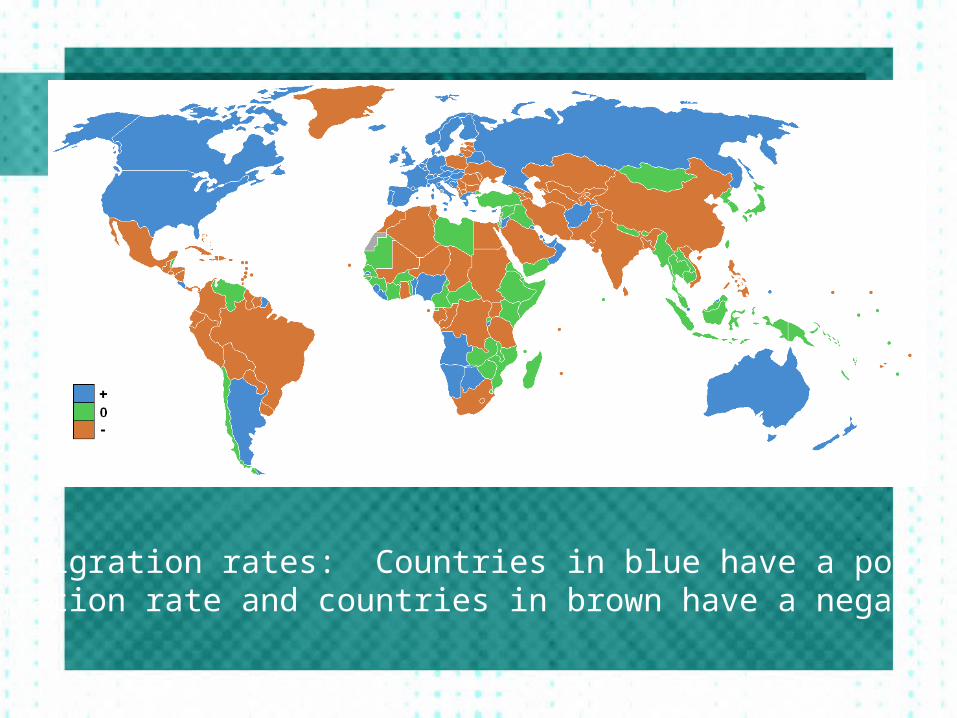
Net migration rates: Countries in blue have a positive migration rate and countries in brown have a negative.
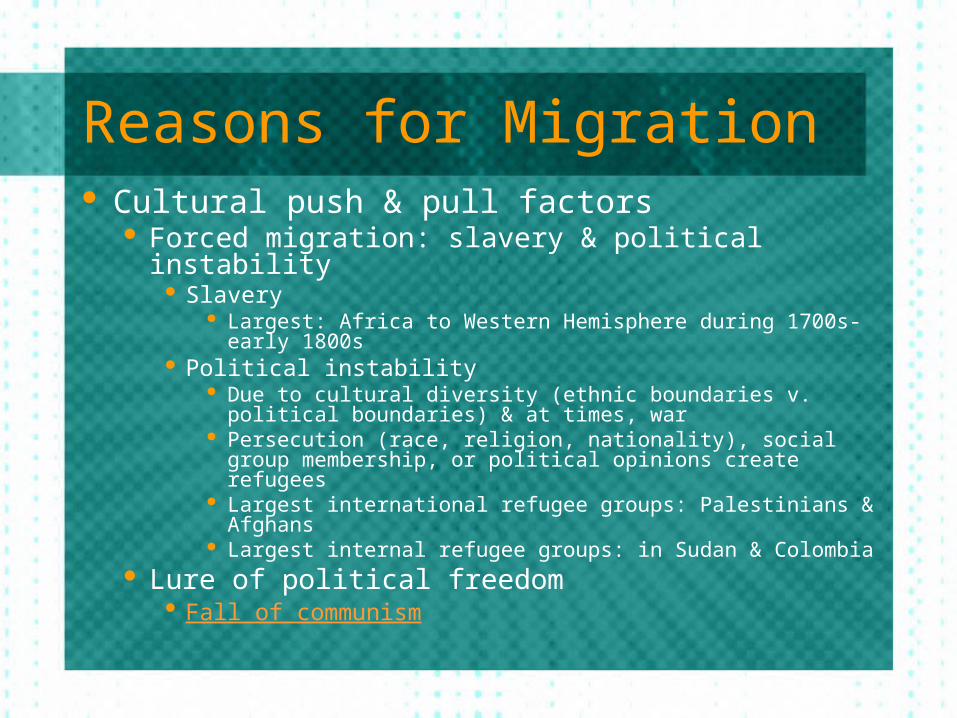
Reasons for Migration Cultural push & pull factors
Forced migration: slavery & political instability Slavery
Largest: Africa to Western Hemisphere during 1700s-early 1800s
Political instability Due to cultural diversity (ethnic boundaries v. political
boundaries) & at times, war Persecution (race, religion, nationality), social group
membership, or political opinions create refugees Largest international refugee groups: Palestinians &
Afghans Largest internal refugee groups: in Sudan & Colombia
Lure of political freedom Fall of communism
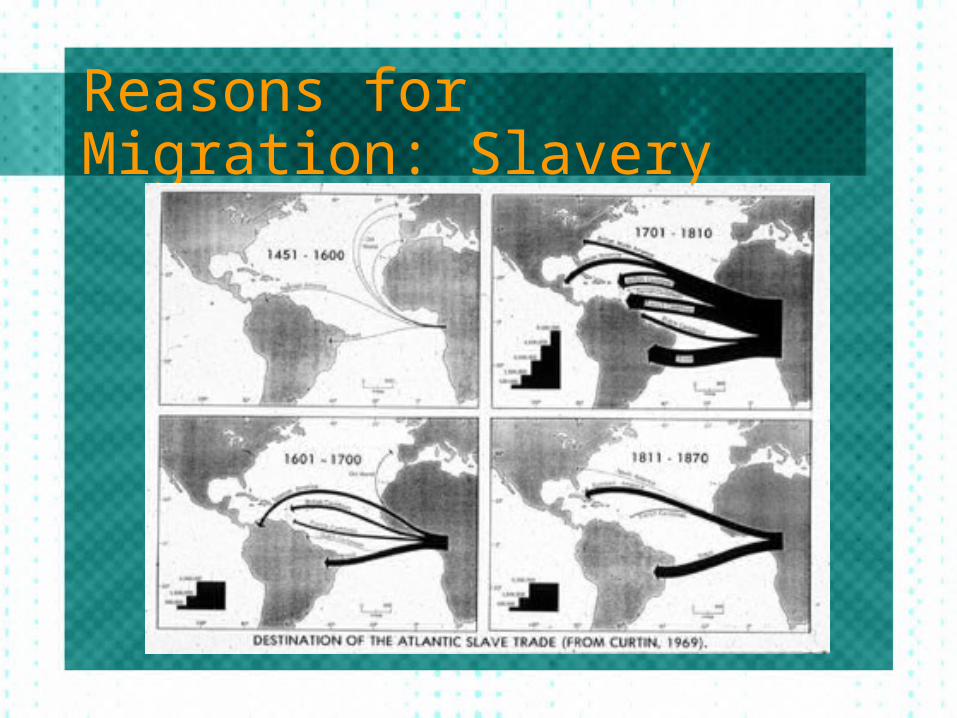
Reasons for Migration: Slavery
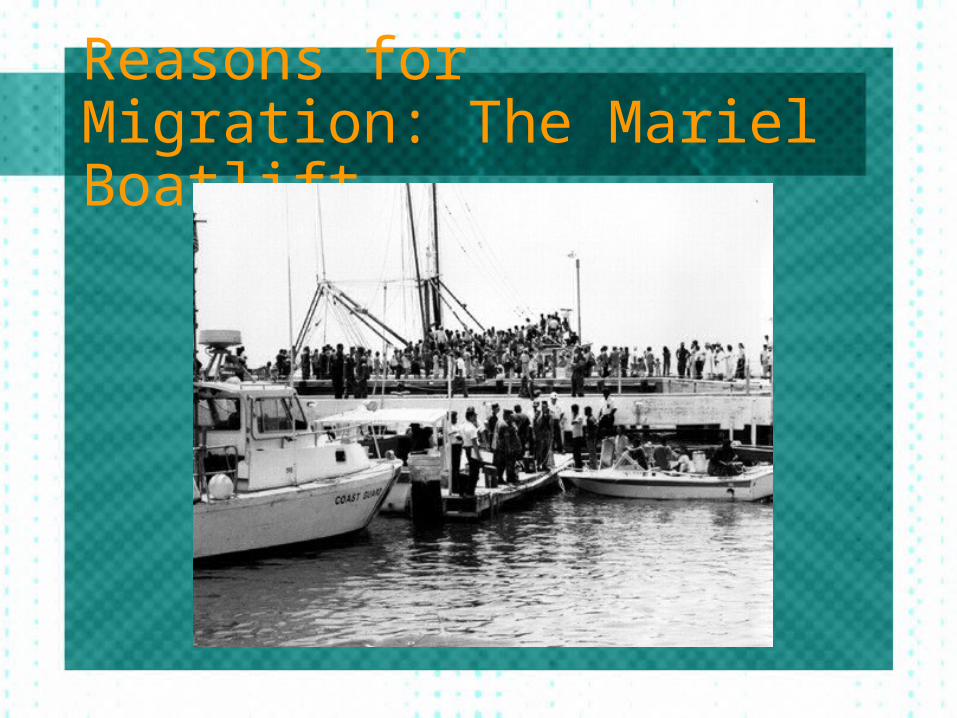
Reasons for Migration: The Mariel Boatlift
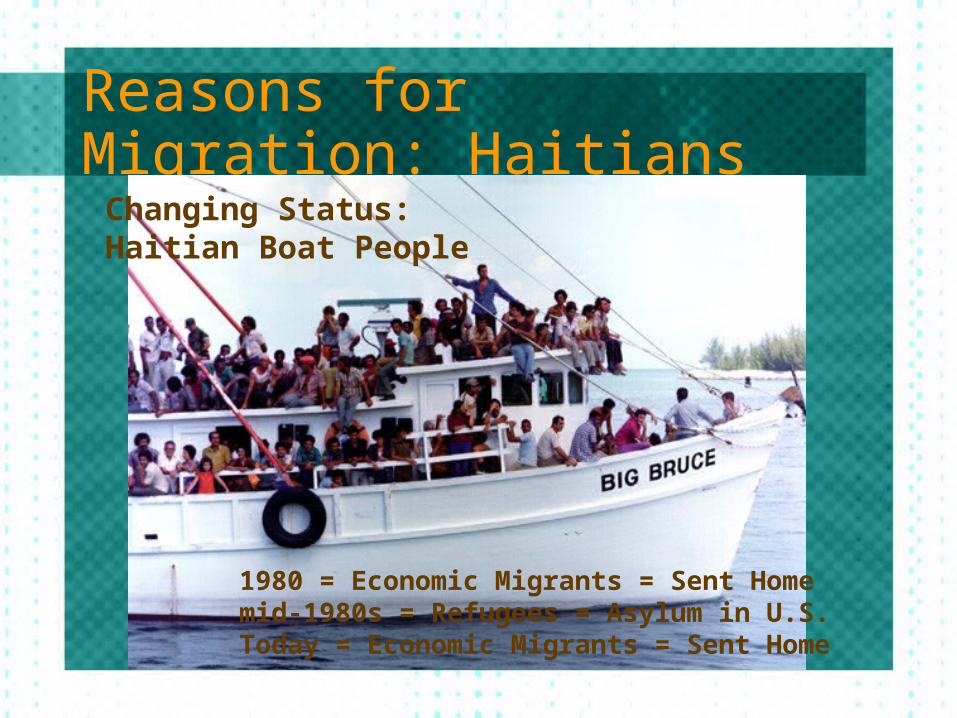
Reasons for Migration: Haitians
Changing Status:Haitian Boat People
1980 = Economic Migrants = Sent Homemid-1980s = Refugees = Asylum in U.S.Today = Economic Migrants = Sent Home

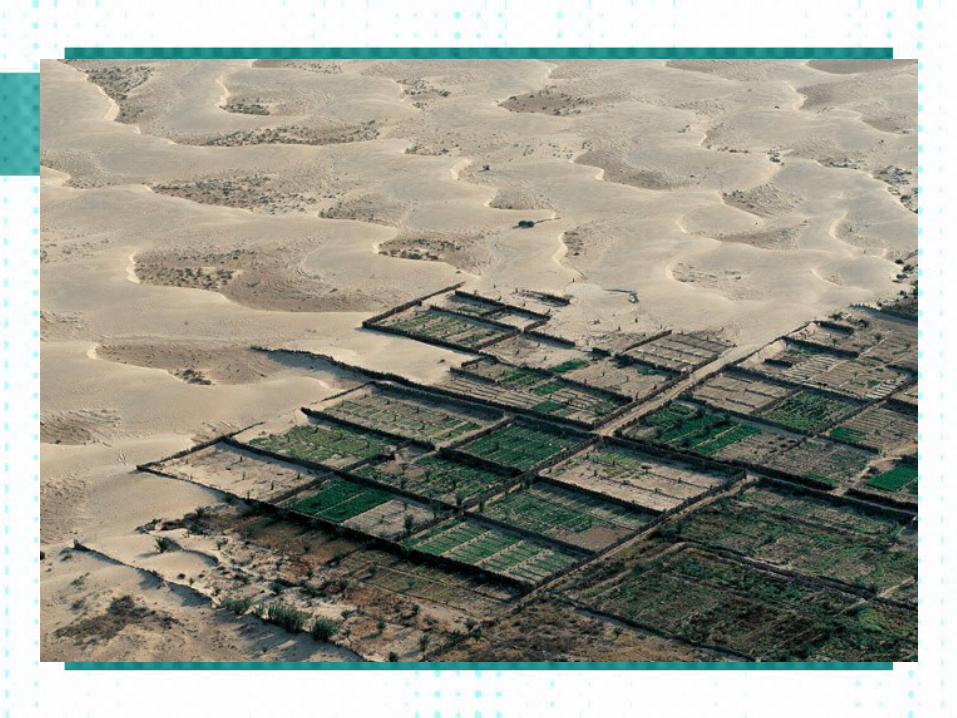
Reasons for Migration: Farmland
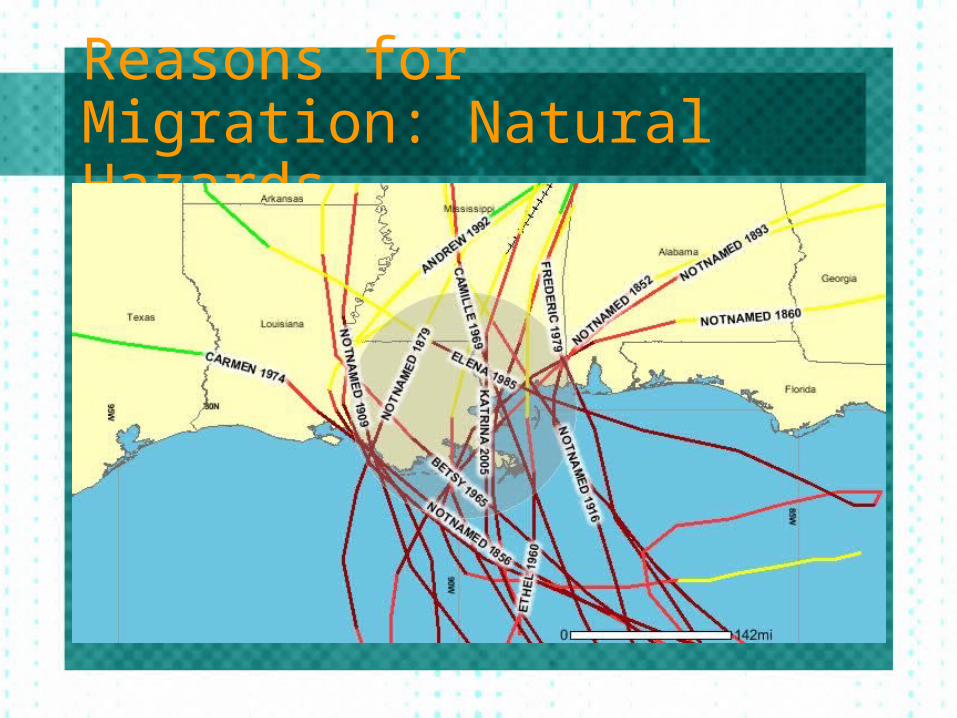
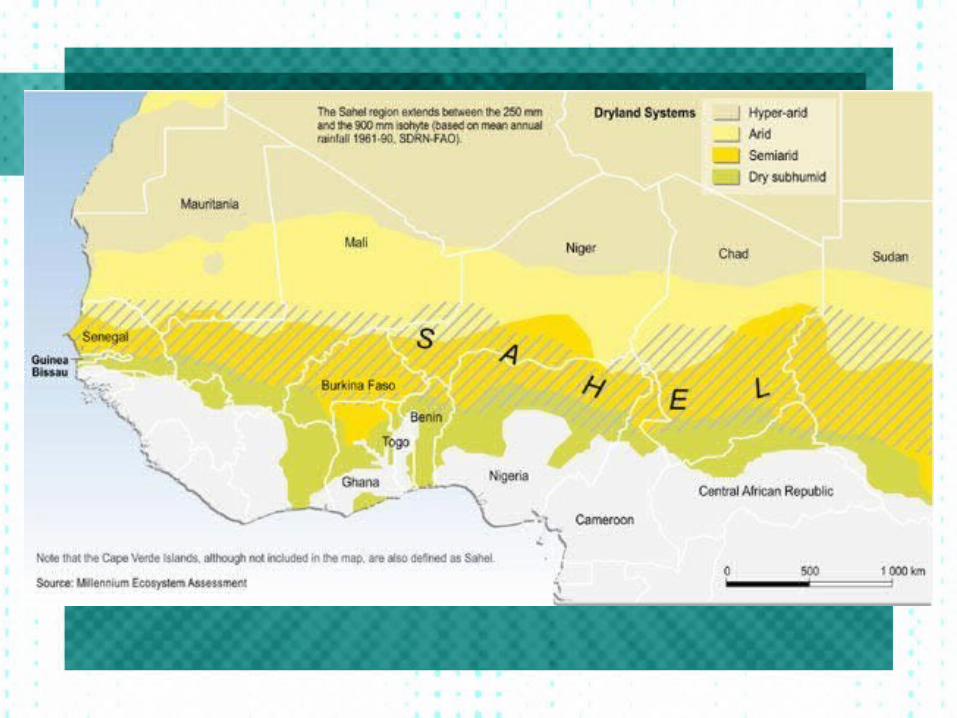
Reasons for Migration: Natural Hazards
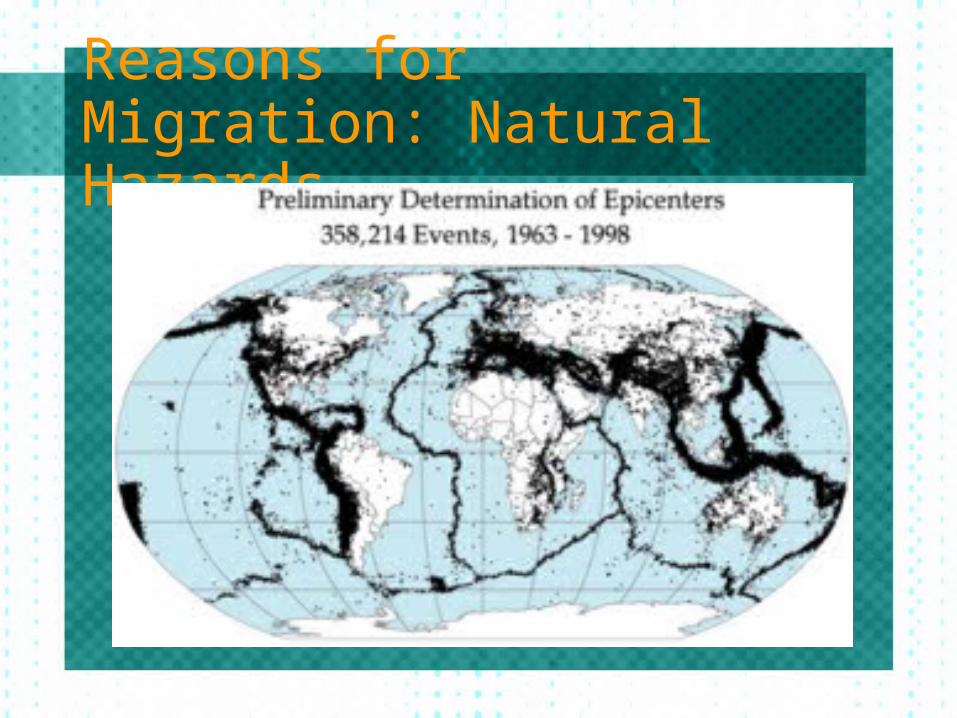
Reasons for Migration: Natural Hazards

Reasons for Migration: Natural Hazards
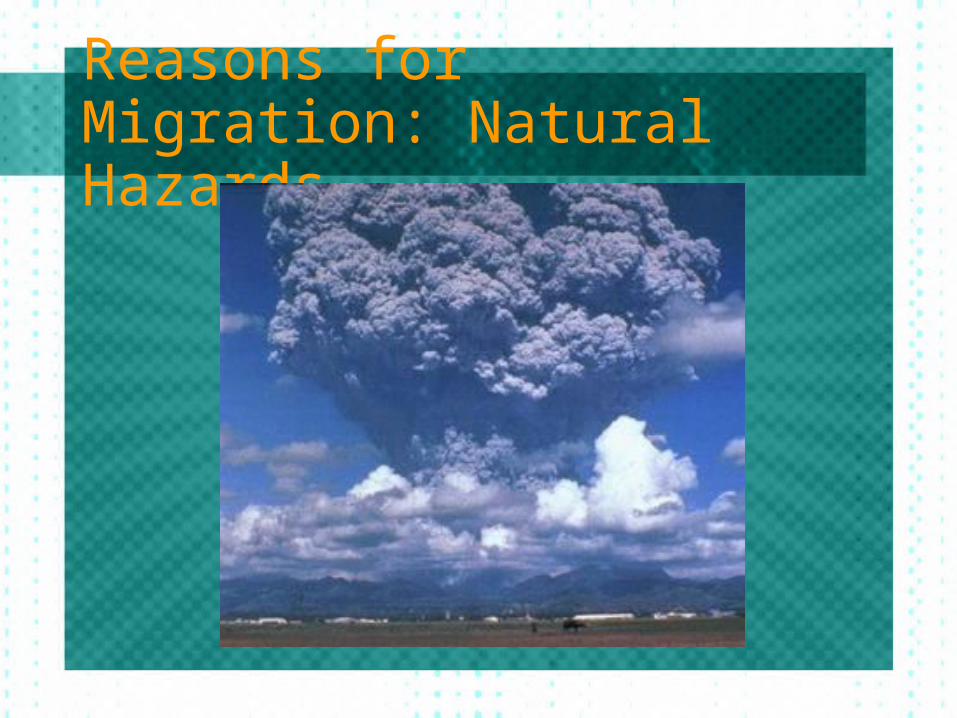
Reasons for Migration: Natural Hazards

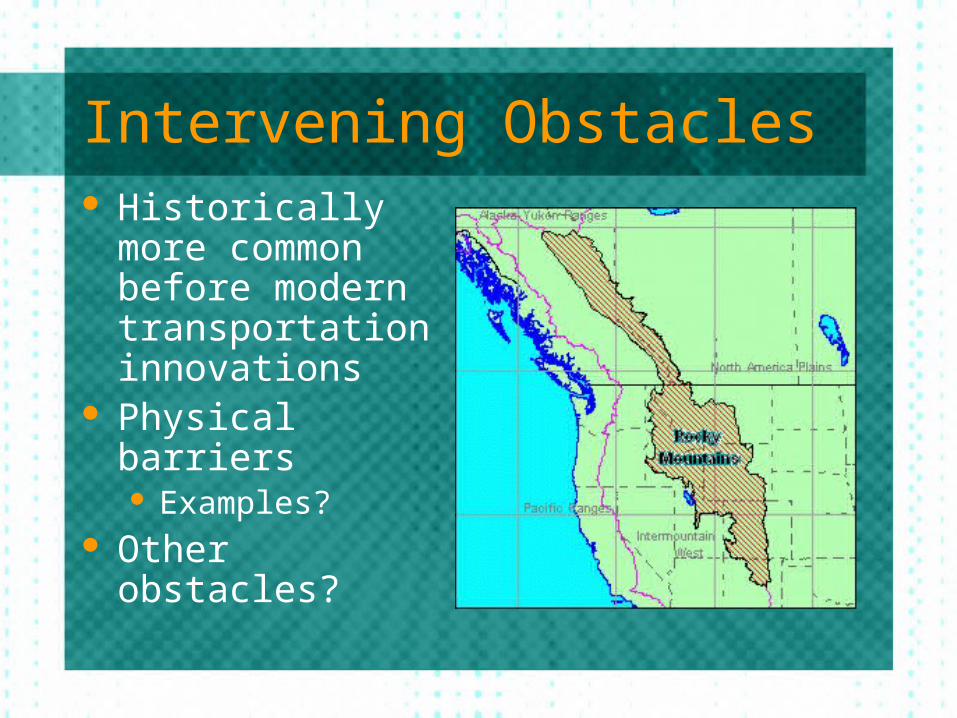
Intervening Obstacles Historically more
common before modern transportation innovations
Physical barriers Examples?
Other obstacles?
Distance of Migration Internal migration
Most migrants relocate in same country Interregional v. intraregional
Most common interregional = rural to urbanMost common in developed countries = older
cities to newer suburbs
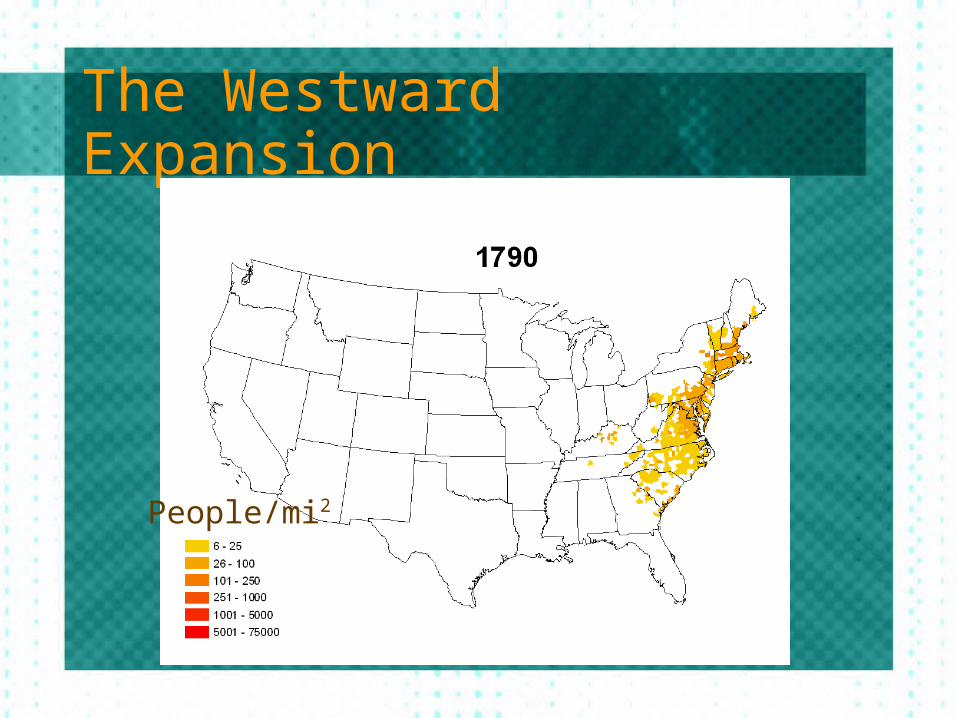
The Westward Expansion
People/mi2
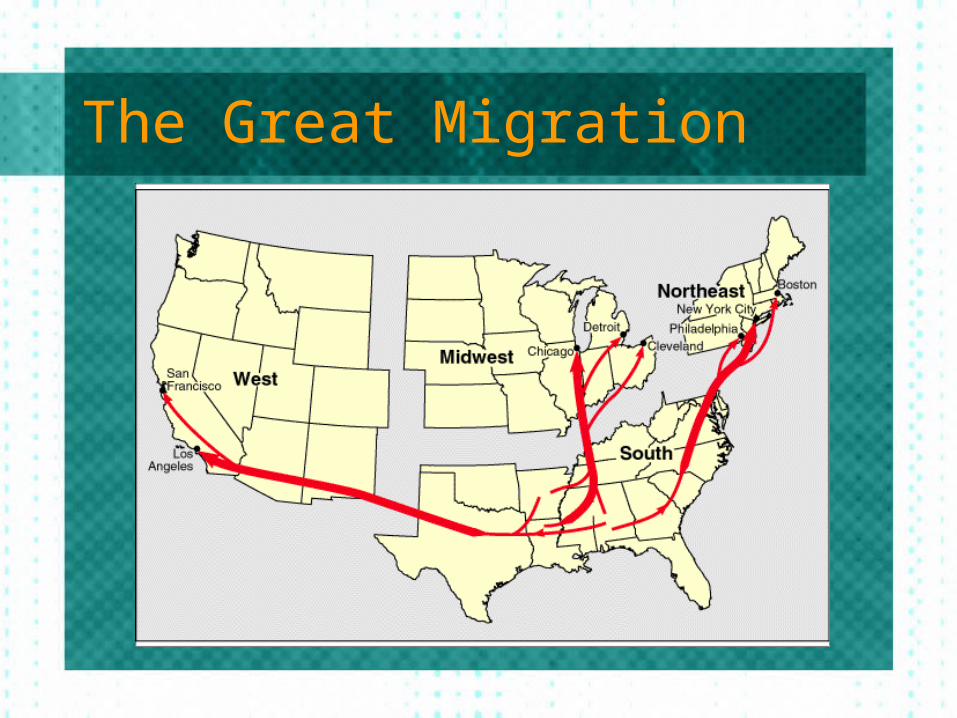
The Great Migration
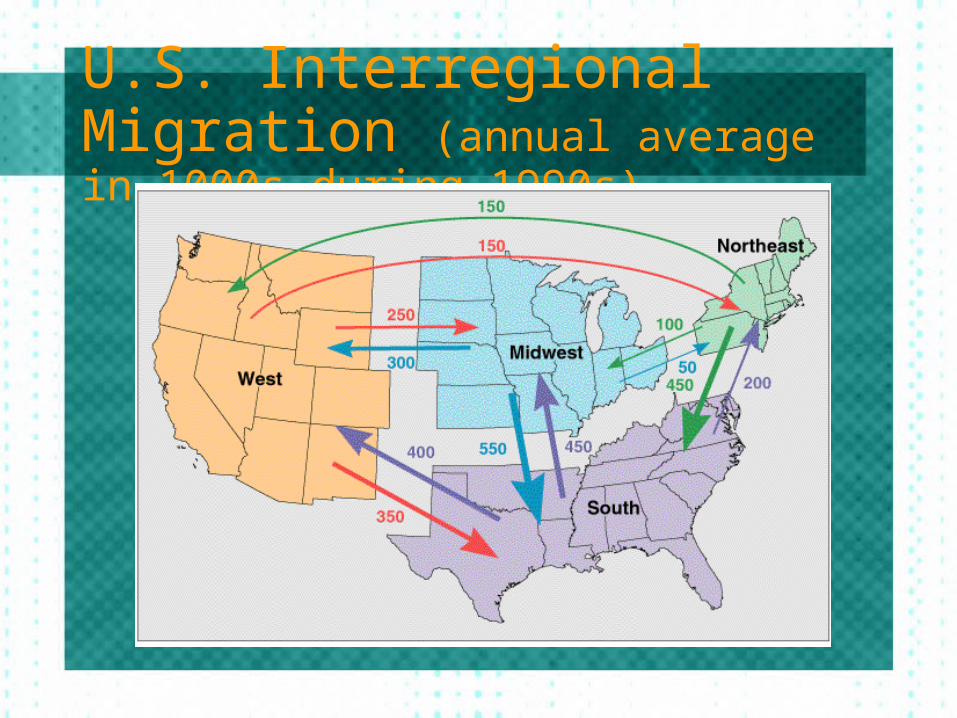
U.S. Interregional Migration (annual average in 1000s during 1990s)
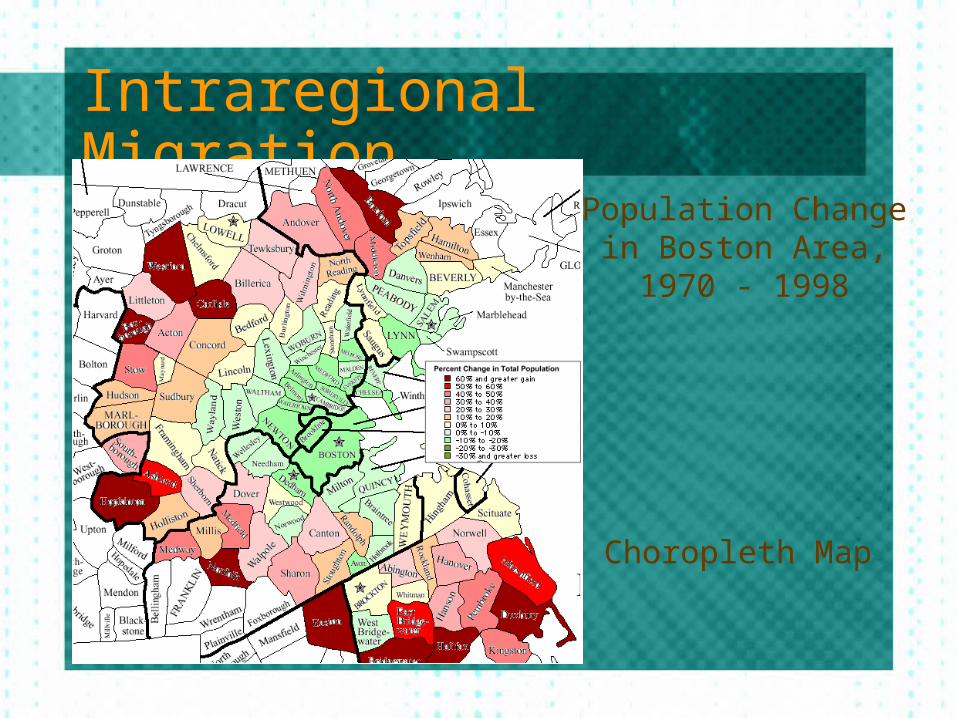
Intraregional MigrationPopulation Change
in Boston Area,1970 - 1998
Choropleth Map
Distance Migration International Migration
Forced v. voluntary Forced = cultural factors Voluntary = economic factors
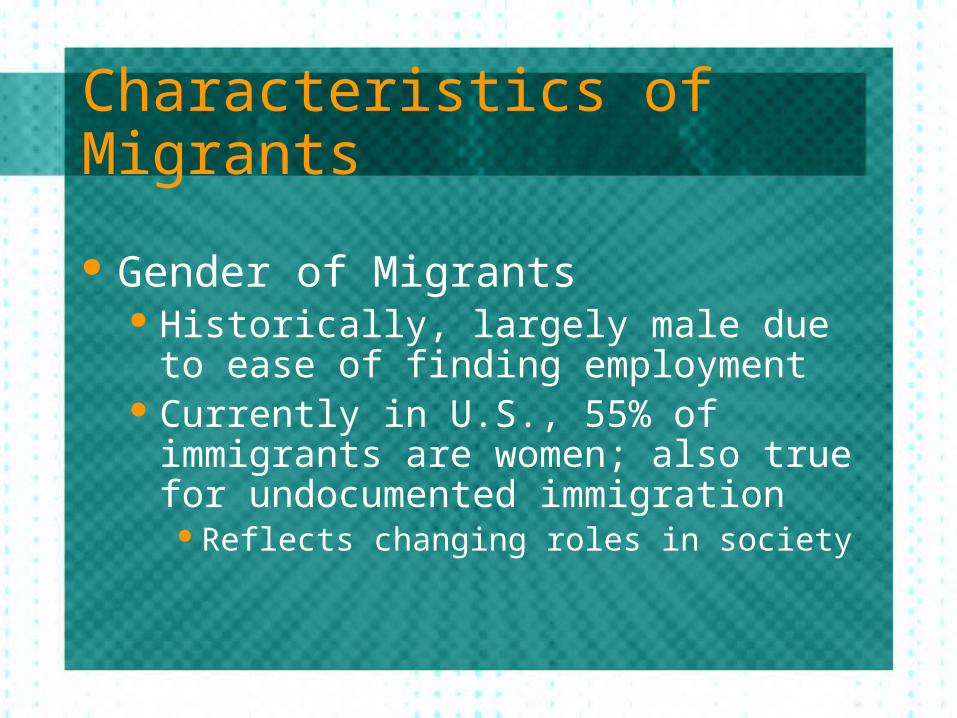
Characteristics of Migrants
Gender of Migrants Historically, largely male due to ease of
finding employment Currently in U.S., 55% of immigrants are
women; also true for undocumented immigration
Reflects changing roles in society
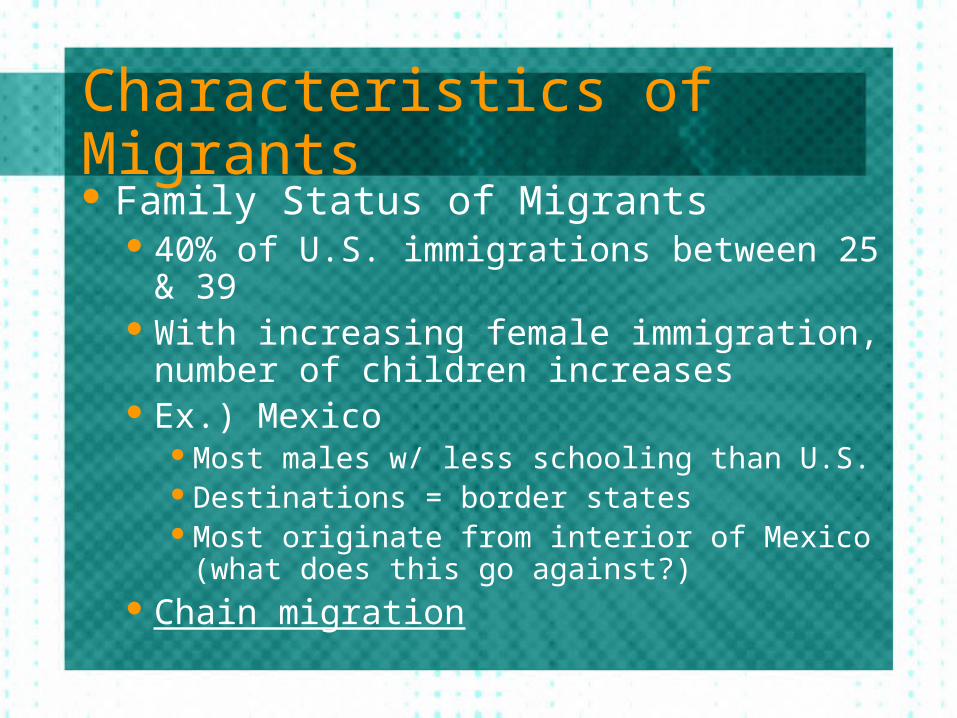
Characteristics of Migrants Family Status of Migrants
40% of U.S. immigrations between 25 & 39 With increasing female immigration,
number of children increases Ex.) Mexico
Most males w/ less schooling than U.S.Destinations = border statesMost originate from interior of Mexico (what
does this go against?) Chain migration
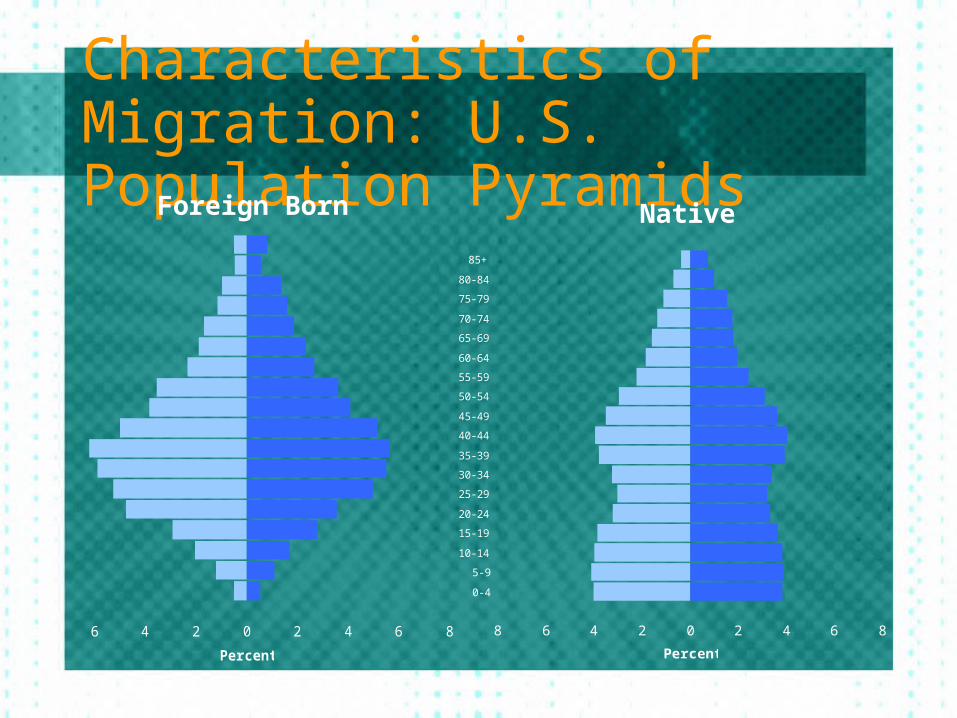
Characteristics of Migration: U.S. Population Pyramids
8 6 4 2 0 2 4 6 8
Percent
8 6 4 2 0 2 4 6 8
0-4
5-9
10-14
15-19
20-24
25-29
30-34
35-39
40-44
45-49
50-54
55-59
60-64
65-69
70-74
75-79
80-84
85+
Percent
NativeForeign Born
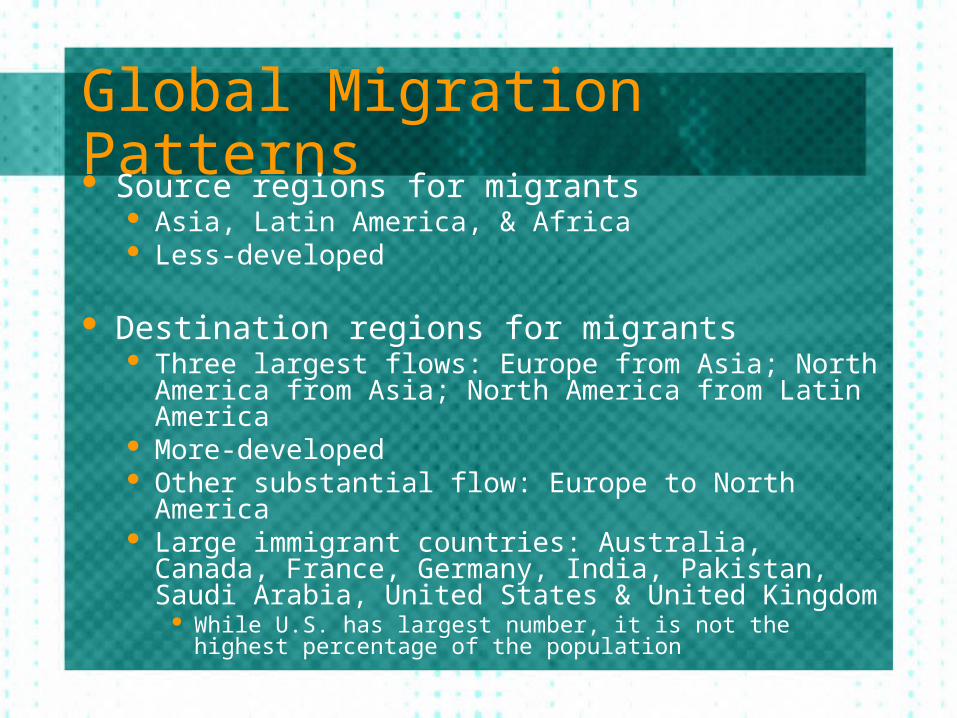
Global Migration Patterns Source regions for migrants
Asia, Latin America, & Africa Less-developed
Destination regions for migrants Three largest flows: Europe from Asia; North America
from Asia; North America from Latin America More-developed Other substantial flow: Europe to North America Large immigrant countries: Australia, Canada, France,
Germany, India, Pakistan, Saudi Arabia, United States & United Kingdom
While U.S. has largest number, it is not the highest percentage of the population
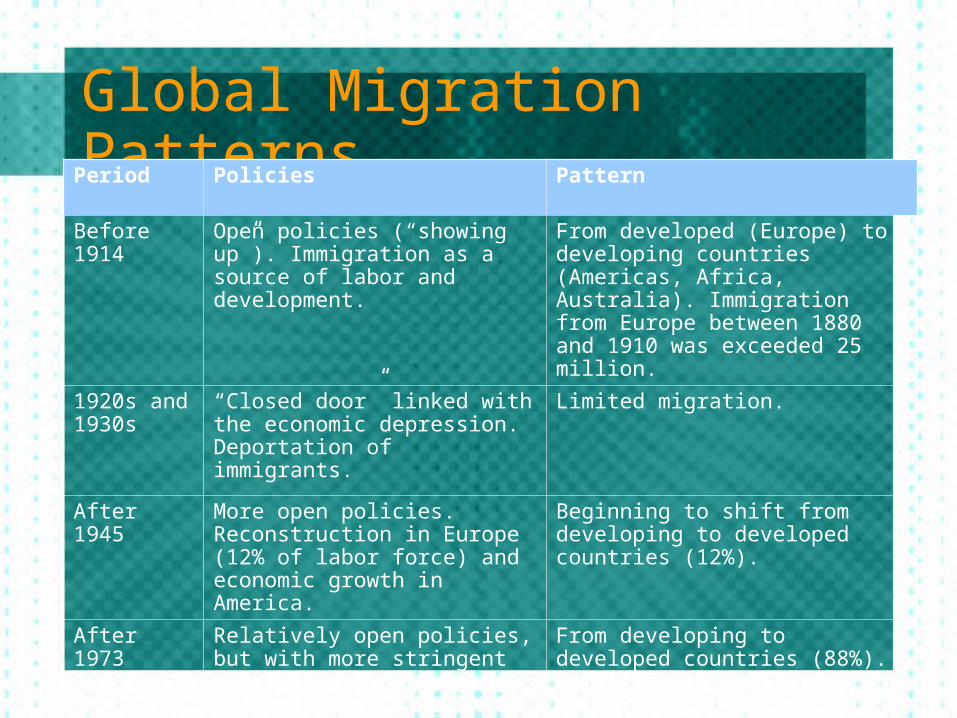
Global Migration PatternsPeriod Policies Pattern
Before 1914 Open policies (“showing up”). Immigration as a source of labor and development.
From developed (Europe) to developing countries (Americas, Africa, Australia). Immigration from Europe between 1880 and 1910 was exceeded 25 million.
1920s and 1930s
“Closed door” linked with the economic depression. Deportation of immigrants.
Limited migration.
After 1945 More open policies. Reconstruction in Europe (12% of labor force) and economic growth in America.
Beginning to shift from developing to developed countries (12%).
After 1973 Relatively open policies, but with more stringent requirements. Growth of refugees and illegal immigration.
From developing to developed countries (88%). 3 million illegal immigrants entering the US per year. Estimates of 20 million illegals in the US alone.
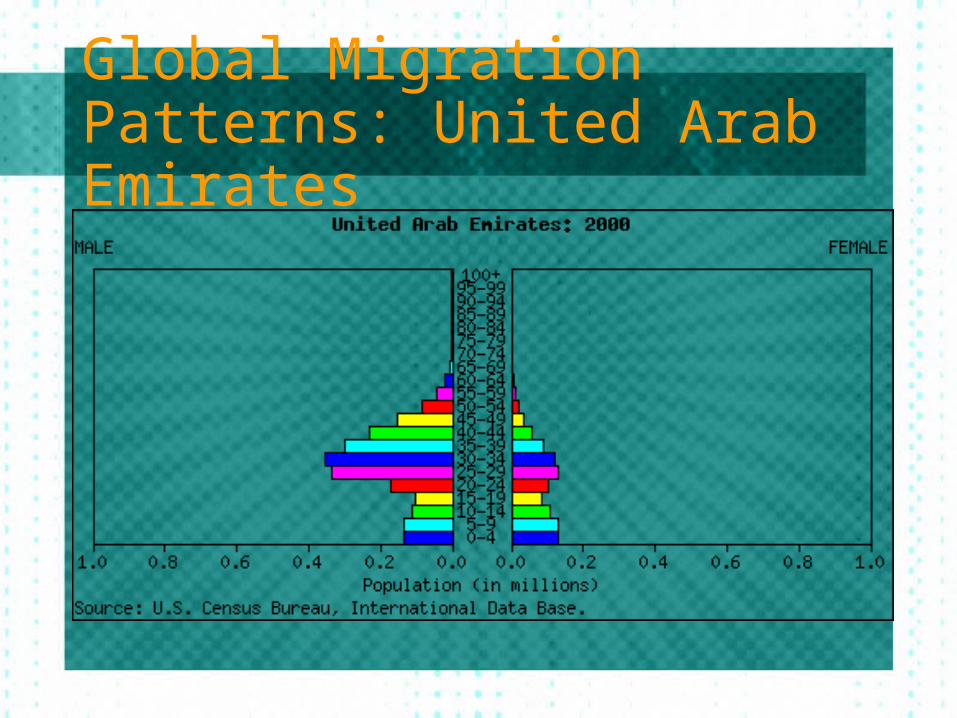
Global Migration Patterns: United Arab Emirates
U.S. Immigration Patterns World’s third most populous country Inhabited overwhelmingly by descendents of
immigrants Appx. 70 million migrated to the U.S. since 1820, &
30 million still alive Three main eras of immigration
Colonization mid-19th century to early 20th century 1970s to present (continues) Each era drew migrants from different regions, but
push/pull factors the same Economic opportunities limited in regions of origins due to
population growth
U.S. Immigration Patterns
U.S. Immigration Patterns Colonial Immigration from Europe & Africa
European immigrants = mostly English (90%) Mostly voluntary migrants, but harsh economic &
persecution blurred the line between voluntary & forced at times
1 million prior to independence 1 million between late 1700s & 1840
African immigrants = forced migration through slavery
Most African Americans descend from former slaves Appx. 400k during colonial times Another 250k in first half of 19th century, despite 1808
law making slave imports illegal
U.S. Immigration Patterns 19th Century Immigration from Europe
40 million Europeans migrated to the U.S. Pull factor: economic opportunities Migrants extolled virtues to friends & families at
home, encouraging others to come Chain migration
Largest European source countries: Germany, Italy, United Kingdom, Ireland, & former Soviet Union
1/4 of Americans trace routes to German; 1/8 each to Irish & English
European boundary changes make exact country numbers difficult
Ex.) Poles
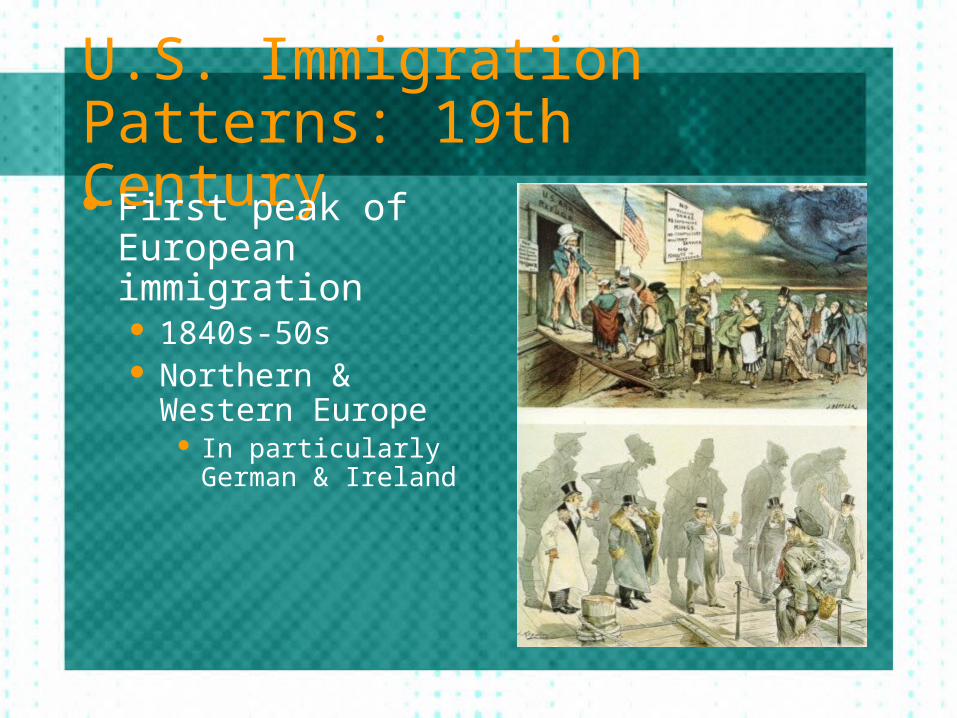
U.S. Immigration Patterns: 19th Century First peak of
European immigration 1840s-50s Northern & Western
Europe In particularly German
& Ireland
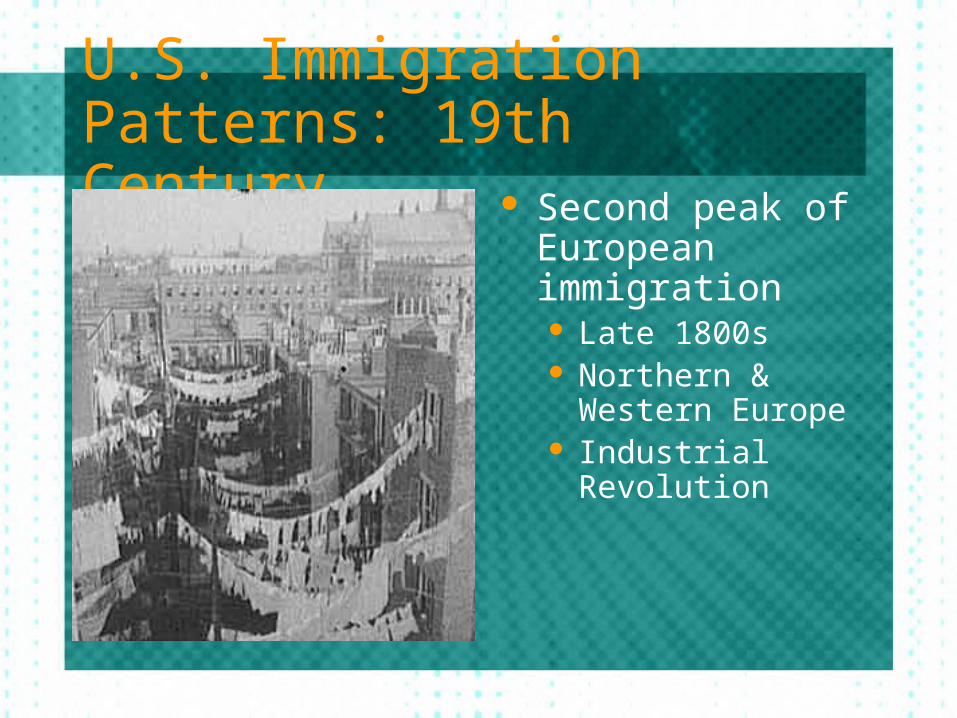
U.S. Immigration Patterns: 19th Century
Second peak of European immigration Late 1800s Northern & Western
Europe Industrial Revolution
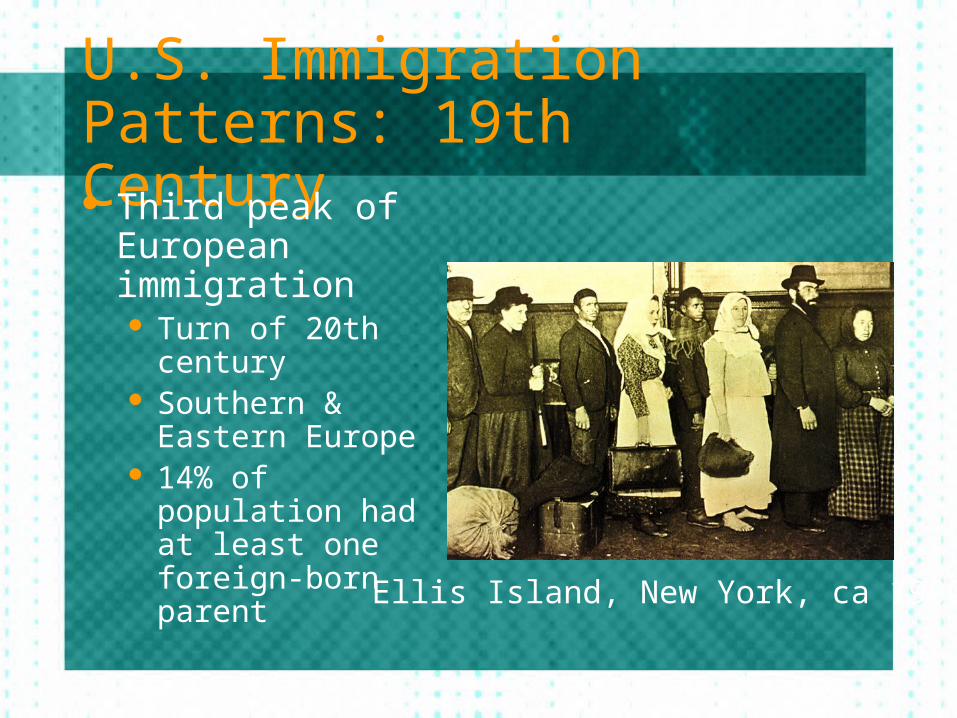
U.S. Immigration Patterns: 19th Century Third peak of
European immigration Turn of 20th
century Southern &
Eastern Europe 14% of population
had at least one foreign-born parent Ellis Island, New York, ca 1900
U.S. Immigration Patterns
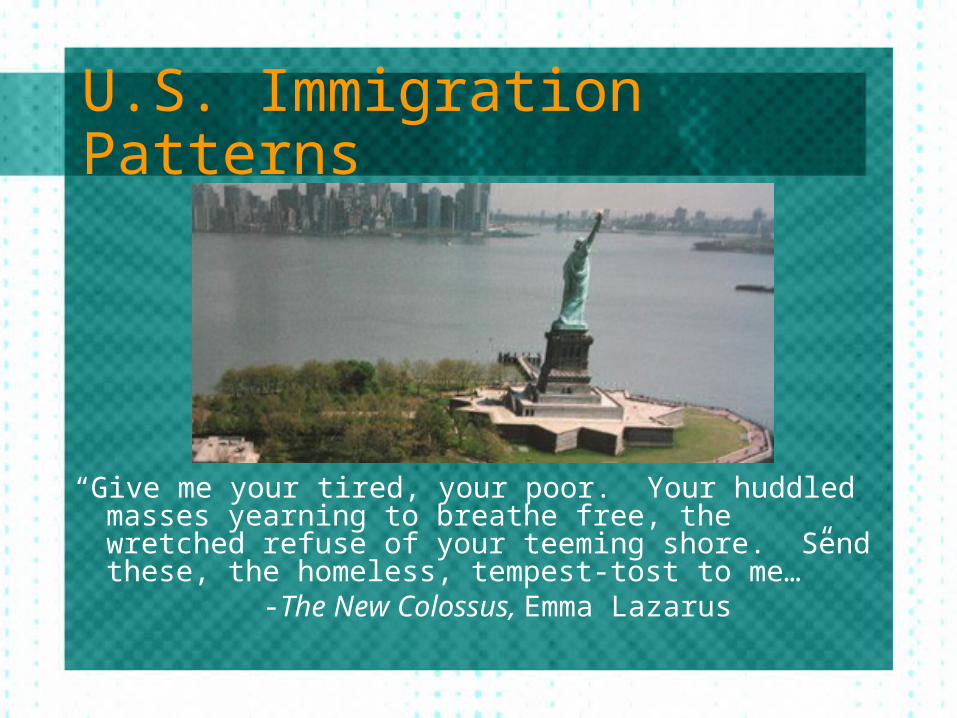
“Give me your tired, your poor. Your huddled masses yearning to breathe free, the wretched refuse of your teeming shore. Send these, the homeless, tempest-tost to me…”
-The New Colossus, Emma Lazarus
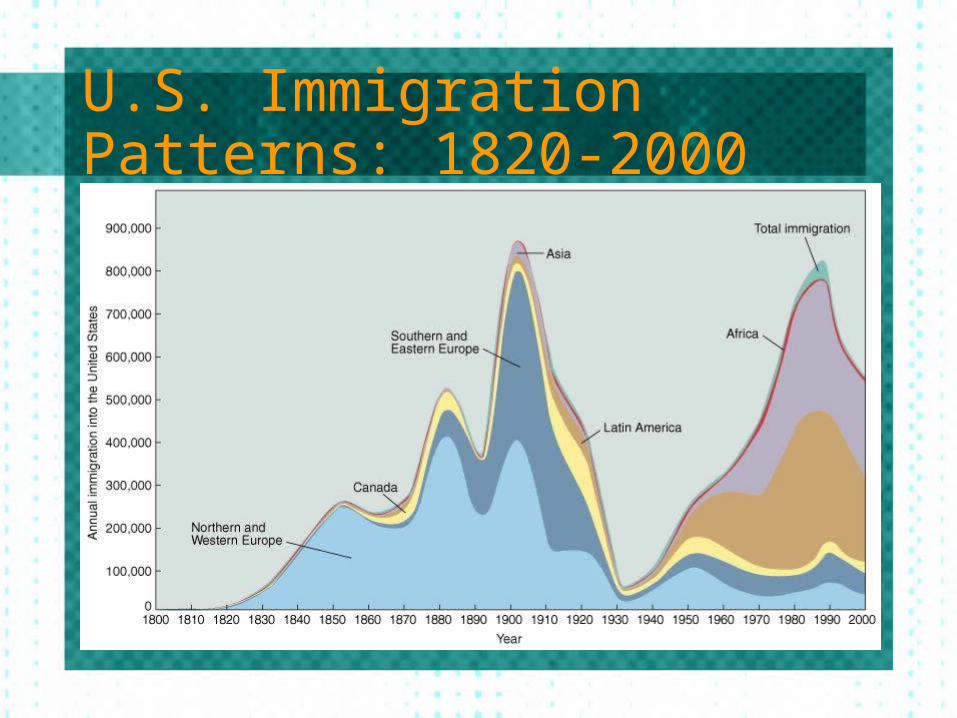
U.S. Immigration Patterns: 1820-2000
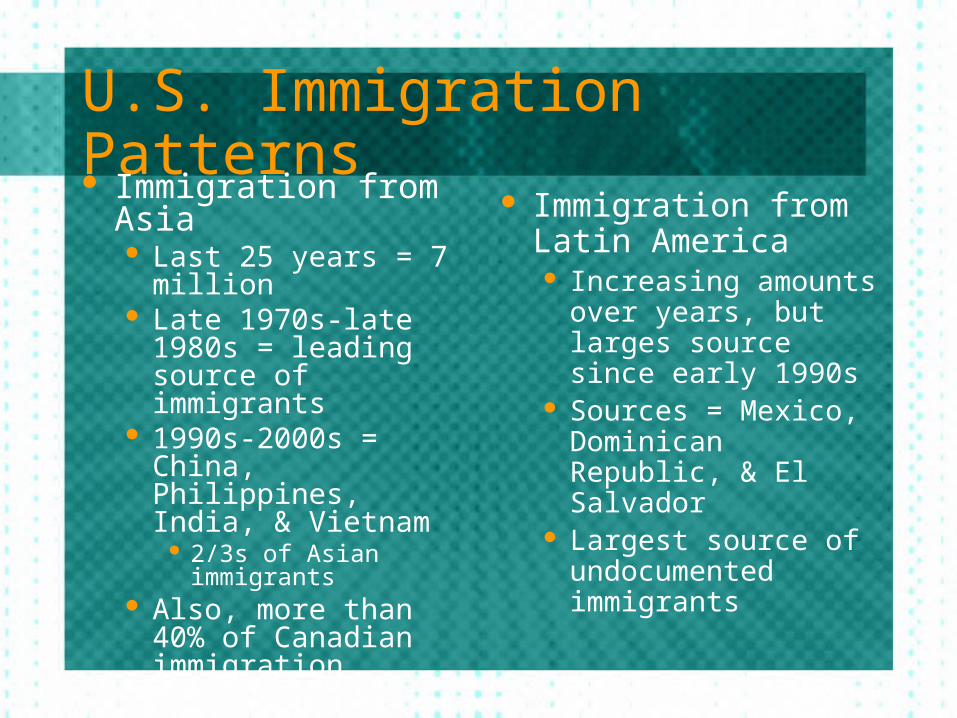
U.S. Immigration Patterns Immigration from
Asia Last 25 years = 7
million Late 1970s-late
1980s = leading source of immigrants
1990s-2000s = China, Philippines, India, & Vietnam
2/3s of Asian immigrants
Also, more than 40% of Canadian immigration
Immigration from Latin America Increasing amounts
over years, but larges source since early 1990s
Sources = Mexico, Dominican Republic, & El Salvador
Largest source of undocumented immigrants
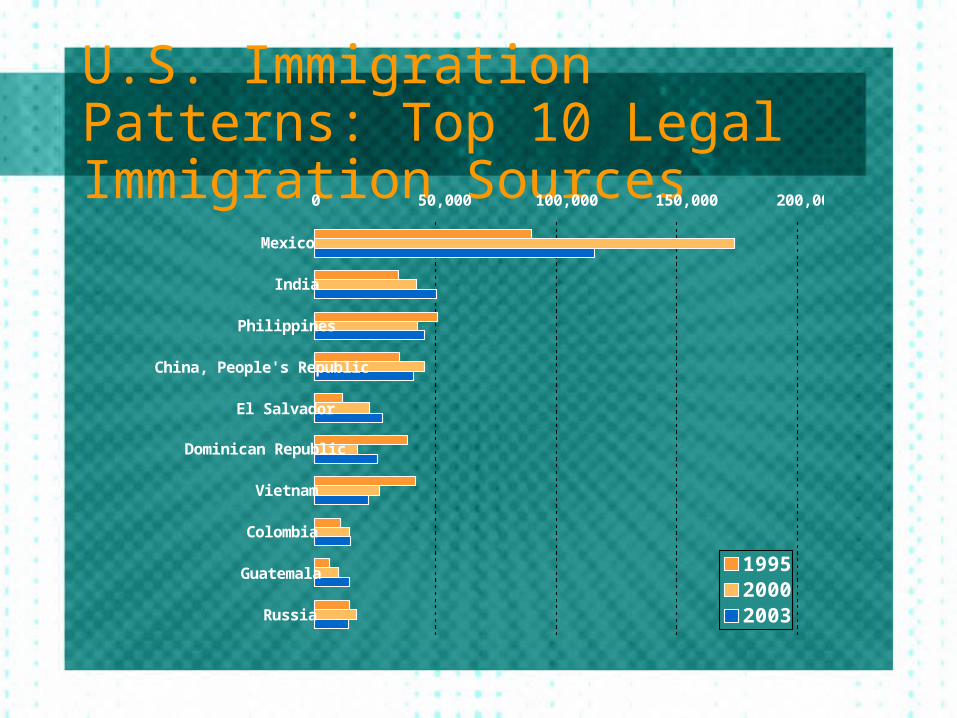
U.S. Immigration Patterns: Top 10 Legal Immigration Sources
0 50,000 100,000 150,000 200,000
Mexico
India
Philippines
China, People's Republic
El Salvador
Dominican Republic
Vietnam
Colombia
Guatemala
Russia
199520002003
Impact of Immigration on the United States Legacy of European migration
Era ended with beginning of WWI Europe’s demographic transition
Rapid population growth fueled emigration (stage 2) due to limited economic opportunities
Other factor: enclosure movements & displaced farmers
U.S. = Europe’s population safety valve Diffusion of European culture
Spread of Indo-European languages, Christianity, as well as fine arts & ideals
Seeds of conflict planted in Africa & Asia
Impact of Immigration on the United States Undocumented immigration to the
United States Appx. 9.3 million (give or take) Mostly looking for employment
Agriculture, construction, industrial Two methods of entry
Half arrive legally as students/tourists & stayRest slip across the border
1986 Immigration Reform & Control Act Current efforts
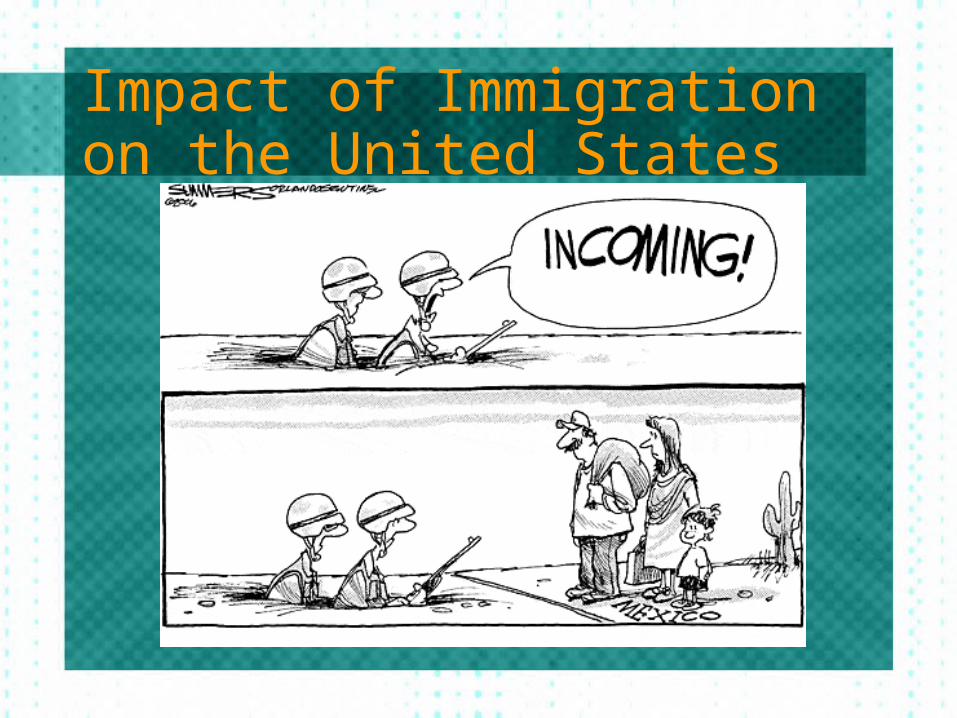
Impact of Immigration on the United States
Impact of Immigration on the United States Destination of immigrants within the
United States Most common = California, Texas, New
York, & Florida Immigrants cluster near those from own
country Distance decay does not always apply
Ex.) Cubans (Florida) v. Iranians (California)
Migration in Other Countries Russia
Forced v. voluntary migration to Siberia Development policies Emigration
Brazil Movement to the interior Rural-urban migration
Indonesia Pays people to move from Java to lesser
populated islands
Migration in Other Countries Europe
Highest per capita income countries = destination countries
Eastern Europe to Western EuropeEx.) Poles to Ireland
Also, within countriesEx.) Italy & United Kingdom
India Restrict ability to move between regions
Ex.) Assam


