Download - pepco POMSlides

Pepco Holdings, Inc.Pepco Holdings, Inc.
Analyst ConferenceOctober 5-6, 2004
Safe Harbor StatementSome of the statements contained in this presentation are forward-looking statements within the meaning of Section 21E of the Securities Exchange Act of 1934 and are subject to the safe harbor created by the Private Securities Litigation Reform Act of 1995. These statements include all financial projections and any declarations regarding management’s intents, beliefs or current expectations. In some cases, you can identify forward-looking statements by terminology such as “may,” “will,” “should,” “expects,” “plans,” “anticipates,”“believes,” “estimates,” “predicts,” “potential” or “continue” or the negative of such terms or other comparable terminology. Any forward-looking statements are not guarantees of future performance, and actual results could differ materially from those indicated by the forward-looking statements. Forward-looking statements involve estimates, assumptions, known and unknown risks, uncertainties and other factors that may cause actual results, levels of activity, performance or achievements to be materially different from any future results, levels of activity, performance or achievements expressed or implied by such forward-looking statements. Each forward-looking statement speaks only as of the date of the particular statement, and we undertake no obligation to publicly update or revise any forward-looking statement, whether as a result of new information, future events or otherwise.
1
A number of factors could cause actual results or outcomes to differ materially from those indicated by the forward-looking statements contained in this presentation. These factorsinclude, but are not limited to, prevailing governmental policies and regulatory actions affecting the energy industry, including with respect to allowed rates of return, industry and rate structure, acquisition and disposal of assets and facilities, operation and construction of plant facilities, recovery of purchased power expenses, and present or prospective wholesale and retail competition; changes in and compliance with environmental and safety laws and policies; weather conditions; population growth rates and demographic patterns; competition for retail and wholesale customers; general economic conditions, including potential negative impacts resulting from an economic downturn; growth in demand, sales and capacity to fulfill demand; changes in tax rates or policies or in rates of inflation; changes in project costs; unanticipated changes in operating expenses and capital expenditures; the ability to obtain funding in the capital markets on favorable terms; restrictions imposed by the Public Utility Holding Company Act; legal and administrative proceedings (whether civil or criminal) and settlements that influence our business and profitability; pace of entry into new markets; volatility in market demand and prices for energy, capacity and fuel; interest rate fluctuations and credit market concerns; and effects of geopolitical events, including the threat of domestic terrorism. Readers are referred to the most recent reports filed with the Securities and Exchange Commission.
Safe Harbor Statement - Continued
2

Corporate Overview & Strategy
Dennis WraaseChairman, President & CEO
3
Regulated Electric & Gas
DeliveryBusiness
PHI Vision
Be the premier energy delivery and services company in the
mid-Atlantic region through employees focused on customer service,
reliability and profitability.
4
Regulated Electric & Gas
DeliveryBusiness
CompetitiveEnergy/Other
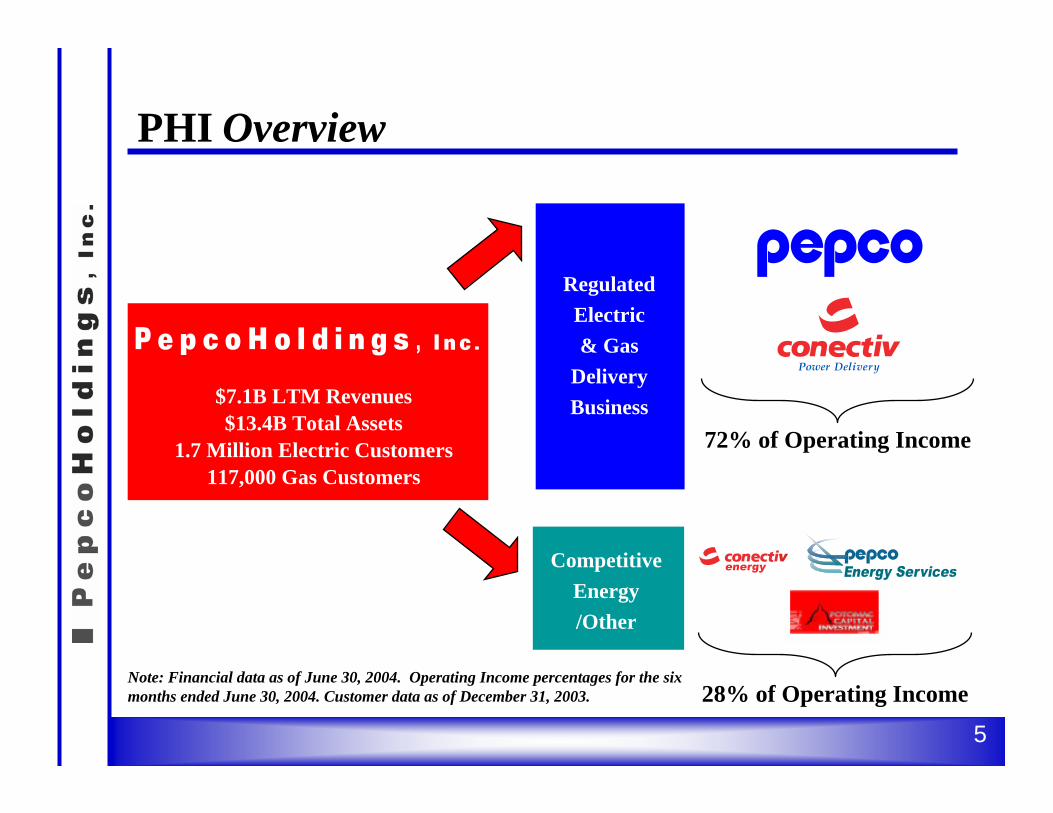
$7.1B LTM Revenues$13.4B Total Assets
1.7 Million Electric Customers117,000 Gas Customers
28% of Operating Income
72% of Operating Income
Note: Financial data as of June 30, 2004. Operating Income percentages for the six months ended June 30, 2004. Customer data as of December 31, 2003.
PHI Overview
5

Focus on Core Focus on Core Delivery BusinessDelivery Business
Strengthen Credit Strengthen Credit ProfileProfile
Manage Manage Complementary Complementary
Unregulated Unregulated BusinessesBusinesses
• Leverage regional PJM focus and expertise• Maintain conservatively hedged position on generation
portfolio• Expand retail supply opportunities in PJM footprint• Receive stable, long-term earnings stream from energy leases• Planned to reduce debt by $1 billion over the five year period
ending 2007; equity offering accelerates the de-levering and increases the debt pay down target to $1.3 billion
• Maximize free cash flow(1) through disciplined approach to capital expenditures
• Achieve equity ratio in the mid-40% area• Maintain low risk business profile
(1) Free cash flow defined as net cash from operating activities less capital expenditures net of asset disposition proceeds.
• Ensure high level of customer satisfaction• Maintain solid regulatory relations• Continue Power Delivery integration• Implement regulatory plan in line with removal of rate caps• Shed non-core assets – sale of Starpower and aircraft
PHI Strategy
6
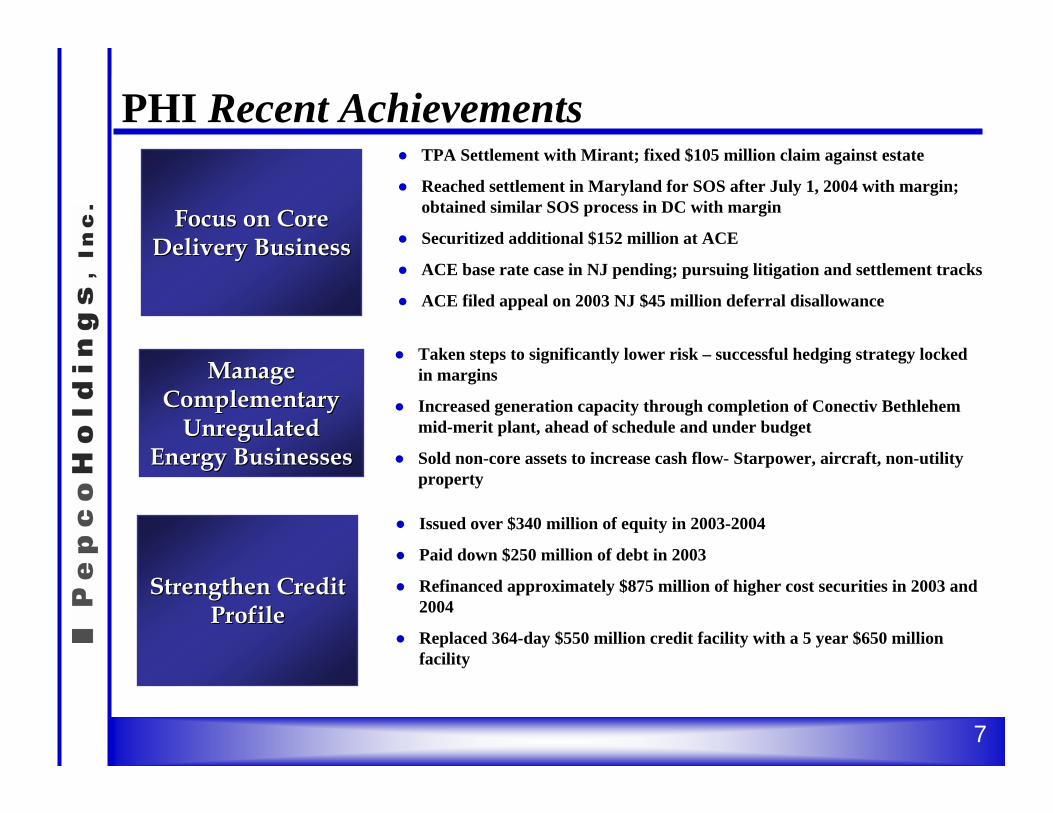
PHI Recent Achievements
Focus on Core Focus on Core Delivery BusinessDelivery Business
Manage Manage Complementary Complementary
Unregulated Unregulated Energy BusinessesEnergy Businesses
Strengthen Credit Strengthen Credit ProfileProfile
● TPA Settlement with Mirant; fixed $105 million claim against estate
● Reached settlement in Maryland for SOS after July 1, 2004 with margin; obtained similar SOS process in DC with margin
● Securitized additional $152 million at ACE
● ACE base rate case in NJ pending; pursuing litigation and settlement tracks
● ACE filed appeal on 2003 NJ $45 million deferral disallowance
● Taken steps to significantly lower risk – successful hedging strategy locked in margins
● Increased generation capacity through completion of Conectiv Bethlehem mid-merit plant, ahead of schedule and under budget
● Sold non-core assets to increase cash flow- Starpower, aircraft, non-utility property
● Issued over $340 million of equity in 2003-2004
● Paid down $250 million of debt in 2003
● Refinanced approximately $875 million of higher cost securities in 2003 and 2004
● Replaced 364-day $550 million credit facility with a 5 year $650 million facility
7

PHI Corporate Governance● Audit Committee of the Board
∗ Comprised of external Directors (biographies in Proxy)∗ Directors Cronin, Golden, Nussdorf and Ross designated by Board
as Audit Committee Financial Experts∗ Internal Auditor reports directly to Audit Committee of the Board∗ Pre-approves all services provided by external auditor
● Chief Ethics Officer – William T. Torgerson, Vice Chairman and General Counsel
● Policies and Procedures∗ 24 corporate business policies posted on PHI Intranet, include
policies on codes of conduct, insider trading, compliance with laws, conflict of interest, ethical conduct
∗ Corporate governance guidelines, business policies and bylaws have been posted on PHI’s internet website
8
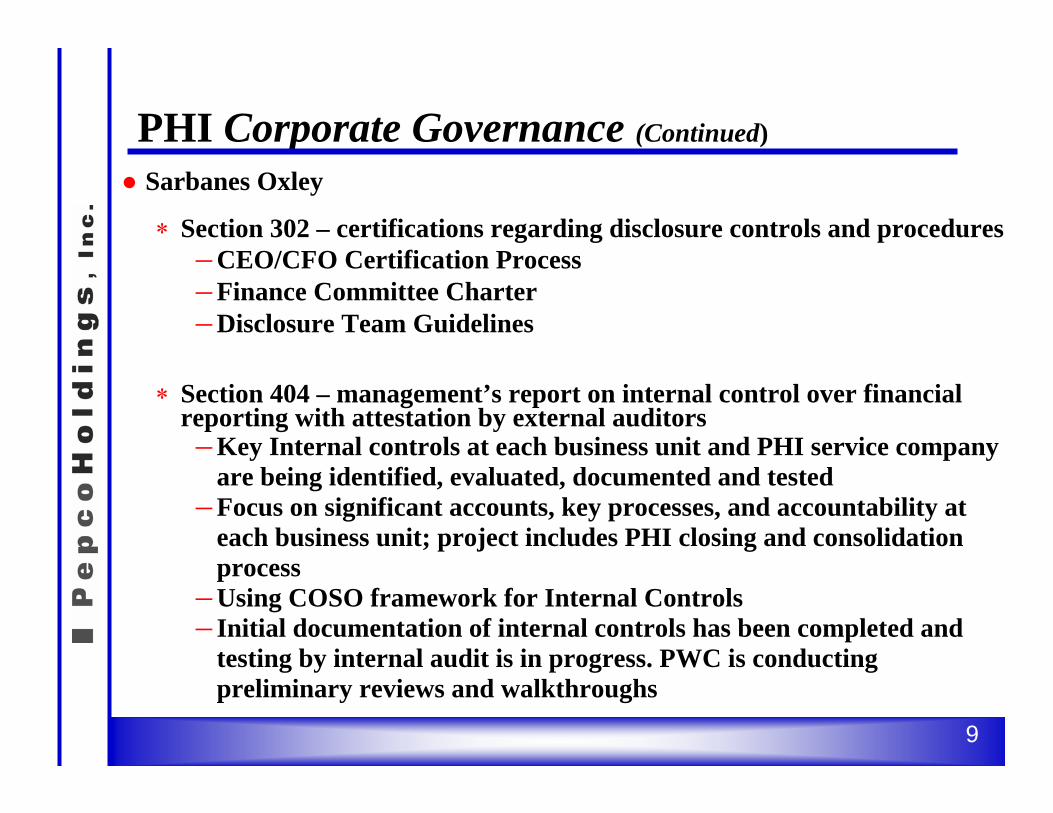
PHI Corporate Governance (Continued)
● Sarbanes Oxley
∗ Section 302 – certifications regarding disclosure controls and procedures―CEO/CFO Certification Process―Finance Committee Charter―Disclosure Team Guidelines
∗ Section 404 – management’s report on internal control over financial reporting with attestation by external auditors―Key Internal controls at each business unit and PHI service company
are being identified, evaluated, documented and tested―Focus on significant accounts, key processes, and accountability at
each business unit; project includes PHI closing and consolidation process
―Using COSO framework for Internal Controls―Initial documentation of internal controls has been completed and
testing by internal audit is in progress. PWC is conducting preliminary reviews and walkthroughs
9

PHI Summary● PHI is well positioned
● Our businesses fit together well and the strategy is working● We do business in a strong market
● PHI is focused on the customer● Reliability is top priority● Emergency preparedness initiatives well underway● Satisfied customers = Good regulatory relations
● PHI offers real value - with a low risk profile● Predictable earnings growth● Strong, predictable cash flow● Stable, secure dividend● Attractive total return potential
10

Power Delivery
Tom ShawPHI, Executive Vice President
1

• One of the largest Transmission & Distribution companies in the mid-Atlantic region
• Power Delivery is comprised of three legal entities– Potomac Electric Power Company (PEPCO)– Delmarva Power and Light Company (DPL)– Atlantic City Electric Company (ACE)
• 1.8 million customer base• Approx. 50,000 GWH of electric load delivered annually• 23,884 billion cubic feet of gas delivered annually• Service territory of 9,600 square miles• Approx. 4,200 Power Delivery employees• Regulated by 5 states and FERC• 2003 Operating Revenue of $4.0 billion and Assets of $8.5 billion
Power Delivery Introduction
2

PHI Power Delivery - Business Overview• Robust Service Territory Economy
– Sales growth of approximately 2%
– Employment growth exceeds national average
– Diverse government and private sectors
– Area has been less susceptible to economic downturns
– Per capita income above national average
Residential
34%
Government
10%
Commercial45%
Industrial
11%
¹2003 MWh Sales.
Diversified Customer Mix¹
3

Power Delivery- A Business Overview
Customers • 726,000
GWH • 25,994
Mcf N/A
Service Area • 640 square miles
District of Columbia, Major portions of Prince George's and Montgomery Counties in Suburban Maryland
Population • 2.0 million
• 521,000
• 9,643
N/A
• 2,700 square miles
Southern one-third of
New Jersey
• 1.0 million
• 493,000
• 14,034
N/A
• 6,000 square miles
Delmarva Peninsula
• 1.3 million
• 117,000
N/A
• 23,884,125
• 275 square miles
Northern Delaware
• 0.5 million
Reflects 12/31/03 data; GWH/Mcf calendar year 2003
4
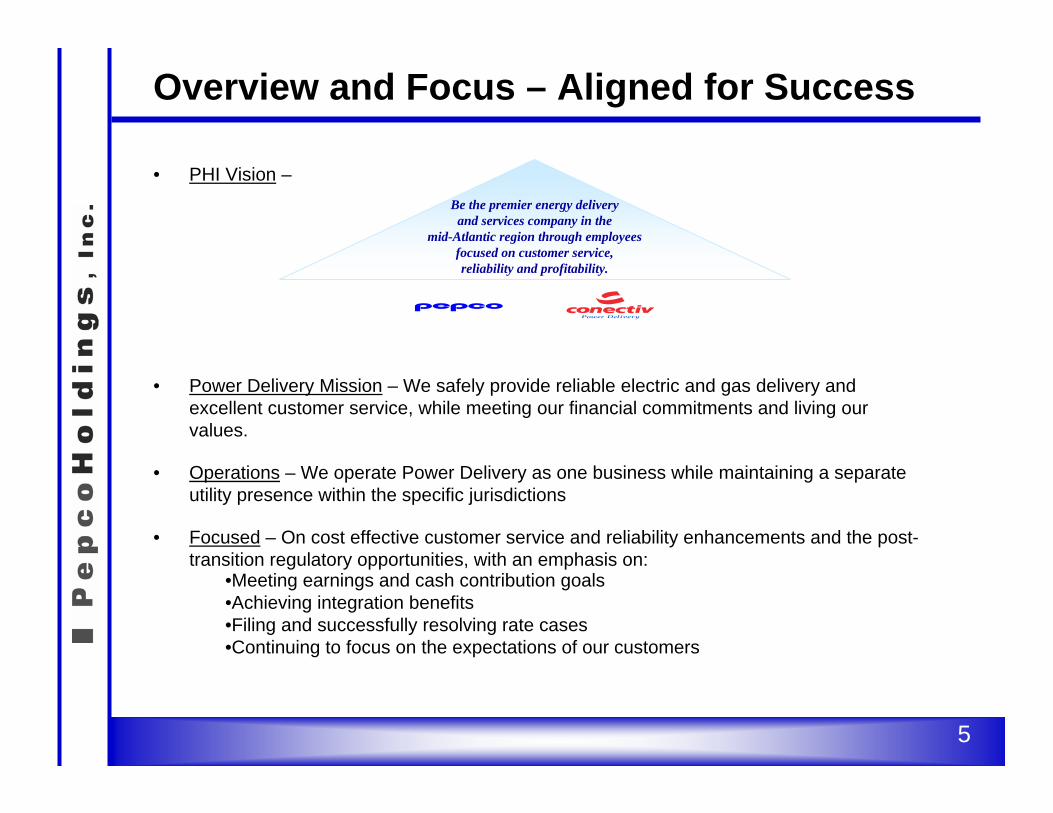
Overview and Focus – Aligned for Success
• PHI Vision –
• Power Delivery Mission – We safely provide reliable electric and gas delivery and excellent customer service, while meeting our financial commitments and living our values.
• Operations – We operate Power Delivery as one business while maintaining a separate utility presence within the specific jurisdictions
• Focused – On cost effective customer service and reliability enhancements and the post-transition regulatory opportunities, with an emphasis on:
•Meeting earnings and cash contribution goals •Achieving integration benefits •Filing and successfully resolving rate cases•Continuing to focus on the expectations of our customers
Be the premier energy delivery and services company in the
mid-Atlantic region through employees focused on customer service, reliability and profitability.
5

How We Manage the Power Delivery Business
FieldOperations &
Gas Div
Revenue Management/Revenue Accounting
AccountManagers
EngineeringGroups
Customers
CallCenters
RegionalOperating
Centers (Dispatch)
Manage Revenue
Manage Customer Relationships
Manage System Assets
Operate the System
Support from: HR, Strategic Support Services, Business Planning & Finance, IT, Safety & Environmental,Regulatory, and Corporate Services
Supply Customers’ Energy
Manage Emergency Preparedness
Power Delivery
6

Components of the Regulated Return
• Distribution Assets – Regulated by States
• Transmission Assets – Regulated by FERC
• Standard Offer Service Margin– DC - Avg 0.2¢ kWh (beginning Feb 2005)– MD - Avg 0.2¢ kWh– DE - No current margin; post-May 2006 margin TBD– NJ - No margin – pass through– VA - No current margin; post-Jan 2005 margin TBD
• Between Rate Cases– Customer sales growth– Manage operating expenses/capital costs
7

($ Millions) June 2004 June 2003Actual Actual
Earnings Availablefor Common Shareholders1 $109.6 $90.5
Operating Revenues1 $2,117.4 $1,893.0Less: Fuel, Purchased Energy & Gas1 $1,224.8 $1,062.6 Net Margin1 $892.6 $830.4
O&M Expense1 $313.1 $306.1
Capital Expenditures2 $222.4 $170.7
Return on Average Common Equity3 10.9% 10.6%
1 Amount represents combined operating results of Pepco, ACE, and DPL as presented on their Statements of Earnings in their Form 10-Q.2 Amount represents combined capital expenditures of Pepco, ACE, and DPL as presented in their Statements of Cash Flow in their Form 10-Q.
3 12 months ended 6/30/04 includes SOS margin.
Six Months Ended
Summarized Financial InformationPower Delivery
8

Summary of Plant & Rate Base AssetsTotal Power Delivery
AuthorizedDate Amount Return
(Millions)Electric Delivery - Distribution Pepco District of Columbia Dec. 2003 $969 11.10% (Formal Case No. 939, Order No. 10646 effective 7-11-95) Maryland June 2003 $725 11.00% (Case No. 8791 Settlement, Order No. 74711 effective 12-1-98)
Delmarva Delaware Dec. 2003 $353 11.50% (Docket No. 94-84, Order No. 3991, effective 5-1-95) Maryland Dec. 2003 $234 11.90% (Case No. 8492 Settlement, Order No. 70415, effective 4-1-93) Virginia Dec. 2003 $29 11.05% (PUE930036, effective 10-5-93)
Atlantic City Electric New Jersey Dec. 2002 $648 12.50% (Docket No. ER90091090J, effective 6-20-90)
Electric Delivery - Transmission (FERC) Total Power Delivery Dec. 2003 $655 2/ Rates negotiated - no stated Return on Equity
Gas Delmarva Delaware Dec. 2003 $234 10.50% (Docket No. 03-127, Order No. 6327, effective 12-9-03)
1/ Detail information regarding individual rate filings can be obtained from the public records of each filing.2/ Company determination - No recent FERC filings.
Rate Base 1/Regulatory Reference to Authorized Return
9

●Continue to maintain and benefit from a strong regulatory relationship
●Power Delivery will receive a margin as SOS provider in D.C. andMaryland (annually approximately $8 million and $17 million,respectively, after-tax)¹
●Rate case outcomes in Delaware (ancillary service rate increase of $12.4million annually and gas base rate increase of $7.75 million annually)
●New Jersey rate case pending; pursuing both regulatory litigation andsettlement tracks
●Filed appeal on 2003 New Jersey deferral disallowance decision
●Gearing up for post rate cap filings in other jurisdictions
PHI Regulatory Highlights
¹Based on 2003 SOS sales. Realized margin depends on customer migration.
10
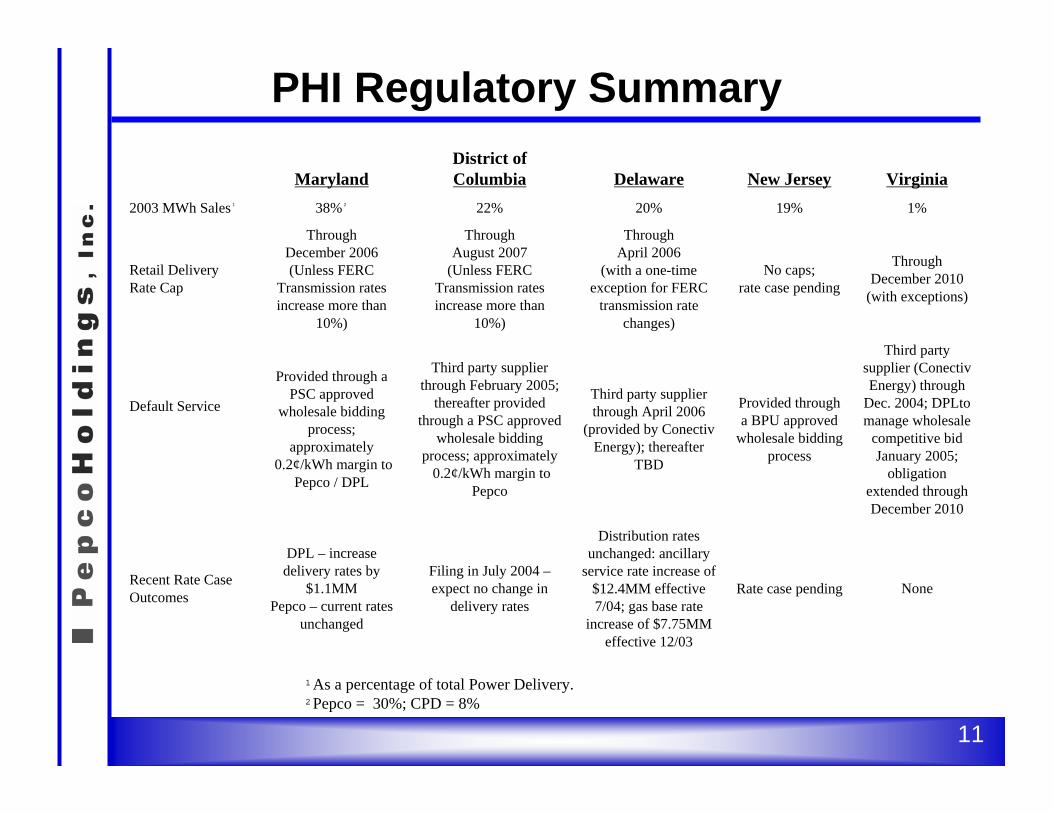
PHI Regulatory Summary
¹As a percentage of total Power Delivery.²Pepco = 30%; CPD = 8%
NoneRate case pending
Distribution rates unchanged: ancillary
service rate increase of $12.4MM effective 7/04; gas base rate
increase of $7.75MM effective 12/03
Filing in July 2004 –expect no change in
delivery rates
DPL – increase delivery rates by
$1.1MMPepco – current rates
unchanged
Recent Rate Case Outcomes
Third party supplier (Conectiv Energy) through
Dec. 2004; DPLto manage wholesale
competitive bid January 2005;
obligation extended through December 2010
Provided through a BPU approved
wholesale bidding process
Third party supplier through April 2006
(provided by Conectiv Energy); thereafter
TBD
Third party supplier through February 2005;
thereafter provided through a PSC approved
wholesale bidding process; approximately
0.2¢/kWh margin to Pepco
Provided through a PSC approved
wholesale bidding process;
approximately0.2¢/kWh margin to
Pepco / DPL
Default Service
ThroughDecember 2010
(with exceptions)
No caps;rate case pending
ThroughApril 2006
(with a one-time exception for FERC
transmission rate changes)
ThroughAugust 2007
(Unless FERC Transmission rates increase more than
10%)
ThroughDecember 2006 (Unless FERC
Transmission rates increase more than
10%)
Retail DeliveryRate Cap
1%19%20%22%38%²2003 MWh Sales¹
VirginiaNew JerseyDelawareDistrict of ColumbiaMaryland
11

• Strong financial results through June 2004
• Completed the Executive Integration Phase I – Core Team in Place
• Successful completion of labor contract negotiations with Locals1900 & 1238A
• On track with reliability and customer satisfaction survey results– Ranked above average by JD Power among Eastern Region utilities in
residential customer satisfaction
• Implemented scheduled emergency preparedness initiatives
Year to Date Business Accomplishments
12

APPENDIX
13

Electric GWH Sales:GWH GWH SOS
Delivered Sales
2003 Actual 25,994 16,199
Estimated:2004 27,013 17,932 2005 27,486 13,472 2006 28,075 13,522 2007 28,677 13,812
Capital Expenditures & Depreciation ($M):Capital Depreciation &
Estimated: * Expenditures Amortization2004 196$ 160$ 2005 189$ 159$ 2006 193$ 165$ 2007 193$ 173$
* See Safe Harbor Statement at beginning of this presentation
Sales and Financial Information
Potomac Electric Power Company
14

Electric GWH Sales:GWH GWH SOS BCF
Delivered Sales Sales
2003 Actual 14,673 12,362 23,337
Estimated:2004 14,079 12,202 21,7972005 14,528 12,265 21,8792006 14,857 12,563 22,0162007 15,194 12,870 21,901
Capital Expenditures & Depreciation ($M):Capital Depreciation &
Estimated: * Expenditures Amortization2004 122$ 67$ 2005 128$ 70$ 2006 110$ 72$ 2007 92$ 74$
* See Safe Habor Statement at the beginning of this presentation
Sales and Financial Information
Delmarva Power and Light Company
15

Electric GWH Sales:GWH GWH SOS
Delivered Sales
2003 Actual 9,643 8,598
Estimated:2004 9,815 7,885 2005 9,760 7,965 2006 10,004 7,898 2007 10,256 8,107
Capital Expenditures & Depreciation ($M):Capital Depreciation &
Estimated: * Expenditures Amortization¹2004 113$ 120$ 2005 83$ 121$ 2006 85$ 123$ 2007 92$ 123$
¹Includes amortization of transition bond principal
* See Safe Harbor Statement at the beginning of this presentation
Sales and Financial Information
Atlantic City Electric Company
16

For our Web cast viewers -We are currently on a 15
minute break

William H. SpenceSr. Vice President, Pepco Holdings, Inc.President & COO, Conectiv Energy
Objectives of Today’s Discussion
• Describe the unique characteristics of Conectiv Energy’s business model.
• Explain how hedging provides earnings stability.
• Provide expanded market, financial and operational data.
• Provide an expected range of key value drivers.
1
Executive Summary
• Conectiv Energy’s business model uniquely maximizes returns.
• Conectiv Energy’s investment in power plant operating flexibility and dual fuel capabilities results in higher than normal “spark spreads.”
• Earnings have been improved due to effective hedging and focused financial management.
• Future regional trends, strategy, and operational excellence areexpected to boost earnings.
2

Business Overview& Operating Model
3

Business Overview
• Property, Plant & Equipment $ 1,354 million• Average Net Cost of Installed Capacity $366/kW• Number of Generating Units 52• Number of Plant Sites 18• YTD Earnings @ 6/30/04 $ 30 million• Debt @ 6/30/04 (1) $ 739 million• Equity @ 6/30/04 $ 629 million
Hay Road – 1,066 MW’s Bethlehem – 1,092 MW’s
(1) Will be exclusively inter-company debt after repayment of Bethlehem loan.
4
Business Model
• Niche Generator: Specialize in one portion of the generation supply stack, utilizing our unit flexibility to provide energy and ancillary services to the growing PJM east market.
• Unit flexibility: The flexibility designed into Conectiv Energy’s generation assets provides higher generation margins.
• Fuel Flexibility: The ability to switch fuels rapidly provides additional arbitrage value.
• Hedged Portfolio: Manage the business as a portfolio of assets and contracts that are intended to provide a reasonably predictable cash flow/earnings stream.
5

Business Overview
$0
$50
$100
$150
$200
$250
0 10 20 30 40 50 60 70
Base Load Mid-Merit Peaking
Geographic LocationGeographic Location Positioning inPositioning in PJM Supply StackPJM Supply Stack
MD
DE
VA
PA
3,698 MWs (reflects completion of Bethlehem)
$/MWh
Mid-Merit2,689 MW73% fleet
Base Load340 MW9% fleet
Peaking 669 MW18% fleet
GW
Conectiv Energy Power Plants
• Conectiv Energy Plants are located near large Northeast load pockets.
• Fleet is focused on the mid-merit portion of the supply stack.
Population > 20 mm
Population < 10 mm
6
PJM Market
7
PJM Market Update
• PJM remains the most liquid and advanced power pool in the U.S.
• PJM is considering a new capacity pricing model.
• May provide higher and more stable prices for capacity and send better signals to the market.
• The eastern PJM region is expected to be the first area to receive localized capacity prices.
• Market conditions strengthening in Traditional PJM
• Continued PJM load growth.
• Announced generation retirements will lower excess capacity in PJM.
• Minimal new capacity additions currently planned for PJM.
• PJM is expanding to include AEP, ComEd, Dominion, Duquesne and Dayton.
8
Future PJM Power MarketDiscussion
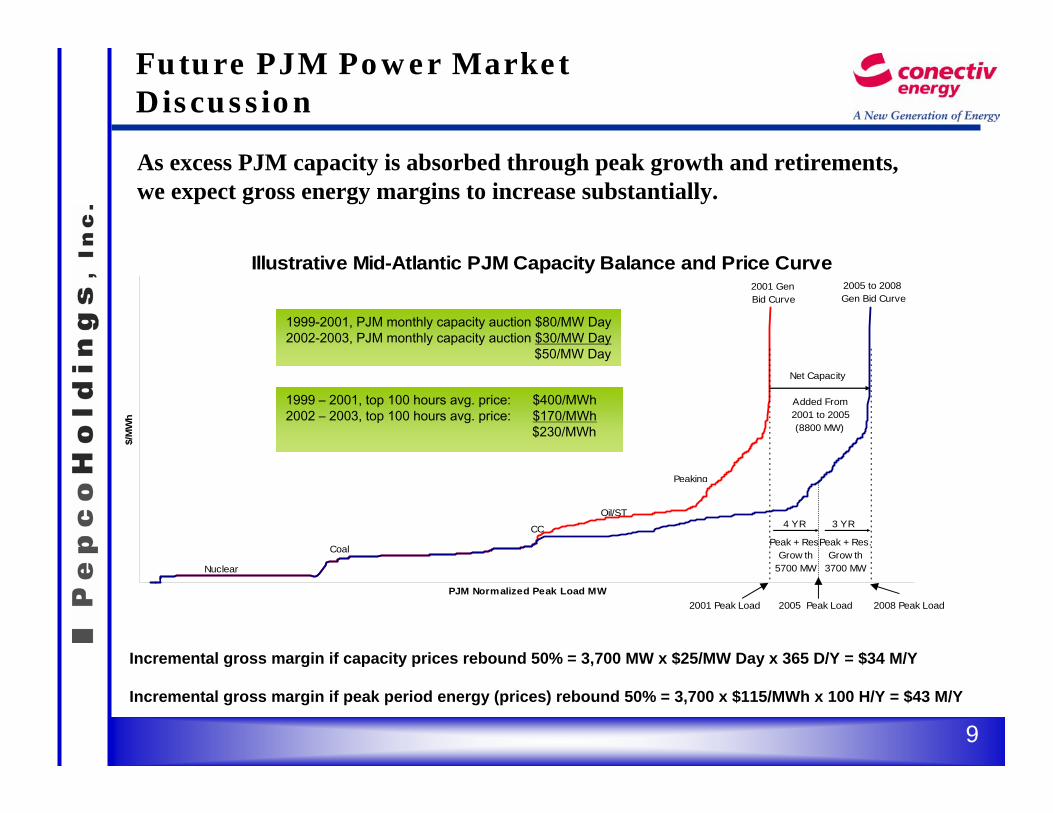
Incremental gross margin if capacity prices rebound 50% = 3,700 MW x $25/MW Day x 365 D/Y = $34 M/Y
Incremental gross margin if peak period energy (prices) rebound 50% = 3,700 x $115/MWh x 100 H/Y = $43 M/Y
As excess PJM capacity is absorbed through peak growth and retirements, we expect gross energy margins to increase substantially.
Illustrative Mid-Atlantic PJM Capacity Balance and Price Curve
PJM Normalized Peak Load MW
$/M
Wh
Nuclear
Coal
CC
Net Capacity
Oil/ST
Peaking
Added From 2001 to 2005
(8800 MW)
2001 Gen Bid Curve
2005 to 2008Gen Bid Curve
4 YR 3 YR
Peak + Res.Grow th
5700 MW
Peak + Res.Grow th
3700 MW
2001 Peak Load 2008 Peak Load2005 Peak Load
1999 – 2001, top 100 hours avg. price: $400/MWh2002 – 2003, top 100 hours avg. price: $170/MWh
$230/MWh
1999-2001, PJM monthly capacity auction $80/MW Day2002-2003, PJM monthly capacity auction $30/MW Day
$50/MW Day
9
Conectiv Operating Model
10
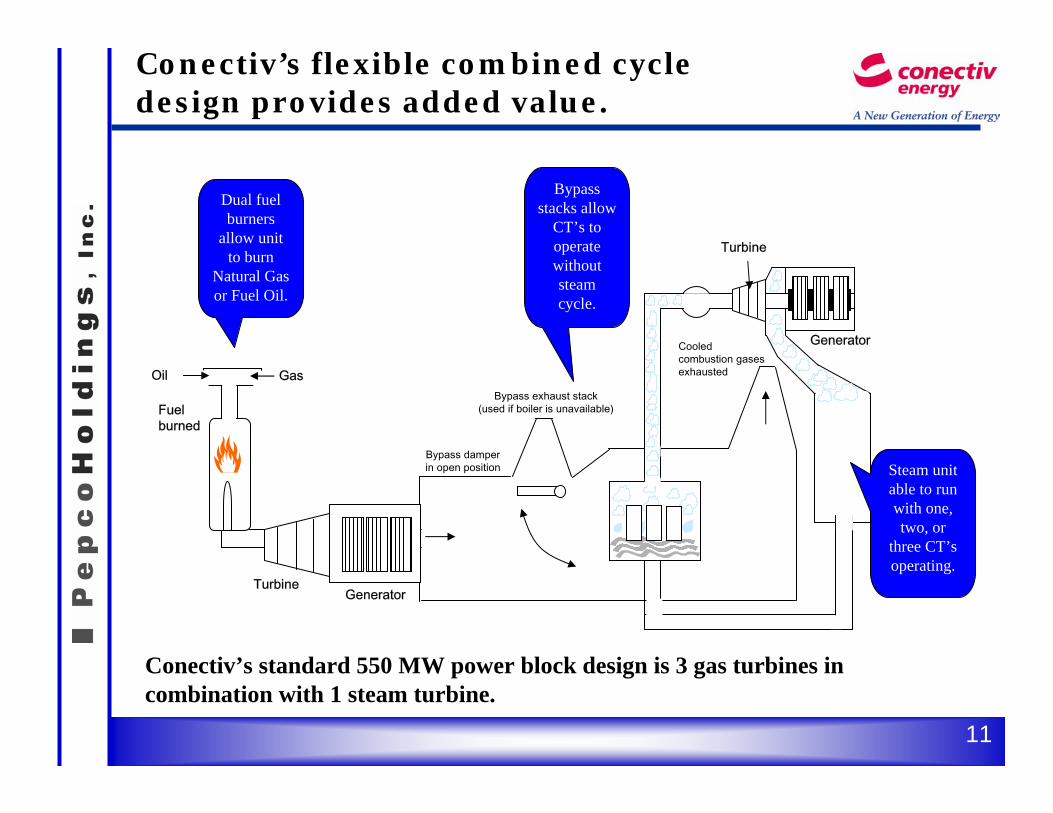
Conectiv’s flexible combined cycledesign provides added value.
Generator
Generator
Turbine
Bypass damperin open position
Cooledcombustion gasesexhausted
Bypass exhaust stack(used if boiler is unavailable)
Dual fuel burners
allow unit to burn
Natural Gas or Fuel Oil.
Bypass stacks allow
CT’s to operate without steam cycle.
Steam unit able to run with one, two, or
three CT’s operating.
Gas
Fuelburned
Oil
Turbine
Conectiv’s standard 550 MW power block design is 3 gas turbines incombination with 1 steam turbine.
11

Conectiv Design Compared Typical Design
12 or 3Multi-Pipeline Access
12Allowable Starts per Day
8-164Minimum Run Time (hours)
NoYesMulti-fuel Capability (natural gas and No. 2 oil)
NoYesAbility to Run only CT’s
2 Hours20 MinutesTime for CT’s to Reach Full Load
Typical
Combined Cycle Design
Conectiv Energy
Combined Cycle Design
12
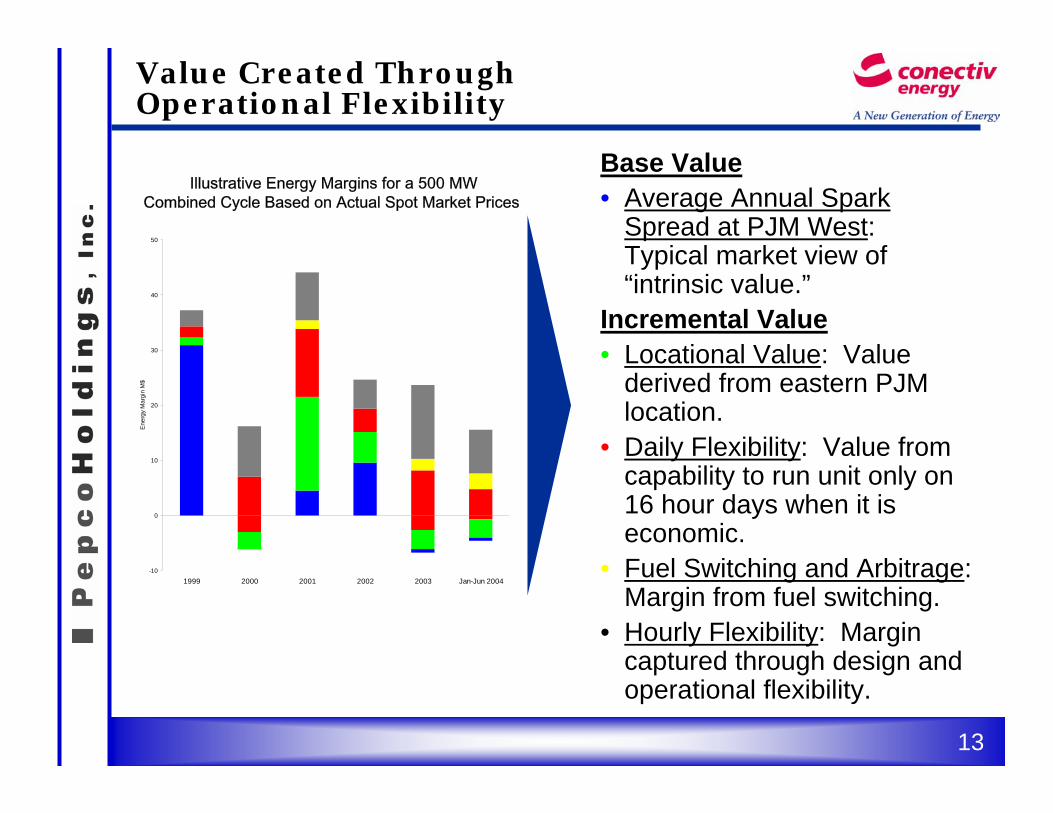
Value Created ThroughOperational Flexibility
Base Value• Average Annual Spark
Spread at PJM West: Typical market view of “intrinsic value.”
Incremental Value• Locational Value: Value
derived from eastern PJM location.
• Daily Flexibility: Value from capability to run unit only on 16 hour days when it is economic.
• Fuel Switching and Arbitrage: Margin from fuel switching.
• Hourly Flexibility: Margin captured through design and operational flexibility.
-10
0
10
20
30
40
50
1999 2000 2001 2002 2003 Jan-Jun 2004
Ene
rgy
Mar
gin
M$
Illustrative Energy Margins for a 500 MWCombined Cycle Based on Actual Spot Market Prices
13
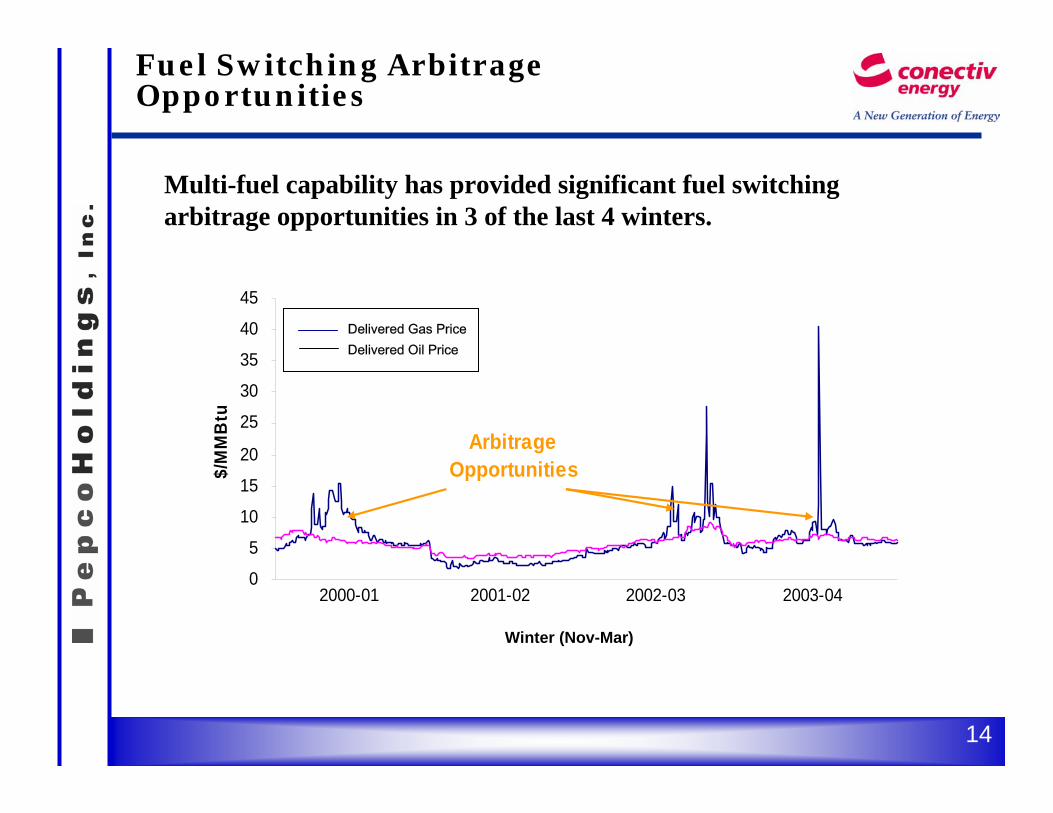
Fuel Switching ArbitrageOpportunities
0
5
10
15
20
25
30
35
40
45
$/M
MB
tu
2000-01 2003-042002-032001-02
Arbitrage Opportunities
Winter (Nov-Mar)
Multi-fuel capability has provided significant fuel switchingarbitrage opportunities in 3 of the last 4 winters.
Delivered Gas PriceDelivered Oil Price
14

Key Drivers of Generation Gross Margin (1)(June 2004 YTD)
YT
D A
vera
ge M
argi
n $/
MW
h
Realized spot energy margins from actual generation.
Locational value.
Power and fuel hedges provide predictability.
Unit flexibility to start quickly, run for short durations, dispatch as CT only, and provide local system support allows for additional margins.
Fuel switching generates arbitrage.
$21.
47/M
Wh
$40.
21 M
Wh
West to East Hub Congestion
Power & Fuel Hedges
Ancillary Services &Hourly Flexibility
Premium
Fuel Switching
PJM Capacity (ICAP)
Energy SparkSpreads
$18.
74 /M
Wh
(1) Generation Gross margin is calculated by subtracting cost of goods sold from generation revenues and dividing by generation output.
15
Power Plant Operations Statistics
16

Generation Performance*
39
19
28
14
32
11
21 23 23
93 92 95 90 95 94 92 93 93
96
8387
79
97
84
97
8588
0
20
40
60
80
100
120
Q3 2002 Q4 2002 Q1 2003 Q2 2003 Q3 2003 Q4 2003 Q1 2004 Q2 2004 Last 8Quarters
Perc
ent
Capacity Factor On-Dispatch (1) Availability
* Excludes peaking plants.
(1) On-dispatch represents the percentage of available energy margin obtained from the market.
17

Year Ending Year Ending 6 months as of2002 2003 June 2004
Total Generation O&M(1) ($millions) 56.5$ 58.9$ 27.0$
Installed Capacity (MW)(2) 2,912 3,656 3,698Generation Output (MWH)(3) 4,395,260 5,355,270 2,738,850
Generation O&M Expenses per KW 19.39$ 16.12$ 14.61$ Generation O&M Expenses per MWH 12.85$ 11.01$ 9.86$
(1)The Generation O&M expense for all periods includes the Deepwater Power Plant O&M.(2)Includes 185MW Deepwater Capacity(3)Includes Deepwater Output
Generation Operatingand Maintenance Expenses
18

Focus on Cost Control
Generation O&M Expense per Installed kW
$19.39
$14.61$16.12
$0
$5
$10
$15
$20
$25
2002 2003 6 Months as ofJune 2004
$/kW
Generation O&M Expense per MWh Produced
$12.85
$9.86$11.01
$0
$2
$4
$6
$8
$10
$12
$14
2002 2003 6 Months as ofJune 2004
$/M
Wh
19
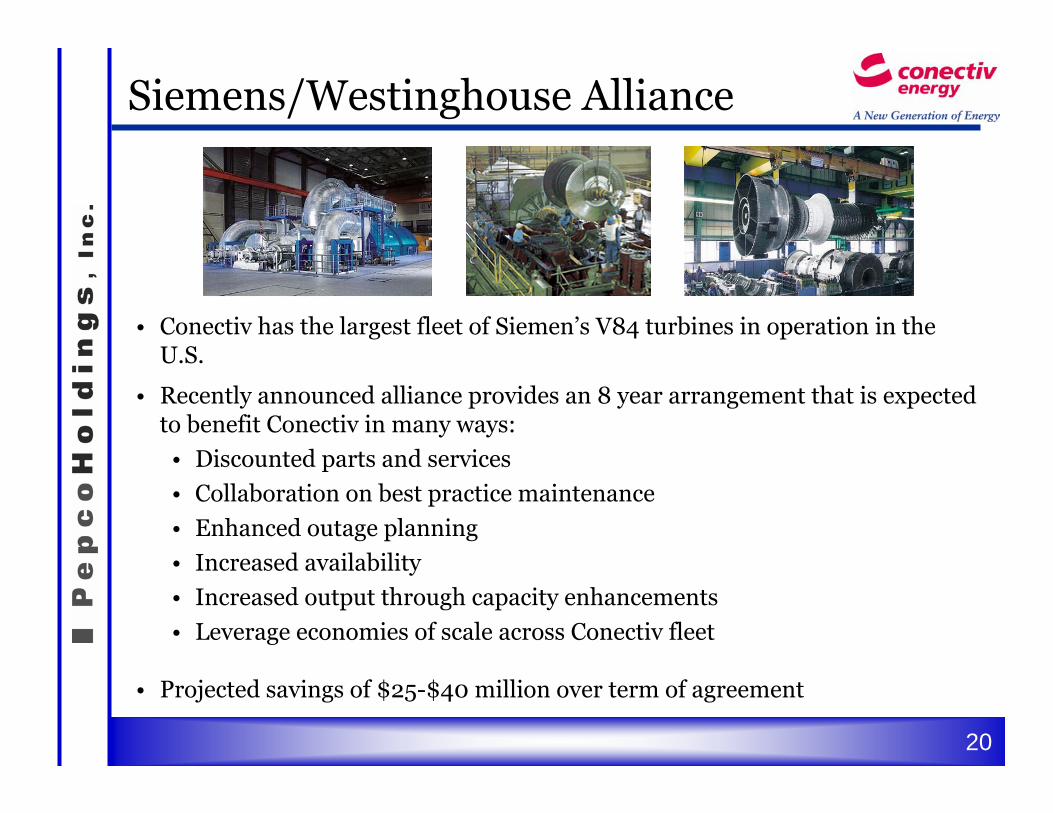
Siemens/Westinghouse Alliance
• Conectiv has the largest fleet of Siemen’s V84 turbines in operation in the U.S.
• Recently announced alliance provides an 8 year arrangement that is expected to benefit Conectiv in many ways:
• Discounted parts and services
• Collaboration on best practice maintenance
• Enhanced outage planning
• Increased availability
• Increased output through capacity enhancements
• Leverage economies of scale across Conectiv fleet
• Projected savings of $25-$40 million over term of agreement
20

Hedging Activities
21
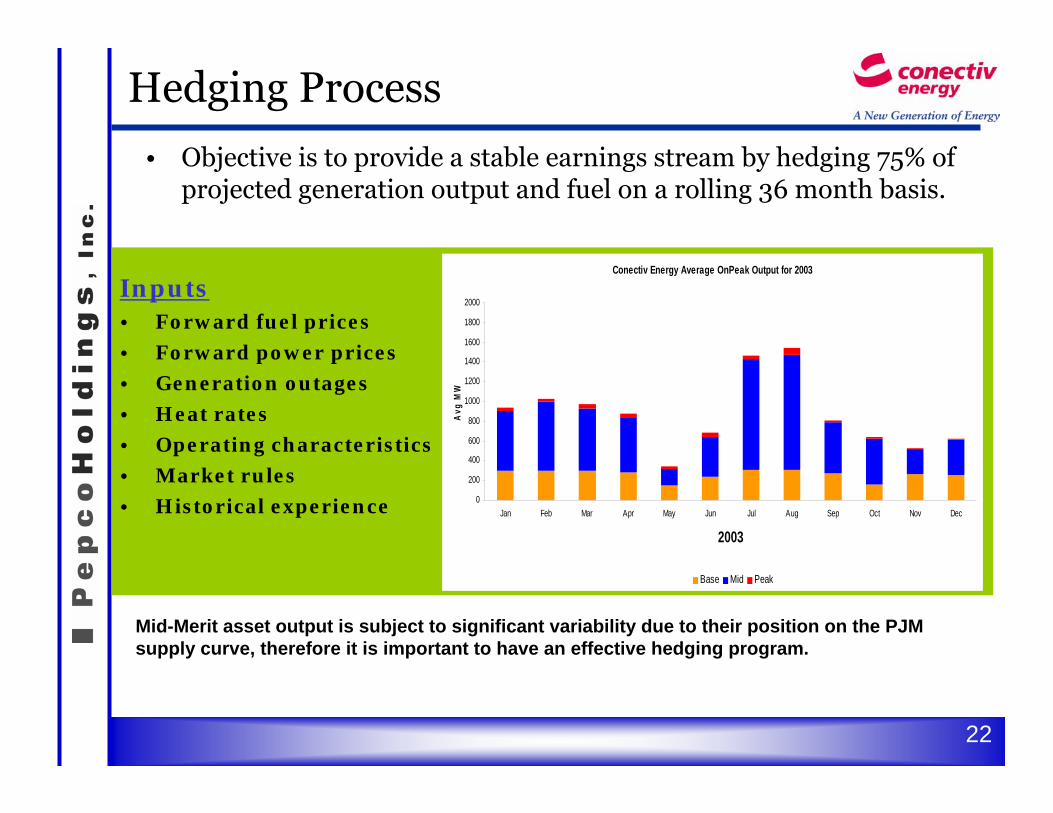
Hedging Process
• Objective is to provide a stable earnings stream by hedging 75% of projected generation output and fuel on a rolling 36 month basis.
Inputs• Forward fuel prices
• Forward power prices
• Generation outages
• Heat rates
• Operating characteristics
• Market rules
• Historical experience
Mid-Merit asset output is subject to significant variability due to their position on the PJM supply curve, therefore it is important to have an effective hedging program.
Conectiv Energy Average OnPeak Output for 2003
0
200
400
600
800
1000
1200
1400
1600
1800
2000
Jan Feb Mar Apr May Jun Jul Aug Sep Oct Nov Dec
2003
Avg
MW
Base Mid Peak
22

Daily Load & Generation
0
500
1,000
1,500
2,000
2,500
3,000
3,500
4,000
8-1 8-3 8-5 8-7 8-9
8-11 8-13 8-15 8-17 8-19 8-21 8-23 8-25 8-27 8-29 8-31A
vera
ge O
n-Pe
ak M
W
Total Supply Contracts Gen-Coal Gen-Oil Gen-Mid Gen-Peak Total Obligations Total Gen Capability
Buy fromSpot
Market
Sell toSpot
Market
There is a positive correlation between serving POLR obligations and our generation output.
23
Hedging Process (continued)
• With projected load and generation, hedging alternatives are
then considered
• Standard power sales products; e.g., 50 MW on-peak or ATC
• Financial options
• Customized transactions (tolling arrangements)
• Standard Offer Services (e.g., BGS, POLR, etc.)
• Fuel Supply contracts are needed to protect projected margins
and ensure reliable operations (e.g., NYMEX, physical supply,
transportation and storage).
• Maintain a mix of various types of power and fuel contracts to
manage overall portfolio risk
24
Financial Statistics
25

Financial Summary - 2004 YTD
June YTD 2004 Gross Margin and Operating Income (GAAP)
($ millions except where noted)
6 Months EndingJune 30, 2004
Plant Output (MWh's) 2,738,850Average Generation Margin ($/MWh) $40.21
Operating Revenue $1,153.2Cost of Goods Sold (1,033.4)
Gross Margin $119.8
Gross Margin Detail:Merchant Generation $110.1
Load Following Service (POLR) 1.7Other Energy Services 8.0
Total Gross Margin $119.8
Operating Expenses ($70.0)Operating Income $49.8
26
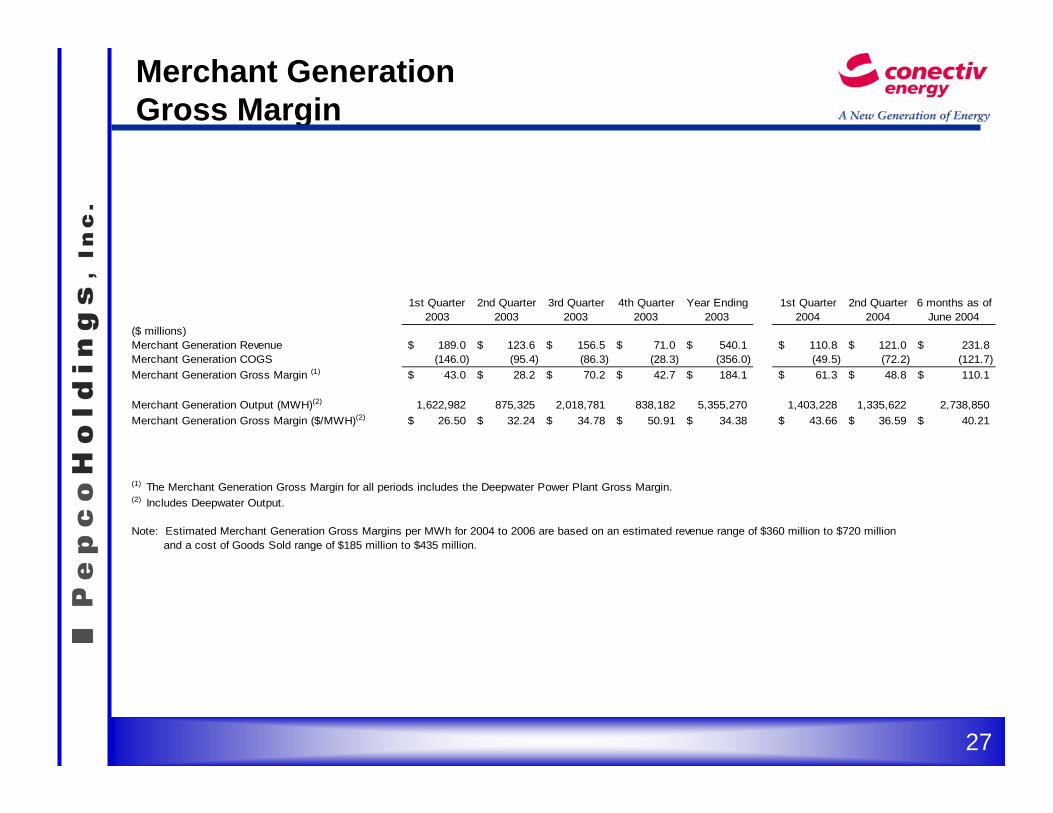
Merchant GenerationGross Margin
1st Quarter 2nd Quarter 3rd Quarter 4th Quarter Year Ending 1st Quarter 2nd Quarter 6 months as of2003 2003 2003 2003 2003 2004 2004 June 2004
($ millions)Merchant Generation Revenue 189.0$ 123.6$ 156.5$ 71.0$ 540.1$ 110.8$ 121.0$ 231.8$ Merchant Generation COGS (146.0) (95.4) (86.3) (28.3) (356.0) (49.5) (72.2) (121.7) Merchant Generation Gross Margin (1) 43.0$ 28.2$ 70.2$ 42.7$ 184.1$ 61.3$ 48.8$ 110.1$
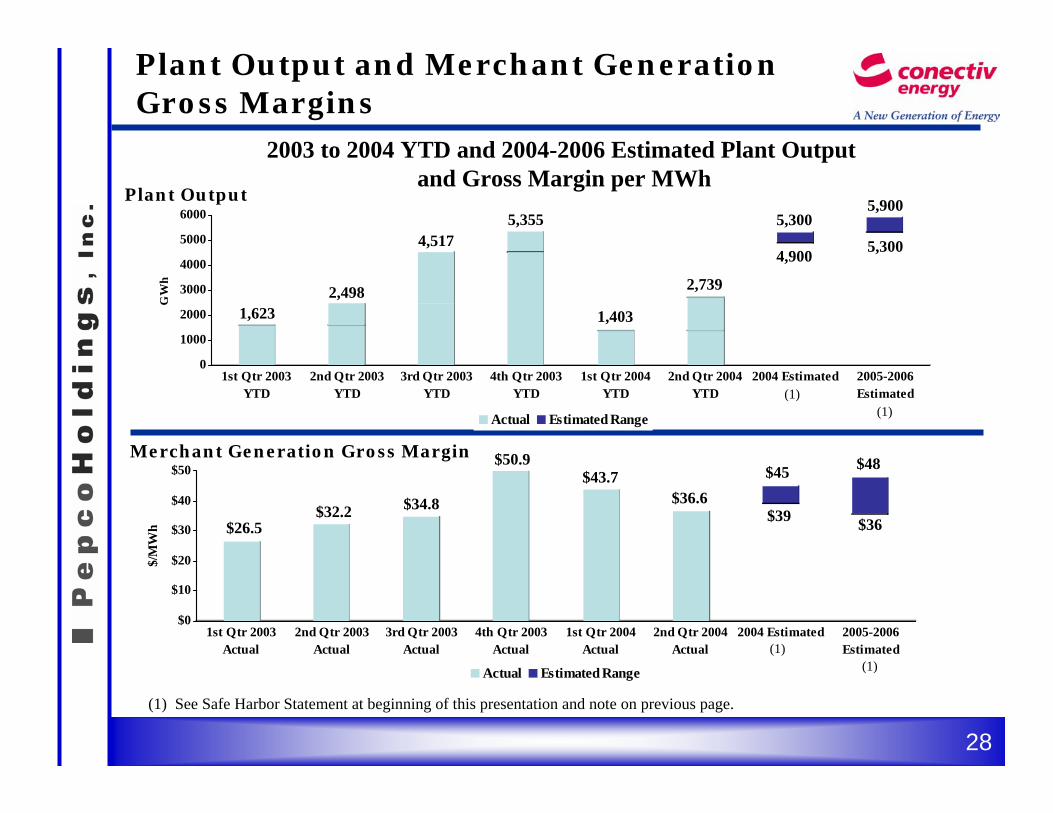
Merchant Generation Output (MWH)(2) 1,622,982 875,325 2,018,781 838,182 5,355,270 1,403,228 1,335,622 2,738,850Merchant Generation Gross Margin ($/MWH)(2) 26.50$ 32.24$ 34.78$ 50.91$ 34.38$ 43.66$ 36.59$ 40.21$
(1) The Merchant Generation Gross Margin for all periods includes the Deepwater Power Plant Gross Margin.(2) Includes Deepwater Output.
Note: Estimated Merchant Generation Gross Margins per MWh for 2004 to 2006 are based on an estimated revenue range of $360 million to $720 million and a cost of Goods Sold range of $185 million to $435 million.
27
Plant Output and Merchant GenerationGross Margins
$0
$10
$20
$30
$40
$50
$/M
Wh
1st Qtr 2003Actual
2nd Qtr 2003Actual
3rd Qtr 2003Actual
4th Qtr 2003Actual
1st Qtr 2004Actual
2nd Qtr 2004Actual
2004 Estimated 2005-2006Estimated
Actual Estimated Range
2003 to 2004 YTD and 2004-2006 Estimated Plant Outputand Gross Margin per MWh
$26.5$32.2 $34.8
$50.9$43.7
$36.6$45
$39
$48
$36
Merchant Generation Gross Margin
(1)(1)
Plant Output
0
1000
2000
3000
4000
5000
6000
GW
h
1st Qtr 2003YTD
2nd Qtr 2003YTD
3rd Qtr 2003YTD
4th Qtr 2003YTD
1st Qtr 2004YTD
2nd Qtr 2004YTD
2004 Estimated 2005-2006Estimated
Actual Estimated Range
1,6232,498
4,5175,355
1,403
2,739
5,3005,900
4,900 5,300
(1)(1)
(1) See Safe Harbor Statement at beginning of this presentation and note on previous page.
28
Conectiv Energy Net Cash FromOperating Activity
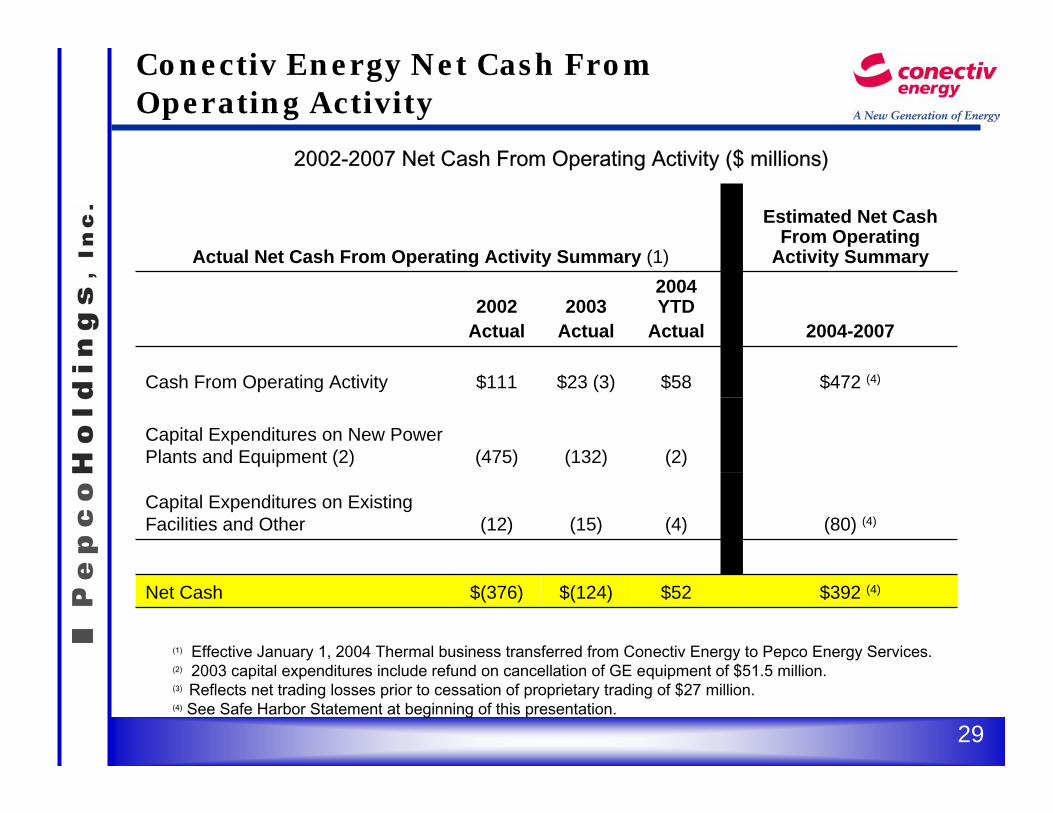
2002-2007 Net Cash From Operating Activity ($ millions)
Estimated Net Cash From Operating
Activity SummaryActual Net Cash From Operating Activity Summary (1)
$392 (4)$52$(124)$(376)Net Cash
(80) (4)(4)(15)(12)Capital Expenditures on Existing Facilities and Other
(2)(132)(475)Capital Expenditures on New Power Plants and Equipment (2)
$472 (4)$58$23 (3)$111Cash From Operating Activity
2004-2007
2004 YTD
Actual2003
Actual2002
Actual
(1) Effective January 1, 2004 Thermal business transferred from Conectiv Energy to Pepco Energy Services.(2) 2003 capital expenditures include refund on cancellation of GE equipment of $51.5 million.(3) Reflects net trading losses prior to cessation of proprietary trading of $27 million.(4) See Safe Harbor Statement at beginning of this presentation.
29
Executive Summary
• Conectiv Energy’s business model uniquely maximizes returns.
• Conectiv Energy’s investment in power plant operating flexibility and dual fuel capabilities results in higher than normal “spark spreads.”
• Earnings have been improved due to effective hedging and focused financial management.
• Future regional trends, strategy, and operational excellence are expected to boost earnings.
30

Appendix
31
Operating Income Summary
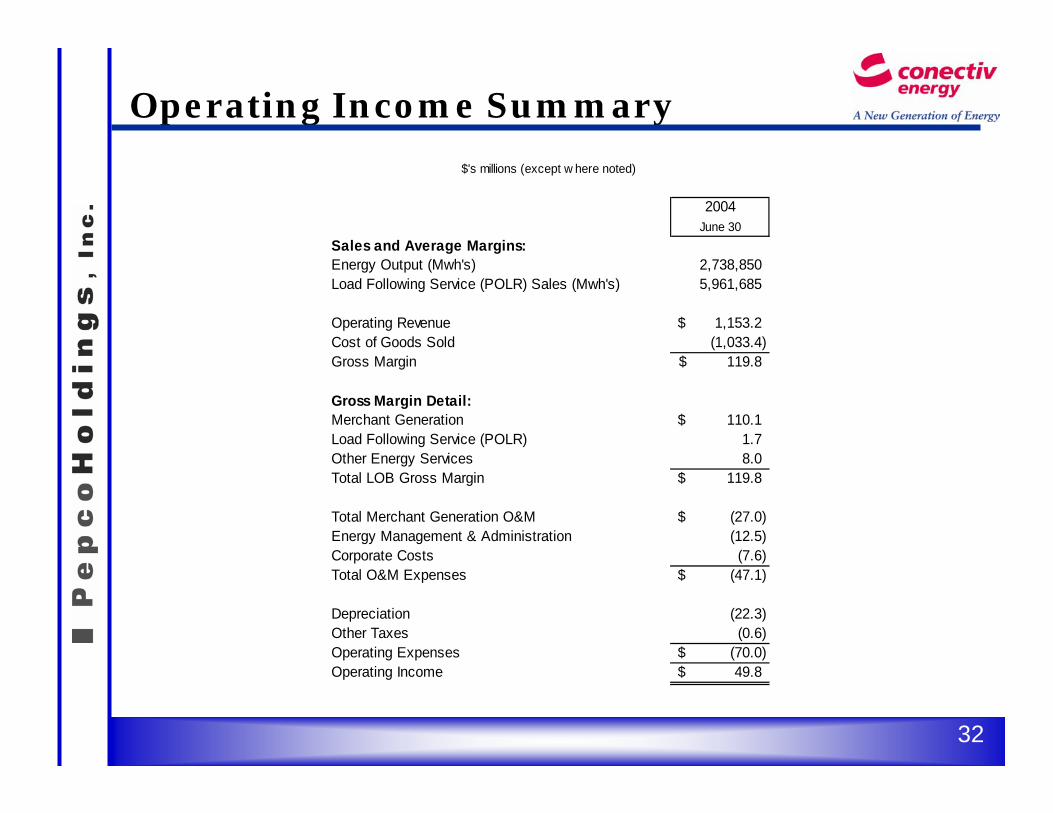
$'s millions (except w here noted)
2004June 30
Sales and Average Margins:Energy Output (Mwh's) 2,738,850Load Following Service (POLR) Sales (Mwh's) 5,961,685
Operating Revenue 1,153.2$ Cost of Goods Sold (1,033.4) Gross Margin 119.8$
Gross Margin Detail:Merchant Generation 110.1$ Load Following Service (POLR) 1.7Other Energy Services 8.0Total LOB Gross Margin 119.8$
Total Merchant Generation O&M (27.0)$ Energy Management & Administration (12.5)Corporate Costs (7.6)Total O&M Expenses (47.1)$
Depreciation (22.3)Other Taxes (0.6)Operating Expenses (70.0)$ Operating Income 49.8$
32

E.R. MayberrySenior Vice President , Pepco Holdings, Inc.
President & CEO , Pepco Energy Services, Inc.
1

Pepco Energy Services - Overview• A profitable C&I energy services business in the mid-Atlantic
region.
• One of the largest retail energy providers in PJM.– About 2,850 MW of load under contract.– Over 80 million dekatherms of delivered natural gas in 2003.– Eighty-eight percent of retail electricity load is large C&I.
• A full requirements energy service business for customers who wish to outsource their energy needs.– Develops and installs energy efficiency equipment including
central plants.– Installs and operates HVAC, controls, and high voltage
equipment.– Performs testing and maintenance.
2
Positioned for Growth• Sized to handle a high volume of business.
• Mature systems to handle future growth.
• Strong risk management and counterparty credit processes.
• Limited need for capital expenditures.($14 mm – 2004, $10 mm in 2005, $3 mm in 2006)
3

Organizational Structure
Asset Management Group
Performance Management
Group
Pepco BuildingServices
Energy Services
• Commercial and Industrial Commodity Sales
• Mass Market CommoditySales
• 800 MW Generation - PPR• Energy Savings
Performance Contracting
• Central Plants
• High Voltage Testing and Maintenance
• Building Controls and HVAC
4

Pepco Energy Services - Strategy
• Supply energy products and services in competitive retail markets.
– Offer retail electricity and natural gas focused on large C&I customers in the mid-Atlantic region.
– Provide integrated energy management solutions to commercial, institutional and government customers.
– Expand geographically as PJM expands.
• Provide PHI the opportunity for increased earnings growth with manageable risk.
5
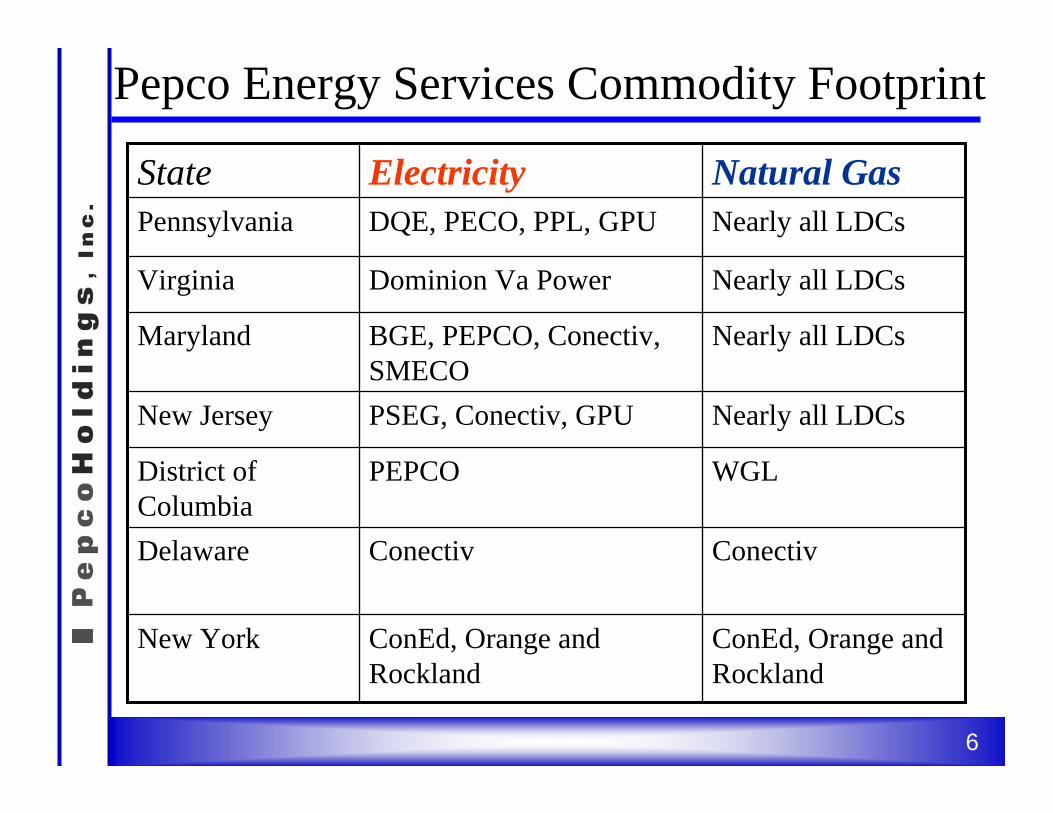
ConectivConectivDelaware
Natural GasElectricityState
ConEd, Orange and Rockland
ConEd, Orange and Rockland
New York
WGLPEPCODistrict of Columbia
Nearly all LDCsPSEG, Conectiv, GPUNew Jersey
Nearly all LDCsBGE, PEPCO, Conectiv, SMECO
Maryland
Nearly all LDCsDominion Va PowerVirginia
Nearly all LDCsDQE, PECO, PPL, GPUPennsylvania
Pepco Energy Services Commodity Footprint
6
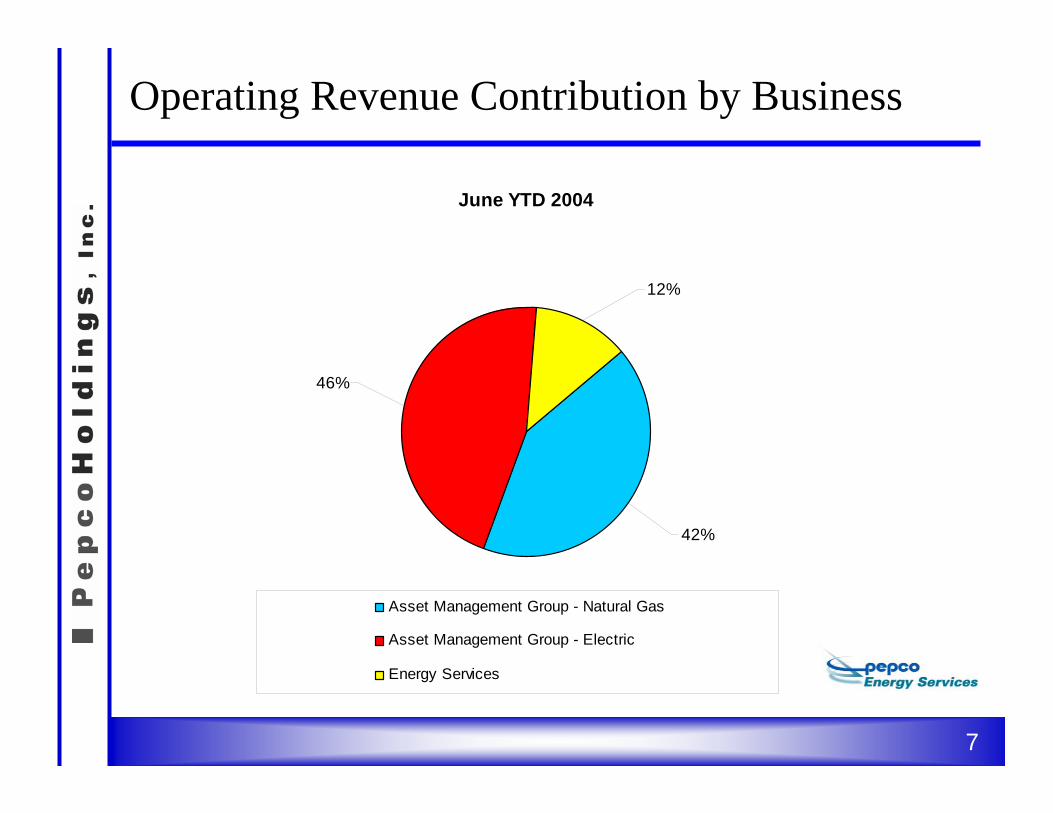
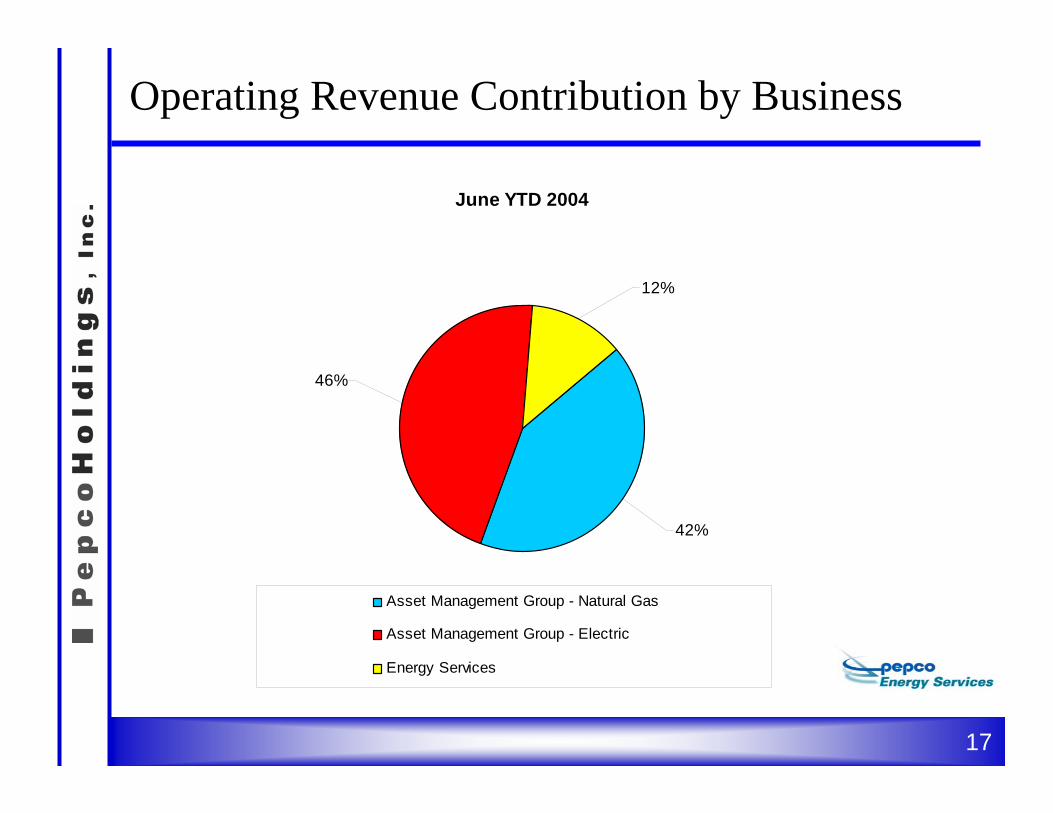
Operating Revenue Contribution by Business
June YTD 2004
46%
12%
42%
Asset Management Group - Natural Gas
Asset Management Group - Electric
Energy Services
7
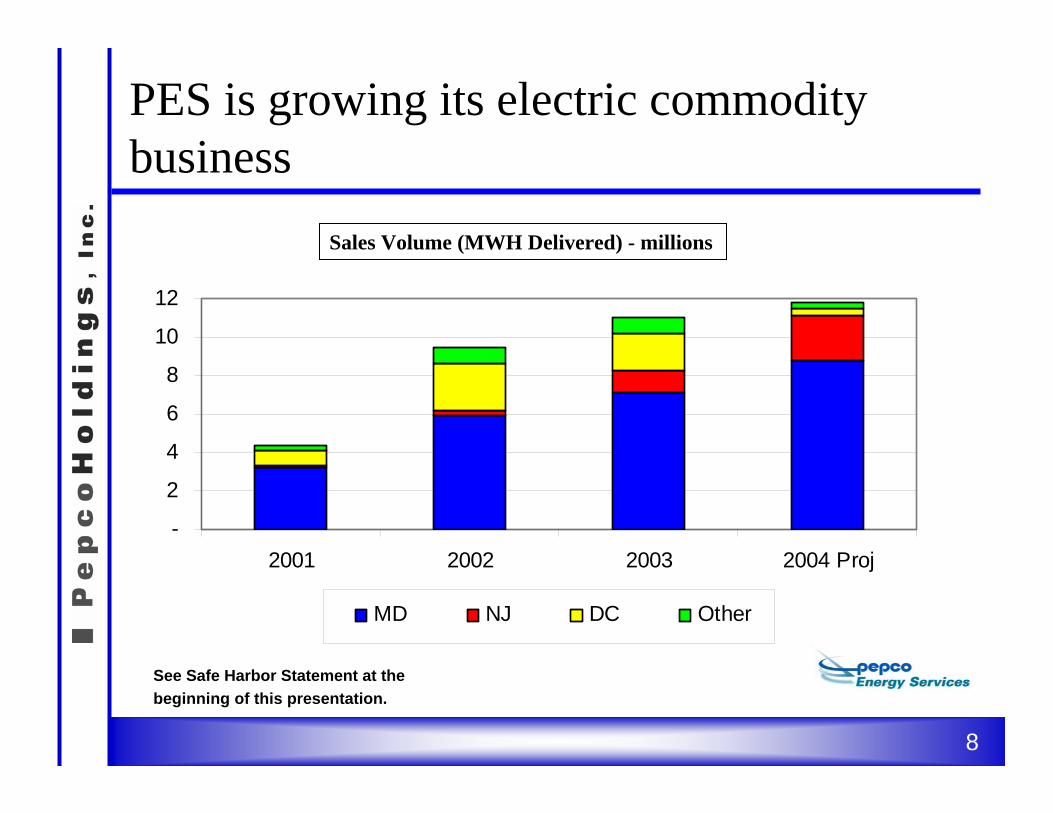
Sales Volume (MWH Delivered) - millions
PES is growing its electric commodity business
-
2
4
6
8
10
12
2001 2002 2003 2004 Proj
MD NJ DC Other
See Safe Harbor Statement at the beginning of this presentation.
8
Commodity Acquisition
• Retail oriented wholesale desk – buy wholesale in support of retail sales.
• Manage toward a flat book.
• No speculative trading.
• Very low Value-at-Risk limit.
9
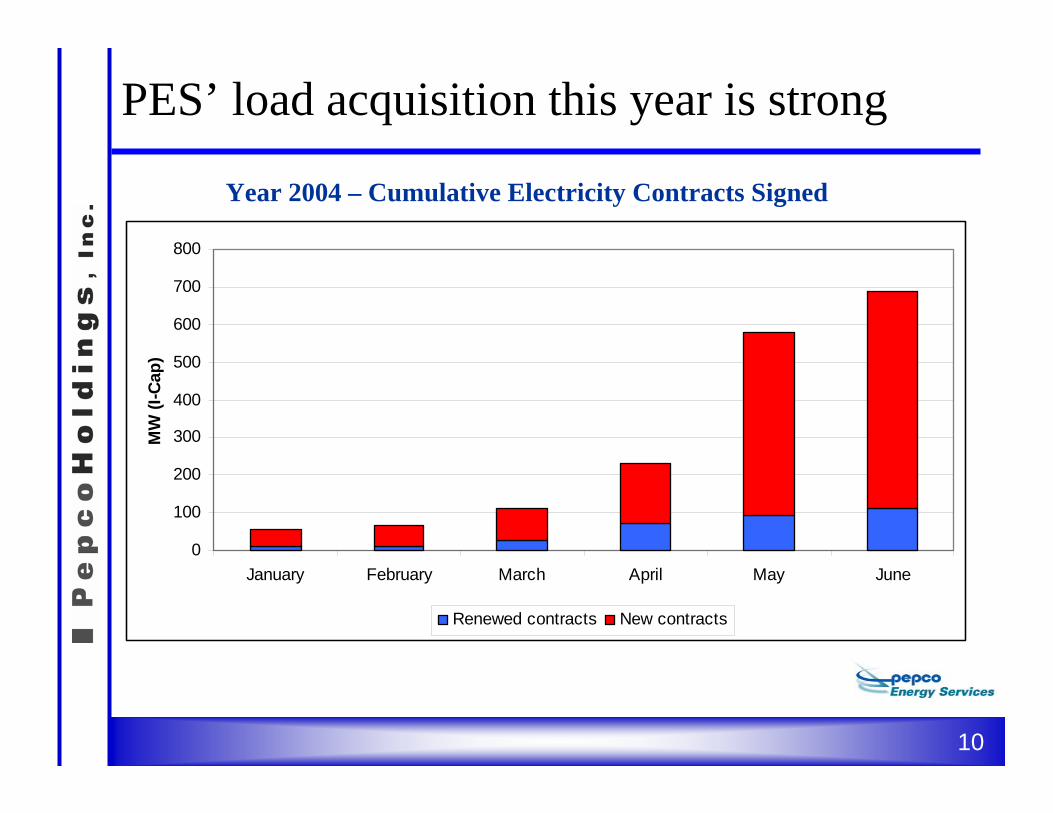
Year 2004 – Cumulative Electricity Contracts Signed
PES’ load acquisition this year is strong
0
100
200
300
400
500
600
700
800
January February March April May June
MW
(I-C
ap)
Renewed contracts New contracts
10

Growth Opportunities
• Expand commercial and industrial commodity business into attractive markets – primarily high density areas with good competitive climate. Ohio, Illinois, Michigan and New York look most attractive.
• Continue to develop ongoing revenue streams in the energy services business.
11
-
2,0004,000
6,0008,000
10,00012,000
14,000
New York Illinois Michigan Ohio
I-Cap
(MW
)
C&I Market (Customers>400 KW) - target markets
C&I Market (Customers>400 KW) - non-switched
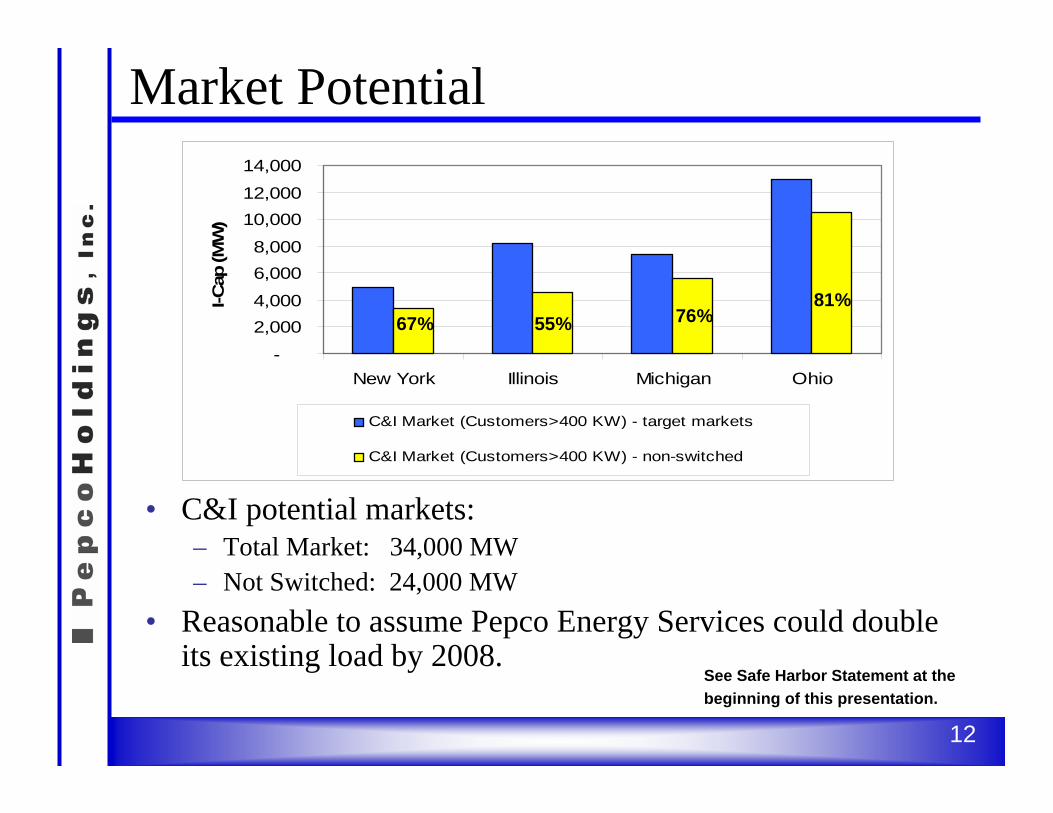
Market Potential
• C&I potential markets:– Total Market: 34,000 MW– Not Switched: 24,000 MW
• Reasonable to assume Pepco Energy Services could double its existing load by 2008.
67%81%
76%55%
See Safe Harbor Statement at the beginning of this presentation.
12
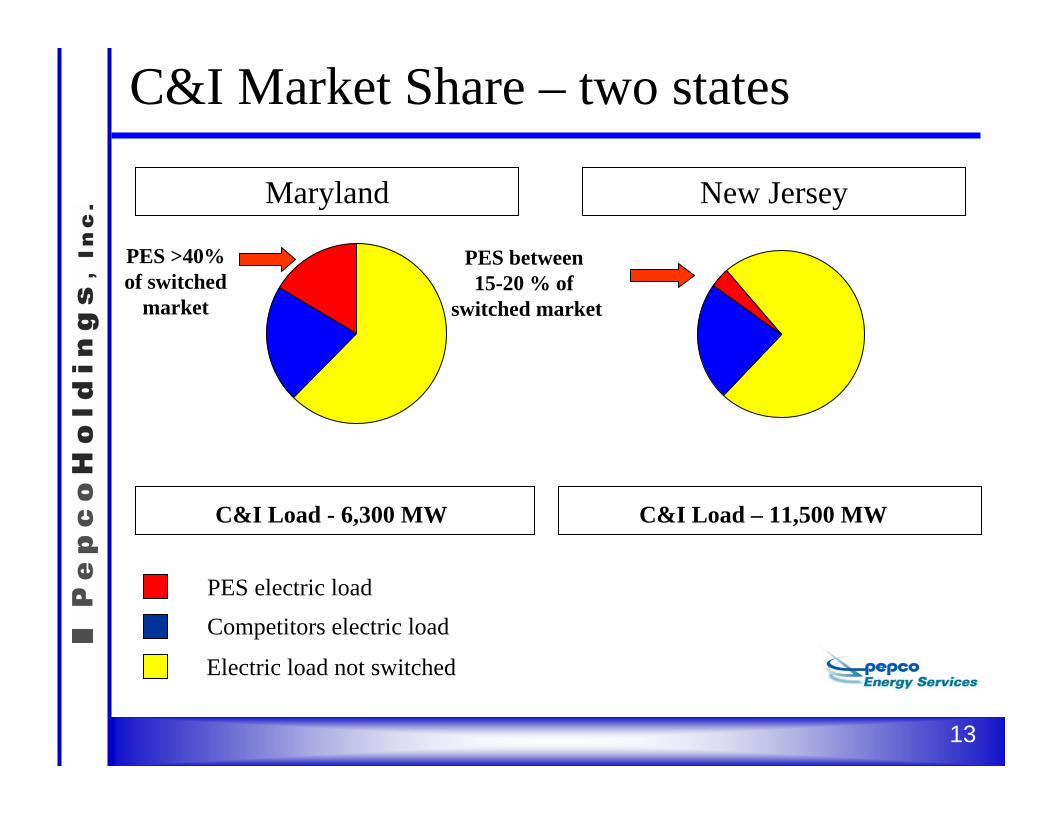
C&I Market Share – two states
Competitors electric loadPES electric load
Electric load not switched
Maryland New Jersey
C&I Load - 6,300 MW C&I Load – 11,500 MW
PES >40%of switched
market
PES between 15-20 % of
switched market
13

Alliances help PES execute its strategy
• One of the largest electricity purchasing groups in mid-Atlantic
• Commercial buildings in D.C. and Maryland
• About 400 MW electric load
• 93 participating companies
• Provides flexibility in supply
Apartment and Office Building Association
14

Electric and Natural Gas Contract examplesMETRO •$25 million electric
supply contract• 48 MW electric load•2 year term
EPA • Renewable energy
certificates• 1,000 MWH• 3 year term
NovartisElectric and gas supply
• 25 MW electric load• 1 million dekatherms of
natural gas• Customer since 2001
Rutgers UniversityElectric and natural gassupply36 MW electric load 2 million dekatherms of natural gas
• Customer since 2001
University of Maryland•$5 million electric supply
contract• 25 MW electric load
15
Electric Commodity Supply Contract example – Federal Government
• Electric commodity supply to Maryland locations
• 107 MW electric load
• $47 million contract
• Term is approximately 1.5 years
16
Operating Revenue Contribution by Business
June YTD 2004
46%
12%
42%
Asset Management Group - Natural Gas
Asset Management Group - Electric
Energy Services
17
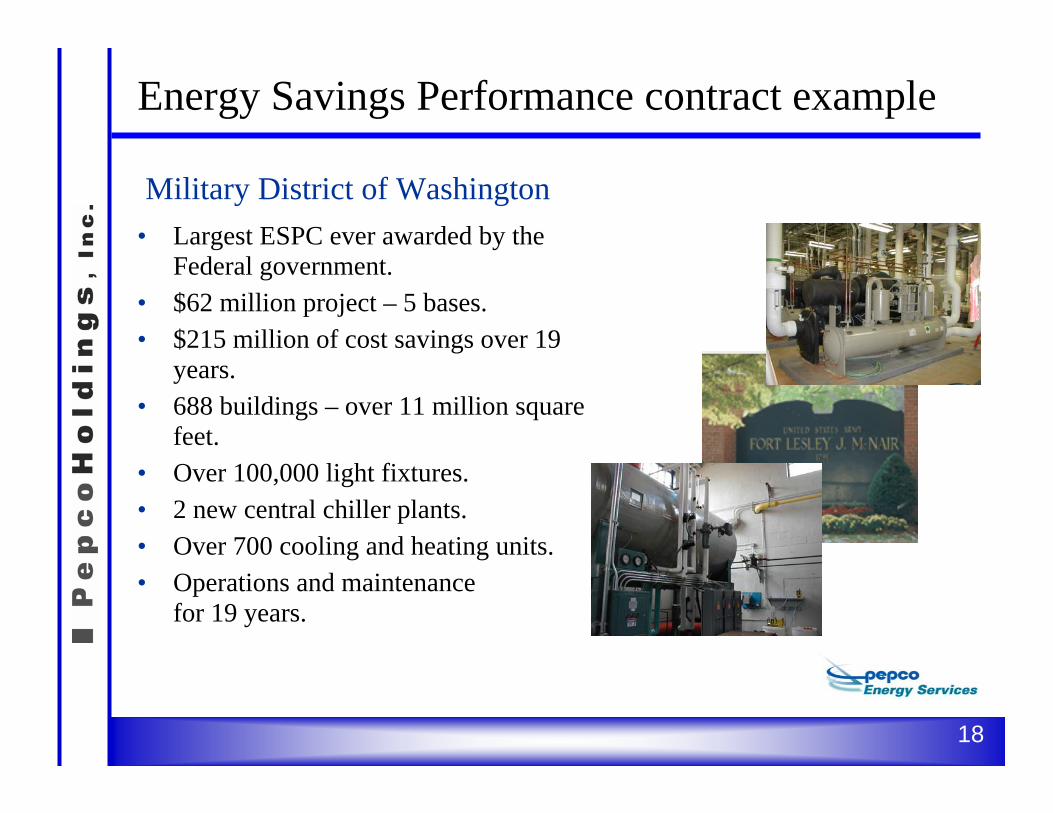
Energy Savings Performance contract example
• Largest ESPC ever awarded by the Federal government.
• $62 million project – 5 bases.• $215 million of cost savings over 19
years.• 688 buildings – over 11 million square
feet.• Over 100,000 light fixtures.• 2 new central chiller plants.• Over 700 cooling and heating units.• Operations and maintenance
for 19 years.
Military District of Washington
18

Energy Efficiency Contract example
• $60 million in projects.• Construction included a co-
generator, substation, and building retrofits.
• 10 year operations and maintenance contract.
• Additional contract to sell natural gas to the co-generator.
• Selling electricity to customer as well.
National Institutes of Health
19

A larger percentage of service revenues are from ongoing contracts• White Flint chiller plant.
• Military District of Washington – O&M contract.
• D.C. Convention Center chiller plant.
• National Institutes of Health Cogeneration – O&M contract.
• Other Thermal assets (Atlantic City and Wilmington, DE)
20

Service revenues from ongoing contracts
(millions)
$-
$10
$20
$30
$40
$50
$60
$70
2000 2001 2002 2003 * 2004Proj* Includes the transfer of thermal assets.
* Based on existing contracts.See Safe Harbor Statement at the beginning of this presentation.
21

541.5 554.2
1,074.7
827.5
212.4
$-
$200
$400
$600
$800
$1,000
$1,200
2000 2001 2002 2003 2004 June YTD
Operating Revenue(millions)
22

Gross Margins by business segment
Gross Margin Percentage
Natural Gas 6.4$ 3%
Electric 18.5$ 7%
Energy Services 25.0$ 36%
Pepco Energy Services, Inc. 49.9$ 9%
June 2004 – YTD(millions)
Natural Gas Gross Margin equals Natural Gas Operating Revenue of $231.2 million less Natural Gas Cost of Sales of $224.8 million.
Percentage = (Revenues- Cost of Sales)/Revenues
Electric Gross Margin equals Electric Operating Revenue of $253.9 million less Electric Cost of Sales of $235.4 million.
Energy Services Gross Margin equals Energy Services Operating Revenue of $69.1 million less Energy Services Cost of Sales of $44.1 million.
23

Gross Margin by BusinessJune YTD 2004
13%
50%
37%
Asset Management Group - Natural Gas
Asset Management Group - Electric
Energy Services
Gross margin by business = gross margin by stated category/total Pepco Energy Services gross margin (percentage)
24

Income Statement (millions)
Gross Margin of $49.9 million less certain other Operating Expensesof $42.2 million equals Operating Income of $7.7 million.
Other Income is comprised of interest income, income from equity investments and other revenue and expenses.
June YTD - 2004Operating Revenue 554.2$ Cost of Sales 504.3$
Gross Margin 49.9$
Other Operating Expenses 42.2$
Operating Income 7.7$
Other Income 1.0$
Tax and Interest Expense 2.3$
Net Income 6.4$
25
Summary
• One of the largest retail energy providers in the mid-Atlantic region.
• Excellent opportunities for growth.
• Plans to expand geographically, especially as PJM expands.
• Provides PHI the opportunity for earnings growth with manageable risk.
26

For our web cast audience we are now on a 45 minute lunch break
Potomac Capital Investment Corporation
John McCallumSenior Vice President - PHI & President - Potomac Capital
Investment Corporation1
Potomac Capital Investment (PCI)
• Designed to provide a supplement to earnings, cash flow and long term shareholder value through existing energy-related financial investments
• Manage existing portfolio – principally cross border lease assets backed by high investment-grade collateral arrangements
• No new investments; other assets divested
2
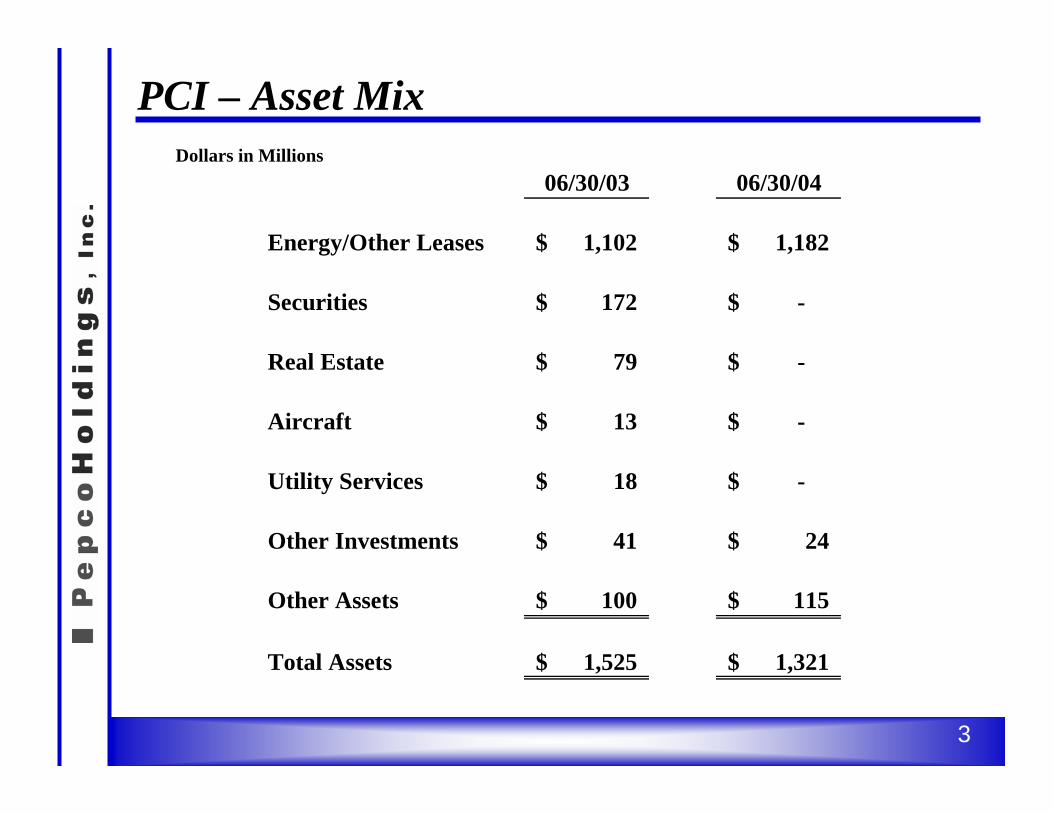
PCI – Asset MixDollars in Millions
06/30/03 06/30/04
Energy/Other Leases 1,102$ 1,182$
Securities 172$ -$
Real Estate 79$ -$
Aircraft 13$ -$
Utility Services 18$ -$
Other Investments 41$ 24$
Other Assets 100$ 115$
Total Assets 1,525$ 1,321$
3

PCI – Energy Leasing Portfolio
As of June 30, 2004
Year Country Asset Description %
Owned Lease
ExpirationBook Value
($ in Millions)
94 Netherlands Co-Fired Generation (210 MW) 35% 2017 $84
95 Australia Co-Fired Generation (700 MW) 100% 2019 167
99 Netherlands Gas Transmission/Distribution 100% 2025 195
99 Netherlands Gas Transmission/Distribution 100% 2025 125
01 Austria Hydro Generation (781 MW) 56% 2033 213
02 Austria Hydro Generation (184 MW) 100% 2030-35 132
02 Austria Hydro Generation (239 MW) 100% 2033-41 165
02 Austria Hydro Generation (80 MW) 100% 2039 65
$1,146
4
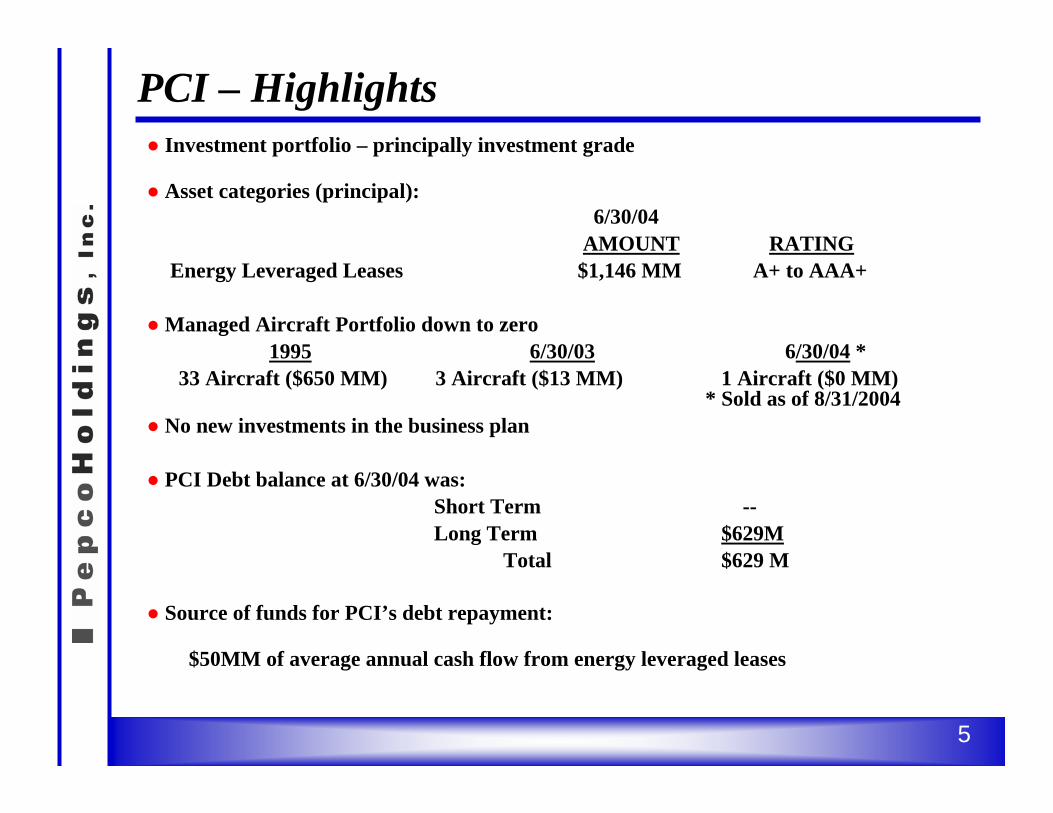
● Investment portfolio – principally investment grade
● Asset categories (principal):6/30/04
AMOUNT RATINGEnergy Leveraged Leases $1,146 MM A+ to AAA+
● Managed Aircraft Portfolio down to zero1995 6/30/03 6/30/04 *
33 Aircraft ($650 MM) 3 Aircraft ($13 MM) 1 Aircraft ($0 MM)* Sold as of 8/31/2004
● No new investments in the business plan
● PCI Debt balance at 6/30/04 was:Short Term --Long Term $629M
Total $629 M
● Source of funds for PCI’s debt repayment:
$50MM of average annual cash flow from energy leveraged leases
PCI – Highlights
5
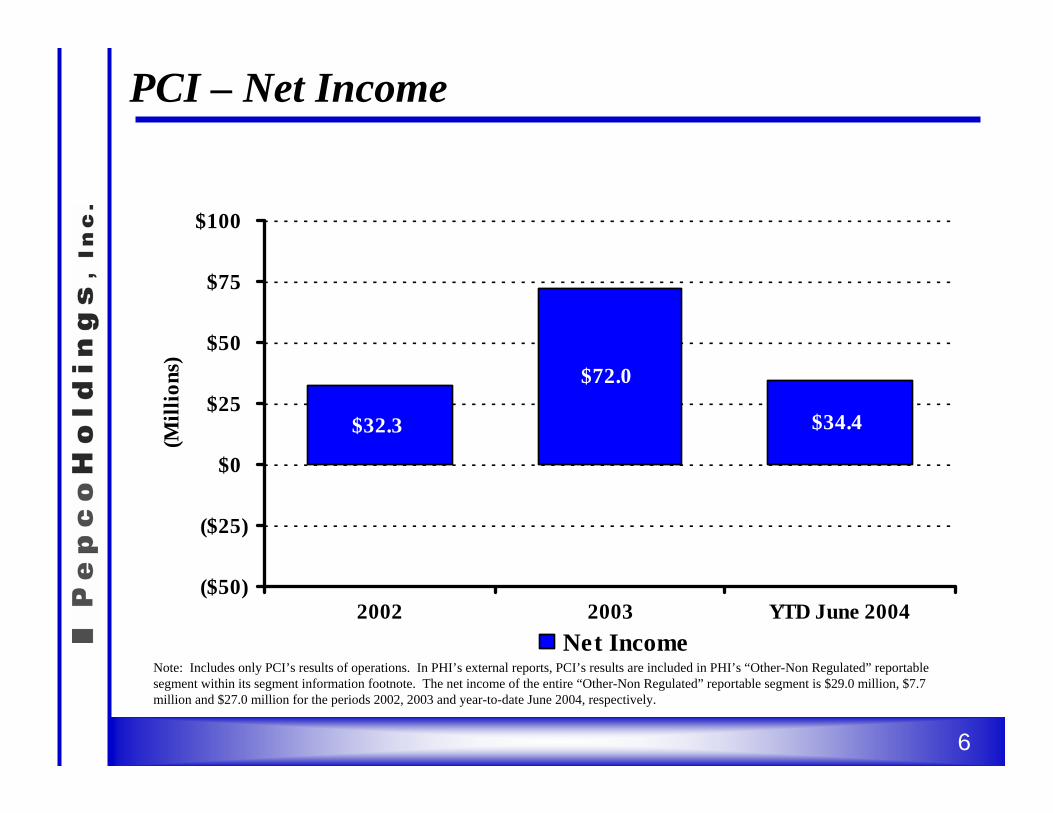
PCI – Net Income
$32.3
$72.0
$34.4
($50)
($25)
$0
$25
$50
$75
$100
2002 2003 YTD June 2004
(Mill
ions
)
Net IncomeNote: Includes only PCI’s results of operations. In PHI’s external reports, PCI’s results are included in PHI’s “Other-Non Regulated” reportable segment within its segment information footnote. The net income of the entire “Other-Non Regulated” reportable segment is $29.0 million, $7.7 million and $27.0 million for the periods 2002, 2003 and year-to-date June 2004, respectively.
6

Risk Management &Financial Review
Joe RigbySenior Vice President & CFO
1

Risk Management
2
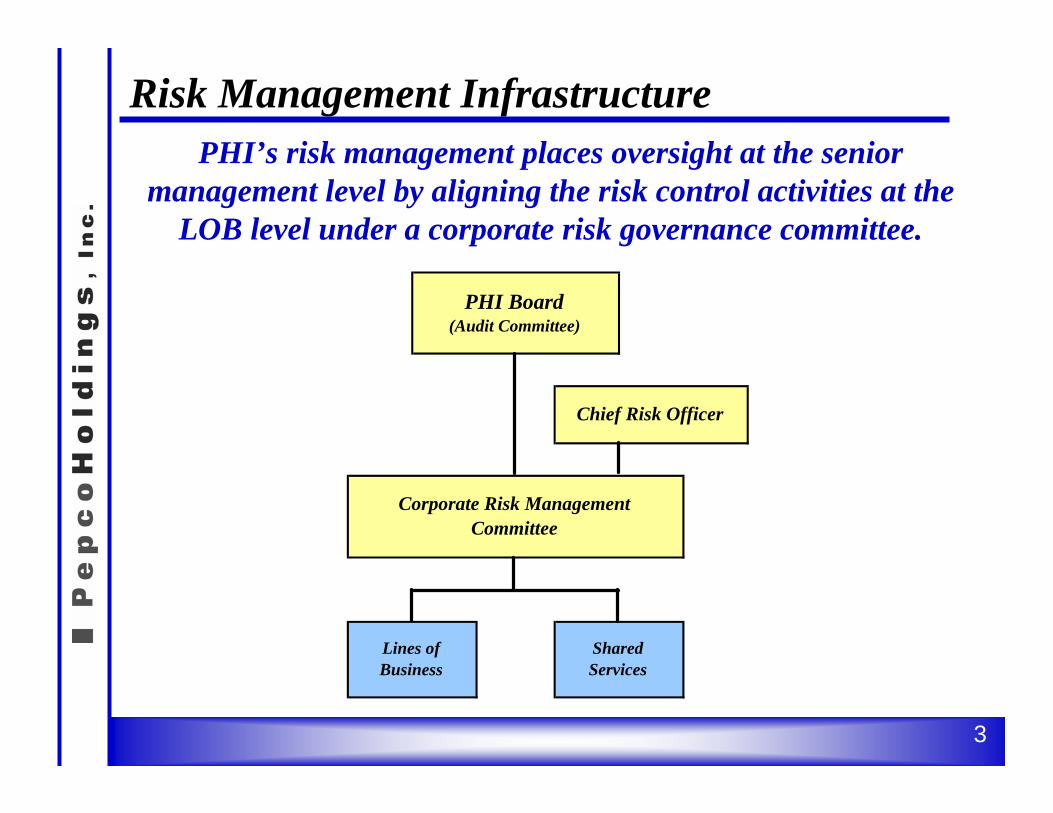
PHI’s risk management places oversight at the senior management level by aligning the risk control activities at the
LOB level under a corporate risk governance committee.
Risk Management Infrastructure
PHI Board(Audit Committee)
Chief Risk Officer
Corporate Risk ManagementCommittee
Lines ofBusiness
SharedServices
3

Very High
High
Medium
Low
Very Low
Very Low Low Medium High Very High
Very Low
Low Low
Low
Low
Low
Medium
Medium
Medium
Medium
Medium
Medium
Medium
Medium
Medium
High
High
High
High
High
High
High
Very High
Very High
Very High
Lik
elih
ood
of O
ccur
renc
e*
Materiality (Dollar Impact)**
PHI monitors risk on an enterprise-wide basis through an Aggregate Scoring Matrix that intersects a risk’s likelihood of occurrence with the
materiality of the occurrence.
Aggregate Scoring Matrix
* Probability ranges are assigned to each category from “Very Low” to “Very High”.** Dollar impact ranges are assigned to each category from “Very Low” to “Very High”.
Risk Management Infrastructure
4

Financial Review
5

Strengthening the Balance Sheet–Debt Reduction Plan
• PHI has a stated objective of reducing debt by $1 billion over the five year period ending 2007 (excluding application of recent common stock issuance proceeds)
• In 2003, PHI reduced debt by $250 million
• In 2004, PHI plans to reduce debt by approximately $100 million (excluding application of recent common stock issuance proceeds)
• PHI targets a common equity ratio in the mid-40% area by 2007 (excluding transition bonds)
6

Common Stock Offering
Issuance Date: September 15, 2004
Shares Issued: 14.95 million shares of common stock(13 million offered plus greenshoe)
Share Price: $19.25
Net Proceeds: $277.7 million
Use of Proceeds: Repay term debt
Distribution: 57% institutional; 43% retail
This offering allowed us to accelerate the de-levering of our balance sheet and is additive to our stated objective of reducing debt by $1 billion over the five year period ending 2007.
7
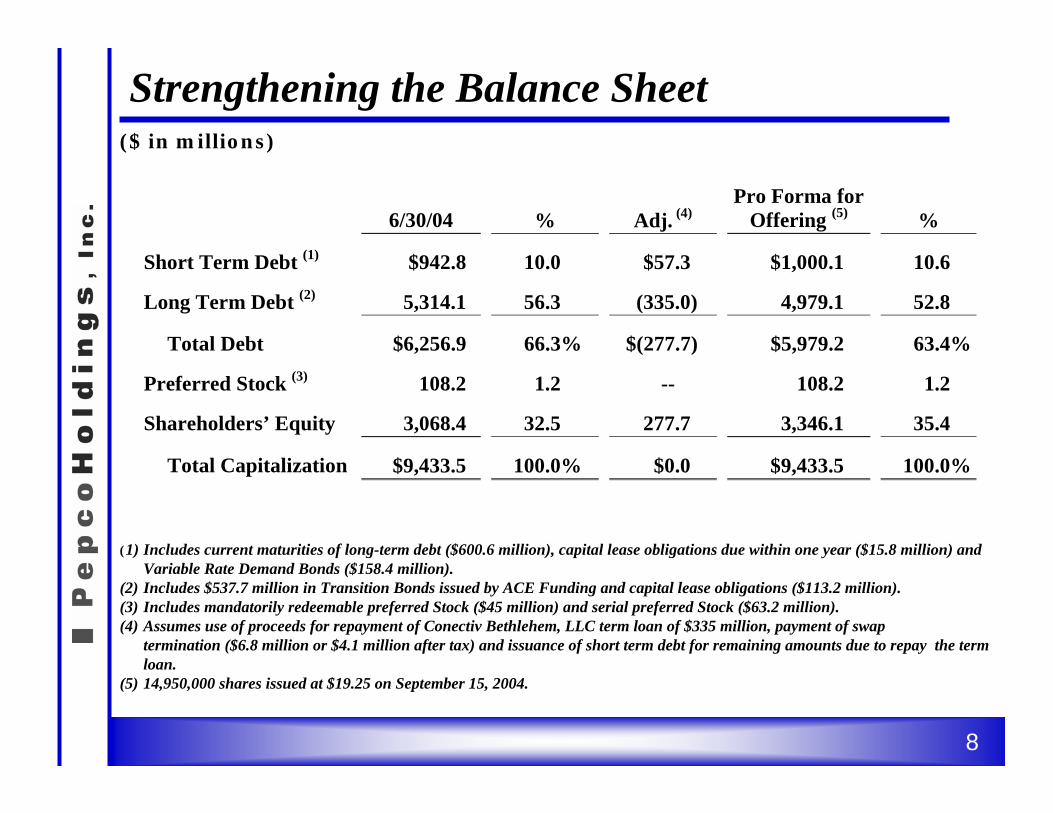
Strengthening the Balance Sheet
(1) Includes current maturities of long-term debt ($600.6 million), capital lease obligations due within one year ($15.8 million) and Variable Rate Demand Bonds ($158.4 million).
(2) Includes $537.7 million in Transition Bonds issued by ACE Funding and capital lease obligations ($113.2 million).(3) Includes mandatorily redeemable preferred Stock ($45 million) and serial preferred Stock ($63.2 million).(4) Assumes use of proceeds for repayment of Conectiv Bethlehem, LLC term loan of $335 million, payment of swap
termination ($6.8 million or $4.1 million after tax) and issuance of short term debt for remaining amounts due to repay the term loan.
(5) 14,950,000 shares issued at $19.25 on September 15, 2004.
($ in millions)
6/30/04 % Adj. (4) Pro Forma for
Offering (5) %
Short Term Debt (1) $942.8 10.0 $57.3 $1,000.1 10.6
Long Term Debt (2) 5,314.1 56.3 (335.0) 4,979.1 52.8
Total Debt $6,256.9 66.3% $(277.7) $5,979.2 63.4%
Preferred Stock (3) 108.2 1.2 -- 108.2 1.2
Shareholders’ Equity 3,068.4 32.5 277.7 3,346.1 35.4
Total Capitalization $9,433.5 100.0% $0.0 $9,433.5 100.0%
8
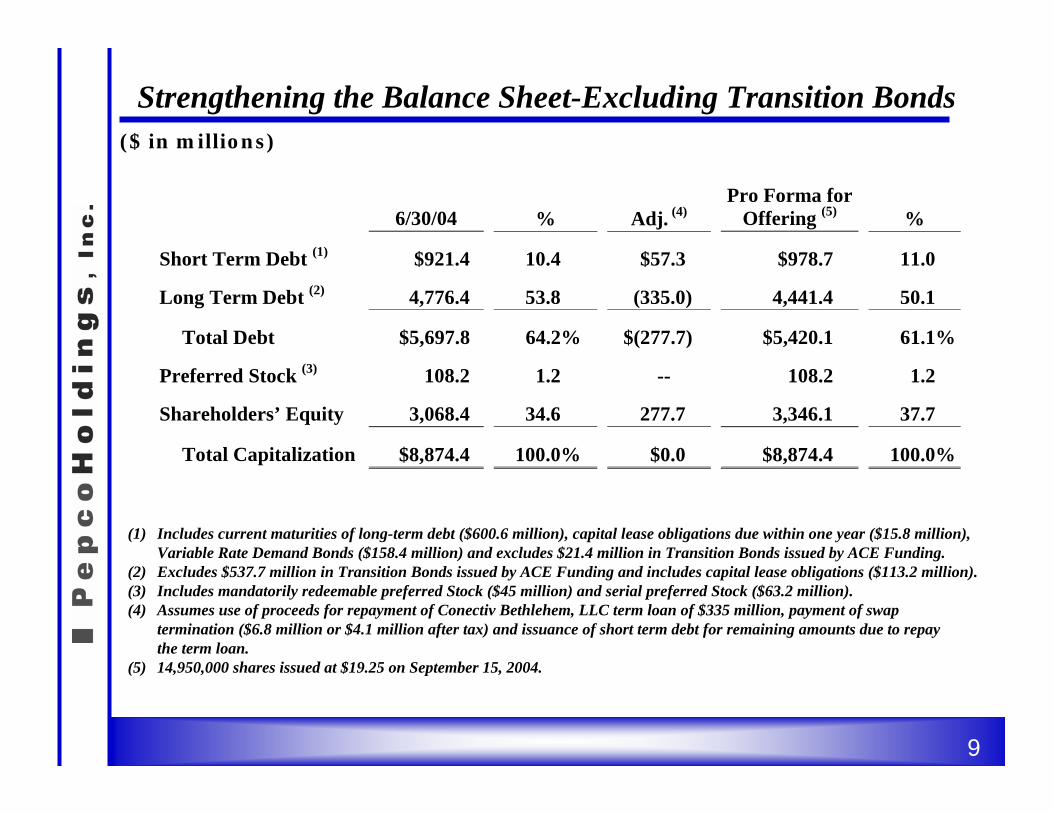
Strengthening the Balance Sheet-Excluding Transition Bonds
(1) Includes current maturities of long-term debt ($600.6 million), capital lease obligations due within one year ($15.8 million),Variable Rate Demand Bonds ($158.4 million) and excludes $21.4 million in Transition Bonds issued by ACE Funding.
(2) Excludes $537.7 million in Transition Bonds issued by ACE Funding and includes capital lease obligations ($113.2 million).(3) Includes mandatorily redeemable preferred Stock ($45 million) and serial preferred Stock ($63.2 million).(4) Assumes use of proceeds for repayment of Conectiv Bethlehem, LLC term loan of $335 million, payment of swap
termination ($6.8 million or $4.1 million after tax) and issuance of short term debt for remaining amounts due to repay the term loan.
(5) 14,950,000 shares issued at $19.25 on September 15, 2004.
($ in millions)
6/30/04 % Adj. (4) Pro Forma for
Offering (5) %
Short Term Debt (1) $921.4 10.4 $57.3 $978.7 11.0
Long Term Debt (2) 4,776.4 53.8 (335.0) 4,441.4 50.1
Total Debt $5,697.8 64.2% $(277.7) $5,420.1 61.1%
Preferred Stock (3) 108.2 1.2 -- 108.2 1.2
Shareholders’ Equity 3,068.4 34.6 277.7 3,346.1 37.7
Total Capitalization $8,874.4 100.0% $0.0 $8,874.4 100.0%
9
Cash from Operating Activities
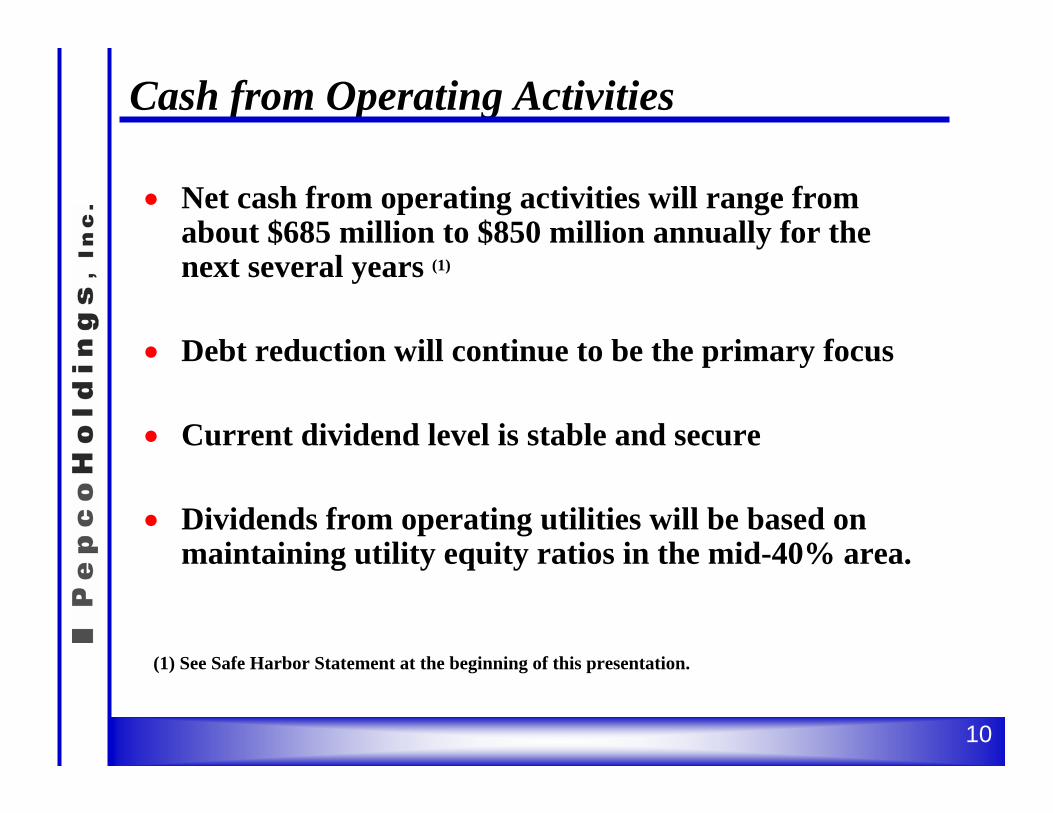
• Net cash from operating activities will range from about $685 million to $850 million annually for the next several years (1)
• Debt reduction will continue to be the primary focus
• Current dividend level is stable and secure
• Dividends from operating utilities will be based on maintaining utility equity ratios in the mid-40% area.
(1) See Safe Harbor Statement at the beginning of this presentation.
10

Capital Expenditures Covered by Internally Generated Funds
$37 $71 $65 $60 $52 $47
$355$360
$335 $328 $325 $337
$200
$29$28 $24 $23 $16
$0
$100
$200
$300
$400
$500
$600
$700
2003 Actual 2004 2005 2006 2007 2008
Power Delivery Transmission Power Delivery Distribution Non Regulated
Capital Expenditures($ in millions)
Note: See Safe Harbor Statement at the beginning of this presentation.
11

Holding Company
• Holding Company expenses will range between about $45 million to $55 million of costs annually (after-tax) that are not allocated to subsidiaries.(1)
These costs are primarily interest expense.
• As of September 30, 2004, the Holding Company had $2.2 billion of long-term debt outstanding.∗ As of September 30, 2004, the Holding Company had
$1.3 billion in loans to operating subsidiaries. ∗ These operating subsidiaries make debt service
payments to the parent.
(1) See Safe Harbor Statement at the beginning of this presentation.
12

Liquidity Position
Pepco Operating($ in millions) Holdings, Inc. Utilities Total
Credit Facility Capacity 700$ 500$ 1,200$
CP Outstanding 134$ 63$ 197$ LOC Outstanding 11$ 7$ 18$
Total Outstanding 145$ 70$ 215$
Total Unused Capacity at 9/30/04 555$ 430$ 985$
As of September 30, 2004
13
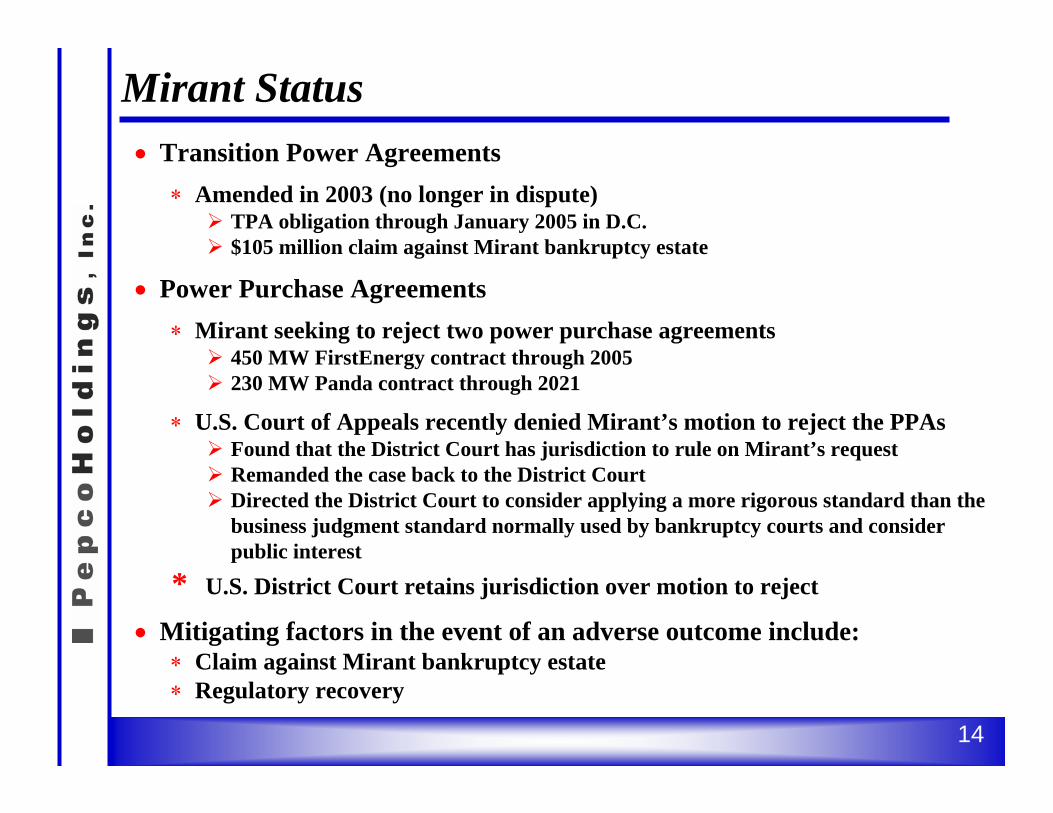
• Transition Power Agreements∗ Amended in 2003 (no longer in dispute)
TPA obligation through January 2005 in D.C.$105 million claim against Mirant bankruptcy estate
• Power Purchase Agreements∗ Mirant seeking to reject two power purchase agreements
450 MW FirstEnergy contract through 2005230 MW Panda contract through 2021
∗ U.S. Court of Appeals recently denied Mirant’s motion to reject the PPAsFound that the District Court has jurisdiction to rule on Mirant’s requestRemanded the case back to the District CourtDirected the District Court to consider applying a more rigorous standard than the business judgment standard normally used by bankruptcy courts and consider public interest
* U.S. District Court retains jurisdiction over motion to reject
• Mitigating factors in the event of an adverse outcome include:∗ Claim against Mirant bankruptcy estate∗ Regulatory recovery
Mirant Status
14

Strong Performance Through June 2004
(1) Adjusted to eliminate supplemental items. Detail of adjustments can be found in the Appendix on page 19 as well as in the second quarter earnings release dated August 6, 2004 at www.pepcoholdings.com.
PHI Earnings per Share
6 Months Ended June 30, 2004 6 Months Ended June 30, 2003
GAAP Adj. As Adjusted(1) GAAP Adj. As Adjusted(1)
Power Delivery $0.66 ($0.05) $0.61 $0.55 $0.06 $0.61
Unregulated
Conectiv Energy 0.17 (0.04) 0.13 (0.51) 0.54 0.03
Pepco Energy Services
0.04 (0.01) 0.03 (0.01) -- (0.01)
Other – Non Regulated 0.15 (0.01) 0.14 0.11 -- 0.11
Corporate & Other (0.20) (0.01) (0.21) (0.03) (0.20) (0.23)
Total $0.82 ($0.12) $0.70 $0.11 $0.40 $0.51
15

Stable, Secure Dividend
Note: Dividend yield = Annual dividend per share / common stock price per sharePricing data as of September 27, 2004Source for S&P Electric Utilities information is Factset
Attractive Yield • Indicated annual dividend of
$1 per share
• Current dividend yield is 31% higher than the average dividend yield for companies in the S&P Electric Utilities
• Utility cash flows completely cover dividend
3.91%
5.11%
0.0%
1.0%
2.0%
3.0%
4.0%
5.0%
6.0%
7.0%
0.0x
2.0x
4.0x
6.0x
8.0x
10.0x
12.0x
Dividend Yield
PHI S&P Electric Utilities
16
Investment Highlights
• Improving credit profile
• Stable, regulated and diversified delivery business
• Conservatively managed competitive energy businesses profitably situated in mid-Atlantic region
• Predictable free cash flow
• Strong financial results through June 2004 reflect solid execution of the business plan and favorable weather
• Attractive total return potential with a stable, secure dividend
17

Appendix
18
Year to Date JuneCompetitive Energy
PowerDelivery
ConectivEnergy
Pepco Energy Services
Other -Non
RegulatedCorporate
& OtherTotalPHI
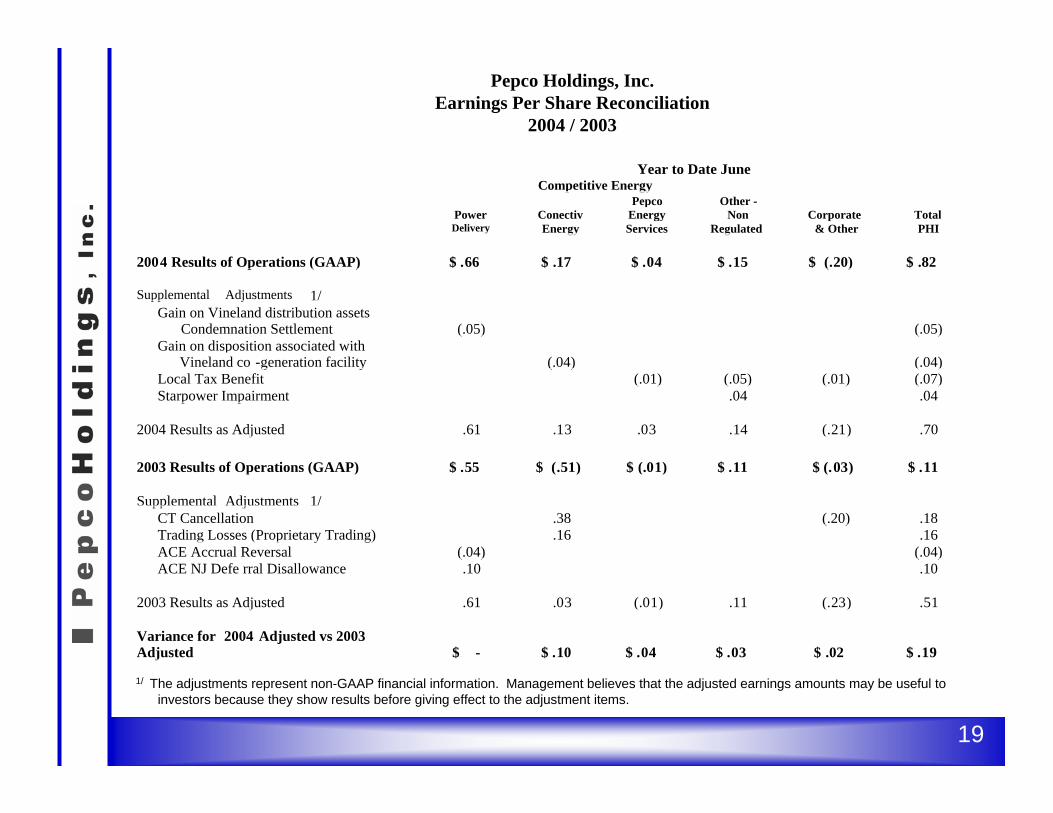
2004 Results of Operations (GAAP) $ .66 $ .17 $ .04 $ .15 $ (.20) $ .82
Supplemental Adjustments 1/Gain on Vineland distribution assets
Condemnation Settlement (.05) (.05)Gain on disposition associated with
Vineland co -generation facility (.04) (.04)Local Tax Benefit (.01) (.05) (.01) (.07)Starpower Impairment .04 .04
2004 Results as Adjusted .61 .13 .03 .14 (.21) .70
2003 Results of Operations (GAAP) $ .55 $ (.51) $ (.01) $ .11 $ (.03) $ .11
Supplemental Adjustments 1/CT Cancellation .38 (.20) .18Trading Losses (Proprietary Trading) .16 .16ACE Accrual Reversal (.04) (.04)ACE NJ Defe rral Disallowance .10 .10
2003 Results as Adjusted .61 .03 (.01) .11 (.23) .51
Variance for 2004 Adjusted vs 2003 Adjusted $ - $ .10 $ .04 $ .03 $ .02 $ .19
1/ The adjustments represent non-GAAP financial information. Management believes that the adjusted earnings amounts may be useful to investors because they show results before giving effect to the adjustment items.
Pepco Holdings, Inc.Earnings Per Share Reconciliation
2004 / 2003
19


