pepco berenson0306
TRANSCRIPT

The Right Stuff
Positioned for Success in a Dynamic Industry
Southeast Utilities Seminar March 21, 2006
Joseph M. RigbySenior Vice President & Chief Financial Officer

Safe Harbor Statement
Some of the statements contained in today’s presentation are forward-looking statements within the meaning of Section 21E of the Securities Exchange Act of 1934 and are subject to the safe harbor created by the Private Securities Litigation Reform Act of 1995. These statements include all financial projections and any declarations regarding management’s intents, beliefs or current expectations. In some cases, you can identify forward-looking statements by terminology such as “may,” “will,” “should,” “expects,”“plans,” “anticipates,” “believes,” “estimates,” “predicts,” “potential” or “continue” or the negative of such terms or other comparable terminology. Any forward-looking statements are not guarantees of future performance, and actual results could differ materially from those indicated by the forward-looking statements. Forward-looking statements involve estimates, assumptions, known and unknown risks, uncertainties and other factors that may cause actual results, levels of activity, performance or achievements to be materially different from any future results, levels of activity, performance or achievements expressed or implied by such forward-looking statements. Each forward-looking statement speaks only as of the date of the particular statement, and we undertake no obligation to publicly update or revise any forward-looking statement, whether as a result of new information, future events or otherwise.
2

A number of factors could cause actual results or outcomes to differ materially from those indicated by the forward-looking statements contained in this presentation. These factors include, but are not limited to, prevailing governmental policies and regulatory actions affecting the energy industry, including with respect to allowed rates of return, industry and rate structure, acquisition and disposal of assets and facilities, operation and construction of plant facilities, recovery of purchased power expenses, and present or prospective wholesale and retail competition; changes in and compliance with environmental and safety laws and policies; weather conditions; population growth rates and demographic patterns; competition for retail and wholesale customers; general economic conditions, including potential negative impacts resulting from an economic downturn; growth in demand, sales and capacity to fulfill demand; changes in tax rates or policies or in rates of inflation; potential changes in accounting standards or practices; changes in project costs; unanticipated changes in operating expenses and capital expenditures; the ability to obtain funding in the capital markets on favorable terms; restrictions imposed by Federal and/or state regulatory commissions; legal and administrative proceedings (whether civil or criminal) and settlements that influence our business and profitability; pace of entry into new markets; volatility in market demand and prices for energy, capacity and fuel; interest rate fluctuations and credit market concerns; and effects of geopolitical events, including the threat of domestic terrorism. Readers are referred to the most recent reports filed with the Securities and Exchange Commission.
Safe Harbor Statement (Continued)
3
We’ve made progress on several strategic issues amid considerable challenges since the 2002 merger
Paid down merger related debt
Divested non-strategic businesses
Effectively managed through Mirant bankruptcy process to date
Invested in our utility infrastructure (rate base) at appropriate levels, with appropriate goals
Integrated the operating utilities
Developed a successful C&I commodity business at Pepco Energy Services that is expandable
Managed Conectiv Energy through cyclical downturn in energy markets
We’ve Delivered
4
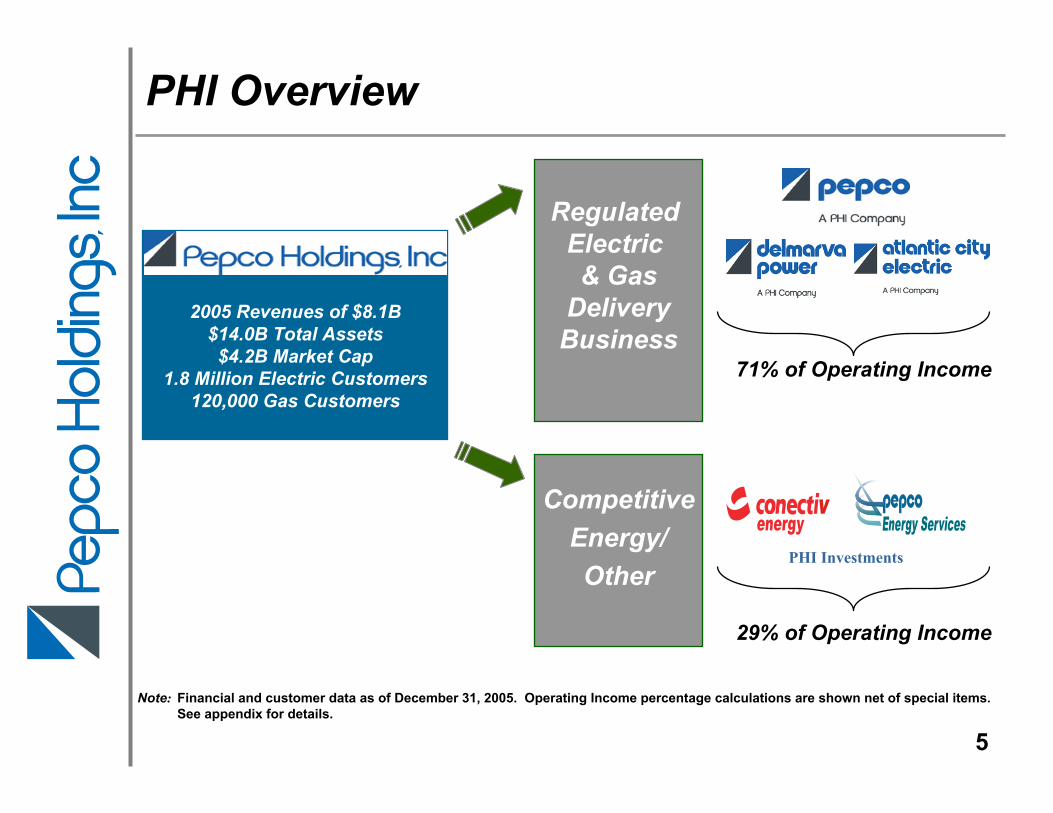
PHI Overview
2005 Revenues of $8.1B$14.0B Total Assets$4.2B Market Cap
1.8 Million Electric Customers120,000 Gas Customers
Regulated Electric & Gas
DeliveryBusiness
Regulated Electric & GasDeliveryBusiness
CompetitiveEnergy/Other
71% of Operating Income
29% of Operating Income
Financial and customer data as of December 31, 2005. Operating Income percentage calculations are shown net of special items. See appendix for details.
PHI Investments
Note:
5

Power Delivery Utility OperationsOperate with excellenceAchieve constructive regulatory outcomesInvest in infrastructure
Conectiv EnergyOptimize assets and capture market opportunitiesAdjust hedging strategy as conditions changeContinue to evaluate asset purchase opportunities
Pepco Energy ServicesExpand into additional attractive markets
PHI’s corporate strategy is to remain a regional diversified energy delivery utility and competitive services company
focused on value creation and operational excellence
PHI Strategy - Summary
Note: See Safe Harbor Statement at the beginning of today’s presentation. 6

+ Sales Growth
+ Infrastructure Investments
+ Operational Excellence
+ Constructive Regulatory Outcomes
At Least 4% Annual AverageEarnings Growth
Power Delivery Summary
Deliver
Achieve
Note: See Safe Harbor Statement at the beginning of today’s presentation.
7

Robust Service Territory EconomyArea is less susceptible to economic downturnsEmployment growth exceeds national averageDiverse government and private sectors Per capita income is 15% above national averageSales growth of approximately 2%
Power Delivery Business Service Territory
Commercial 46%
Combined Service Territory
Diversified Customer Mix
Residential 35%
Government 10%
Industrial 9%
2005 Mwh Sales Note: See Safe Harbor Statement at the beginning of today’s presentation.8
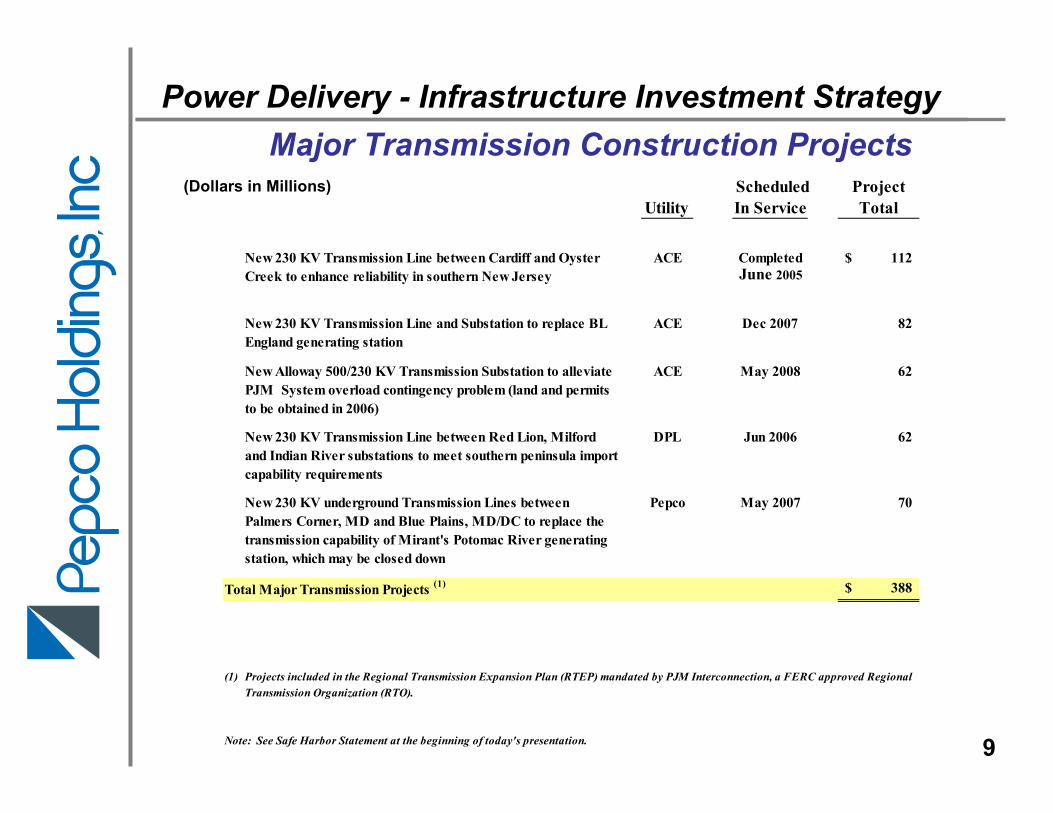
Power Delivery - Infrastructure Investment StrategyMajor Transmission Construction Projects
Scheduled ProjectUtility In Service Total
New 230 KV Transmission Line between Cardiff and Oyster Creek to enhance reliability in southern New Jersey
ACE Completed 112$
New 230 KV Transmission Line and Substation to replace BL England generating station
ACE Dec 2007 82
New Alloway 500/230 KV Transmission Substation to alleviate PJM System overload contingency problem (land and permits to be obtained in 2006)
ACE May 2008 62
New 230 KV Transmission Line between Red Lion, Milford and Indian River substations to meet southern peninsula import capability requirements
DPL Jun 2006 62
New 230 KV underground Transmission Lines between Palmers Corner, MD and Blue Plains, MD/DC to replace the transmission capability of Mirant's Potomac River generating station, which may be closed down
Pepco May 2007 70
Total Major Transmission Projects (1) 388$
(1)
Note: See Safe Harbor Statement at the beginning of today's presentation.
Projects included in the Regional Transmission Expansion Plan (RTEP) mandated by PJM Interconnection, a FERC approved Regional Transmission Organization (RTO).
9
(Dollars in Millions)
June 2005

Power Delivery - Summary of Regulated Assets
(1) Data are taken from the most recent reports filed with the Company’s regulatory commissions between December 31, 2004 and September 30, 2005 (except Atlantic City Electric which is December 31, 2002). Such reports are developed in accordance with commission instructions, which are not necessarily the same as, and do not necessarily reflect, the Company’s filing position in all respects.
(2) Reflects 2005 actual expenditures and 2006 through 2009 projected expenditures.
Note: See Safe Harbor Statement at the beginning of today’s presentation.
2005-2009Capital Rate
Base (1) Expenditures (2)
Distribution Rate Bases:
Electric (Pepco, DPL and ACE) $3,101 1,690$ Gas (DPL) 223 101
Transmission Rate Base (12/31/04) 790 577
Total Regulated Assets $4,114 $2,368
(Dollars in Millions)
10

Power Delivery - Regulated Distribution Summary
11
(Dollars in Millions) Atlantic CityElectric
District of DelawareColumbia Maryland Delaware Maryland Virginia Gas New Jersey
Date of Most Recent Report 12/31/04 9/30/05 3/31/05 12/31/04 12/31/04 9/30/05 12/31/02
Rate Base $973.9 $786.6 $418.9 $235.5 $31.3 $222.8 $654.9 Equity Ratio 47.46% 46.71% 47.72% 49.29% 49.29% 47.76% 46.22%
Earned Return on Rate Base (as adjusted) 6.96% 6.91% 7.47% 5.10% 5.75% 4.57% 8.14%
Regulatory Earned Return on Equity 7.47% 7.86% 10.64% 4.76% 6.06% 4.41% Not stipulated
Most Recent Authorized Return on Equity 11.10% 11.00% 11.50% 11.90% 11.05% 10.50% Not stipulated
Anticipated Filing Date Fall 2006 Summer 2006 Filed 9/05 Summer 2006 N/A TBD N/A
Notes: See appendix for additional details.
See Safe Harbor Statement at the beginning of today's presentation.
Pepco Delmarva Power

Standard Offer ServiceDelaware
Supply pricing becomes market based 5/1/06 for Delmarva Power customers
Competitive bid process for supply completed; 59% total bill increase for residential customers to become effective 5/1/06
Delmarva Power filed a deferral proposal with the DE PSC on 3/16/06
Three step phase in of rates over thirteen months –• One third on 5/1/06, one third on 1/1/07, then full increase on 6/1/07
Maximum after-tax deferral balance of approximately $60 million Recovery of deferral balance, plus interest costs, over two years, beginning 6/1/07
Maryland
Supply pricing became market based 7/1/04 for Pepco and Delmarva Power customers
Competitive bid process for supply completed; 35% - 39% total bill increase for residential customersto become effective 6/1/06
Pepco and Delmarva Power filed a deferral proposal with the MD PSC on 3/15/06
Two step phase in of rates over nine months –• 21% through 2/28/07, then full increase on 3/1/07
Maximum after-tax deferral balance (Pepco + Delmarva) of approximately $60 million Recovery of deferral balance, plus interest costs, over 15 months, beginning 3/1/07
12

Conectiv Energy - Business Overview
Hay Road – 1,066 MW’s Bethlehem – 1,092 MW’s
Property, Plant & Equipment – 12/31/05 $ 1,309 million
Average Net Cost of Installed Capacity $ 354/kW
Number of Generating Units 52
Number of Plant Sites 18
Generating Capacity 3,692 MWs
2005 Earnings $ 48.1 million
Hay Road ~ 1,090 MWs Bethlehem ~ 1,092 MWs
13

Conectiv Energy – Business Drivers
Liquid PJM market provides hedging flexibility
Generation output and natural gas requirements highly hedged in 2006
Hedge position provides near-term predictability and preserves long-term upside potential
Hedge Positions Hedge Positions Enhance ValueEnhance Value
Improving Market Improving Market Conditions Conditions
Amplify ValueAmplify Value
Market conditions strengthening in PJM● Continued PJM load growth ● Improving generation margins
Minimal new PJM capacity additions planned
PJM considering new capacity pricing method that may provide higher and more stable prices for capacity
Focus Captures Focus Captures ValueValue
Advantageous PJM location● Flexible, multi-fuel capable plants● Favorable PJM East locations
Competitive capacity within the mid-merit supply in PJM East● Significant ancillary service capabilities● Minimal capital expenditures needed
14

Conectiv Energy has been successful in recent SOS auctions with load contracted in MD, NJ, DE, VA, and DC
Conectiv Energy uses a combination of standard swap contracts, tolling agreements and standard offer service agreements
Hedging values for energy and capacity margins are meeting 36 month targets:
Month Target Range As of 12/31/051 – 12 50 – 100% 91%
13 – 24 25 – 75% 66%25 – 36 0 – 50% 18%
PJM’s proposal on capacity pricing is still being considered by the FERC
Conectiv Energy - Recent Activities
15

Conectiv Energy –Generation & Full Requirements Gross Margins*
$0
$50
$100
$150
$200
$250
$300
2004 Actual 2005 Actual 2006 Forecast* 2007 Forecast*
Dol
lars
in M
illio
ns
Actual Results Forecast Annual Gross Margin*
$ 267 $ 248 $ 240
$ 200
$ 300
$ 240
* See Safe Harbor Statement at the beginning of today’s presentation. See appendix for Other Power, Oil and Gas Marketing gross margins forecast.See appendix for additional information regarding Generating and Full Requirements gross margins forecast.
16

Pepco Energy Services Overview
A retail energy supply and energy services business serving the C&I market:
C&ICustomers
Retail Energy Supply• Electricity• Natural Gas• 800 MW Generation
Energy Services• Energy savings performance contracting• Central Plant operations and maintenance• Construction• Other Services
17

Pepco Energy Services Competitive Edge
• Relationship-based Sales– Not brand dependent– 14 local sales offices
• Conservative Supply Acquisition– Manage toward a flat book; no speculative trading– Value-at-Risk Limit: $3 million
• Innovative Products– Strong back office allows for tailored billing options– Contract optionality creates value for both PES and customer by taking
advantage of changes in wholesale versus SOS rates– ESCO business unit provides additional services to customers
• Strong Earnings Growth– 2005 earnings doubled versus 2004– 2005 results indicative of near-term future earnings– Going forward, earnings will depend on regulatory and market conditions
Note: See Safe Harbor Statement at the beginning of today’s presentation. 18

Pepco Energy Services – C&I Retail Load Growth
Gross Margins• Planned: $3 per MWh range• Realized: Higher than planned
MW
h(m
illion
s)
Sales Volume
Note: See Safe Harbor Statement at the beginning of today’s presentation. 19
0
2
4
6
8
10
12
14
2001 2002 2003 2004 2005
MD NJ DC Other

(Restated) (Restated)2005 2004 2005 2004
$302.1 $227.1 Power Delivery $225.0 $218.5
$48.1 $60.2 Conectiv Energy $50.7 $61.8
$25.7 $12.9 Pepco Energy Services $25.7 $11.4
$47.9 $25.6 Other Non-Regulated $39.0 $44.0
($52.6) ($65.2) Corporate & Other ($52.6) ($62.1)
Earnings excludingActual Earnings Special Items
$287.8 $273.6$371.2 $260.6 Total PHI
Note: Management believes the special items are not representative of the Company’s core business operations. See Appendix for details.
See Appendix for 2005 Financial Highlights.
(Dollars in Millions)
PHI Financial Performance
20
Year Ended December 31, Year Ended December 31,

Notes:1) Other debt includes capital lease obligations ($135.4M), Company Obligated Mandatorily Redeemable Preferred Securities of Subsidiary Trust which holds Parent Junior
Subordinated Debentures ($290.0M), Mandatorily Redeemable Serial Preferred Stock ($47.5M), Serial Preferred Stock ($63.2M), Short-term debt ($1,362.4M) and Long-term debt ($4,287.5M).
2) Other debt includes capital lease obligations ($131.2M), Company Obligated Mandatorily Redeemable Preferred Securities of Subsidiary Trust which holds solely Parent Junior Subordinated Debentures ($98.0M), Mandatorily Redeemable Serial Preferred Stock ($45.0M), Serial Preferred Stock ($63.2M), Short-term debt ($872.4M) and Long-term debt ($4,588.9M).
3) Other debt includes capital lease obligations ($127.0M), Serial Preferred Stock ($54.9M), Short-term debt ($802.5M) and Long-term debt ($4,362.1M).4) Other debt includes capital lease obligations ($121.9M), Serial Preferred Stock ($45.9M), Short-term debt ($594.3M) and Long-term debt ($4,202.9M).5) Total capitalization excludes Transition Bond Debt and includes Pepco Energy Services’ Project Debt.
Common Equity Ratio (5) 32.5% 33.6% 38.1% 41.8%
Strengthening the Balance Sheet
Total Debt and Preferred Stock
$6,186$5,799
$5,347$4,965
$440$577
$551$523
$3,000
$4,000
$5,000
$6,000
$7,000
12/31/2002 12/31/2003 12/31/2004 12/31/2005
(Mill
ions
)
Other Debt & Preferred Transition Bond Debt
$6,626$6,376
$5,898
$5,488
Total Reduction= $1.14 B
$0(1) (2) (3) (4)
21

$0
$100
$200
$300
$400
$500
$600
$700
$800
$900
2005 Actual 2006 Projection 2007 Projection 2008 Projection 2009 Projection
Dividends and Capital Expenditures (2)
Mill
ions
(1) Cash from operations in 2005 excluding proceeds of $112.9 million from sale of Pepco’s Mirant TPA claim is $874 million.(2) Dividend amount is based on the current annualized dividend rate of $1.04 per share. The dividend level is reviewed quarterly by
the Board of Directors.
See Safe Harbor Statement at the beginning of today’s presentation.
Cash from Operations Projected Range - $750M to $850M
Cash from Operations -Covers Dividends and Capital Expenditures
22
(1)
Dividends and Cap. Ex.
Cash from Operations
$656 $768 $702 $697 $677
Actual$874 M

$104$170 $141
$100$62
$328
$365
$336$370
$392
$35
$36
$28 $30$26
$0
$100
$200
$300
$400
$500
$600
2005 Actual 2006 Projection 2007 Projection 2008 Projection 2009 Projection
Mill
ions
Transmission Distribution Competitive
Capital Expenditures
Note: See Safe Harbor Statement at the beginning of today’s presentation.
$467
$571
$505 $500 $480
Capital Expenditures -Covered by Internally Generated Funds
23

Indicated annual dividend of $1.04 per share
Current dividend yield is 26% higher than the average dividend yield for companies in the S&P Electric Utilities
Notes: Dividend yield = Annual dividend per share / common stock price per sharePricing data as of February 28, 2006
Source for S&P Electric Utilities information is Thomson Financial
Attractive Dividend Yield
Stable, Secure Dividend
4.38%
3.47%
0.0%
1.0%
2.0%
3.0%
4.0%
5.0%
PHI S&P Electric Utilities
24

Growing regulated utility earnings base with incremental earnings from competitive energy businesses
Robust cash flow supports attractive dividend rate and provides cash for growth investments
On-going strengthening of the balance sheet
We’ve delivered on our commitments
Why Invest in PHI ?
Note: See Safe Harbor Statement at the beginning of today’s presentation.25

Appendix
26

RegulatoryRegulatory
27

New Jersey base rate case settled effective June 2005; annual pre-tax earnings increase of approximately $20 million
FERC formula rate application filed for annual transmission rate update; rates in effect June 1, 2005 subject to refundDelaware base rate case pending; filed for $5.1 million annual increase inelectric rates
Maryland and the District of Columbia base rate cases being prepared. Ratecaps end effective 1/1/2007 and 8/7/2007, respectively
SOS Margins establishedDistrict of Columbia (Pepco) and Maryland (Pepco/DPL) – approximately 0.2 cents per kilowatt hour, on averageDelaware (DPL) – Key component of margin is a fixed annual amount of $2.75 million (effective May 2006)
Auction completed for ACE’s interests in Keystone and Conemaugh. Auction for B. L. England expected to be completed in early 2006
Decision pending on appeal of 2003 New Jersey $45 million deferraldisallowance decision
Power Delivery Regulatory Highlights
28

Maryland District of Columbia Delaware New Jersey Virginia
2005 MWh Distribution Sales(1) 39% 22% 18% 20% 1%
Retail Delivery Rate Cap Through December 2006 (unless FERC transmission rates increase more than 10%)
Through August 2007 (unless FERC transmission rates increase more than 10%)
Through April 2006 (with a one-time exception for FERC transmission rate changes)
No caps Through December 2010 (with exceptions)
Default Service
Provided through a PSC approved wholesale bidding process; approximately 0.2¢/kWh margin to Pepco / DPL
Provided through a PSC approved wholesale bidding process; approximately 0.2¢/kWh margin to Pepco
Third party supplier through April 2006 (provided by Conectiv Energy); thereafter to be provided through a PSC approved bidding process; settlement provides for a fixed annual margin of $2.75M
Provided through a BPU approved wholesale bidding process
Provided through DPL managed competitive bidding process
Recent Rate Case Outcomes In rate review cases mandated by the merger, it was shown that the current delivery rates for Pepco and DPL should not be decreased, and that DPL was entitled to increase delivery rates by $1.1M, effective 7/04, which was the only increase allowed under the merger settlements until 2007
In rate review case mandated by the merger settlement, it was shown that the current delivery rates for Pepco should not be decreased; no increase was allowed under the settlement
Gas base rate increase of $7.75M effective 12/03; ancillary service rate increase of $12.4M effective 7/04; transmission service revenue filing pending ($6.2 M); base rate case pending ($5.1M)
Annual pre-tax earnings increase of approximately $20M effective 6/05
None
Power Delivery Regulatory Summary
(1) As a percentage of total PHI distribution sales. 29

Filed September 1, 2005
Requested $5.1 million annual increase in electric rates$1.6 million* in distribution rates and $3.5 million transferred from distribution to supply rates
Requested capital structure/rate of return:
7.64%100.00%Total
5.25%11.00%47.72%Common Equity0.08%4.81%1.73%Preferred Stock
2.31%4.57%50.55%Long Term Debt
Overall RORCost RateRatioType of Capital
Key Dates:Hearing Examiner’s Report – March 31, 2006Proposed Effective Date – May 1, 2006
* Includes $0.4 million for changes in collection and reconnect fees
Delmarva Power – Delaware Rate Case
30

Notes: (1) Rates in effect from 6/1/2005 are subject to refund and reflect a requested 12.9% return on equity. Settlement discussions ongoing.
(2) The decrease in Pepco revenue is offset by a corresponding increase in distribution revenue through December 2006 in MD and August 2007 in DC up to a 10% decrease in transmission rates.
(3) A portion of the Delmarva increase (the portion attributable to Maryland) is offset by a decrease in distribution rates through December 2006 up to a 10% increase in transmission rates.
(4) Details of the formula rate filing are available at www.pjm.com/Services/Transmission Services/Formula Rates.
See Safe Harbor Statement at the beginning of today’s presentation.
12/31/04 Rate Base
2004
Wholesale Transmission
Revenue
Annual Wholesale Transmission Revenue
Based on Rates in Effect 6/1/05 through 5/31/06
(1) (4) Pepco $311.8 $102.7 $ 93.6 (2) Delmarva Power 268.9 56.1 59.2 (3) Atlantic City Electric 209.7 43.7 44.6 Total $790.4 $202.5 $197.4 ( )
No significant impact in 2006 due to corresponding changes in distribution rates in MD and DC.
Beyond 2006, positive earnings impact realized as transmission rate base grows.
Transmission Rate Base(Dollars in Millions)
31

(Dollars in Millions) District of Columbia Maryland Date of Most Recent Report Data
12/31/04
9/30/05
Rate Base (1) $973.9 $786.6
Equity Ratio 47.46% 46.71%
Earned Return on Rate Base (as adjusted) (1) 6.96% 6.91%
Regulatory Earned Return on Equity (2) Most Recent Authorized Return on Equity
7.47%
11.10%(3)
7.86%
11.00% (4)
Revenue Increase Necessary Based on Earned Returns Shown Above at:
11.0% ROE $27.9 $19.6 Estimated total bill percentage increase (5) 10.5% ROE
4.1% $23.9
1.9% $16.5
Estimated total bill percentage increase (5) Anticipated Filing Date
3.5%
Fall 2006
1.6%
Summer 2006
Notes: (1) Data are taken from the most recent reports filed with the Company’s regulatory commissions between December 31, 2004 and September 30, 2005. Such reports are developed in accordance with Commission instructions, which are not necessarily the same as, and do not necessarily reflect, the Company’s filing position in all respects.
(2) The Regulatory Earned Return on Equity is computed by deducting the composite embedded costs of debt and preferred stock from the Earned Return on Rate Base and dividing the remainder by the equity percentage in the capital structure.
(3) Formal Case No. 939, Order No. 10646 effective 7/11/95.(4) Case No. 8791 Settlement, Order No. 74711 effective 12/1/98.(5) Based on total billed revenues for 12 month period ending with the dates noted above.
Regulated Distribution - Pepco
32
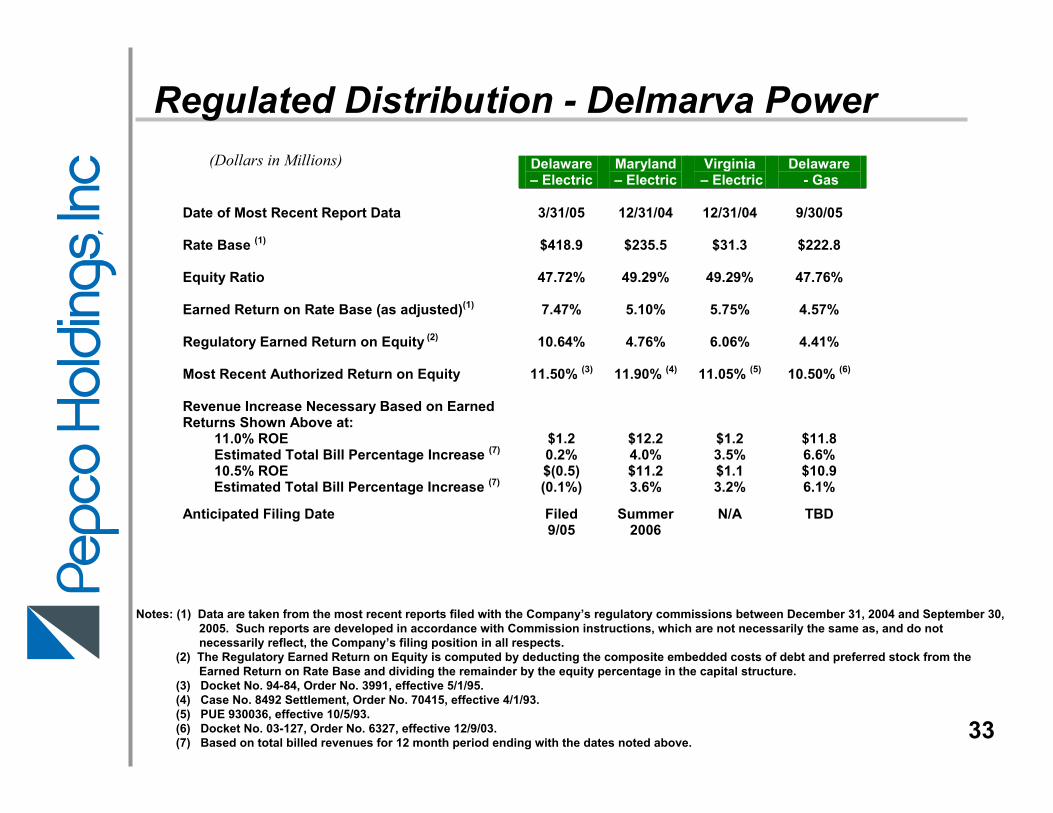
Delaware – Electric
Maryland – Electric
Virginia – Electric
Delaware - Gas
Date of Most Recent Report Data
3/31/05
12/31/04
12/31/04
9/30/05
Rate Base (1) $418.9 $235.5
$31.3 $222.8
Equity Ratio
47.72% 49.29% 49.29% 47.76%
Earned Return on Rate Base (as adjusted)(1) 7.47% 5.10%
5.75% 4.57%
Regulatory Earned Return on Equity (2) 10.64% 4.76%
6.06% 4.41%
Most Recent Authorized Return on Equity Revenue Increase Necessary Based on Earned Returns Shown Above at:
11.50% (3) 11.90% (4) 11.05% (5) 10.50% (6)
11.0% ROE $1.2 $12.2 $1.2 $11.8 Estimated Total Bill Percentage Increase (7) 10.5% ROE
0.2% $(0.5)
4.0% $11.2
3.5% $1.1
6.6% $10.9
Estimated Total Bill Percentage Increase (7) Anticipated Filing Date
(0.1%)
Filed 9/05
3.6%
Summer 2006
3.2%
N/A
6.1%
TBD
Notes: (1) Data are taken from the most recent reports filed with the Company’s regulatory commissions between December 31, 2004 and September 30,2005. Such reports are developed in accordance with Commission instructions, which are not necessarily the same as, and do notnecessarily reflect, the Company’s filing position in all respects.
(2) The Regulatory Earned Return on Equity is computed by deducting the composite embedded costs of debt and preferred stock from the Earned Return on Rate Base and dividing the remainder by the equity percentage in the capital structure.
(3) Docket No. 94-84, Order No. 3991, effective 5/1/95.(4) Case No. 8492 Settlement, Order No. 70415, effective 4/1/93.(5) PUE 930036, effective 10/5/93.(6) Docket No. 03-127, Order No. 6327, effective 12/9/03.(7) Based on total billed revenues for 12 month period ending with the dates noted above.
Regulated Distribution - Delmarva Power(Dollars in Millions)
33

New Jersey Date of Most Recent Report Data
12/31/02
Rate Base * $654.9
Equity ratio (as stipulated)
46.22%
Earned Return on Rate Base (as adjusted) * 8.14%
Regulatory Earned Return on Equity Most Recent Authorized Return on Equity
Not stipulated in settlement
Not stipulated in
settlement
* Data are taken from the Company’s approved settlement agreement in the most recent rate case. The Companydoes not file a periodic report with the New Jersey Board of Public Utilities.
Regulated Distribution – Atlantic City Electric(Dollars in Millions)
New Jersey rate case settled effective June 2005Annual pre-tax earnings increase of approximately $20 million
34

35

Conectiv Energy - Power, Oil and Gas Marketing
● Within this grouping the following major activities are housed:
- Oil marketing through our subsidiary Petron Oil Company- Power and Gas Origination activities- Short term power marketing via our real time desk- Third party asset management contracts
● Overall, our expectations from this segment are gross marginsin a range of $15-$25 million*
* See Safe Harbor Statement at the beginning of today’s presentation.36

Conectiv Energy –Generation & Full Requirements Forecasts*
● 2006 margins are likely to be impacted by several factors, compared to 2005:
↓ Lower value from standard product hedges↓ Expiration of tolling contract May 1, 2006↓ Weather↑ Expiration of POLR contracts↑ Option value of plants during summer peak period is regained
● 2007 margins reflect anticipated improvements over 2006 projections:↑ Higher capacity prices↑ Improved margins on standard product hedges↑ Higher output, reflecting improved supply/demand fundamentals↑ Re-pricing of POLR/SOS contracts
* See Safe Harbor Statement at the beginning of today’s presentation. 37

Conectiv Energy - Critical Assumptions*
Our forecasted generation and load serving margins reflect an improving PJM market and the following critical assumptions:
- 2006 generation is highly hedged - Merchant generation energy and capacity margin improvements
beginning in 2007- Generation output of 5.0 to 5.5 GWh’s in 2006- Generation output of 5.7 to 6.2 GWh’s in 2007- No change in PJM operating or dispatching rules- Maintaining improvements in plant availability and on-dispatch
results- Hedge effectiveness is maintained- Re-pricing of POLR/SOS contracts at more favorable margins- No replacement of existing tolling agreement- Replacement of standard product hedges at more favorable margins
* See Safe Harbor Statement at the beginning of today’s presentation. 38

Conectiv Energy Generation Plants
Bethlehem
Edge Moor/Hay Road
Deepwater
Crisfield
Tasley
Bayview
Missouri AvenueCumberland/Carll’s CornerDelaware City
Sherman Avenue
Middle
Cedar
MickletonChristiana
West
Mt. Carmel
Chesapeake
Essex
39
MW40
31560
Generation Capacity Under ContractMt. CarmelChesapeakeEssex
MW8481777368605945131516261012
Peaking UnitsCumberland 1Sherman Avenue 1Middle 1-3Carll’s Corner 1 & 2Cedar 1 & 2Missouri Avenue B,C,DMickleton 1Christiana Edge Moor Unit 10West SubDelaware CityTasley 10Crisfield 1-4Bayview 1-6
MW545545
1,092
Gas Combined CycleHay Road Units 1-4Hay Road Units 5-8Bethlehem Units 1-8
MW445
86
Oil Fired SteamEdge Moor 5Deepwater 1
MW260
80
Coal Fired BaseloadEdge Moor 3 & 4Deepwater 6

PHI – Financial Performance Details
40

PHI 2005 Financial Highlights (1)
Execution of our strategy generated favorable financial results
Power Delivery results driven by:Higher sales due to warmer weather; T&D system performed well as it handled new record peaks forelectric usage Lower interest expense due to aggressive debt buydown and refinancing effortsLower standard offer service margins due to increased customer migration
Conectiv Energy results driven by:Higher generation output due to warmer weather and load growth in PJM; output up 8.4% versus 2004Captured increased opportunities to take advantage of unit operating flexibilityLower Full Requirements Load Service margins due to higher energy pricesEffective hedging strategy and risk management capability provided stable results even with record high natural gas and oil prices
Pepco Energy Services results driven by:C&I retail load acquisition increased by 56% contributing to higher electric gross margins for the year Higher generation output due to warmer weather
Common equity ratio was 41.8% at year end 2005, an improvement of 370 basis points since year end 2004 (2)
(1) 2005 compared to 2004; excluding special items.(2) Exclusive of transition bonds issued by ACE Transition Funding.
41

Note: Management believes the special items are not representative of the Company’s core business operations.
Reconciliation of Earnings Per ShareGAAP EPS Reconciled to EPS Excluding Special Items
42
Earnings per Share
Twelve Months Ended December 31,
2005
(Restated) 2004
Reported (GAAP) Earnings per Share $1.96 $1.48 Special Items: Non lease financial asset IRS settlement - 0.11 IRS Revenue Ruling 2005-53 - Mixed Service Costs 0.06 - Conectiv Bethlehem term loan buy down - 0.04 Starpower investment impairment - 0.04 Severance cost accruals - 0.05 Impairment of jointly owned generation project 0.01 - New Jersey base rate case settlement (0.03) - Gain on sale of Vineland co-generation facility - (0.04) Gain on sale of Vineland distribution assets - (0.05) Liquidation of financial investment previously written off (0.04) - Local tax benefit - retroactive change in regulations - (0.07) Gain on sale of Buzzard Point non-utility land (0.22) - Gain on settlement of Mirant Transitional Power Agreement claim and asbestos claim (0.22) - Earnings per Share, Excluding Special Items $1.52 $1.56

Note: Management believes the special items are not representative of the Company’s core business operations.
Reconciliation of EarningsGAAP Earnings Reconciled to Earnings Excluding Special Items
43
Net Earnings - Dollars in Millions
Twelve Months Ended December 31,
2005 (Restated)
2004 Reported (GAAP) Net Earnings $371.2 $260.6Special Items: Non lease financial asset IRS settlement - 19.7 IRS Revenue Ruling 2005-53 - Mixed Service Costs 10.9 - Conectiv Bethlehem term loan buy down - 7.7 Starpower investment impairment - 7.3 Severance cost accruals - 6.7 Impairment of jointly owned generation project 2.6 - New Jersey base rate case settlement (5.1) - Gain on sale of Vineland co-generation facility - (6.6) Gain on sale of Vineland distribution assets - (8.6) Liquidation of financial investment previously written off (8.9) - Local tax benefit - retroactive change in regulations - (13.2) Gain on sale of Buzzard Point non-utility land (40.7) - Gain on settlement of Mirant Transitional Power Agreement claim and asbestos claim (42.2) - Net Earnings, Excluding Special Items $287.8 $273.6

Reconciliation of Operating Income
44
Reported Operating Income Reconciled to Operating Income Excluding Special Items
Pepco OtherPower Conectiv Energy Non- Corporate PHI
Delivery Energy Services Regulated & Other ConsolidatedReported Segment Operating Income $670.8 $103.9 $42.4 $86.9 $1.4 $905.4 Percent of operating income 74.1% 11.5% 4.7% 9.5% 0.2% 100.0%
Special Items: Gain on sale of non utility land, Buzzard Point (68.1) (68.1) Gain on sale of Pepco Mirant TPA and asbestos claim (70.5) (70.5) Final liquidation of Financial Investment (13.3) (13.3) Atlantic City Electric - New Jersey - Base Rate Case settlement 6.6 6.6
Operating Income excluding Special Items $538.8 $103.9 $42.4 $73.6 $1.4 $760.1 Percent of operating income excluding special items 70.9% 13.7% 5.6% 9.6% 0.2% 100.0%
Note: Management believes the special items are not representative of the Company's core business operations.