Download - Pakistan Day Conference_2011_Strategy

Table of contents
Strategy| Pakistan
First Capital Equities Ltd
Economy
A glimpse into the past
Macro economic indicators
Concerns & Expectations
Key macro challenges in near term
Politics
Noisy but normal
Market
Dec-2011 index target of 13,500
Key drivers in 2011
Adopt a bottom-up approach
*All prices as of Feb 25, 2011
PLEASE SEE ANALYST CERTIFICATIONS AND IMPORTANT DISCLOSURES AT THE END OF THIS MATERIAL
A glimpse into past
Strategy| Pakistan
First Capital Equities Ltd
ECONOMY
2
· Pakistan underwent a series of economic shocks since 2008 that hurt the economic growth (GDP grew
by 1.2% in FY09); shocks that aroused from perpetual deterioration in external accounts, mounting internal
imbalances, sky-high inflation and portfolio de-leveraging by offshore investors primarily as a reciprocal
impact of the global meltdown.
· Meanwhile, the financial assistance from IMF has triggered much needed economic reforms starting
2009 while the ensuing dollar inflows have provided a cushion for the vulnerable foreign exchange reserves
in terms of currency.
· Country�s real output grew 4.1% in FY10 supported by industrial and service sectors.
· As required by IMF, major structural reforms have been initiated, like framework for introducing reformed
GST, improving tax administration, elimination of subsidies and allowing SBP to follow an independent
monetary policy.
· Headline inflation softened from the peak of 20.8% in FY09 to 11.7% in FY10.
· External side of the economy has shown pronounced signs of recovery. Current account deficit (CAD)
during FY10 has shrunk to US$3.9bn (2.3% of the GDP) from US$9.3bn (5.6% of the GDP) in FY09.
· Private sector credit demand also picked-up, which indicates the regaining economic confidence. That
said, the credit to the private sector during FY10 has increased by 3.9% after a muted growth of 0.7%
in the preceding year.
· Tough but crucial step to remove energy subsidies would augur well for the economy in the long term.
Nevertheless, it has a short term implication on the inflationary trend.

Macro Economic Indicators
Strategy| Pakistan
First Capital Equities Ltd
ECONOMY
3
Macro Snapshot 2007 2008 2009 2010 2011E
GDP Growth rates 6.8% 4.1% 1.2% 4.1% 2.2%
MacroAgriculture (%) 4.1% 1.1% 4.0% 2.0% -1.5%
Manufacturing (%) 8.8% 1.7% -2.0% 4.9% 2.5%
Services (%) 7.0% 6.6% 1.6% 4.6% 3.5%
Tax Collection (PRs bn) 890 1,051 1,205 1,473 1,630
FiscalTax revenue as % of GDP 10.3% 10.3% 9.5% 10.0% 9.5%
Fiscal deficit as % of GDP 4.4% 7.6% 5.3% 6.3% 5.9%
Trade balance (US$ bn) (13.6) (20.9) (17.1) (15.4) (15.3)
External
Export growth (%) 3.2% 12.2% -7.2% 9.1% 11.5%
Import growth (%) 6.9% 30.9% -12.9% -0.3% 6.0%
Remittances growth (%) 19.4% 17.4% 21.1% 14.0% 17.5%
Current account (US$ bn) (6.9) (14.0) (9.3) (3.9) (5.5)
Current account as % of GDP -4.8% -8.6% -5.6% -2.3% -2.8%
CPI (%) 7.8% 12.0% 20.8% 11.7% 14.5%
MonetaryM2 growth (%) 19.30% 15.30% 9.60% 12.50% 13.50%
10-Year PIB 10.2% 11.2% 14.1% 12.5% 14.0%
Pakistan External Debt (US$ mn) 40,322 46,161 52,331 55,626 58,412
Domestic Debt (PRs bn) 2,610 3,275 3,861 4,653 5,500
Pakistan External Debt as % of GDP 28% 28% 32% 32% 29%
Pakistan Domestic Debt as % of GDP 30% 32% 30% 32% 32%
Pakistan total Debt as % of GDP 58% 60% 62% 64% 62%
Source: SBP, Ec. Survey & FCEL Research
Debt

Concerns & Expectations
Strategy| Pakistan
First Capital Equities Ltd
ECONOMY
4
· Floods in Pakistan, affected more than 2.0mn of people and almost 20% of the Pakistan, have left a
desolate impact on the overall economy. Damage to infrastructures, crops and livestock is extensive. Full
impact of floods is yet to come.
· GDP growth projection is scaled down from 4.4% in pre-floods scenario to 2.0-2.5% in post-floods.
Agriculture sector (22% of GDP) is anticipated to decline 1.5% in FY11 due to damage to crops (cotton,
sugarcane & rice) and livestock.
· Importantly, despite the floods, the external position and the exchange rate have remained stable so
far. The envisaged loss of reserves due to flood-related imports has not materialized. Interestingly, in
1HFY11, the country recorded a current account surplus - albeit only 0.03% of GDP - and the FX reserves
increased by US$970 million to US$17.4bn.
· Inflation is likely to shoot-up to 14.-14.5%, mainly fueled by agriflation. This is far high from pre-flood
target of 9.5%. Despite rising headline consumer inflation, core inflation (non food and non energy) has
been on declining trend and has reached to 9.4% in Jan-2011 from its peak level of 18.9% in February
2009.
· Cost of rehabilitation & construction (R&C) would be significant. External flows are not enough to cover
all cost related to R&C. As a result, fiscal side may come under stress. As per initial estimates, the budget
deficit for FY11 would touch ~6.0% of GDP, higher than 4.0% budget by the government.
· Though the balance of payments is expected to weaken in FY11 - mainly due to the floods� impact, we
expect that the higher trade deficit will be compensated partly by rising remittances from overseas
Pakistanis and other unilateral inflows like Coalition Support Fund and Kerry Lugar tranche.
· Structural reforms are in the pipeline targeting to improve the budgetary position. In this regard, the
reformed general sales tax (RGST), including an effective input-crediting mechanism, reduced exemptions,
and elimination of zero-rating and special rates is deemed to be a crucial measure.

Concerns & Expectations
Strategy| Pakistan
First Capital Equities Ltd
ECONOMY
5
· Meanwhile, power sector reform, with an objective to eliminate untargeted subsidies would be
helpful in the long run.
· Realization of donor financing would support the government�s efforts to finance flood relief and
reconstruction as well as raise development and social spending. Already, the country has received
US$450mn from IMF under emergency assistance.
· Monetary environment is anticipated to be tight. Interest rates are expected to trend upward in near
term. We have already witnessed a 150bps hike in the discount rate to 14% since the start of the ongoing
fiscal. Moreover, rising government recourse of SBP borrowing would induce continuation of tight stance
by SBP.
· Despite short-term economic woes caused by floods, both Moody�s and S&P�s kept Pakistan outlook
�Stable�.
· Pakistan�s 5years CDS currently stand at 1,126bps from peak level of 5,051bps observed in 2008.
· Yield on Pakistan�s Eurodollar bond (maturity in 2016) is hovering at 10.6%, 16pps lower than its record
level of 26% in Dec-2008.

Key Macro Challenges in near term
Strategy| Pakistan
First Capital Equities Ltd
ECONOMY
6
Below we provide key macro challenges faced by Pakistan.
Inflation
· Inflation in Pakistan has always remained a prime concern. Preceding FY08-09, country�s real output
grew at an average rate of 6.8% (5yrs average) while inflation remained comparatively benign at 6.5%.
· Global meltdown and escalating oil and commodity prices sparked high risk of inflation. Annual inflation
peaked in FY09 at 20.8%, in line with other regional economies and then receded to single digit.
· After a breath, inflation once again is on an uptrend and has reached to 14.2% in Jan 2011, mainly driven
by 20% YoY increase in food prices and 9% increase in fuel and lightening index.
Headline inflation rising but core inflation is stable
· Despite rising headline consumer inflation, core inflation (non food and non energy) has been on declining
trend and has reached to 9.4% in Jan-11 from its peak level of 18.9% in Feb-09.
· Major difference between two is the composition of CPI basket. In Pakistan, food and beverages comprise
more than 40% of the CPI basket, thereby, adding much volatility in the inflationary trend. Rising food
prices drive the inflation in the country.
· Food prices are surging due to damages caused by floods (as like in China), and it is more aggravated
by global bull-run in commodity prices. Moreover, the electricity reforms (which carries positive economic
implications in the long run) to eliminate untargeted subsidies has also caused a recent upsurge in headline
inflation.
Inflation to recede in 2HFY11
· Headline inflation to settle at 12.0% by the end of FY11 as compared to current level of ~15%. Average
inflation for 4QFY11 is estimated at 12.5% versus 15.5% expected in 2QFY11. Improvement in food supply
and administrator measures may bring down high food prices.

Key Macro Challenges in near term
Strategy| Pakistan
First Capital Equities Ltd
ECONOMY
7
External account showing recovery
· In 2008, Pakistan CAD surged to 8.6% of GDP. Sharp rise in CAD was due to oil and food import bill
(39% of total import) which grew 55% YoY in FY08. The country�s Fx reserves declined to US$7.0bn, an
import cover of 2.0 months only.
· Growing remittances and rising exports helped the country to reduce external imbalances in FY10 and
CAD shrank to 2.3% of the GDP in FY10. Recently, the country�s total Fx reserves hit the record level of
US$17.4bn.
· In first six months of current fiscal, CA balance of the country stood at positive US$26mn (0.03% of GDP)
versus a deficit of US$2.6bn (3% of GDP) in the same period of last year. However, due to bullish trend
in global commodity prices, we anticipate CAD to reach at US$5.5bn, 2.8% of the GDP in FY11. Though,
it represents YoY increase, CAD as % of GDP is competitive in the region.
Exchange rate - Stable outlook
· In the last three years Pakistan�s currency weakened sharply against the US$. PRs/US$ depreciated by
30% in 2008, after a stable trend in the preceding couple of years.
· Despite a relatively high domestic inflation and high interest rate, local currency remained stable due
to deliberate policy to support the exchange rate. Later on, hit by the global commodity crisis that
aggravates external balances, the country fully adopted a flexible exchange rate and allowed its currency
to depreciate.
· This resulted in a sharp decline in currency value, mainly as a correcting difference of past years.
· Fx reserves have increased from low of US$7.0bn in 2008 to ~US$17.4bn currently. In addition to this,
unilateral inflows and loans from donors and FI would boost the foreign exchange reserves of the country
going forward and will keep the domestic currency relatively stable.

Economy: Real sector
Strategy| Pakistan
First Capital Equities Ltd 8
0.0%
3.0%
6.0%
9.0%
12.0%
15.0%
2004
2005
2006
2007
2008
2009
2010
Domestic ExpenditureReal GDP
10
15
20
25
200
0
200
1
200
2
200
3
200
4
200
5
200
6
200
7
200
8
200
9
201
0
Investment % of GDP
National Savings % of GDP(%)
Private Consp. 73%
Invest. 15%
Govt Expd. 10%Others 3%
-3.0%
0.0%
3.0%
6.0%
9.0%
12.0%
15.0%
2005
2006
2007
2008
2009
2010
2011E
GDP ManftgServices Agriculture
Source: SBP, FBS & FCEL Research
GDP Sub-Sec Performance
Source: SBP, FBS & FCEL Research
Saving & investment gap (% of GDP)
Agri: 22%
Services: 53%
Manftg: 25%
Source: SBP, FBS & FCEL Research
GDP Composition (FY10)
Source: SBP, FBS & FCEL Research
Growth Pattern
-10%10%
30%50%70%
90%110%
2005
2006
2007
2008
2009
2010
Pvt consumption Investments
Govt exp Net exports
Source: SBP, FBS & FCEL Research
Demand Side Nominal GDP
Source: SBP, FBS & FCEL Research
Demand Side GDP at FC (FY10)

-3.0%
0.0%
3.0%
6.0%
9.0%
12.0%
15.0%
18.0%
2002
2003
2004
2005
2006
2007
2008
2009
2010
2011E
Manufacuring GDP
Social Serv.
Fin. & Ins.
Real Est.
Public Admn.
Transport & Com.
WS & Retail
-30%
-20%
-10%
0%
10%
20%
Jul-
08
Oct
-08
Jan-0
9
Apr-
09
Jul-
09
Oct
-09
Jan-1
0
Apr-
10
Jul-
10
Oct
-10
-2.5%
0.0%
2.5%
5.0%
7.5%
10.0%
2002
2003
2004
2005
2006
2007
2008
2009
2010
2011E
Agriculture GDP
0.0%
2.0%
4.0%
6.0%
8.0%
10.0%
2002
2003
2004
2005
2006
2007
2008
2009
2010
2011E
Services GDP
50.0%
51.0%
52.0%
53.0%
54.0%
2001
2002
2003
2004
2005
2006
2007
2008
2009
2010
Source: SBP, FBS & FCEL Research
Services share in GDP
Source: SBP, FBS & FCEL Research
GDP vs IP (YoY) -Real
Source: SBP, FBS & FCEL Research
Service sector Composition (FY10)
Source: SBP, FBS & FCEL Research
Large Scale Manufacturing (YoY)
Source: SBP, FBS & FCEL Research
GDP vs Services (YoY) -Real
Source: SBP, FBS & FCEL Research
GDP vs Agri (Y0Y) -Real
Economy: Real sector (Contd�)
Strategy| Pakistan
First Capital Equities Ltd 9

HRI, 23%Fuel, 7%
Misc, 7%
Food, 40%
Transport, 7%
0.0%
5.0%
10.0%
15.0%
20.0%
25.0%
2003
2004
2005
2006
2007
2008
2009
2010
2011E
2012
E
0%
5%
10%
15%
20%
25%
30%
Jan-0
8
May
-08
Sep-0
8
Jan-0
9
May
-09
Sep-0
9
Jan-1
0
May
-10
Sep-1
0
Jan-1
1
Core Headline
-2.0%
-1.0%
0.0%1.0%
2.0%
3.0%
4.0%
Jan-0
7
May
-07
Sep-0
7
Jan-0
8
May
-08
Sep-0
8
Jan-0
9
May
-09
Sep-0
9
Jan-1
0
May
-10
Sep-1
0
Jan-1
1
CPI (MoM change %)Average
0%
5%
10%
15%
20%
25%
Jan-0
7
May-
07
Sep-0
7
Jan-0
8
May-
08
Sep-0
8
Jan-0
9
May-
09
Sep-0
9
Jan-1
0
May-
10
Sep-1
0
Jan-1
1
CPI (YoY change %) Average
-5.0%
0.0%
5.0%
10.0%
15.0%
20.0%
2004
2005
2006
2007
2008
2009
2010
2011E
0.0%
5.0%
10.0%
15.0%
20.0%
25.0%IPGDPCPI (RHS)
Source: SBP, FBS & FCEL Research
Price vs Growth (YoY)
Source: SBP, FBS & FCEL Research
Annual Headline CPI (%)
Source: SBP, FBS & FCEL Research
CPI (YoY)
Source: SBP, FBS & FCEL Research
Break-up of CPI
Source: SBP, FBS & FCEL Research
CPI (MoM)
Source: SBP, FBS & FCEL Research
Headline vs Core CPI(YoY)
Economy: Prices
Strategy| Pakistan
First Capital Equities Ltd 10

0
200
400
600
800
1000
2005
2006
2007
2008
2009
2010
1Q2011
PrivatizationNon-BankBankExternal
-
500
1,000
1,500
2,000
2,500
200
3
200
4
200
5
200
6
200
7
200
8
200
9
201
0
201
1
Gross RevenueTaxNon-Tax
1.0%
2.0%
3.0%
4.0%
5.0%
6.0%
7.0%
8.0%
200
3
200
4
200
5
200
6
200
7
200
8
200
9
201
0
201
1E
201
2E
8.0%
8.5%
9.0%
9.5%
10.0%
10.5%
2002
2003
2004
2005
2006
2007
2008
2009
2010
2011E
0%
5%
10%
15%
20%
25%
30%
200
2
200
3
200
4
200
5
200
6
200
7
200
8
200
9
201
0
201
1E
Nominal GDP
Gross Tax Collection
-
250
500
750
1,000
1,250
1,500
1,750
2001
2002
2003
2004
2005
2006
2007
2008
2009
2010
2011E
Direct Taxes Indirect taxes
Source: SBP, FBS & FCEL Research
FBR Tax Collection (PRs bn)
Source: SBP, FBS & FCEL Research
Fiscal deficit as % of GDP
Source: SBP, FBS & FCEL Research
Growth pattern (YoY)
Source: SBP, FBS & FCEL Research
Deficit Financing (PRs bn)
Source: SBP, FBS & FCEL Research
Gross Tax to GDP (FBR)
Source: SBP, FBS & FCEL Research
Fiscal Consolidation (PRs bn)
Economy: Fiscal Position
Strategy| Pakistan
First Capital Equities Ltd 11

Economy: External Sector
Strategy| Pakistan
First Capital Equities Ltd 12
-
4
8
12
16
20
24
Jan-0
7
May-
07
Sep-0
7
Jan-0
8
May-
08
Sep-0
8
Jan-0
9
May-
09
Sep-0
9
Jan-1
0
May-
10
Sep-1
0
Jan-1
1
40
50
60
70
80
90Reserves (US$ bn)
PRs/US$ (RHS)
-
200
400
600
800
1,000
Jul-
07O
ct-0
7Ja
n-0
8Apr-
08Ju
l-08
Oct
-08
Jan-0
9Apr-
09Ju
l-09
Oct
-09
Jan-1
0Apr-
10Ju
l-10
Oct
-10
Jan-1
1
US$ mnAvg-FY09Avg-FY11
-25.0
-15.0
-5.0
5.0
15.0
25.0
35.0Inc. (net)Services (net)Cur. Trans. (net)Trade Bal.CA. bl.
5.0
10.0
15.0
20.0
25.0
2005
2006
2007
2008
2009
2010
2011E
-20%
-10%
0%
10%
20%
30%
40%
50%Trade deficitExport Growth (RHS)Import Growth (RHS)
-
5
10
15
20
25
200
1
200
3
200
5
200
7
200
9
201
1E
-10%
-5%
0%
5%
10%
15%
20%
25%
30%Export (US$ bn)
Export growth
Source: SBP, FBS & FCEL Research
Export Performance (US$ bn)
Source: SBP, FBS & FCEL Research
Monthly Remittances (US$ mn)
Source: SBP, FBS & FCEL Research
Export Growth Pattern (YoY)
Source: SBP, FBS & FCEL Research
Reserves Vs Currency
Source: SBP, FBS & FCEL Research
Trade Gap (US$ bn)
Source: SBP, FBS & FCEL Research
Current Ac. Bal (US$ bn)
-40%
-20%
0%
20%
40%
60%
Jul-
06
Jan-0
7
Jul-
07
Jan-0
8
Jul-
08
Jan-0
9
Jul-
09
Jan-1
0
Jul-
10
Jan-1
1
GrowthFY06-10 Avg.FY11 Avg.
Rise in Avg. YoY
export growth
Avg-FY08Avg-FY10
2007
2008
2009
2010
2011E

Noisy but normal
Strategy| Pakistan
First Capital Equities Ltd
POLITICS
13
· During 2010, the political scenario of the country remained comparatively calm as against an almost
chaos like situation during 2007-09.
· The end of the year also marked the completion of almost 3-years in power for the prevailing ruling
setup. In Pakistan, historically, a period of 3-year is more than the average period for any democratic
setup.
· Though the political noise level increased quite a few times during the year on many critical issues,
the ruling setup remained relatively more efficient in taking the corrective measures and to keep the
situation under-control.
· For 2011, the most immediate problem for the ruling setup would be to tackle the situation developed
after PML-N�s decision to dissociate PPP from the Punjab cabinet amid dissatisfaction over the implementation
of its 10-point agenda. However, we do not foresee any serious threat to the government benches in the
federal assembly due to this move as the number game for PPP has become more positive in the National
Assembly.
· We also do not foresee any significant negative dent on PAK-USA relationships due to �Raymend Davis
Case� after discounting the American realization of ground-realities over the general public sentiments
and the USA-backed government�s position in any extra beneficial move for it.
· Furthermore, for the time being, the government is not likely to gather the required support for the
implementation of RGST, however, keeping in view the nature of domestic politics, we cannot rule out
such a possibility by the mid-2011. As a positive surprise, a road-map to implement it could also be
announced after the upcoming All party round-table conference.
· Otherwise, in a worse-case scenario, the government still has some constitutional power to implement
RGST (though for a specified period) without the parliament�s approval.

Noisy but normal
Strategy| Pakistan
First Capital Equities Ltd
POLITICS
14
· During the last three years, the sensible and rational approach by top opposition leader Nawaz Sharif
towards the continuation of democracy as well as the parliament�s setup provide us a strong argument
to assume that there will be very limited chances of any government-derailing efforts at least by PML-
N.
· While, the judiciary is still expected to pursue its so-called uncompromised approach, the ruling setup�s
�no-collision with institutions� strategy is providing enough grounds to assume a low-probability of any
major legal/constitutional break-down in the near-future.
· On the law and order front, the provincial government - with the help of Pakistan Army has successfully
established its writ in the Swat and South Waziristan regions.
· Going forward, Pak Army is likely to start a full scale military operation in North-Waziristan as there is
an immense pressure from US and the international community to pursue a military operation in the
region in order to eliminate the remaining terrorist hide-outs and their cross-border movement in
Afghanistan.
· In our opinion, a notable surge in the terrorist attacks in retaliation of this possible full scale military
operation cannot be ruled out. However, as their infrastructure has been considerably damaged due to
the army�s targeted strikes in the region along with weak country network strength, the fall-out is not
likely to be notable as was in 2008 Swat Operation.

Dec-2011 Index target of 13,500
Strategy| PakistanMarch 07, 2011
First Capital Equities Ltd
MARKET
15
KSE yielded 28% gain in 2010
· Despite macro concerns, imposition of a capital gains tax, devastating floods, monetary tightening and
political hiccups, Pakistan equities provided a lucrative gain of 28% in 2010.
· Upturn in the earnings cycle, increased foreign participation, status quo on sovereign ratings and positive
expectations over the reintroduction of leverage product caused equity values to continue their upward
trajectory.
· It may not be wrong to argue that the index remained single-stock driven. That said, the heavyweight
OGDC (current index weightage of 24%) rallied 54% in 2010. Thus, OGDC alone contributed nearly 40%
of the 2010 index gain.
Bull run expected to continue in 2011
· In our opinion, the bull run at Pakistan market will be carried forward in 2011 too with scope for yet
another double-digit gain.
· Despite 28% price gains in 2010, Pakistan�s equity valuations remain attractive as companies� earnings
are likely to see a rebound in 2011.
· The Pakistani market is currently trading at an FY11E PE of ~7.2x � a discount of 24% from its average
of 9.5x over the last 15 years.
· Interestingly, excluding OGDC, which is trading at a higher PE multiple, the market multiples look more
attractive at 6.3x on 2011E estimates.
· At a target of PE 8.0x, we have calculated the end-December 2011 KSE-Index at ~13,500. This also
incorporates the FY11E dividend yield of 7.5% because the KSE-100 is a total return index.

Key drivers in 2011
Strategy| PakistanMarch 07, 2011
First Capital Equities Ltd
MARKET
16
Pakistan�s equity market is likely to be influenced by the following catalysts in upcoming trading sessions:
· Corporate earnings are likely to depict double digit growth in 2011. In 2010, the overall corporate profits
were up by 18%. The earnings trend is likely to show further improvement in 2011 due to better expectations
from the core growth of E&P, banking, fertilizer and power sector companies. All in all, we expect
corporate earnings in Pakistan to depict an average growth of ~22% in 2011. High earnings growth on the
corporate side will ensure valuations to remain at attractive levels even after 28% increase in equity
prices during 2010.
· We expect share prices to react positively on the introduction of the much needed leverage product.
In this regard, the Margin Trading System (MTS) is likely to be launched by mid March 2011.
· Developments on structural reforms, like elimination of nonproductive subsidies, RGST implementation
and settlement of circular debt would be positive for the overall economic situation.
· With investment opportunities in emerging giants like China & India and frontier markets continuing
to lessen, Pakistan�s untapped and under-capitalized equity market would continue to attract the foreign
interest. Despite the challenging macro and political situation, we have not witnessed panic selling by
the foreign investors. In fact, offshore funds have remained net buyers and injected ~US$526mn in 2010
(2011 YTD US$66mn). We expect foreign inflows to continue in 2011 given the steep valuation gap of
Pakistan vis-à-vis regional peers and strong global liquidity.
· With strong valuations pegged with Pakistani equities, the PE discount to regional peers could see a
further re-rating depending on progress on structural reforms (RGST, circular debt), macro recovery/stability,
IMF assistance, inflows from US & FODP and security situation.
· Monetary tightening is likely to continue till mid-2011 with the expectation of further 50-100bps hikes
in policy rate. Thus, interest rate would peak out in mid-2011. Thereafter, we expect stable (if not
relaxing) monetary environment.

2011E 2012E 2011E 2012E 2011E 2012E
Key drivers in 2011
Strategy| Pakistan
First Capital Equities Ltd
MARKET
17
· Positive developments on privatization front and M&As would also help in retaining investors� confidence.
· On the political front, we think the government will keep facing problems and we might see political
hiccups to continue. However, this is inherited in the domestic political system of the country. We do
not anticipate any serious threat for the prevailing democratic setup. Meanwhile, the successful 18th
and 19th constitutional amendments have highlighted the growing political maturity.
· In the absence of other viable investment options, the market will keep attracting the domestic liquidity,
we believe. Meanwhile, the fundamental recovery would also attract the foreign investment flows.
Regional Valuations
Pakistan
Korea
Thailand
Philippine
Hong Kong
Taiwan
China
Indonesia
Malaysia
India
Median
Pakistan Discount to Region
Source: Bloomberg, FCEL Research
7.2
10.0
11.7
12.1
12.4
12.6
13.4
13.7
14.5
16.6
12.64
-43%
1.5
1.3
1.8
1.9
1.7
1.8
2.1
2.8
2.2
2.8
1.9
-20%
7.4
1.5
3.8
3.7
3.4
3.9
2.2
2.4
3.6
1.4
3.4
0.5
0.9
0.8
1.0
0.8
1.1
0.7
0.7
1.3
0.9
0.9
PE(x)
6.3
9.0
10.2
10.8
10.8
11.3
11.3
11.4
13.1
13.9
11.3
-44%
8.6
1.6
4.3
3.8
3.9
4.2
2.5
2.9
3.9
1.6
3.8
1.4
1.2
1.6
1.7
1.5
1.6
1.8
2.5
2.0
2.4
1.7
-19%
PBv(x) Div Yield (%) PEG Ratio
2011ECountries

Adopt a bottom-up approach
Strategy| Pakistan
First Capital Equities Ltd
MARKET
18
· A bottom-up approach seems more effective than a top-down investment strategy for Pakistani market
where selective stock pickings could help the investors to outperform the broader market.
· We say this by considering the fact that despite a modest GDP growth of 5% on average in last 10 years
(FY01-10), Pakistan�s equity market has yielded an impressive return of 26% annually.
· GDP growth does not necessarily transform into a proportionate growth in corporate earnings, EPS,
dividends and ultimately returns to investors. While short-term changes in GDP growth can have an impact
on equity values, there may not necessarily a long-term connection.
· In Pakistan, stock market represents smaller part of the overall domestic GDP. Market Cap as % of GDP
is only ~18-20%. Total sales of listed companies represent only 22% of the total GDP. That means performance
of non listed companies, which occupy major chunk of economy is not reflected in the stock market
return.
· Another argument is that GDP represents a total value of goods and services produced in the country
for a given year. It does not indicate the profitability of the companies. If sales are growing but profitability
is declining, stocks are not likely to rally.
· This does not mean that GDP is a totally useless indictor to look for before making investment.

Pakistan equities: Cheapest in the region
Strategy| Pakistan
First Capital Equities Ltd 19
Source: Bloomberg, FCEL Research
PE2011E
Source: Bloomberg, FCEL Research
PE 2011E vs EPS growth 2012E
3 4 5 6 7 8 9 10 11 12 13 14 15 16 17 18
Pakistan
Korea
Thailand
Philippine
Hong Kong
Taiwan
China
Indonesia
Malaysia
India
MARKET
Source: Bloomberg, FCEL Research
Dividend Yield 2011E
0
1
2
3
4
5
6
7
8
9
India
Kore
a
Chin
a
Indonesi
a
Hong
Kong
Mala
ysia
Philip
pin
e
Thailand
Taiw
an
Paki
stan
Source: Bloomberg, FCEL Research
PBv 2011E
0.0
0.5
1.0
1.5
2.0
2.5
3.0
3.5
Kore
a
Paki
stan
Hong
Kong
Thailand
Taiw
an
Philip
pin
e
Chin
a
Mala
ysia
India
Indonesi
a
0%
5%
10%
15%
20%
25%
Pakistan
Korea
Thailand
Philippine
Hong Kong
Taiwan
China
Indonesia
Malaysia
India
5 7 9 11 13 15 17 19

Market PE & Index target
Strategy| Pakistan
First Capital Equities Ltd 20
MARKETSource: Bloomberg
Market PE (12-months trailing EPS)
0
5
10
15
20
25
Feb-0
6
Jun-0
6
Oct
-06
Feb-0
7
Jun-0
7
Oct
-07
Feb-0
8
Jun-0
8
Oct
-08
Feb-0
9
Jun-0
9
Oct
-09
Feb-1
0
Jun-1
0
Oct
-10
Feb-1
1
Source: KSE & FCEL Research
Dec-2011 Index Target
KSE-100: Still more upside
5,000
7,000
9,000
11,000
13,000
15,000
17,000
11,223.5
13,500
(+ 20%)
Aug-
08
Nov-
08
Mar-
09
Jun-0
9
Oct
-09
Jan-1
0
May-
10
Aug-
10
Dec-
10
Mar-
11
May-
11
Aug-
11
Oct
-11
Dec-
11

Foreign participation
Strategy| Pakistan
First Capital Equities Ltd 21
MARKET
Source: NCCPL, KSE & FCEL Research
FPI vs KSE
Source: SBP, KSE & FCEL Research
Foreign Ownership
0
50
100
150
200
250
300
350
Jan-0
7
Apr-
07
Aug-0
7
Dec-
07
Mar-
08
Jul-
08
Nov-
08
Mar-
09
Jul-
09
Oct
-09
Feb-1
0
Jun-1
0
Sep-1
0
Jan-1
1
0%
1%
2%
3%
4%
5%
6%
7%
8%
9%Foreign Inv (PRs bn) % of M.Cap
(200)
(150)
(100)
(50)
0
50
100
150
200
Apr-
08
Jun-0
8
Aug-
08
Oct
-08
Dec-
08
Feb-0
9
Apr-
09
Jun-0
9
Aug-
09
Oct
-09
Dec-
09
Feb-1
0
Apr-
10
Jun-1
0
Aug-
10
Oct
-10
Dec-
10
FPI (US$ mn) KSE-100 (RHS)
0
2,000
4,000
6,000
8,000
10,000
12,000
14,000
16,000

Sector Concentration & EPS buildup
Strategy| Pakistan
First Capital Equities Ltd 22
Source: KSE
Sector Concentration
Source: FCEL Research
Composition of FCEL universe earnings
MARKET
Fertilizer,
11%
Banks, 32%
Oil & Gas, 44%
Others, 5%
Power, 4%
Telecom, 3%
Cements, 2%
Oil & Gas, 36%
Banks, 21%Chemicals, 11%
Foods, 9%
Personal
Goods, 4%
0thers, 12%
Power, 3%
Telecom, 2%
Cons & Mat, 2%
234
244
254
264
274
284
2010
E&
P
Banks
Fert
iliz
er
OM
C
Pow
er
Tele
com
Cem
ents
Oth
ers
2011E
PRs281bn
PRs230bn
Source: Company Data & FCEL Research
2011 EPS buildup (FCEL Universe)
Source: Company Data & FCEL Research
Qrtrly Profitability
-120%
-70%
-20%
30%
80%
130%
3Q
2007
4Q
2007
1Q
2008
2Q
2008
3Q
2008
4Q
2008
1Q
2009
2Q
2009
3Q
2009
4Q
2009
1Q
2010
2Q
2010
3Q
2010
4Q
2010
FCEL Universe Ex- Oil
Ex-Banks Ex-Cement
Ex-Fertilizer

Earnings uptrend to continue in 2011
Strategy| Pakistan
First Capital Equities Ltd 23
Source: Company Data & FCEL Research
FCEL Universe Earnings growth
Source: Company Data & FCEL Research
Yearly profitability trend
MARKET
-5%
0%
5%
10%
15%
20%
25%
2007
2008
2009
2010
2011E
0
250
500
750
1,000
1,250
1,500
1,750
2,000
2,250
2006
2007
2008
2009
2010
2011E
0%
5%
10%
15%
20%
25%
30%Revenues EBITDAEBIT PATEBITDA margins (RHS) Net margins (RHS)
Source: Company Data & FCEL Research
Earnings uptrend to continue
Earnings (PRs mn)Earnings growth (%)ROAE (%)ROAA (%)ROCE (%)PE (x)PBv (x)PS (x)EV/EBITDA (x)Dividend Yield(%)PEG Ratio
2010
230,32417.620.94.0
26.68.11.61.05.46.40.4
2011E
280,61021.822.54.4
30.67.21.50.94.37.40.5
2009
195,8409.1
20.13.9
25.16.81.30.86.58.70.4
2008
179,531(5.0)20.34.0
28.311.22.21.56.45.21.2
FCEL Universe
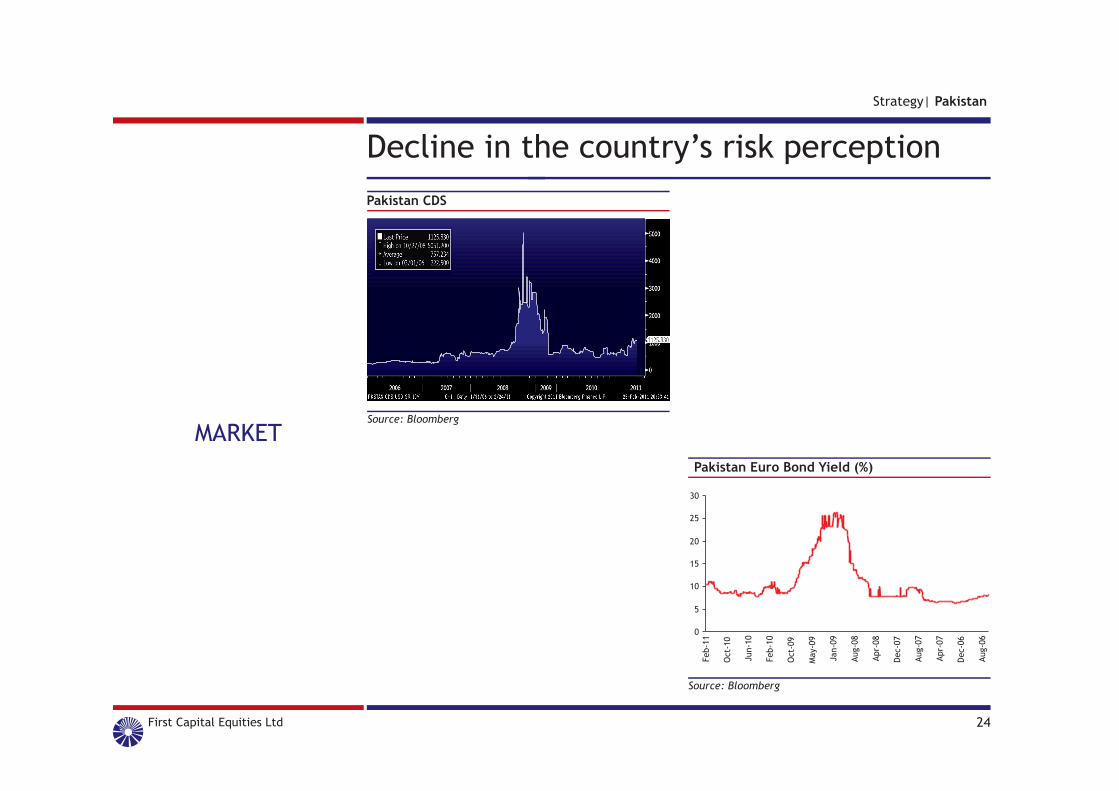
Decline in the country�s risk perception
Strategy| Pakistan
First Capital Equities Ltd 24
MARKET
Source: Bloomberg
Pakistan Euro Bond Yield (%)
Source: Bloomberg
Pakistan CDS
0
5
10
15
20
25
30
Feb-1
1
Oct
-10
Jun-1
0
Feb-1
0
Oct
-09
May-
09
Jan-0
9
Aug-
08
Apr-
08
Dec-
07
Aug-
07
Apr-
07
Dec-
06
Aug-
06
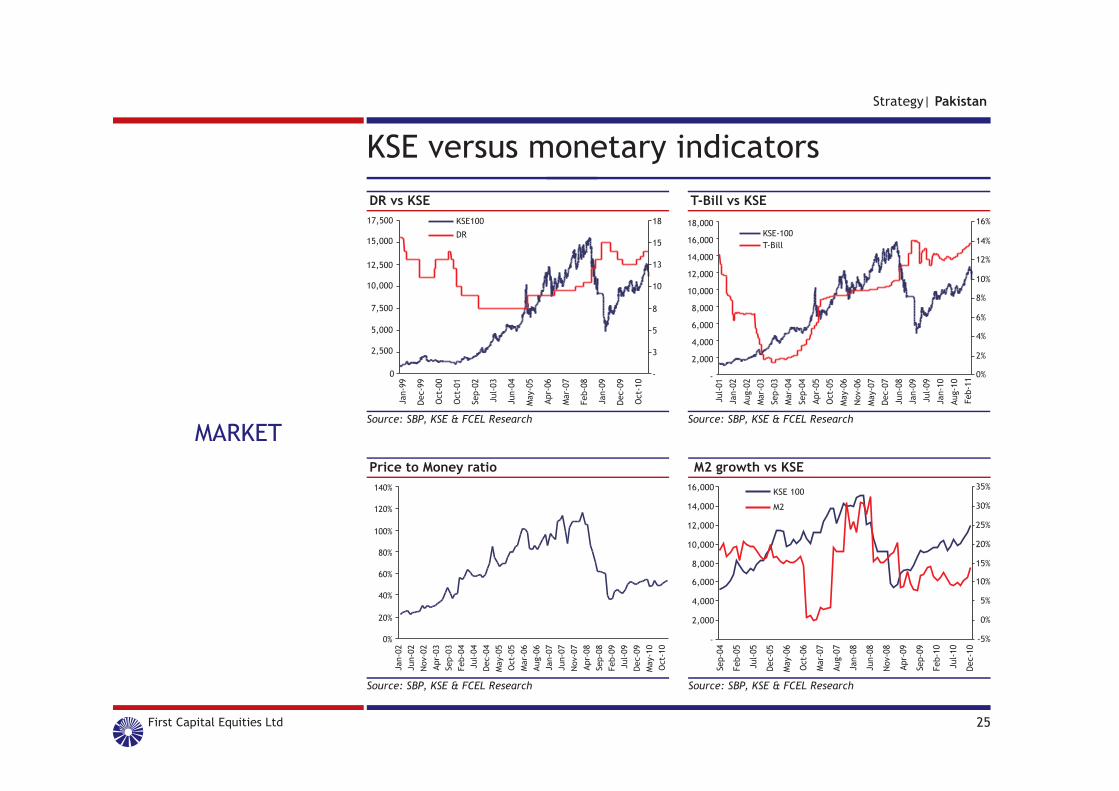
KSE versus monetary indicators
Strategy| Pakistan
First Capital Equities Ltd 25
Source: SBP, KSE & FCEL Research
DR vs KSE
Source: SBP, KSE & FCEL Research
T-Bill vs KSE
MARKET
0
2,500
5,000
7,500
10,000
12,500
15,000
17,500
Jan-9
9
Dec-
99
Oct
-00
Oct
-01
Sep-0
2
Jul-
03
Jun-0
4
May-
05
Apr-
06
Mar-
07
Feb-0
8
Jan-0
9
Dec-
09
Oct
-10
KSE100
DR
-
3
5
8
10
13
15
18
-
2,000
4,000
6,000
8,000
10,000
12,000
14,000
16,000
18,000
Jul-
01
Jan-0
2
Aug-
02
Mar-
03
Sep-0
3
Mar-
04
Sep-0
4
Apr-
05
Oct
-05
May-
06
Nov-
06
May-
07
Dec-
07
Jun-0
8
Jan-0
9
Jul-
09
Jan-1
0
Aug-
10
Feb-1
1
KSE-100
T-Bill
0%
2%
4%
6%
8%
10%
12%
14%
16%
Source: SBP, KSE & FCEL Research
Price to Money ratio
0%
20%
40%
60%
80%
100%
120%
140%
Jan-0
2
Jun-0
2
Nov-
02
Apr-
03
Sep-0
3
Feb-0
4
Jul-
04
Dec-
04
May-
05
Oct
-05
Mar-
06
Aug-0
6
Jan-0
7
Jun-0
7
Nov-
07
Apr-
08
Sep-0
8
Feb-0
9
Jul-
09
Dec-
09
May-
10
Oct
-10
Source: SBP, KSE & FCEL Research
M2 growth vs KSE
-
2,000
4,000
6,000
8,000
10,000
12,000
14,000
16,000
Sep-0
4
Feb-0
5
Jul-
05
Dec-
05
May-
06
Oct
-06
Mar-
07
Aug-
07
Jan-0
8
Jun-0
8
Nov-
08
Apr-
09
Sep-0
9
Feb-1
0
Jul-
10
Dec-
10
-5%
0%
5%
10%
15%
20%
25%
30%
35%KSE 100
M2

Strategy| Pakistan
First Capital Equities Ltd
Analyst Certification
All of the views expressed in this document accurately reflect the personal views of the responsible analyst(s) about any and all of the subject securitiesor issuers. No part of the compensation of the responsible analyst(s) named herein is, or will be, directly or indirectly, related to the specificrecommendations or views expressed by the responsible analyst(s) in this report.
Disclaimer
This information and opinion contained in this report have been complied by our research department from sources believed by it to be reliable and ingood faith, but no representation or warranty, express or implied, is made as to their accuracy, completeness or correctness. All opinions and estimatescontained in the document constitute the department�s judgment as of the date of this document and are subject to change without notice and areprovided in good faith but without legal responsibility.
This report is not, and should not be construed as, an offer to sell or a solicitation of an offer to buy any securities. First Capital Equities Limited (thecompany) or persons connected with it may from time to time have an investment banking or other relationship, including but not limited to, theparticipation or investment in commercial banking transactions (including loans) with some or all of the issuers mentioned therein, either for their ownaccount or the account of their customers. Persons connected with the company may provide or have provided corporate finance and other services tothe issuer of the securities mentioned herein, including the issuance of options on securities mentioned herein or any related investment and may makea purchase and/or sale, or offer to make a purchase and/or sale of the securities or any related investment from time to time in the open market orotherwise, in each case either as principal or agent.
This report may contain forward looking statements which are often but not always identified by the use of words such as �anticipate�, �believe�,�estimate�, �intend�, �plan�, �expect�, �forecast�, �predict� and �project� and statements that an event or result �may�, �will�, �can�, �should�,�could� or �might� occur or be achieved and other similar expressions. Such forward looking statements are based on assumptions made and informationcurrently available to us and are subject to certain risks and uncertainties that could cause the actual results to differ materially from those expressedin any forward looking statements. Readers are cautioned not to place undue relevance on these forwardlooking statements. FCEL expressly disclaimsany obligation to update or revise any such forward looking statements to reflect new information, events or circumstances after the date of thispublication or to reflect the occurrence of unanticipated events.
Exchange rate fluctuations may affect the return to investors. Neither the company or any of its affiliates, nor any other person, accepts any liabilitywhatsoever for any direct or consequential loss arising from any use of this report or the information contained therein.
First Capital Equities, their respective affiliate companies, associates, directors and/or employees may have investments in securities or derivatives ofsecurities of companies mentioned in this report, and may make investment decisions that are inconsistent with the views expressed in this report.Neither the company or any of its affiliates, nor any other person, accepts any liability whatsoever for any direct or consequential loss arising from anyuse of this report or the information contained therein.


