U.S. Department of the InteriorU.S. Geological Survey
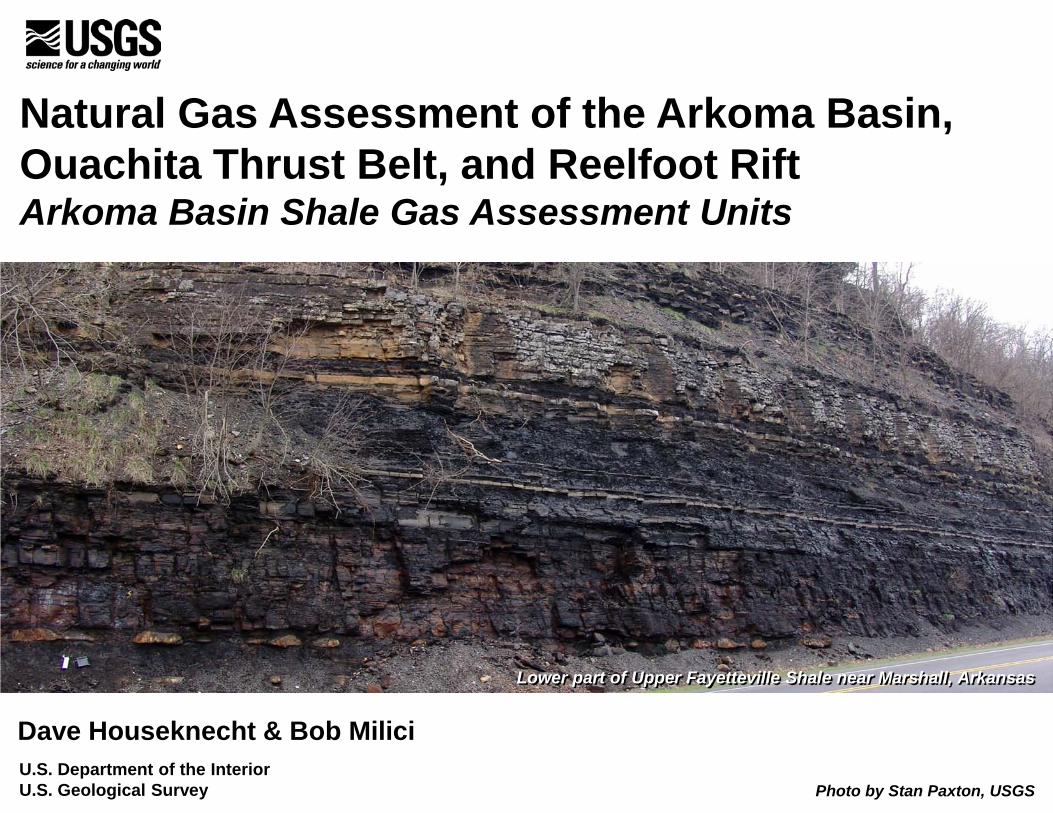
Natural Gas Assessment of the Arkoma Basin, Ouachita Thrust Belt, and Reelfoot RiftArkoma Basin Shale Gas Assessment Units
Dave Houseknecht & Bob Milici
Lower part of Upper Fayetteville Shale near Marshall, Arkansas
Photo by Stan Paxton, USGS

Defining Shale-Gas Assessment Units – Delineate Area to be Considered
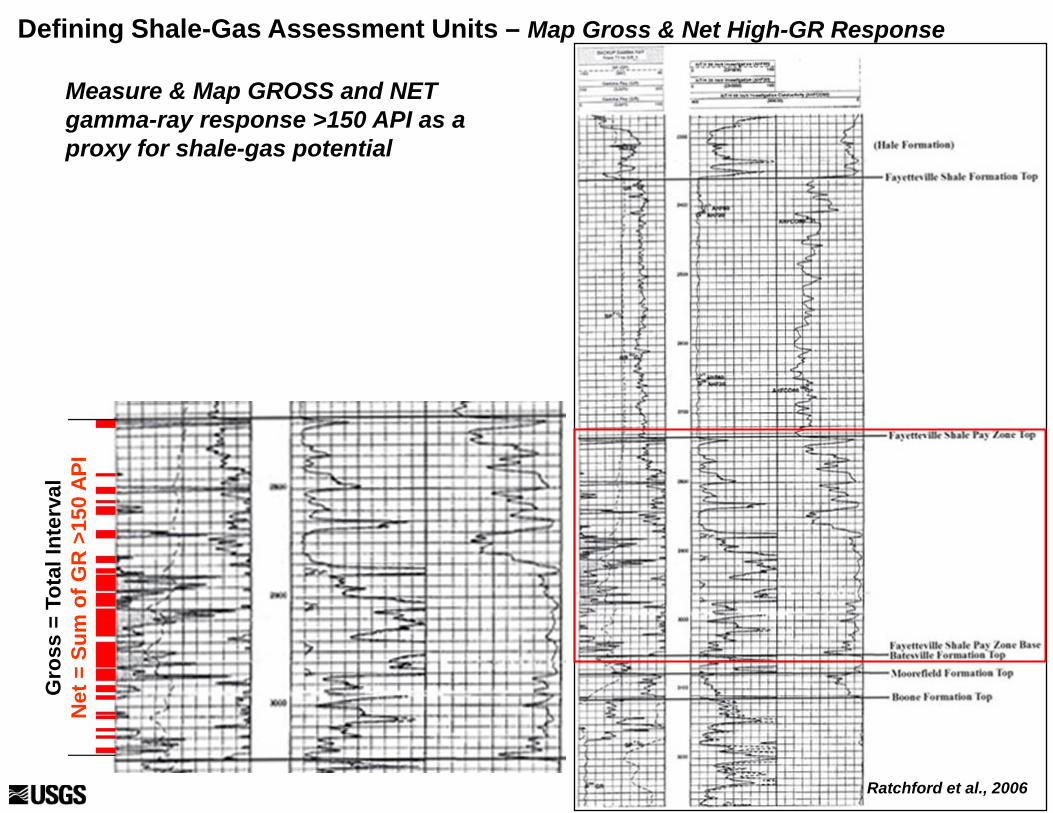
Defining Shale-Gas Assessment Units – Map Gross & Net High-GR Response
Ratchford et al., 2006
Gro
ss =
Tot
al In
terv
alN
et =
Sum
of G
R >
150
API
Measure & Map GROSS and NET gamma-ray response >150 API as a proxy for shale-gas potential

Defining Shale-Gas Assessment Units – Isopach Gross & Net High Gamma-Ray
These “dummy” isopach patterns are for illustration only – actual isopach maps will
be displayed on posters.

Defining Shale-Gas Assessment Units – Overlay Thermal Maturity Information

Woodford and Chattanooga Shale Gas Assessment Units

Fayetteville and Caney Shale Gas Assessment Units

Subdivision of Shale Gas Assessment Units
Each shale-gas AU is subdivided based on:• Gross GR map• Net GR Map• Thermal Maturity• Well spacing & completion design (vertical, horizontal,
lateral length, lateral orientation, etc.)• Production History of Wells (IP, Decline, etc.)
This analysis results in an estimation of EUR* Distribution for each subdivision of each AU.
*EUR = Estimated Ultimate Recovery; 3 points of distribution are estimated:• Minimum• Median• Maximum


