Download - Metodyka A. Niemczyk and R. Seweryn - Influence of meetings industry on the economy of Krakow

+
Influence
of the meetings
industry
on the economy
of Kraków
Based on the project
Steering the meetings industry in Kraków: assessment and monitoring of the
economic effect of the meetings industry on the economy of Kraków with the
use of good practices from Switzerland
Agata Niemczyk
Renata Seweryn
Krzysztof Borodako – chief
Jadwiga Berbeka
+ Agenda
1. Kraków as the city of
meetings industry
2. Methodology of the
influence of meetings
industry on Kraków’s
economy
3. Conclusion – resulats
of our research
+
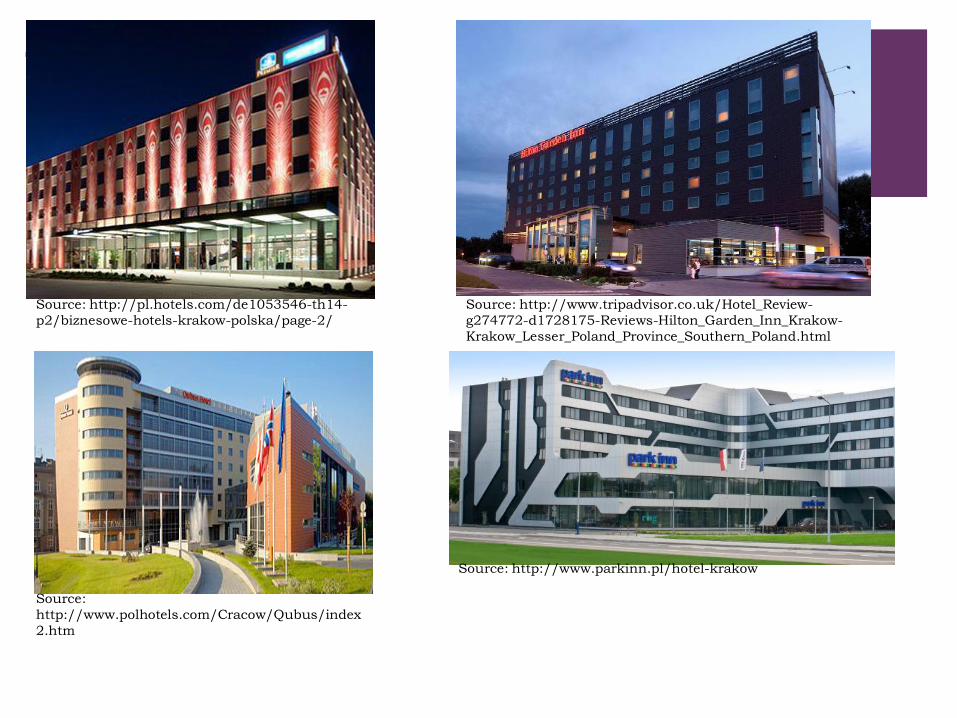
Source: http://pl.hotels.com/de1053546-th14-
p2/biznesowe-hotels-krakow-polska/page-2/
Source: http://www.tripadvisor.co.uk/Hotel_Review-
g274772-d1728175-Reviews-Hilton_Garden_Inn_Krakow-
Krakow_Lesser_Poland_Province_Southern_Poland.html
Source:
http://www.polhotels.com/Cracow/Qubus/index
2.htm
Source: http://www.parkinn.pl/hotel-krakow
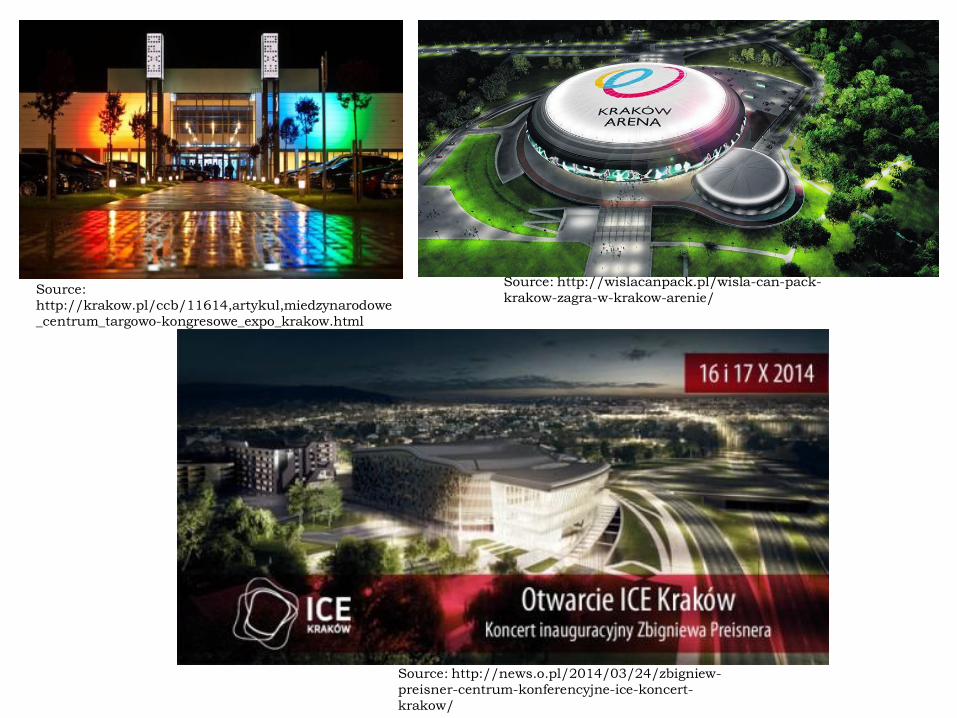
Source: http://news.o.pl/2014/03/24/zbigniew-
preisner-centrum-konferencyjne-ice-koncert-
krakow/
Source:
http://krakow.pl/ccb/11614,artykul,miedzynarodowe
_centrum_targowo-kongresowe_expo_krakow.html
Source: http://wislacanpack.pl/wisla-can-pack-
krakow-zagra-w-krakow-arenie/
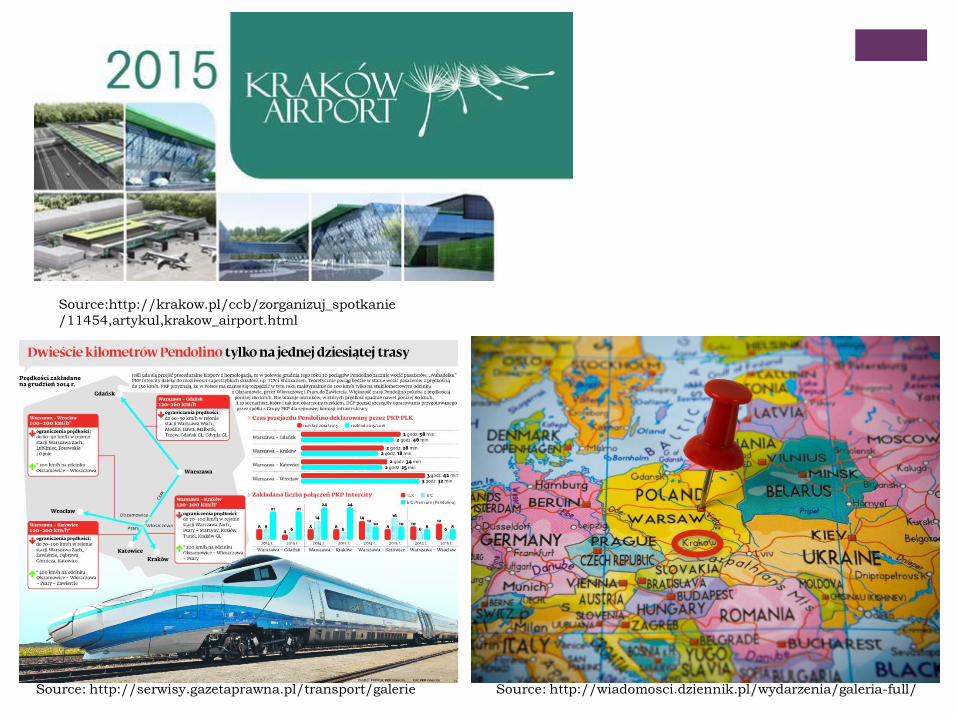
Source:http://krakow.pl/ccb/zorganizuj_spotkanie
/11454,artykul,krakow_airport.html
Source: http://wiadomosci.dziennik.pl/wydarzenia/galeria-full/ Source: http://serwisy.gazetaprawna.pl/transport/galerie
+
Kraków rich with meetings
and their participants –
tourists!!!

+
In 2012 – 1855 group meetings
In 2013 – 3413 group meetings
In 2012 – 286 898 participants
In 2013 – 427 980 participants
Meetings industry in Kraków
in 2012-2013
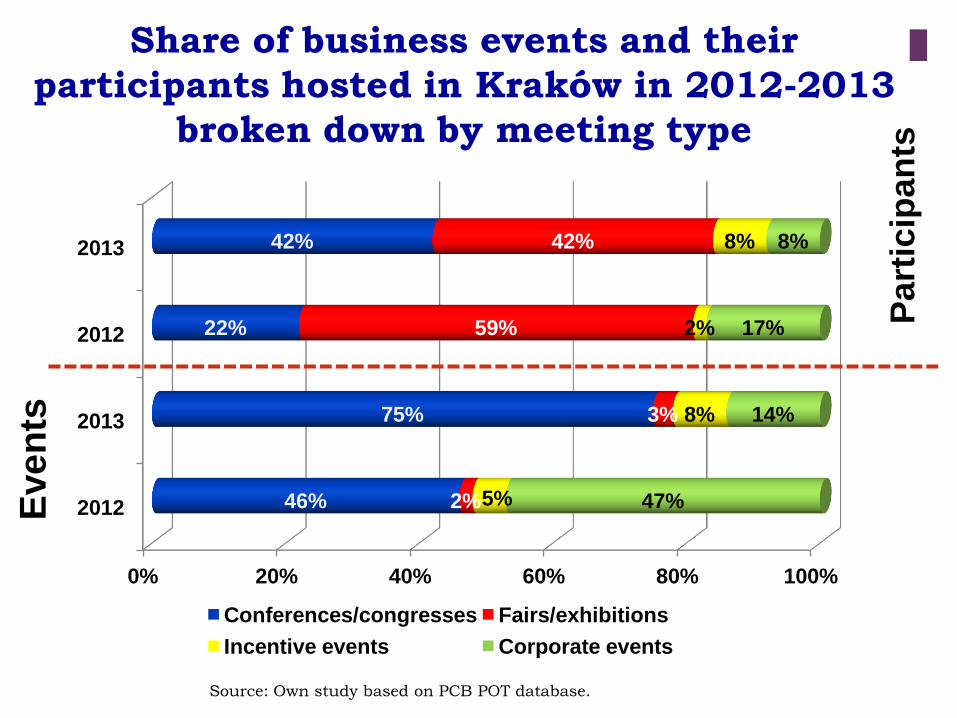
0% 20% 40% 60% 80% 100%
2012
2013
2012
2013
46%
75%
22%
42%
2%
3%
59%
42%
5%
8%
2%
8%
47%
14%
17%
8%
Conferences/congresses Fairs/exhibitions
Incentive events Corporate events
Share of business events and their
participants hosted in Kraków in 2012-2013
broken down by meeting type
Source: Own study based on PCB POT database.
Even
ts
Part
icip
an
ts
+
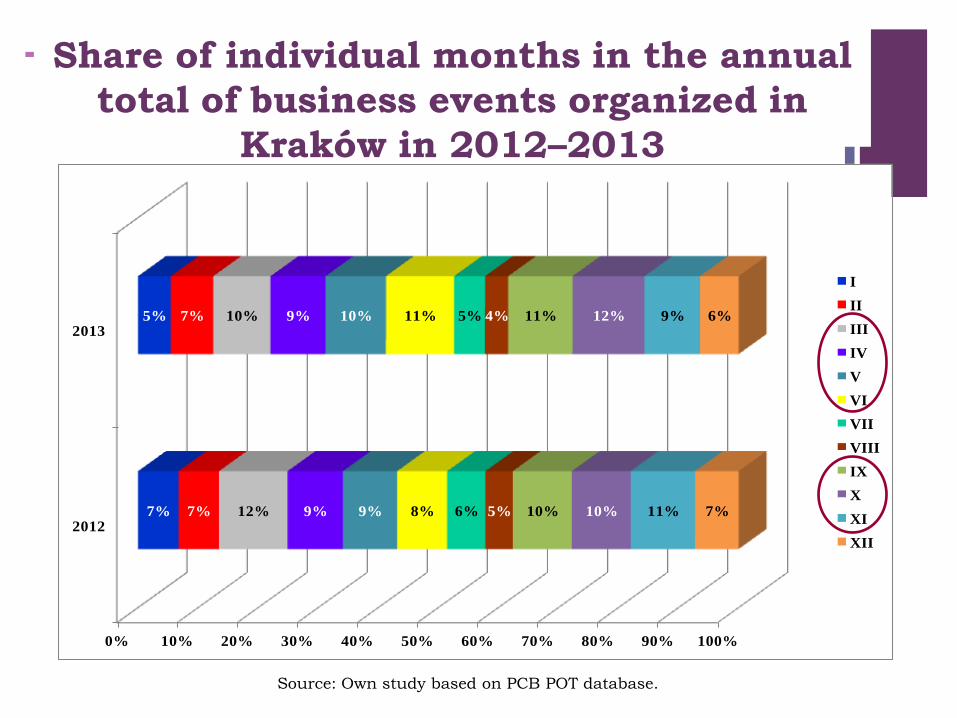
0% 10% 20% 30% 40% 50% 60% 70% 80% 90% 100%
2012
2013
7%
5%
7%
7%
12%
10%
9%
9%
9%
10%
8%
11%
6%
5%
5%
4%
10%
11%
10%
12%
11%
9%
7%
6%
I
II
III
IV
V
VI
VII
VIII
IX
X
XI
XII
Share of individual months in the annual
total of business events organized in
Kraków in 2012–2013
Source: Own study based on PCB POT database.
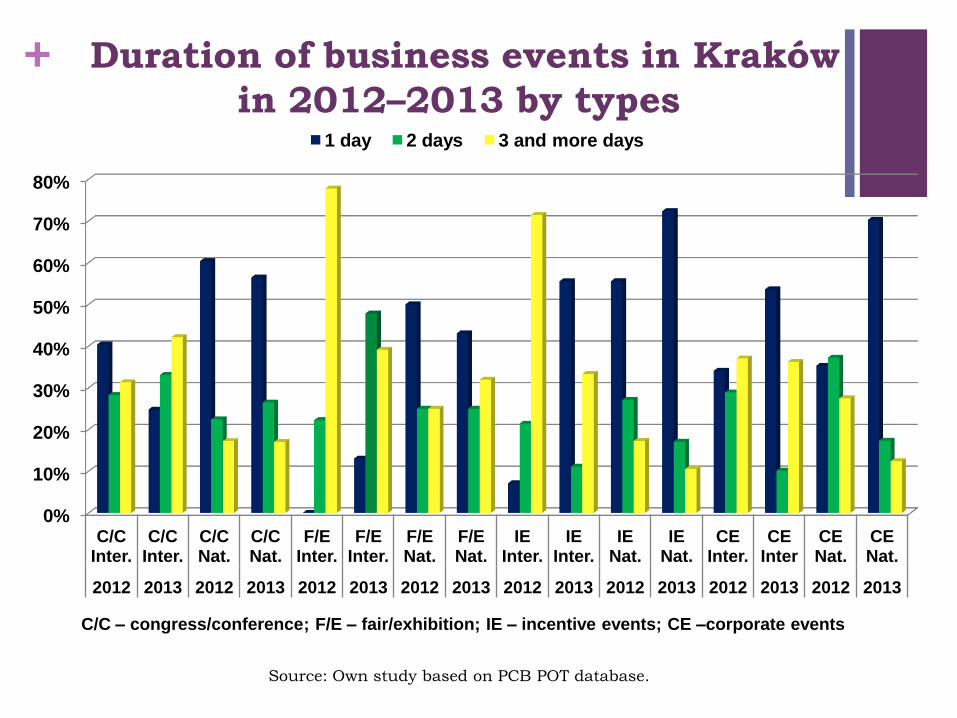
+ Duration of business events in Kraków
in 2012–2013 by types
C/C – congress/conference; F/E – fair/exhibition; IE – incentive events; CE –corporate events
Source: Own study based on PCB POT database.
0%
10%
20%
30%
40%
50%
60%
70%
80%
C/C Inter.
C/C Inter.
C/C Nat.
C/C Nat.
F/E Inter.
F/E Inter.
F/E Nat.
F/E Nat.
IE Inter.
IE Inter.
IE Nat.
IE Nat.
CE Inter.
CE Inter
CE Nat.
CE Nat.
2012 2013 2012 2013 2012 2013 2012 2013 2012 2013 2012 2013 2012 2013 2012 2013
1 day 2 days 3 and more days
+
Methodology
of the influence
of meetings industry
on Kraków’s economy
+ RESEARCH GOAL
the estimation of the economic significance
of meetings industry for the economy of KRAKÓW
with special focus on the key parameters:
GDP
Employment (annual FTEs)
Salaries
Taxes and levies
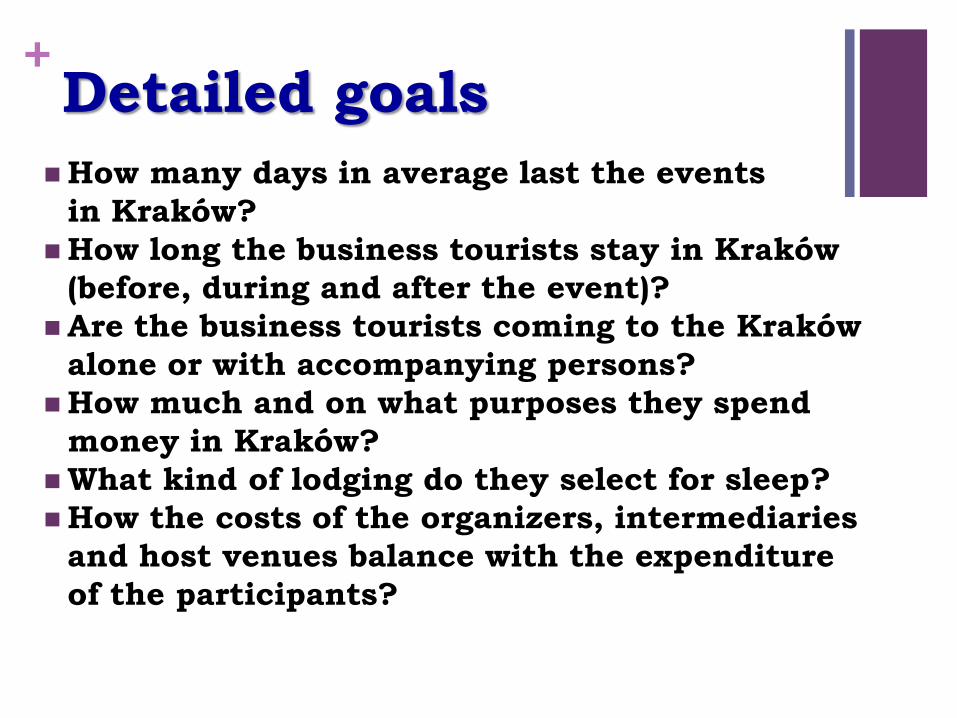
+ Detailed goals
How many days in average last the events
in Kraków?
How long the business tourists stay in Kraków
(before, during and after the event)?
Are the business tourists coming to the Kraków
alone or with accompanying persons?
How much and on what purposes they spend
money in Kraków?
What kind of lodging do they select for sleep?
How the costs of the organizers, intermediaries
and host venues balance with the expenditure
of the participants?
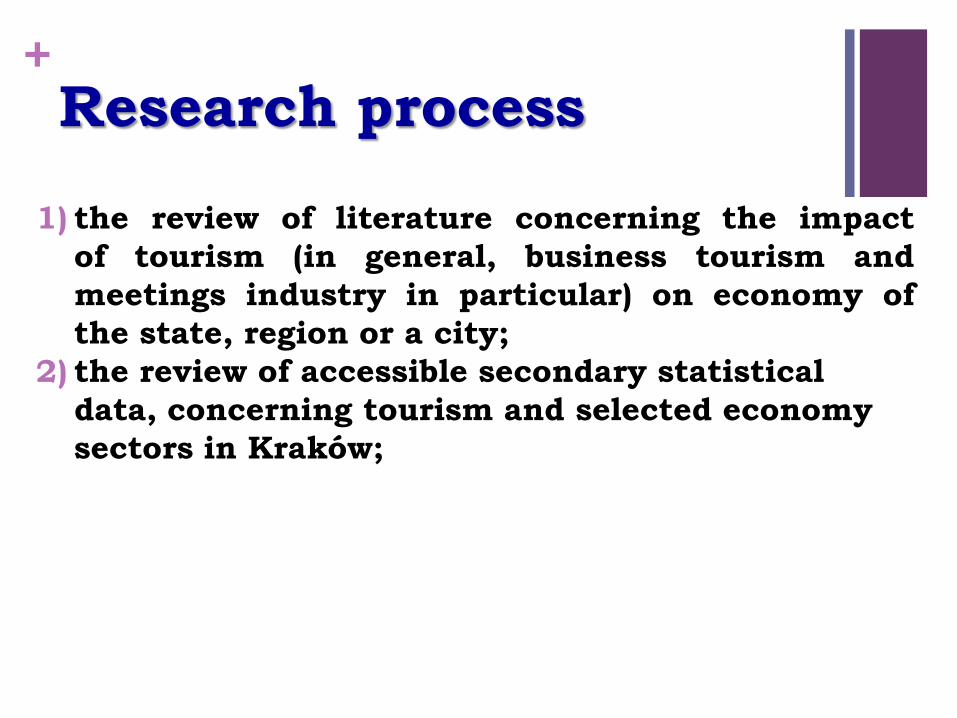
+ Research process
1) the review of literature concerning the impact
of tourism (in general, business tourism and
meetings industry in particular) on economy of
the state, region or a city;
2) the review of accessible secondary statistical
data, concerning tourism and selected economy
sectors in Kraków;
+
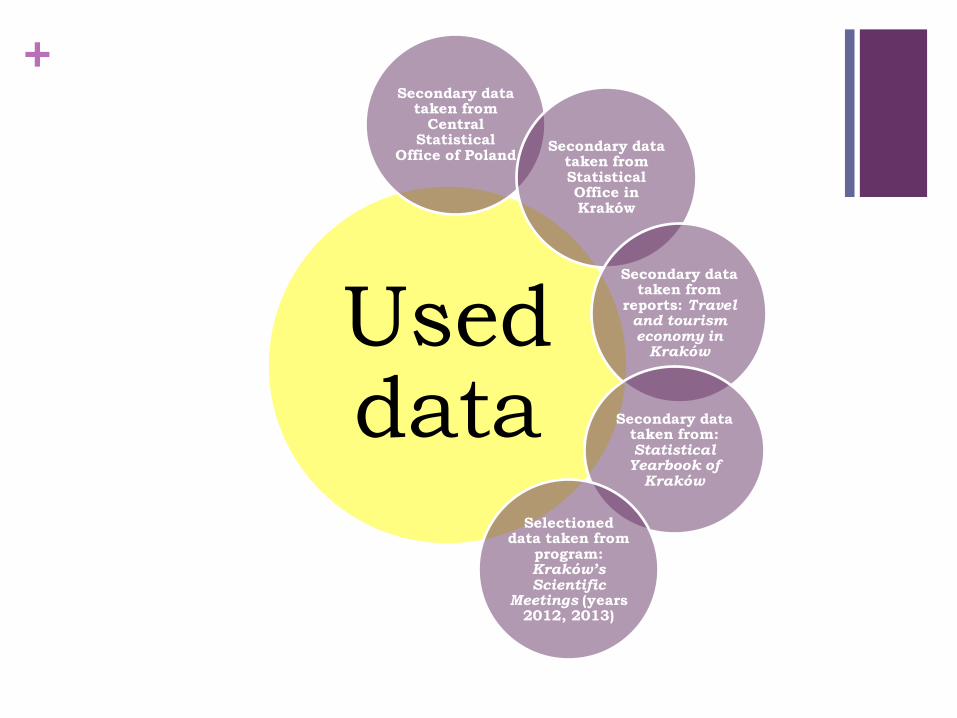
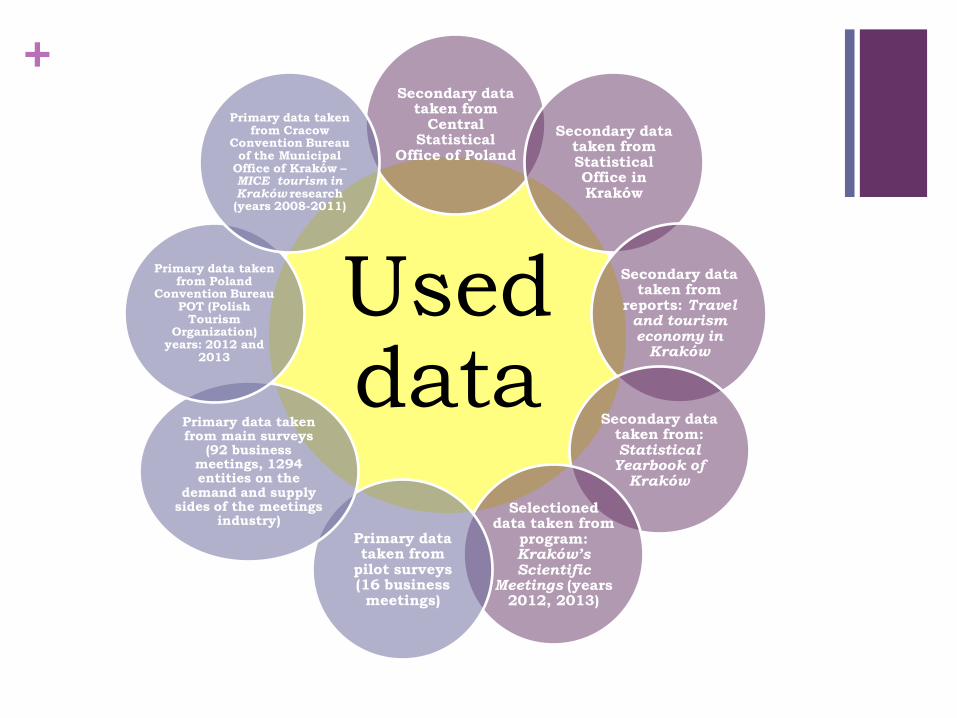
Used data
Secondary data taken from
Central Statistical
Office of Poland Secondary data
taken from Statistical Office in Kraków
Secondary data taken from
reports: Travel and tourism economy in
Kraków
Secondary data taken from: Statistical Yearbook of Kraków
Selectioned data taken from
program: Kraków’s Scientific
Meetings (years 2012, 2013)
Primary data taken from
pilot surveys (16 business meetings)
Primary data taken from main surveys
(92 business meetings, 1294 entities on the
demand and supply sides of the meetings
industry)
Primary data taken from Poland
Convention Bureau POT (Polish
Tourism Organization)
years: 2012 and 2013
Primary data taken from Cracow
Convention Bureau of the Municipal
Office of Kraków – MICE tourism in Kraków research (years 2008-2011)
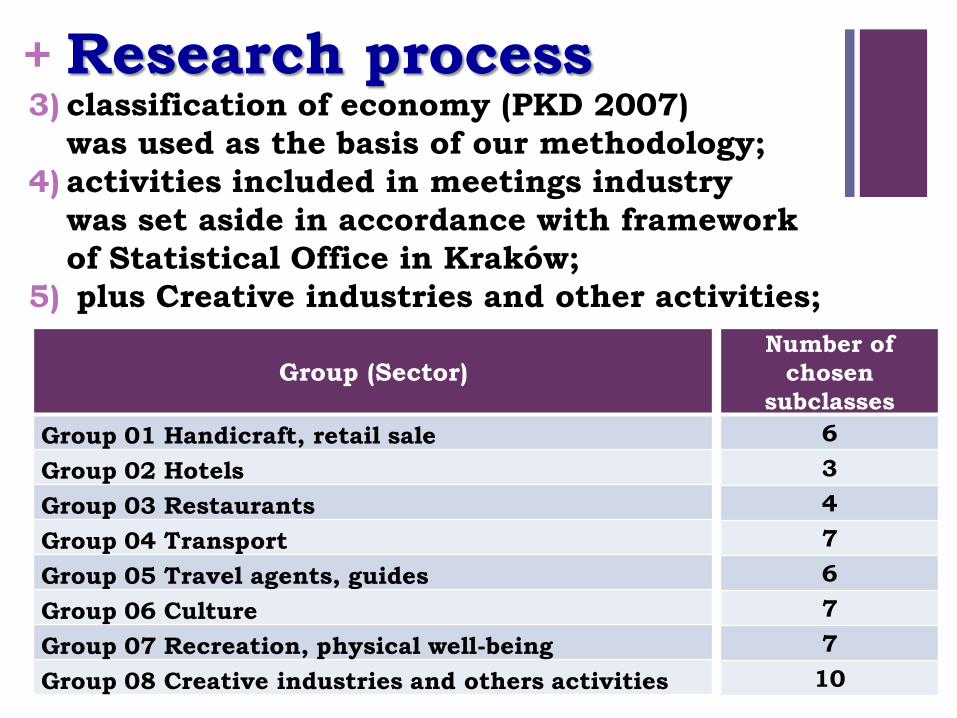
+ 3) classification of economy (PKD 2007)
was used as the basis of our methodology;
4) activities included in meetings industry
was set aside in accordance with framework
of Statistical Office in Kraków;
5) plus Creative industries and other activities;
Research process
Group (Sector)
Group 01 Handicraft, retail sale
Group 02 Hotels
Group 03 Restaurants
Group 04 Transport
Group 05 Travel agents, guides
Group 06 Culture
Group 07 Recreation, physical well-being
Group 08 Creative industries and others activities
Number of
chosen
subclasses
6
3
4
7
6
7
7
10
+ Research process
6) questionnaires – were prepared and applied at
pilot survey in Kraków;

+ Research process
five different questionnaires
+ Research process
The research process was consulted
with Swiss partners and representatives
of the meetings industry from Kraków

+ Research process
7) main survey, conducted on a sample of
92 meetings;
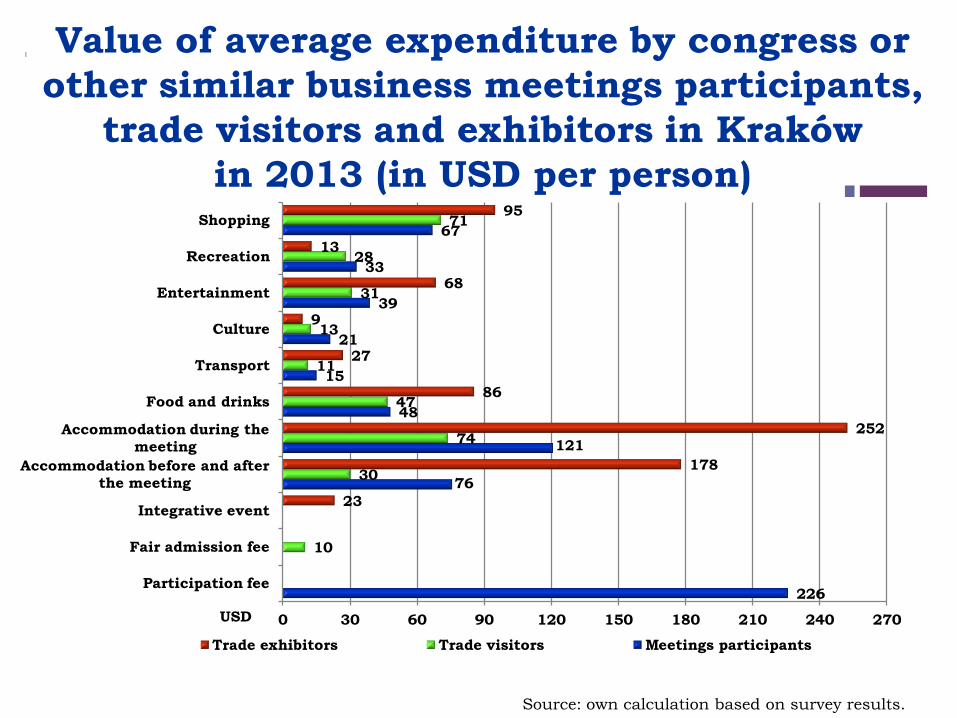
+ Value of average expenditure by congress or
other similar business meetings participants,
trade visitors and exhibitors in Kraków
in 2013 (in USD per person)
226
76
121
48
15
21
39
33
67
10
30
74
47
11
13
31
28
71
23
178
252
86
27
9
68
13
95
0 30 60 90 120 150 180 210 240 270
Participation fee
Fair admission fee
Integrative event
Accommodation before and after the meeting
Accommodation during the
meeting
Food and drinks
Transport
Culture
Entertainment
Recreation
Shopping
USD
Trade exhibitors Trade visitors Meetings participants
Source: own calculation based on survey results.
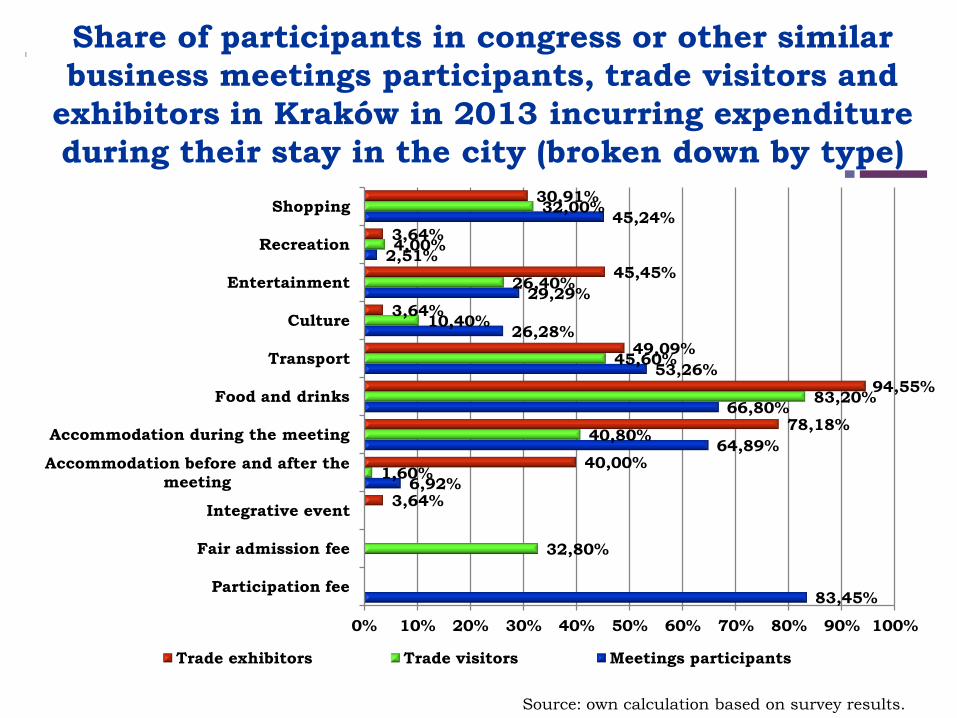
+ Share of participants in congress or other similar
business meetings participants, trade visitors and
exhibitors in Kraków in 2013 incurring expenditure
during their stay in the city (broken down by type)
Source: own calculation based on survey results.
83,45%
6,92%
64,89%
66,80%
53,26%
26,28%
29,29%
2,51%
45,24%
32,80%
1,60%
40,80%
83,20%
45,60%
10,40%
26,40%
4,00%
32,00%
3,64%
40,00%
78,18%
94,55%
49,09%
3,64%
45,45%
3,64%
30,91%
0% 10% 20% 30% 40% 50% 60% 70% 80% 90% 100%
Participation fee
Fair admission fee
Integrative event
Accommodation before and after the
meeting
Accommodation during the meeting
Food and drinks
Transport
Culture
Entertainment
Recreation
Shopping
Trade exhibitors Trade visitors Meetings participants

+ Share of exhibitors at fairs in Kraków broken
down by type of personal expenditure in the
city and the average spending per an
exhibitor (in USD) in 2013
Source: own calculation based on survey results.
506
1 684
62
1 311
596
711
9,09% 7,27%
1,82%
3,64% 5,45%
98,18%
0%
10%
20%
30%
40%
50%
60%
70%
80%
90%
100%
0
200
400
600
800
1000
1200
1400
1600
1800
Employment
of additional
staff from Krakow
Fair Handling
Agency
services
Free tickets
for partners
Organisation
of an event for
partners
Advertisment Costs of
renting space
at the fair
USD
+
Used data
Secondary data taken from
Central Statistical
Office of Poland
Secondary data taken from Statistical Office in Kraków
Secondary data taken from
reports: Travel and tourism economy in
Kraków
Secondary data taken from: Statistical Yearbook of Kraków
Selectioned data taken from
program: Kraków’s Scientific
Meetings (years 2012, 2013)
Primary data taken from
pilot surveys (16 business meetings)
Primary data taken from main surveys
(92 business meetings, 1294 entities on the
demand and supply sides of the meetings
industry)
Primary data taken from Poland
Convention Bureau POT (Polish
Tourism Organization)
years: 2012 and 2013
Primary data taken from Cracow
Convention Bureau of the Municipal
Office of Kraków – MICE tourism in Kraków research (years 2008-2011)
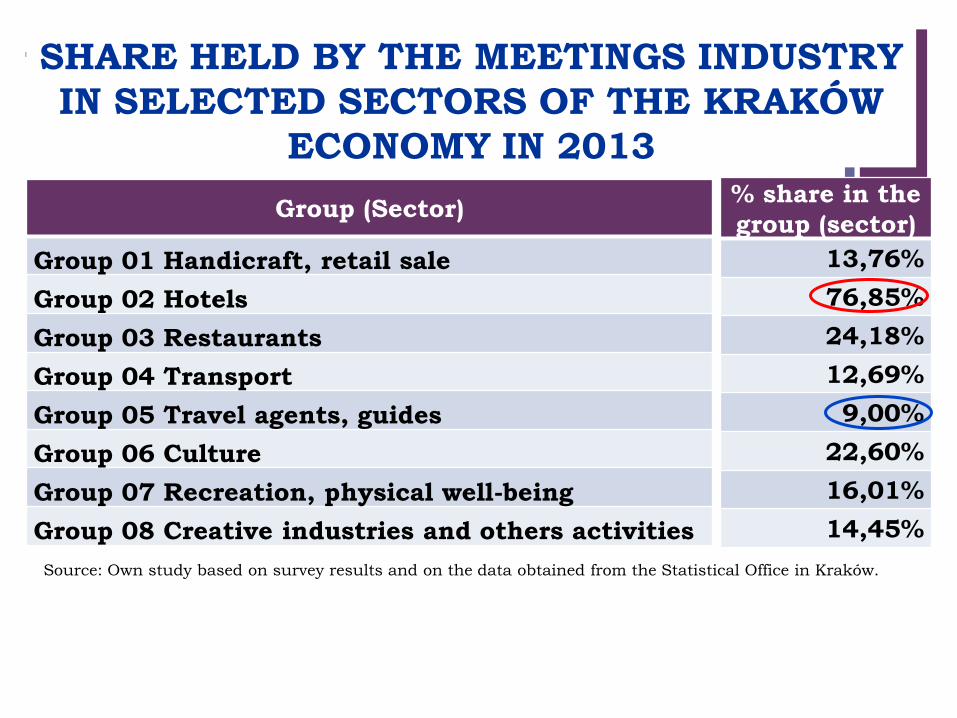
+
Group (Sector)
Group 01 Handicraft, retail sale
Group 02 Hotels
Group 03 Restaurants
Group 04 Transport
Group 05 Travel agents, guides
Group 06 Culture
Group 07 Recreation, physical well-being
Group 08 Creative industries and others activities
SHARE HELD BY THE MEETINGS INDUSTRY
IN SELECTED SECTORS OF THE KRAKÓW
ECONOMY IN 2013
Source: Own study based on survey results and on the data obtained from the Statistical Office in Kraków.
% share in the
group (sector)
13,76%
76,85%
24,18%
12,69%
9,00%
22,60%
16,01%
14,45%

+
8) a direct impact of meetings industry on the
selected sectors of Kraków economy was
calculated;
Research process
Terms of impact of the meetings
industry on the economy of Kraków Amount in 2013
Employment 8 890 persons
Salaries USD 58.2 mln
Taxes and levies USD 18.5 mln

+
As we know ……
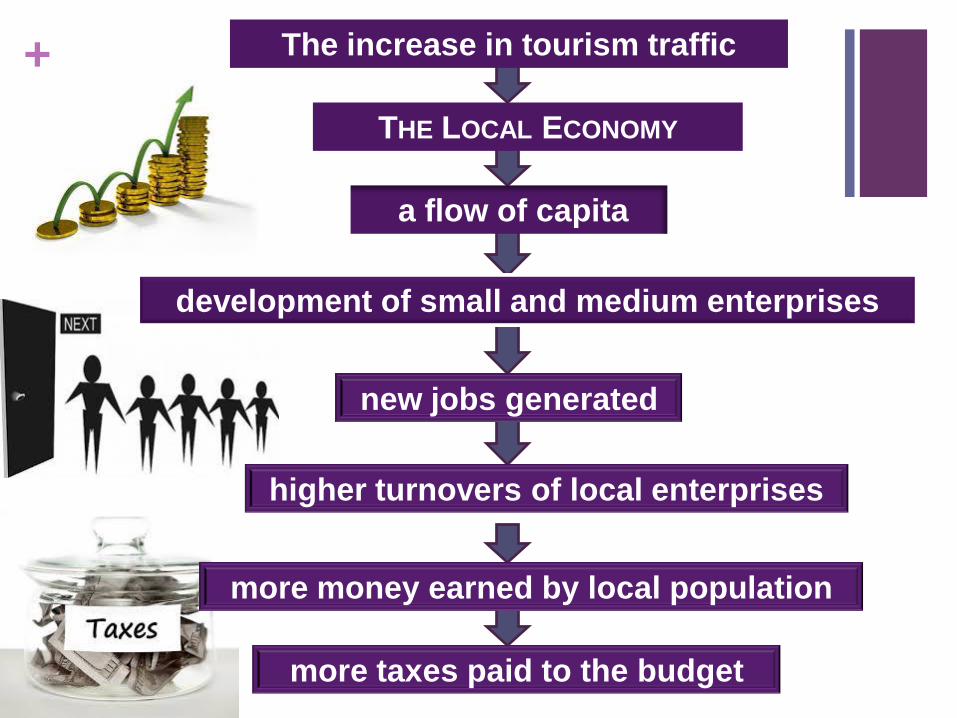
+
more taxes paid to the budget
THE LOCAL ECONOMY
The increase in tourism traffic
a flow of capita
development of small and medium enterprises
new jobs generated
higher turnovers of local enterprises
more money earned by local population
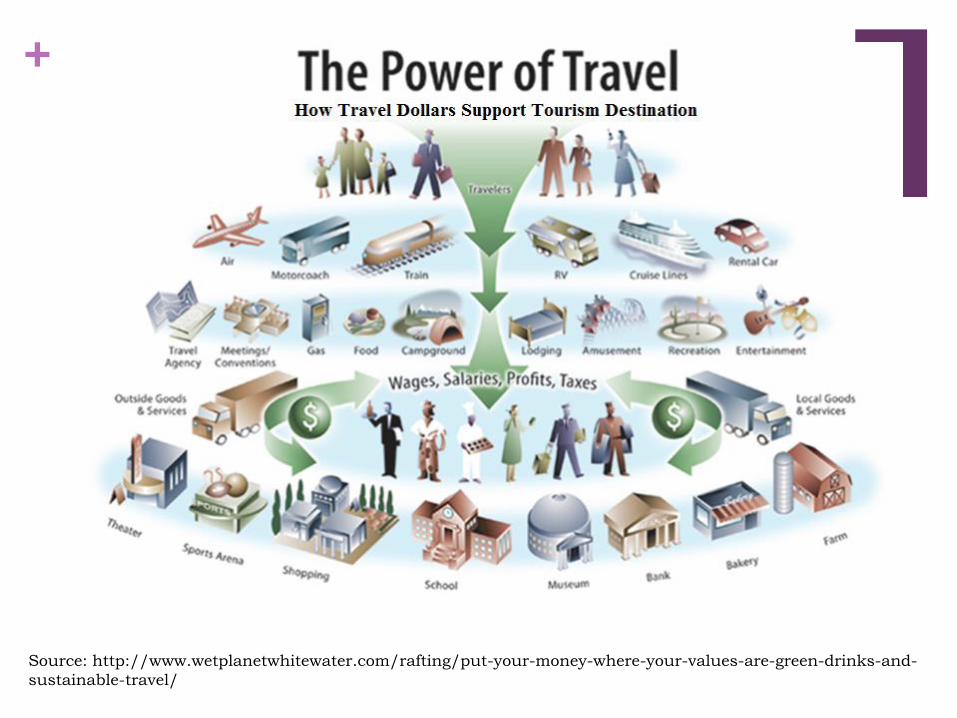
+
Source: http://www.wetplanetwhitewater.com/rafting/put-your-money-where-your-values-are-green-drinks-and-
sustainable-travel/
+
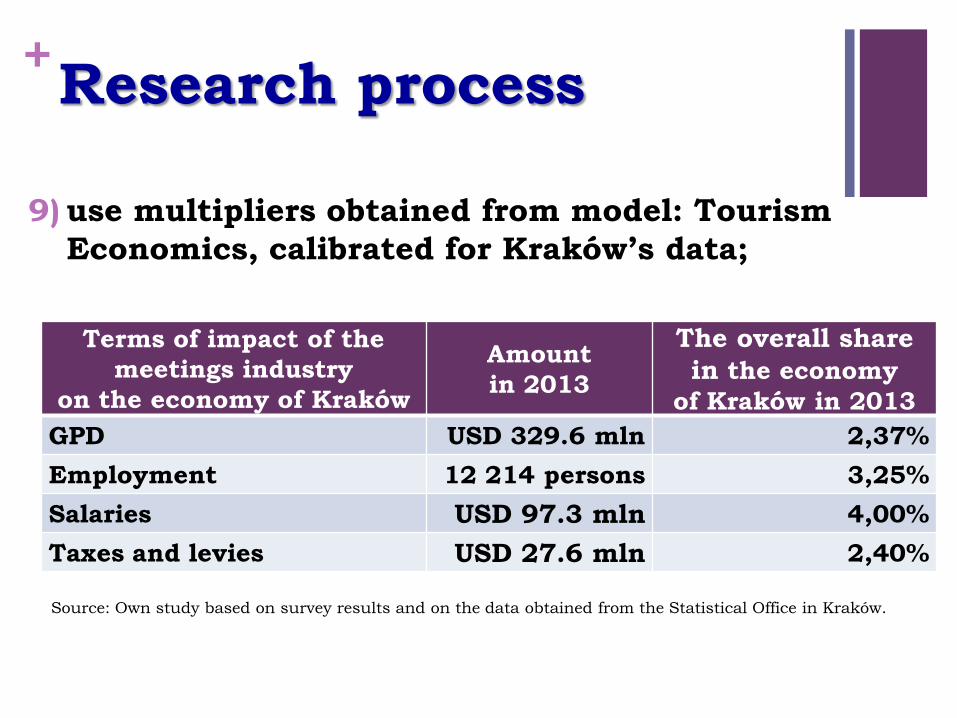
9) use multipliers obtained from model: Tourism
Economics, calibrated for Kraków’s data;
Research process
Terms of impact of the
meetings industry
on the economy of Kraków
Amount
in 2013
The overall share
in the economy
of Kraków in 2013
GPD USD 329.6 mln 2,37%
Employment 12 214 persons 3,25%
Salaries USD 97.3 mln 4,00%
Taxes and levies USD 27.6 mln 2,40%
Source: Own study based on survey results and on the data obtained from the Statistical Office in Kraków.
+ Final report
http://krakowimpact.pl/
wp-content/uploads/ki-
raport-2014-EN-WEB.pdf