
65
65
Lidar Basics for Mapping ApplicationsByJamesD.Giglierano
�owaGeologicalSurvey�owaDepartmentofNaturalResources
109TrowbridgeHall�owaCity,�A52242-1319Telephone:(319)335-1594
Fax:(319)335-2754e-mail:[email protected]
INTRODUCTION
Thepurposeofthisarticleistohelpnewcomersun-derstandthebasicsoflidardatacollectionandprocessing,especiallynon-engineering,mappingspecialistssuchasgeologists,soilsscientists,andthoseinterestedinlandcovercharacterization.ManystatesintheU.S.areem-barkingonlarge-scalelidaracquisitions.Thiswillmakelidarelevationandotherderivedproductswidelyavail-abletomanydifferentaudiences.Tomakefulluseofthisnewsourceofinformation,mappersmusthaveoracquiresomeknowledgeofthelidardatacollectionandhandlingprocedures,andhavethecapabilitytoconvertthevendorsupplied files into useful products. In some cases, map-perswilldotheprocessingthemselves;inothers,theywillopttohavetheprocessingperformedbyavendororthirdparty.Anothercasemaybethatlidarderivedtopo-graphicdatasuppliedbyalocalgovernmententitywillhavenometadata.�nthiscase,theuserwillhavetomakesomeeducatedguessesastothetypeofprocessingthatmayhavebeenperformedonthedata.
HOW LIDAR DATA ARE COLLECTED AND REPRESENTED
ThetermLiDARisanacronymforLightDetec-tionandRanging.LightDetectionandRangingbasicallyconsists of a laser rangefinder that operates in some form ofairborneplatform(helicopter,plane,orsatellite).Therangefinder takes repeated measurements of the dis-tancefromtheplatformtotheground.ThepositionandelevationoftheplatformispreciselyknownbywayofairborneGPSalongwithgroundcontrol,sotheeleva-tionofthegroundsurfacecanbecalculatedbysubtract-ing the laser rangefinder distance from the height of the platform.Compensationmustbemadeforthetiltandpitchoftheairborneplatformbywayofgyroscopesandaccelerometersintheaircraft’sinertialmeasurementunit.AgoodtechnicaloverviewoflidarscanningtechnologyisprovidedbyWehrandLohr(1999).
Lidarsystemsrecordthousandsofhighlyaccuratedistancemeasurementseverysecond(newersystemsoperateatfrequenciesupto150kHz;oldersystems30-80kHz)andcreateaverydensecoverageofelevationsoverawideareainashortamountoftime.Becauselidarisanactivesensorthatsuppliesitsownlightsource,itcanbe used at night and, thus, avoid routine air traffic, or it can be flown under some types of high cloud conditions. Most lidar systems record multiple surface reflections, or “returns,”fromasinglelaserpulse.Whenalaserpulseencountersvegetation,powerlines,orbuildings,multiplereturns can be recorded. The first return will represent theelevationnearthetopoftheobject.Thesecondandthirdreturnsmayrepresenttrunksandbrancheswithinatree,orunderstoryvegetation.Hopefully,thelastreturnrecordedbythesensorwillbetheremaininglaserenergyreflected off the ground surface, though at times, the tree willblockalltheenergyfromreachingtheground.Thesemultiplereturnscanbeusedtodeterminetheheightoftreesorpowerlines,orgiveindicationsofforeststructure(crownheight,understorydensity,etc.).Figure1showsasingle 2 x 2 km tile that consists of 3.3 million first return lidarpoints.
Anotherfeatureofanairbornelidarsystemistheuseofmirrorsorothertechnologytopointthelaserbeamtoeithersideoftheaircraftasitmovesalongitspath.Dependingonthescanningmechanism,thelidarscanscanhaveaside-to-side,zigzag,sinusoidal,orwavypat-tern.Whilethelaseritselfpulsesmanythousandsoftimespersecond,thescanningmechanismusuallymovesfromside-to-sideataround20-40cyclespersecond.Thisscan-ning,combinedwiththeforwardmotionoftheaircraft,producesmillionsofelevationsinashortdistanceandtime. The field of view or angle the scan makes from side-to-sidecanbeadjustedbytheoperator,butisusuallysetat30to40degrees.Thiscreatesaswathofaround1kilometerwideorless.Adjacentswathsoverlapfrom15to 30% so that no data gaps are left between flight lines.
Thespacingoflidarpointsontheground,called“postings,”isafunctionofthelaserpulsefrequency,scan

66 D�G�TALMAPP�NGTECHN�QUES‘06
frequency, and flight height (Baltsavias, 1999). While there is usually a nominal posting spacing specified in a lidarproject,actualdatapointshavevariablespacingthatare smaller and larger than the specified spacing. Map-pers need to be aware of these effects when viewing final productsthatwerederivedfromtherawdata.Thesecondaspectisthat,becausethelaserscansfromsidetoside,itinteractswiththegroundindifferentways,dependingontheangleofincidence.Lidarpulsesattheedgeofascanwillstrikethesidesofbuildings,whereaspulsesatthecenterofascanwillonlystriketherooftops.Like-wise,pulsesattheedgesofscanswillpassthroughtreesatanangle.Sometimesthiswillcreate“shadows”ontheothersidewherenolidarpassesthrough.�naddition,lessenergy will return to the lidar receiver as it reflects away fromtheaircraft.Thisisevidentintheintensityimagescreatedfromtheintensityvaluesforeachreturn:onecanseeoveralldarkeningoftheintensityattheedgesofswaths.Edgesofswathsappeardarkerthanthereturnsatcentersofswaths.
HOW LIDAR POINTS ARE PROCESSED INTO TINS AND DEMS
�ntheSpringof2005,the�owaDepartmentofNatu-ralResources(DNR)andothers,hadlidarwithanominalresolutionof1metercollectedbyacommercialvendor
overtheLakeDarlingwatershedlocatedinWashingtonCounty, Iowa. The vendor’s lidar system collected a first and last return from each lidar pulse. From the first and lastreturns,aso-called“bareearth”returnwascreatedusing a proprietary classification algorithm developed by the vendor. These classification systems try to sort out non-bareearthreturns(treetops,buildings,powerlines,automobiles)frombareearthreturns.Todistinguishbareearthinforestedareas,differencesinelevationbetweenthe first and last returns, relative changes in elevation, andslopewereused.�ntensitydatawereusedtoidentifyvegetationandman-madematerials.ThelidardatafortheLakeDarlingwatershedwerecollectedinAprilwithmostlyleaf-offconditions.Therearesomedatavoidsinforestedareasduetonon-penetrationofthelaserthroughtreecanopy,buttheseareasaregenerallylessthan10meters across and are easily filled in by interpolation. Leaf-onconditionsandtallcrops,suchascorn,donotalloweasypenetrationofthelaserbeamtothegroundandshouldbeavoided.
LidardatafortheLakeDarlingareaweresuppliedbythevendorinASC��textformat,consistingof2x2kilometertileswithxandycoordinates,zelevations,andintensityvalues.Withanominal1meterpostingspac-ing,sometileshadupto3.3millionpoints.Postingsnearthe center of the flight lines were close to the nominal 1 meterspacing(Figure2),whiletowardtheendsofscans,thepointsconvergewiththestartofthenextscan(Figure3).Whilesomescansconverge,othersdiverge.Wherethescansconverge,thepointscanbelessthanhalfofthenominalspacing,andlikewise,wheretheydiverge,theycanbetwicethenominalspacing.Becausesomepointscanbeascloseas0.5meters,thetileswereinitiallyinterpolatedtocreategridswith0.5meterresolution,withtheideathatnodatapointsshouldbemergedoraveragedwithanyotherpoints.Thereisatendencyamongsomeuserstocreategridswithresolutionsof3,5,andeven10meterstosavestoragespaceorreducethevolumeofdatatoprocess.Wedesiredtocreatethegridsascloseaspossibletothenativeresolutionofthelidardatatoevalu-atetheirfullpotentialtorepresentthesmallestsurfacefeatures.
Tomakedigitalelevationmodels(DEM)fromthetiles,theSurfer8software(http://www.goldensoftware.com/products/surfer/surfer.shtml)wasused.Thissoftwarefirst creates a triangulated irregular network (TIN) before itinterpolatesthepointsintoarasterDEM;however,oncetheDEMtileswereinitiallyputtogetherintomosaics,itbecameobviousthattherewerenoticeablegapsbetweeneachtile.Toremedythis,aCprogramwascreatedtosort through the ASCII text files of the adjacent tiles and find points within a 3 meter buffer of the edge of the tile tobeprocessed.Thenthetileswerereprocessedaddingthe3meterbuffers.Whentheserastertilesweremergedtogetherintoamosaic,thegapswerealmostcompletelyeliminated.Leica�magine(http://gi.leica-geosystems.
Figure 1.Grayscaleimageconsistingof3.3millionlidarfirst return points or “postings.” First returns indicate the topsoftreesandbuildingsaswellasbaregroundinopenareas.Whiteareasaredatavoidswherenoreturnswererecorded, usually due to non-reflecting water surfaces.

67L�DARBAS�CSFORMAPP�NGAPPL�CAT�ONS
Figure 2. Data near the middle of a lidar flight line. Post-ingspacingisaroundonemeteratthecenterofbackandforthscans.
Figure 3. Data along overlap of two adjacent lidar flight lines (top and bottom of figure). The posting spacing is highly variable at edges of flight lines. Some postings are lessthanonemeterapartattheendofoneandbeginningofthenextscan,whilethedistancesbetweenpointsindif-ferentsetsofscansareasmuchas1.5metersapart.
com/)wasusedtomosaicallthetilesintoonelargerasterDEM file. From the DEM, shaded relief images were createdandcompressed.DEMsandshadedreliefimagesweretheneasilyimportedintoArcG�Ssoftware(http://www.esri.com/)fordisplayandfurtheranalysis.
FieldexaminationofthelidarbareearthshadedreliefimageswasconductedinJanuary,2006.�twassurpris-inghowwelllidarshadedthereliefimagesrepresented
thesmallesttopographicfeatures,includingsmallslopechangesoflessthanhalf-a-meter,eveninforestedareas.Thereweresomedatavoidsduetolackofpenetrationthroughthedensetreecanopy,buttherewereenoughdatapoints to show good definition of incised stream channels, meanderscars,andgullies(Figure4).Man-madefeaturessuchasroadditchesandembankments,terraces,anddams were also well defined. Tillage patterns are evident as regular lineated textures on crop fields parallel to the roadgrid.Thesearenotscanningartifactsastheindividu-al scans are at a slight angle to the east-west flight lines.
Becausethebareearthprocessingdoesnotremove100%oftheforestartifacts,adistinctivebumpypatternisleftinthebaremodel,whichindicatesthepresenceofforest cover (Figure 5). During field examination, it was noticedthatdifferentcanopystructureswererepresentedbydifferentpatternsintheartifacts.�nthetallcanopyfloodplain forest, most of the bumps were removed, which leftamostlysmoothsurface,whileonsideslopeswiththickunderstoryorbrushcover,thetextureontheshadedreliefimageisrougherinappearance.�nterestingly,thebareearthprocessingremovednearlyallofthenumeroustreefallsinthestreamchannels,whichallowsdrain-age tracing programs to work well when following flow pathsdownstream.Also,areaswithpinetreeswereverysmooth,whichindicatednearlycompletepenetrationbythelaserbeam.
HOW TO USE LIDAR PRODUCTS FOR MAPPING APPLICATIONS
Oncetherawlidarpointtilesareprocessedintohigh-resolutionDEMs,otherusefulmappingproductscanbederived.Thederivedshadedreliefimagepreviouslymentioned(Figure4)isveryusefulforvisualdisplayandinterpretation,andcanbecombinedwithcolorizedeleva-tionimagesforextrainformationcontent.Anotherusefuldisplayproductistheslopemap,whichcanbederivedfromtheDEMusingthegridprocessingtoolsfoundinalmosteveryG�Spackage.Usually,achoicecanbemadewhethertocalculatethesloperateindegreesoraspercent(45degreeslope=100%).Aslopemapbasedonpercentcanbegroupedintoslopeclassestypicallyusedbysoilsurveymappers(slopeclassA=0-2%,B=2-4%,etc.)andreadilycomparedtosoilpolygonsdisplayedbyslopeclass(Figure6).Figure7showsthenewlevelofdetailavailableinslopeclassesderivedfromlidardata.
�nadditiontotheelevationcomponentofthelidarreturn,manysystemsproduceanintensitycomponentthatindicatesthestrengthofthelidarreturn.Thisintensityvalue is mostly influenced by the reflectance of the mate-rial struck by the laser pulse, but is also influenced by the scanangle.(Laserpulsesdirectedawayfromtheairplaneat significant angles do not reflect back as much light energyasapulsedirectedstraightdownfromtheplane).Becausemostlidarsystemsusealaserthatemitslightin

68 D�G�TALMAPP�NGTECHN�QUES‘06
Figure 4.PortionofthebareearthshadedreliefimageoftheLakeDarlingwatershed,showingnaturalandman-madefeaturesreadilyapparentinthelidardata.
Figure 5.Portionofabareearthshadedreliefimageshowingartifacts(bumpytexture)indeciduousfor-estareas.Theseartifactsarelidarelevationsclas-sified as bare earth, but probablyarefromtreetrunks,branches,orunder-storyclosetothegroundand classified as bare earth bythevendor’salgorithm.

69L�DARBAS�CSFORMAPP�NGAPPL�CAT�ONS
Figure 6.Soilsurveysoilpolygonsshadedbyslopeclassrange:lightshadesarelowerslopesanddarkershadesindicatesteeperslopes.
Figure 7.SlopeclassrangesderivedfromLakeDarlinglidardata.Whilelowslopeareasonlidarlooksimilartothesoilpolygons,lidarshowsmoredetailonsteepslopessuchasgulliesandstreamchannels.
70 D�G�TALMAPP�NGTECHN�QUES‘06
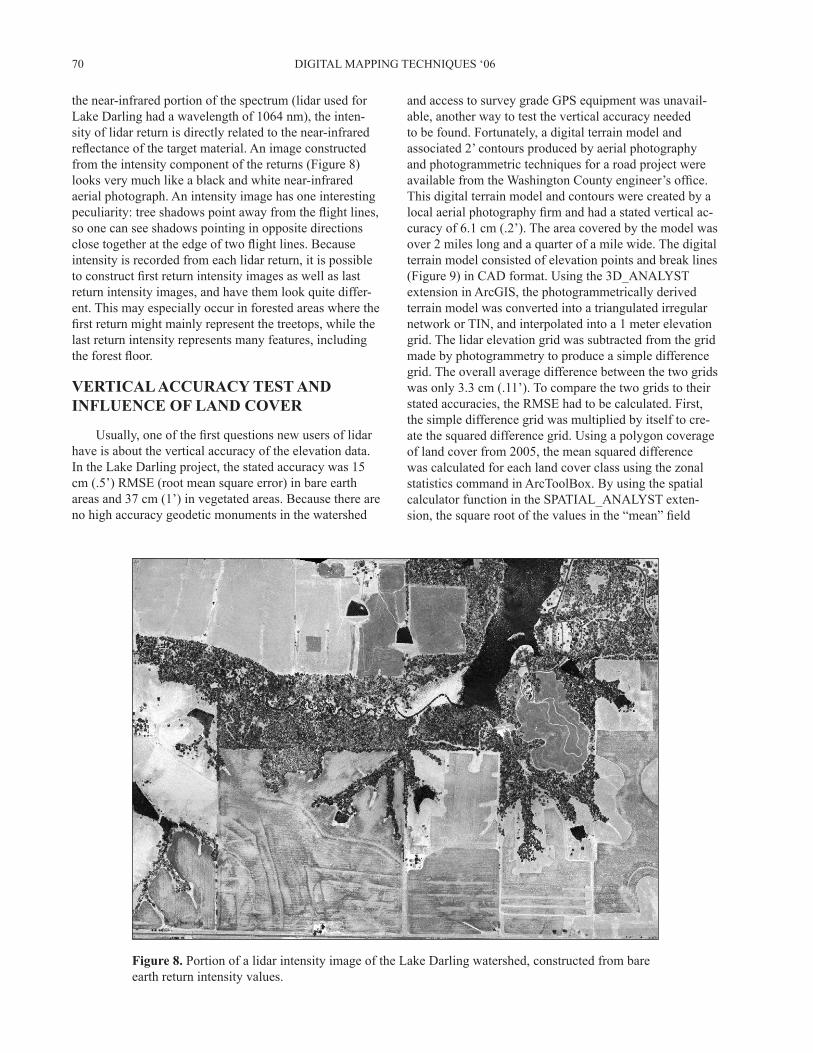
thenear-infraredportionofthespectrum(lidarusedforLakeDarlinghadawavelengthof1064nm),theinten-sityoflidarreturnisdirectlyrelatedtothenear-infraredreflectance of the target material. An image constructed fromtheintensitycomponentofthereturns(Figure8)looksverymuchlikeablackandwhitenear-infraredaerialphotograph.Anintensityimagehasoneinterestingpeculiarity: tree shadows point away from the flight lines, soonecanseeshadowspointinginoppositedirectionsclose together at the edge of two flight lines. Because intensityisrecordedfromeachlidarreturn,itispossibleto construct first return intensity images as well as last returnintensityimages,andhavethemlookquitediffer-ent.Thismayespeciallyoccurinforestedareaswherethefirst return might mainly represent the treetops, while the lastreturnintensityrepresentsmanyfeatures,includingthe forest floor.
VERTICAL ACCURACY TEST AND INFLUENCE OF LAND COVER
Usually, one of the first questions new users of lidar haveisabouttheverticalaccuracyoftheelevationdata.�ntheLakeDarlingproject,thestatedaccuracywas15cm(.5’)RMSE(rootmeansquareerror)inbareearthareasand37cm(1’)invegetatedareas.Becausetherearenohighaccuracygeodeticmonumentsinthewatershed
andaccesstosurveygradeGPSequipmentwasunavail-able,anotherwaytotesttheverticalaccuracyneededtobefound.Fortunately,adigitalterrainmodelandassociated2’contoursproducedbyaerialphotographyandphotogrammetrictechniquesforaroadprojectwereavailable from the Washington County engineer’s office. Thisdigitalterrainmodelandcontourswerecreatedbyalocal aerial photography firm and had a stated vertical ac-curacyof6.1cm(.2’).Theareacoveredbythemodelwasover2mileslongandaquarterofamilewide.Thedigitalterrainmodelconsistedofelevationpointsandbreaklines(Figure9)inCADformat.Usingthe3D_ANALYSTextensioninArcG�S,thephotogrammetricallyderivedterrainmodelwasconvertedintoatriangulatedirregularnetworkorT�N,andinterpolatedintoa1meterelevationgrid.Thelidarelevationgridwassubtractedfromthegridmadebyphotogrammetrytoproduceasimpledifferencegrid.Theoverallaveragedifferencebetweenthetwogridswasonly3.3cm(.11’).Tocomparethetwogridstotheirstatedaccuracies,theRMSEhadtobecalculated.First,thesimpledifferencegridwasmultipliedbyitselftocre-atethesquareddifferencegrid.Usingapolygoncoverageoflandcoverfrom2005,themeansquareddifferencewascalculatedforeachlandcoverclassusingthezonalstatisticscommandinArcToolBox.ByusingthespatialcalculatorfunctionintheSPAT�AL_ANALYSTexten-sion, the square root of the values in the “mean” field
Figure 8.PortionofalidarintensityimageoftheLakeDarlingwatershed,constructedfrombareearthreturnintensityvalues.

71L�DARBAS�CSFORMAPP�NGAPPL�CAT�ONS
ofthetablewascalculated,andtheRMSEwasfoundforeachlandcoverclass.Thezonalstatistictoolalsocomputesa“count”ofcellsforeachclassanda“sum”oftheelevationswithinthatclass.Bycalculatingthesumofall the “count” field values and “sum” field values for all theclasses,anddividingthetotalsumbythetotalcount,theaveragesquareddifferencefortheentiredatasetwasfound.Bytakingthesquarerootofthisvalue,theRMSEwasfoundforthewholearea.�nitially,RMSEbetweenthelidarDEMandthephotogrammetryDEMwasfoundtobe.79feetor24.1cm.
Uponexaminationofthesquareddifferenceim-age,itwasapparentthattheterraininseveralareashadchanged significantly between the time of the airphoto flight in 2000 and the lidar flight in 2005. These mainly includedareaswheretheinstallationofsedimentreten-tionstructuresanddams,androadgradinghadoccurred.Whentheseareasweredigitizedandexcludedfromthesquareddifferencecalculation,theoverallRMSEwasfoundtobe.57feetor17.4cm(Figure10).TheRMSEoftherowcropareawas.46’(14.3cm),grassareas.62’(18.9cm),andforestedareas.85’(25.8cm).�ftheDEMderivedbyphotogrammetricmeansisacceptedasthe
higheraccuracysource,thenthelidarmeetsitsstatedaccuracyof15cminthebaregroundareas,andunder37cminthevegetatedareas.Thisappearstobeagoodtestoflidaraccuracybecauseitincludesmanytypesoflandcoverconditions,notjustafewhighaccuracylocationsatbenchmarksonroadsornearbyditches.
COMPARING OLD AND NEW DATA
One of the first tests of any new lidar data set is to compareitwiththeexistingDEMderivedfromthe10’contoursfromtheUSGStopographicquadranglemappingprojectsofthelatterhalfofthelastcentury.Displayedatsmaller scales, it is difficult to see much difference be-tweentheshadedreliefimagesderivedfromthe30meterresolutionNationalElevationDatasetorNED(http://ned.usgs.gov/)andlidarshadedrelief.Onlywhenthedis-playiszoomedintolargerscalesisitpossibletoseethemarkeddifferencesbetweenthe30meterNED(Figure11)andlidarDEM(Figure12).Visibleonthelidarimage(butnotonthe30meterNEDshadedreliefimage),areman-madefeaturessuchasroadways,ditches,fencelines,terracesanddams.Naturalfeaturessuchasstreamchan-nels, gullies, and floodplains are also visible.
Lidarexcelsatmappingtopographicallychallengedareas:areaswithlittlerelief.Figure13isashadedreliefimage,derivedfromthe30meterNED,thatshowstypi-calglaciatedterraininnorth-central�owa,eastofSpiritLakeinDickinsonCounty.Figure14showsthesameareausing1meterresolutionlidar,whichfocusestheindis-tinctmoundsseenontheNEDshadedreliefintosharplydefined, circular, and elongated features. These are inter-pretedtoberemnantsoficewalledlakes,whichformedonthesurfaceoftheglacier.Theselakeshadvaryingamountsofsedimentdepositedinthem,andaftertheicemelted,thesesedimentsformedindistinct,lowmounds(Quadeetal.,2004).
Figure 15 shows the Missouri River floodplain north ofCouncilBluffs,�owa,inaview,whichagain,usesthe30meterresolutionNEDtocreateashadedreliefimage.�trevealsnumerousdefectsintheoriginalconversionofwidely spaced contours on a very flat surface. With a 10’ contourinterval,thereisnotenoughinformationtointer-polate features on the floodplain adequately. The shaded reliefimagerevealscross-shapedartifactswithintheDEM,whichwerecreatedbytheinterpolationsoftware’sattempttoconnectwidelyspaceddata.Figure16showsthegreatimprovementaffordedbyinterpolatingasurfacefromcloselyspacedlidarpoints(about2meterlidarpost-ings).MissouriRivermeanderscars,leveesalongdrain-ageditches,fencelines,interstatelanes,railroadright-of-ways,borrowpits,andsewagelagoonsareallvisibleonthelidarshadedreliefimage.
Whenusingshadedreliefimagesforon-screendigitizing,geologicalmapperswillneedtobecomeac-customedtorecognizingandseparatingman-madeaswell
Figure 9.Portionofshadedreliefdigitalterrainmodelderivedfromlowaltitudeaerialphotos.Theblackdotsareelevationmasspointsandtheblacklinesarebreaklines.

72 D�G�TALMAPP�NGTECHN�QUES‘06
Figure 10.Rootmeansquareerror(RMSE)calculationofphotogrammetricallyderivedDEMandlidarDEM,after2000/2005landscape-changeareasremovedfromcalculation.
Figure 11.PortionofashadedreliefimagemadefromaNationalElevationDataset(NED)30meterresolutionDEM.AreaisfromLakeDarlingwatershedinWashing-tonCounty,�owa.
Figure 12.Portionofshadedreliefimagemadefroma1meterresolutionlidarDEMforthesameareainWashing-tonCounty,�owa.

73L�DARBAS�CSFORMAPP�NGAPPL�CAT�ONS
Figure 13.PortionofashadedreliefimageshowingrecentlyglaciatedterrainnearSpiritLakeinDickinsonCounty,�owa.Theshadedreliefwascreatedfroma30meterresolutionDEMfromtheNationalElevationDataset(NED).
Figure 14.Portionofalidar-derivedshadedreliefimageofthesameareaofglacialterrainnearSpiritLakeinDickinsonCounty,�owa.Noticehowtheshapesofsubtle,lowreliefglacialfeaturesarenowreadilyapparent.

74 D�G�TALMAPP�NGTECHN�QUES‘06
Figure 15.PortionofashadedreliefimageshowingtheMissouriRiver floodplain north of CouncilBluffs,�owa.Theshadedreliefimagewascreatedfroma30meterresolutionDEMfromtheNationalElevationDataset(NED).Noticethecross-shapedfeaturesthatareartifactsoftheinterpola-tionoftheoriginal10’contoursfromUSGStopo-graphicmaps.
Figure 16.Portionofalidar-derivedshadedreliefimageofthesameareaontheMissouriRiverfloodplain (see Figure 15). Notice the much finer de-tailshowingtheinterstatecloverleaf,rivermeanderscars,borrowpits,andaditchandleveesystem.LidarDEMwasobtainedfromthePottawattamieCountyG�SDepartment.

75L�DARBAS�CSFORMAPP�NGAPPL�CAT�ONS
asgeomorphicfeatures.Becauseshadedreliefimagescanrepresenttheencodingofrelativelysmallchangesinslopes,mapperswillneedtobuildupcriteriaforrecog-nitionofeverydayfeaturesusingthecluesincontrast,shading,shape,texture,pattern,andcontextcontainedintheseimages.�nthepast,geologicalmapperslearnedhowtointerpretaerialphotosbyporingoverexampleafterexampleofnaturalandman-madefeatures.Theyalsolearnedhowtointerpretgeologicalfeaturesbylookingatgeomorphicsignaturesontopographicmaps.Lidarwillrequirerelearningandreinventingbothtechniquesbymovingthegeomorphicscaledowntotherealmoftheairphoto,roughlyatresolutionsfrom1to5meters.Whilequalitativeinformationonslopeswasavailablebywayofstereoviewersandaerialphotos,therehasneverbeenasmuchquantitativeslopeinformationavailableuntilnowwiththeadventoflidardata.Withdigitalelevationdataderived from lidar, new computer assisted classification strategiesforgeomorphicfeatureinterpretationcanbede-veloped,ascannewtypesofimagerytosupportmanualinterpretations.
SUMMARY
Large-scalelidaracquisitionswillprovidemap-pingprofessionalswithanincreaseofnew,highqualityelevationdatatouseasbasemapsfortheirprojects.Totakefulladvantageofthisnewdatasource,thosewhoare
mappingneedtobeawareofhowlidardataarecollectedandwhatdatareductionprocessescommercialvendorsusetomakedeliverableproductsfortheirclients.�nmanycases,mapperswillwanttomanipulatetherawlidarreturnsintotheirownT�Ns,DEMs,andderivedproducts,butsometimestheywillonlyhaveaccesstovendor-sup-plied, finished products that have undergone unknown procedurestomakethevisualappearancemoreappeal-ing.MapperscanuseshadedreliefimagesderivedfromlidarDEMsorT�Nsforon-screendigitizing,aswellasnewderivativeproductssuchasterrainslopeandlidarintensitytoidentifygeologicfeaturesandotherfeatures.Anyoneusinglidardatawillbeinterestedintheabsoluteverticalaccuracyofelevationsandwillneedtoknowhowlandcovertypeaffectsthataccuracy.
REFERENCES
Baltsavias,E.P.,1999,Airbornelaserscanning:basicrelationsandformulas:�SPRSJournalofPhotogrammetryandRe-moteSensing,no.54,p.199-214.
Quade, D.J., Giglierano, J.D. and Bettis, III, E.A., 2004, Surfi-cialgeologicmaterialsoftheDesMoinesLobeof�owa,Phase6:DickinsonandEmmettCounties:�DNR/�GS,OFM-0402,1:100,000scale,accessedathttp://www.igsb.uiowa.edu/gsbpubs/pdf/ofm-2004-2.pdf.
Wehr,A.andLohr,U.,1999,Airbornelaserscanning–anintro-ductionandoverview:�SPRSJournalofPhotogrammetryandRemoteSensing,no.54,p.68-82.


