
(C) 2007 Nancy Pfenning
©2011 Brooks/Cole, Cengage Learning
Elementary Statistics: Looking at the Big Picture 1
Lecture 12: more Chapter 7, Secs. 2-3Continuous Random Variables;Tails of the Normal CurveoStandard/Nonstandard Normal RV ProbabilitiesoPreview Two Forms of Inferenceo68-95-99.7 Rule; Rule for Tails (90-95-98-99) oStandard Normal Tail-Probability ProblemsoNon-standard Tail-Probability Problems
1
©2011 Brooks/Cole, Cengage Learning
Elementary Statistics: Looking at the Big Picture L12.2
Looking Back: Review
o 4 Stages of Statisticsn Data Production (discussed in Lectures 1-3)n Displaying and Summarizing (Lectures 3-8)n Probability
o Finding Probabilities (discussed in Lectures 9-10)o Random Variables (introduced in Lecture 10)
n Binomial (discussed in Lecture 11)n Normal
o Sampling Distributionsn Statistical Inference
2
©2011 Brooks/Cole, Cengage Learning
Elementary Statistics: Looking at the Big Picture L12.3
Definition (Review)o z-score, or standardized value, tells how
many standard deviations below or above the mean the original value is:
o Notation for Population:n z>0 for x above meann z<0 for x below mean
o Unstandardize:
3
©2011 Brooks/Cole, Cengage Learning
Elementary Statistics: Looking at the Big Picture L12.4
Standardizing Values of Normal R.V.s
Standardizing to z lets us avoid sketching a different curve for every normal problem: we can always refer to same standard normal (z) curve:
4

(C) 2007 Nancy Pfenning
©2011 Brooks/Cole, Cengage Learning
Elementary Statistics: Looking at the Big Picture L12.6
Example: Standardized Value of Normal R.V.
o Background: Typical nightly hours slept by college students normal;
o Question: How many standard deviations below or above mean is 9 hours?
o Response: Standardize to z = _________________ (9 is _____ standard deviations above mean)
Practice: 7.49e p.331
6
©2011 Brooks/Cole, Cengage Learning
Elementary Statistics: Looking at the Big Picture L12.8
Example: Standardizing/Unstandardizing Normal R.V.o Background: Typical nightly hours slept by college students
normal; .o Questions:
n What is standardized value for sleep time 4.5 hours?n If standardized sleep time is +2.5, how many hours is it?
o Responses:n z = ___________________________________________n ________________________________________
Practice: 7.49f-g p.331
8
©2011 Brooks/Cole, Cengage Learning
Elementary Statistics: Looking at the Big Picture L12.9
Interpreting z-scores (Review)
This table classifies ranges of z-scores informally, in terms of being unusual or not.
Looking Ahead: Inference conclusions will hinge on whether or not a standardized score can be considered “unusual”.
9
©2011 Brooks/Cole, Cengage Learning
Elementary Statistics: Looking at the Big Picture L12.11
Example: Characterizing Normal Values Based on z-Scoreso Background: Typical nightly hours slept by college students
normal; . o Questions: How unusual is a sleep time of
4.5 hours (z = -1.67)? 10.75 hours (z = +2.5)?o Responses:
n Sleep time of 4.5 hours (z = -1.67):n Sleep time of 10.75 hours (z = +2.5):
__________________ n Sleep time of 10.75 hours (z = +2.5):
________________
Practice: 7.51 p.332
11
(C) 2007 Nancy Pfenning
©2011 Brooks/Cole, Cengage Learning
Elementary Statistics: Looking at the Big Picture L12.12
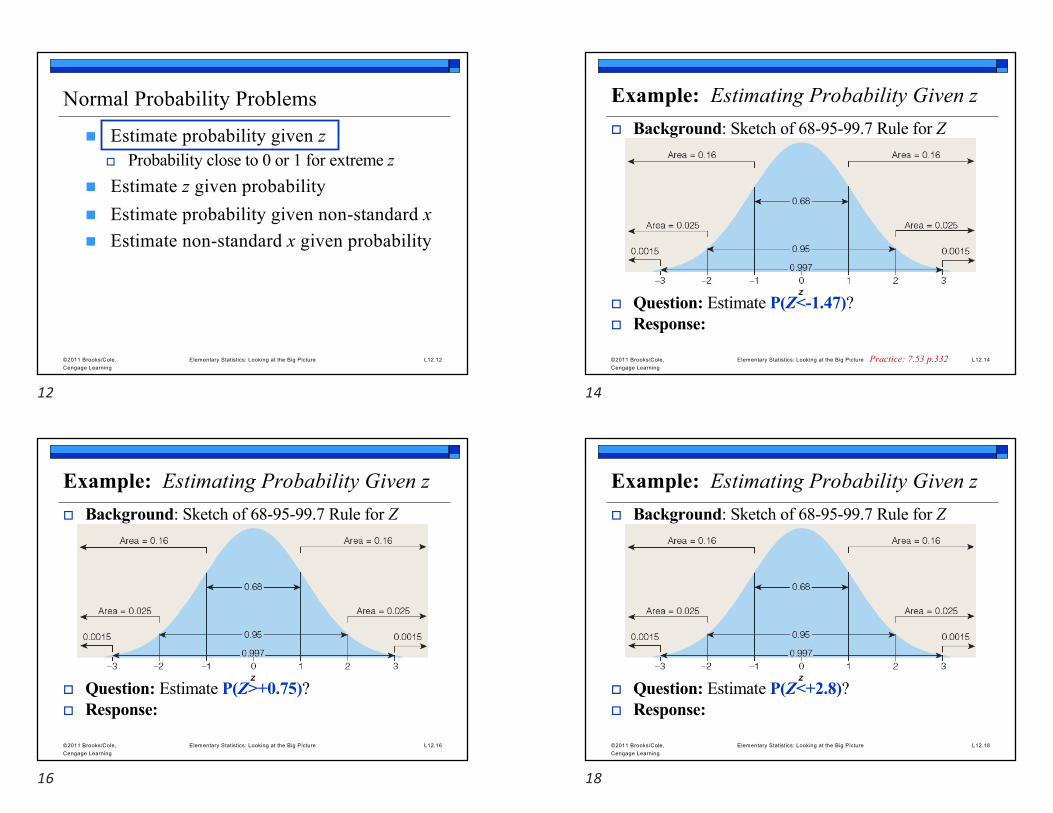
Normal Probability Problems
n Estimate probability given zo Probability close to 0 or 1 for extreme z
n Estimate z given probabilityn Estimate probability given non-standard xn Estimate non-standard x given probability
12
©2011 Brooks/Cole, Cengage Learning
Elementary Statistics: Looking at the Big Picture L12.14
Example: Estimating Probability Given zo Background: Sketch of 68-95-99.7 Rule for Z
o Question: Estimate P(Z<-1.47)?o Response:
Practice: 7.53 p.332
14
©2011 Brooks/Cole, Cengage Learning
Elementary Statistics: Looking at the Big Picture L12.16
Example: Estimating Probability Given zo Background: Sketch of 68-95-99.7 Rule for Z
o Question: Estimate P(Z>+0.75)?o Response:
16
©2011 Brooks/Cole, Cengage Learning
Elementary Statistics: Looking at the Big Picture L12.18
Example: Estimating Probability Given zo Background: Sketch of 68-95-99.7 Rule for Z
o Question: Estimate P(Z<+2.8)?o Response:
18

(C) 2007 Nancy Pfenning
©2011 Brooks/Cole, Cengage Learning
Elementary Statistics: Looking at the Big Picture L12.19
Normal Probability Problems
n Estimate probability given zo Probability close to 0 or 1 for extreme z
n Estimate z given probabilityn Estimate probability given non-standard xn Estimate non-standard x given probability
19
©2011 Brooks/Cole, Cengage Learning
Elementary Statistics: Looking at the Big Picture L12.21
Example: Probabilities for Extreme zo Background: Sketch of 68-95-99.7 Rule for Z
o Question: What are the following (approximately)?a. P(Z<-14.5) b. P(Z<+13) c. P(Z>+23.5) d. P(Z>-12.1)o Response:
a. ________ b. _______ c. ________ d. ________Practice: 7.54 p.332
21
©2011 Brooks/Cole, Cengage Learning
Elementary Statistics: Looking at the Big Picture L12.22
Normal Probability Problems
n Estimate probability given zo Probability close to 0 or 1 for extreme z
n Estimate z given probabilityn Estimate probability given non-standard xn Estimate non-standard x given probability
22
©2011 Brooks/Cole, Cengage Learning
Elementary Statistics: Looking at the Big Picture L12.24
Example: Estimating z Given Probability o Background: Sketch of 68-95-99.7 Rule for Z
o Question: Prob. is 0.01 that Z < what value?o Response:
Practice: 7.57 p.332
24

(C) 2007 Nancy Pfenning
©2011 Brooks/Cole, Cengage Learning
Elementary Statistics: Looking at the Big Picture L12.26
Example: Estimating z Given Probability o Background: Sketch of 68-95-99.7 Rule for Z
o Question: Prob. is 0.15 that Z >what value?o Response:
26
©2011 Brooks/Cole, Cengage Learning
Elementary Statistics: Looking at the Big Picture L12.27
Normal Probability Problems
n Estimate probability given zo Probability close to 0 or 1 for extreme z
n Estimate z given probabilityn Estimate probability given non-standard xn Estimate non-standard x given probability
27
©2011 Brooks/Cole, Cengage Learning
Elementary Statistics: Looking at the Big Picture L12.29
Example: Estimating Probability Given xo Background: Hrs. slept X normal; .
o Question: Estimate P(X>9)?o Response:
Practice: 7.59 p.333
29
©2011 Brooks/Cole, Cengage Learning
Elementary Statistics: Looking at the Big Picture L12.31
Example: Estimating Probability Given xo Background: Hrs. slept X normal; .
o Question: Estimate P(6<X<8)?o Response:
A Closer Look: -0.67 and +0.67 are the quartiles of the z curve.
31

(C) 2007 Nancy Pfenning
©2011 Brooks/Cole, Cengage Learning
Elementary Statistics: Looking at the Big Picture L12.32
Normal Probability Problems
n Estimate probability given zo Probability close to 0 or 1 for extreme z
n Estimate z given probabilityn Estimate probability given non-standard xn Estimate non-standard x given probability
32
©2011 Brooks/Cole, Cengage Learning
Elementary Statistics: Looking at the Big Picture L12.34
Example: Estimating x Given Probabilityo Background: Hrs. slept X normal; .
o Question: 0.04 is P(X < ? )o Response:
Practice: 7.61 p.333
34
©2011 Brooks/Cole, Cengage Learning
Elementary Statistics: Looking at the Big Picture L12.36
Example: Estimating x Given Probabilityo Background: Hrs. slept X normal; .
o Question: 0.20 is P(X > ?)o Response:
36
©2011 Brooks/Cole, Cengage Learning
Elementary Statistics: Looking at the Big Picture L12.37
Strategies for Normal Probability Problems
n Estimate probability given non-standard xo Standardize to zo Estimate probability using Rule
n Estimate non-standard x given probabilityo Estimate zo Unstandardize to x
37

(C) 2007 Nancy Pfenning
©2011 Brooks/Cole, Cengage Learning
Elementary Statistics: Looking at the Big Picture L12.38
Tails of Normal Curve in Inference
n Goal: Perform inference in 2 forms about unknown population proportion or mean:o Produce interval that has high probability
(such as 90%, 95%, or 99%) of containing unknown population parameter
o Test if proposed value of population proportion or mean is implausible (low probability---1% or 5%---of sample data)
n Strategy: Focus on tails of normal curve, in the vicinity of Z=+2 or Z=-2.
38
©2011 Brooks/Cole, Cengage Learning
Elementary Statistics: Looking at the Big Picture L12.39
68-95-99.7 Rule for Z (Review)
For standard normal Z, the probability iso 68% that Z takes a value in interval (-1, +1)o 95% that Z takes a value in interval (-2, +2)o 99.7% that Z takes a value in interval (-3, +3)Need to fine-tune information for probability at or near
95%.
39
©2011 Brooks/Cole, Cengage Learning
Elementary Statistics: Looking at the Big Picture L12.40
90-95-98-99 Rule for Standard Normal Z
For standard normal Z, the probability iso 0.90 that Z takes a value in interval (-1.645, +1.645)o 0.95 that Z takes a value in interval (-1.960, +1.960)o 0.98 that Z takes a value in interval (-2.326, +2.326)o 0.99 that Z takes a value in interval (-2.576, +2.576)
Looking Back: The 68-95-99.7 Rule rounded 0.9544 for 2 s.d.s to 0.95. For exactly 95%, need 1.96 s.d.s.
40
©2011 Brooks/Cole, Cengage Learning
Elementary Statistics: Looking at the Big Picture L12.41
90-95-98-99 Rule: “Inside” ProbabilitiesLooking Ahead: This will be useful for “confidence intervals”.
z
41
(C) 2007 Nancy Pfenning
©2011 Brooks/Cole, Cengage Learning
Elementary Statistics: Looking at the Big Picture L12.42
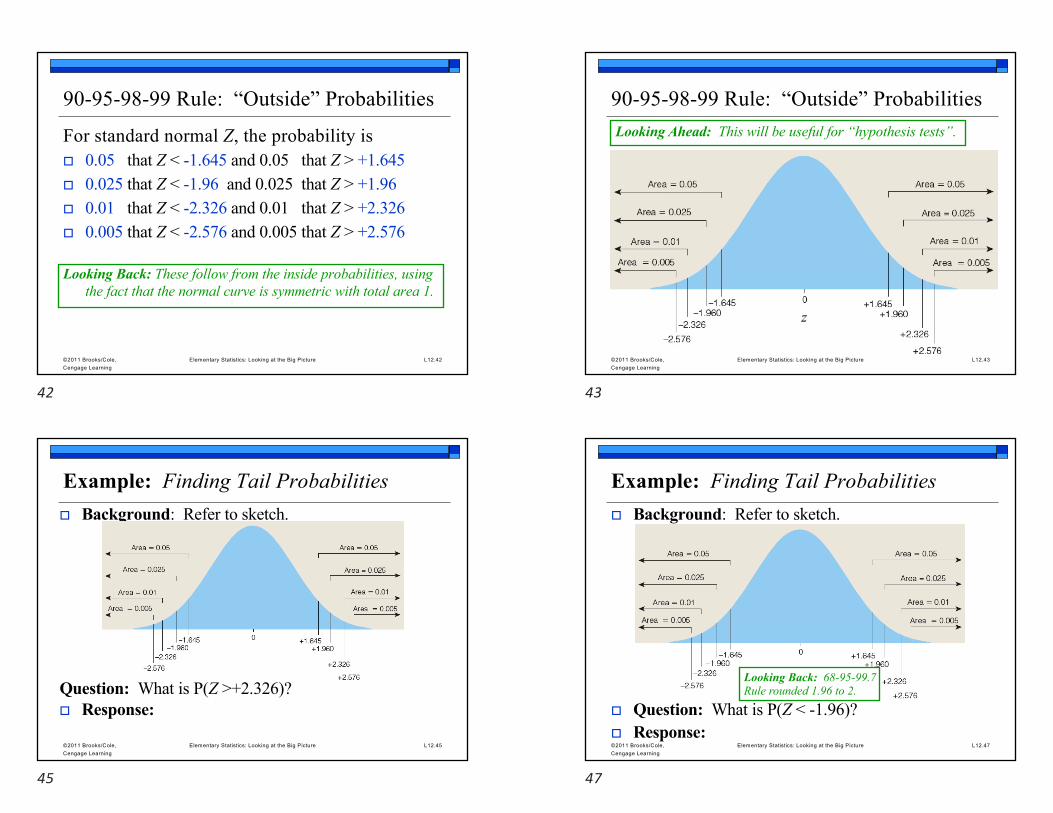
90-95-98-99 Rule: “Outside” Probabilities
For standard normal Z, the probability iso 0.05 that Z < -1.645 and 0.05 that Z > +1.645o 0.025 that Z < -1.96 and 0.025 that Z > +1.96o 0.01 that Z < -2.326 and 0.01 that Z > +2.326o 0.005 that Z < -2.576 and 0.005 that Z > +2.576
Looking Back: These follow from the inside probabilities, using the fact that the normal curve is symmetric with total area 1.
42
©2011 Brooks/Cole, Cengage Learning
Elementary Statistics: Looking at the Big Picture L12.43
90-95-98-99 Rule: “Outside” ProbabilitiesLooking Ahead: This will be useful for “hypothesis tests”.
z
43
©2011 Brooks/Cole, Cengage Learning
Elementary Statistics: Looking at the Big Picture L12.45
Example: Finding Tail Probabilities o Background: Refer to sketch.
Question: What is P(Z >+2.326)? o Response:
45
©2011 Brooks/Cole, Cengage Learning
Elementary Statistics: Looking at the Big Picture L12.47
Example: Finding Tail Probabilities o Background: Refer to sketch.
o Question: What is P(Z < -1.96)? o Response:
Looking Back: 68-95-99.7 Rule rounded 1.96 to 2.
47

(C) 2007 Nancy Pfenning
©2011 Brooks/Cole, Cengage Learning
Elementary Statistics: Looking at the Big Picture L12.49
Example: Finding Tail Probabilities o Background: Refer to sketch.
o Question: What is P(|Z| > 1.96)? o Response:
Looking Back: We apply the “Or” Rule.
49
©2011 Brooks/Cole, Cengage Learning
Elementary Statistics: Looking at the Big Picture L12.51
Example: Given Probability, Find z o Background: Refer to sketch.
o Question: 0.05=P(Z < ? ) o Response:
51
©2011 Brooks/Cole, Cengage Learning
Elementary Statistics: Looking at the Big Picture L12.53
Example: Given Probability, Find z o Background: Refer to sketch.
o Question: 0.005=P(Z > ? ) o Response:
53
©2011 Brooks/Cole, Cengage Learning
Elementary Statistics: Looking at the Big Picture L12.54
Non-Standard Normal Problems (Review)
To find probability, given non-standard normal x, first standardize:
then find probability (area under z curve).To find non-standard x, given probability, find z
then unstandardize:
54

(C) 2007 Nancy Pfenning
©2011 Brooks/Cole, Cengage Learning
Elementary Statistics: Looking at the Big Picture L12.56
Example: Given x, Find Probabilityo Background: Women’s waist circumference X (in.) normal;
.. .
o Question: What is P(X > 43)?o Response: z = ______________, between ______ and ______
so P(X > 43) is between ______ and ______.Practice: 7.63 p.333
56
©2011 Brooks/Cole, Cengage Learning
Elementary Statistics: Looking at the Big Picture L12.58
Example: Given x, Find Probabilityo Background: Women’s waist circumference X (in.) normal;
.. .
o Question: What is P(X < 23)?o Response: z = _______________, between ______ and ______
so P(X < 23) is between _______ and ______.
58
©2011 Brooks/Cole, Cengage Learning
Elementary Statistics: Looking at the Big Picture L12.60
Example: Given x, Find Probabilityo Background: Women’s waist circumference X (in.) normal;
.. .
o Question: What is P(X > 39)?o Response: z = ____________________________________
so P(X > 39) is ______________________
60
©2011 Brooks/Cole, Cengage Learning
Elementary Statistics: Looking at the Big Picture L12.61
Non-Standard Normal Problems (Review)
To find probability, given non-standard normal x, first standardize:
then find probability (area under z curve).To find non-standard x, given probability, find z
then unstandardize:
61

(C) 2007 Nancy Pfenning
©2011 Brooks/Cole, Cengage Learning
Elementary Statistics: Looking at the Big Picture L12.63
Example: Given Probability, Find xo Background: Math SAT score X for population of college
students normal; .
o Question: 0.98 is probability of X in what interval?o Response: Prob. 0.98 has z from _______ to ________ so
x is from __________________ to ___________________Practice: 7.69 p.334
63
©2011 Brooks/Cole, Cengage Learning
Elementary Statistics: Looking at the Big Picture L12.65
Example: Given Probability, Find xo Background: Math SAT score X for population of college
students normal; .
o Question: Bottom 5% are below what score?o Response: Bottom 0.05 has z = ________
so x =_________________
65
©2011 Brooks/Cole, Cengage Learning
Elementary Statistics: Looking at the Big Picture L12.67
Example: Given Probability, Find xo Background: Math SAT score X for population of college
students normal; .
o Question: Top half a percent were above what score?o Response: Top 0.005 has z = _________
so x = ____________________________
67
©2011 Brooks/Cole, Cengage Learning
Elementary Statistics: Looking at the Big Picture L12.69
Example: Comparing to a Given Probabilityo Background: Math SAT score X for population of college
students normal; .
o Question: Is P(X<480) more or less than 0.01?o Response: 480 has z = __________________
Since -1.81 is ____________________, prob. is _____________
69

(C) 2007 Nancy Pfenning
©2011 Brooks/Cole, Cengage Learning
Elementary Statistics: Looking at the Big Picture L12.71
Example: More Comparisons to Given Probability
o Background: 0.01= P(Z<-2.326) = P(Z>+2.326)o Question: Are the following >0.01 or <0.01?
n P(Z>+2.4); P(Z>+1.9); P(Z<-3.7); P(Z<-0.4)o Response:
n P(Z>+2.4) n P(Z>+1.9) n P(Z<-3.7)n P(Z<-0.4)
Looking Ahead: When we perform inference in Part 4, some key decisions will be based on how a normal probability compares to a set value like 0.01 or 0.05.
___0.01, since +2.4 is _____extreme than +2.326__0.01, since +1.9 is _____ extreme than +2.326__0.01, since -3.7 is ______ extreme than -2.326__0.01, since -0.4 is ______ extreme than -2.326
A Closer Look: As z gets more extreme, the tail probability gets __________.
Practice: 7.67 p.334
71
©2011 Brooks/Cole, Cengage Learning
Elementary Statistics: Looking at the Big Picture L12.73
Example: Practice with 90-95-98-99 Ruleo Background: Male chest sizes X (in inches) normal;
o Question: P(X > 45) is in what range?o Response: 45 has z = _____________
so P(X > 45) is between ______ and _______.
73
©2011 Brooks/Cole, Cengage Learning
Elementary Statistics: Looking at the Big Picture L12.75
Example: More Practice with 90-95-98-99 Ruleo Background: Female chest sizes X (in inches) normal;
o Question: P(X < 28.8) is in what range?o Response: 28.8 has z = __________________
so P(X < 28.8) is between _______ and _______.
75
©2011 Brooks/Cole, Cengage Learning
Elementary Statistics: Looking at the Big Picture L12.77
Example: 90-95-98-99 Rule, Given Probabilityo Background: Male ear lengths X (in inches) normal;
s).
o Question: Top 5% are greater than what value?o Response: Top 5% are above z = _______
so x = ______________________________
77

(C) 2007 Nancy Pfenning
©2011 Brooks/Cole, Cengage Learning
Elementary Statistics: Looking at the Big Picture L12.79
Example: More Use of Rule, Given Probabilityo Background: Female ear lengths X (in inches) normal;
(inches).
o Question: Bottom 2.5% are less than what value?o Response: Bottom 2.5% are below z = _______
so x = __________________________________
79
©2011 Brooks/Cole, Cengage Learning
Elementary Statistics: Looking at the Big Picture L12.81
Example: Sketching Curve with 90-95-98-99 Rule
o Background: IQs X are normal; .
o Question: What does the Rule tell us about the IQ curve?o Response: ___ ___ ___ ___ ___ ___ ___ _______
81
©2011 Brooks/Cole, Cengage Learning
Elementary Statistics: Looking at the Big Picture L12.82
Lecture Summary(Normal Random Variables)o Standardizing/unstandardizingo Probability problems
n Find probability given zn Find z given probabilityn Find probability given xn Find x given probability
82
©2011 Brooks/Cole, Cengage Learning
Elementary Statistics: Looking at the Big Picture L12.83
Lecture Summary(Tails of Normal Curve)
o Two forms of inferencen Interval estimaten Test if value is plausible
o 68-95-99.7 Rule and Rule for tails of normal curveo Reviewing normal probability problems
n Given x, find probabilityn Given probability, find x
o Focusing on tails of normal curven Standard normal problemsn Non-standard normal problems
83


