Download - KPIs and Financial Report – FY 2019

Two months ending November 30, 2020 – Unaudited
KPIs and Financial Report – FY 2021
2
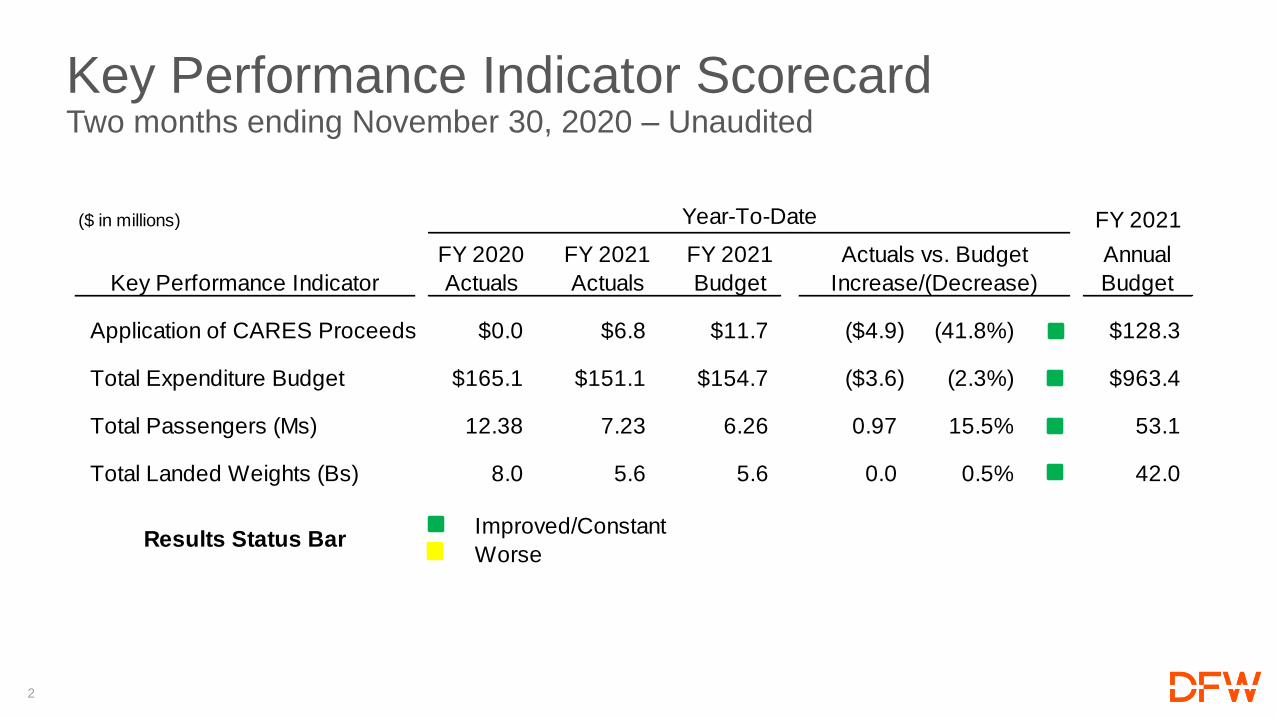
Key Performance Indicator ScorecardTwo months ending November 30, 2020 – Unaudited
($ in millions) Year-To-Date FY 2021
Key Performance Indicator
FY 2020
Actuals
FY 2021
Actuals
FY 2021
Budget
Annual
Budget
Application of CARES Proceeds $0.0 $6.8 $11.7 ($4.9) (41.8%) $128.3
Total Expenditure Budget $165.1 $151.1 $154.7 ($3.6) (2.3%) $963.4
Total Passengers (Ms) 12.38 7.23 6.26 0.97 15.5% 53.1
Total Landed Weights (Bs) 8.0 5.6 5.6 0.0 0.5% 42.0
Improved/Constant
Worse
Actuals vs. Budget
Increase/(Decrease)
Results Status Bar

3
Application of CARES ProceedsTwo months ending November 30, 2020 – Unaudited
Year-to-Date ($ in millions)
November November
Actuals Budget
DFWCC Revenues* $40.1 $38.8 $1.3 3.2%
Airfield & Terminal Revenues* 88.2 90.0 (1.9) (2.1%)
Total Revenues 128.3 128.9 (0.7) (0.5%)
Total Expenditures 151.1 154.7 3.6 2.3%
Passenger Facility Charges 14.7 12.8 1.9 14.5%
Net Variance $4.9
* Excludes CARES revenues
Actuals vs. Budget
Favorable/(Unfavor)

4
DFW Cost CenterTwo months ending November 30, 2020 – Unaudited
Year-To-Date FY 2021
FY 2020
Actuals
FY2021
Actuals
FY 2021
Budget
Annual
Budget
Revenues
Parking $30.4 $12.6 $11.3 $1.4 12.1% $107.6
Concessions 15.9 8.7 9.0 (0.3) (3.2%) 69.8
Rental Car 6.1 3.9 3.5 0.4 11.3% 25.1
Commercial Development 9.1 9.6 9.5 0.1 1.0% 57.4
Other Revenues 7.7 5.2 5.6 (0.3) (5.7%) 34.5
Total Revenues before CARES 69.3 40.1 38.8 1.3 3.2% 294.4
DFW CC Expenditures
Operating Expenditures 23.1 16.5 16.9 (0.4) (2.1%) 119.6
Debt Service, net of PFCs & CFCs 9.8 10.3 11.0 (0.7) (6.3%) 55.3
Total Expenditures 32.9 26.9 27.9 (1.0) (3.8%) 175.0
Gross Margin - DFW Cost Center 36.4 13.2 10.9 2.3 21.1% 119.4
Less Transfers and Skylink
DFW Terminal Contribution 0.5 0.5 0.5 0.0 0.0% 2.8
Skylink Costs 5.6 7.7 7.8 (0.1) (1.1%) 43.6
Net Revenues before CARES 30.3 5.1 2.7 2.4 89.3% 73.0
CARES Revenues 0.0 5.9 8.3 (2.4) (0.3) 91.0
Net Revenues $30.3 $11.0 $11.0 $0.0 0.0% $164.0
Actuals vs. Budget
Increase/(Decrease)

5
Airfield and Terminal Cost CentersTwo months ending November 30, 2020 – Unaudited
Year-To-Date FY 2021
FY 2020
Actuals
FY2021
Actuals
FY 2021
Budget
Annual
Budget
Revenues
Landing Fees $17.8 $12.5 $12.4 $0.1 0.5% $93.5
Other Airfield 2.2 2.0 2.1 (0.1) (4.1%) 10.7
Transfer from DFW Cost Center 14.0 11.7 11.7 0.0 0.0% 70.0
Total Airfield Revenue 34.0 26.1 26.2 (0.0) (0.1%) 174.2
Terminal Leases 55.3 55.3 55.3 0.0 0.0% 331.8
FIS Fees 4.1 1.6 1.5 0.1 5.8% 15.3
Turn Fees 4.3 1.8 3.3 (1.4) (43.9%) 24.7
Other Terminal 4.4 2.8 3.3 (0.5) (15.2%) 20.8
Total Terminal Revenues 68.1 61.6 63.4 (1.8) (2.9%) 392.7
DFW Terminal Contributions 0.5 0.5 0.5 0.0 0.0% 2.8
Total Revenues before CARES 102.6 88.2 90.0 (1.9) (2.1%) 569.7
Expenditures
Operating Expenditures 56.1 50.8 52.2 (1.4) (2.7%) 338.4
Debt Service, net of PFCs 41.1 45.8 48.7 (2.9) (6.0%) 268.7
Total Expenditures 97.2 96.5 100.9 (4.3) (4.3%) 607.0
Net Income/(Loss) before CARES 5.4 (8.4) (10.9) 2.5 (22.8%) (37.3)
CARES Revenues 0.0 0.9 3.4 (2.5) (271.4%) 37.3
Total Net Income/(Loss) $5.4 ($7.5) ($7.5) ($0.0) 0.0% ($0.0)
Actuals vs. Budget
Increase/(Decrease)

6
Operating Fund – Total ExpendituresTwo months ending November 30, 2020 – Unaudited
Year-To-Date FY 2021
FY 2020
Actuals
FY2021
Actuals
FY 2021
Budget
Annual
Budget
Operating Expenditures
Salaries and Wages $26.3 $26.5 $26.6 ($0.1) (0.4%) $166.3
Benefits 11.8 11.1 11.8 (0.7) (6.0%) 74.4
Facility Maintenance Contracts 12.5 12.2 12.2 0.1 0.5% 86.2
Other Contract Services 15.9 13.4 14.0 (0.6) (4.3%) 96.3
Utilities 4.4 4.0 3.9 0.1 1.6% 26.1
Equipment and Other Supplies 2.5 2.3 2.4 (0.2) (7.5%) 17.9
Insurance 0.9 1.3 1.3 (0.1) (4.9%) 9.9
Fuels 0.6 0.3 0.5 (0.1) (30.1%) 3.2
General, Administrative, and Other 1.0 0.6 0.7 (0.1) (8.7%) 12.6
Change in Operating Reserves 8.1 2.2 2.2 0.0 0.0% 2.2
Total Operating Expenditures 83.9 73.8 75.6 (1.8) (2.3%) 495.2
Debt Service, gross 81.1 77.3 79.1 (1.9) (2.4%) 468.2
Total Operating Fund Expenditures $165.1 $151.1 $154.7 ($3.6) (2.3%) $963.4
Actuals vs. Budget
Increase/(Decrease)
Baggage Handling System Update

2
Baggage Handling Systems (BHS): 3 Primary Functions
1. Move bags from the check-in area to the departure gate (plane side)
2. Move bags from one gate to another during transfers
3. Move bags from the plane to the baggage claim area

3
Proper working condition to reduce risk of failure
Passenger & personnel safety
Security
Efficiency
Functionality and tracking accuracy
Operational availability (w/ redundancy)
Maintainability
Ease of improvements/expansion
Effective BHS Elements

4
Current DFW BHS Overview
5 Terminals
16 Miles of Conveyor
17 Ticket Counter Banks
89 Make-Up Devices and Sort Piers
43 Explosives Detection System Units
40 Inbound Systems
75% new/renovated
during TRIP
DFW maintained
60% new/renovated
during TRIP
AA maintained
Under planning review
AA maintained
95% new/renovated
during TRIP
DFW maintained
Terminal D Terminal B
Terminal E Terminal C Terminal A
Original 2005 construction
AA maintained

5
BHS ProgramThree Major Efforts to Maintain Effectiveness
Explosives Detection Systems (EDS)
Recapitalization (Replacement)
(TSA-operated)
Future BHS Improvements Program
(DFW & Airlines-operated)
Board-Approved BHS Reimbursable Agreements
(Airlines-operated)

6
Terminal D - BHS Make-up Units Replacement
Terminal A & C - BHS Controls Replacement
Terminal-wide BHS Improvements - Design
Board-Approved Baggage Handling Systems (BHS) Reimbursable Agreements

7
Federally mandated project to replace obsolete
EDS equipment
Includes Terminals A, B, C, and D
Terminal E completed in 2017
Explosives Detection Systems (EDS) Recapitalization/ Optimization Program

8
EDS Recapitalization/ Optimization Program
Terminals A, B, C (Units Replacement Only)
• 20 EDS total
• 100% Allocable (Reimbursable) costs: $15.5M
Terminal D (Units Replacement with Minimal Conveyor Rework)
• 16 EDS total
• Allocable costs: $78.1M
• DFW Cost Share: TBD (being finalized)
Design Phase 2
9/2019 – 10/2020 11/2020 – 3/2022 1/2022 – 3/2026 3/2026 – 9/2026
Design Phase 1 Construction Closeout

9
Program Development completed October 2019
Five key focus areas
Extend useful life for minimum 10 years
Improve the functionality and tracking accuracy
Support TSA screening requirements
Support passenger growth
Improve reporting and monitoring
Affects all Terminals (A, B, C, D, E)
Future BHS Improvements Program

10
Future BHS Improvements ProgramImplementation Timeline
Establish PMO
December 2019 June 2020 April 2021 August 2021
Approve MII Funding
Execute Design Contracts
Execute Phase 1 Construction Contracts
78 individual projects identified
• Between $10K to $25M each
• Grouped into categories or procurement strategies
• 5-6 years; $100+M

11
BHS InnovationPartnership with Vendors, Federal Government, Airlines
Self-Service Bag Drop (SSBD)
• Partnership with SITA, CBP & AA
• Installed in Terminal D north ticketing hall (AA)
• First in N.A. to design & test biometric-enabled
solution
• 90-day pilot (1 month testing, 2 months live
operations)
High-Speed EDS Pilot
• Proposed partnership with TSA &
Vanderlande
• Proposed for Terminal E
• Would provide additional checked baggage
capacity
Autonomous Vehicle Pilot
• Partnership with Vanderlande & AA
• Installed in Terminal D Int’l Recheck for
two months
• First installation in N.A.
• In operation at Rotterdam since 2018
• Assist passengers with seamless
journey

12
Successful bag transport to & from airplanes
100% checked baggage security
Effective service to the community of air travelers
Enabling of quick turnaround for transferring passengers
Positive reconciliation of bags through tracking
Opportunities for innovation
Criticality of a Fully-Functioning BHS

13
Thank You

1
Julio Badin, SVP Customer Experience
January 7, 2020
Custodial Wage Optimization

2
Custodial Labor Services Optimization
• DFW partnered with its terminal custodial vendors to optimize staffing levels and increase staff retention
• Scope included improved alignment in custodian and supervisory coverage in all terminals in addition to an increase to wage rates
• Effort continues enhanced cleaning and elevated sanitization efforts due to COVID-19 and provides a safe environment to the traveling public and Airport employees

33 Source: DFW Airport Custodial Contracts, FY15-FY21
• To be competitive in the labor market,
DFW has been focused on addressing
minimum wage rates for custodial staff
• Wage rates have been commensurate
with the type of work being conducted by
the contractors and in alignment with
market trends
Competitive Wage Rate Focus
$8.45 $8.45
$9.21
$9.84
$10.50
$11.33
$13.00
$6.00
$7.00
$8.00
$9.00
$10.00
$11.00
$12.00
$13.00
$14.00
FY15 FY16 FY17 FY18 FY19 FY20 FY21
Average Custodian Hourly Minimum Wage Rate
Wage Rate

4
• Effective December 1, the minimum
hourly wage rates increased for custodial
positions on an escalated scale
• New wages will ensure quality staff hiring
and retention by the custodial
contractors
• The program also enhances DFW’s
commitment to serving the Dallas-Fort
Worth community
FY21 New Minimum Wage Rates
Custodial PositionMinimum Hourly
Wage Rate
Custodians (1st and 2nd shifts) $13.00
Custodians (3rd Shift) $13.50
Truck Drivers $13.50
Trash Haulers $13.75
Leads $14.00
Floor Technicians $15.50
Supervisors (1st and 2nd shifts) $16.50
Supervisors (3rd shift) $17.00

5
Thank You


![Audited Financial Results FY 2018-19 April 24, 2019 · Key Financial Highlights: FY 18-19 vs FY 17-18 as per Indian Accounting Standards [IndAS] Key Financial Highlights: Q4 FY 18-19](https://cdn.vdocuments.us/doc/165x107/5f1a178b938ef210d370e190/audited-financial-results-fy-2018-19-april-24-2019-key-financial-highlights-fy.jpg)


