fy 2018 consolidated results · +4.1% 3,360 fy ‘17 3,547 ‘18 +5.6% 2,010 fy ‘17 2,056 fy...
TRANSCRIPT

FY 2018Consolidated Results
Milan, April 3rd, 2019

2
HIGHLIGHTS
ANALYSIS OF RESULTS
AGENDA
ANNEXES

3
FY 2018 vs FY 2017
Highlights
CCGT AND HYDRO VOLUMES
GREEN CERTIFICATES
PHOTOVOLTAIC PLANTS
WASTE TREATMENT PRICES
ACSM-AGAM CONSOLIDATION
CCGT SPREAD AND ANCILLARY SERVICES
GAS MARGIN
PAPER REVENUES

4
Key Financial Indicators
€M
Highlights
REVENUES EBITDA OrdinaryEBITDA
GROUP NET INCOMENET FINANCIAL
POSITION
GROUP NET INCOMEOrdinary
5
HIGHLIGHTS
ANALYSIS OF RESULTS
ANNEXES
AGENDA

6
Analysis of results
Group EBITDA Overview
€M
+1% +4% +7% -1%
7
KPIs include ACSM-AGAM contribution
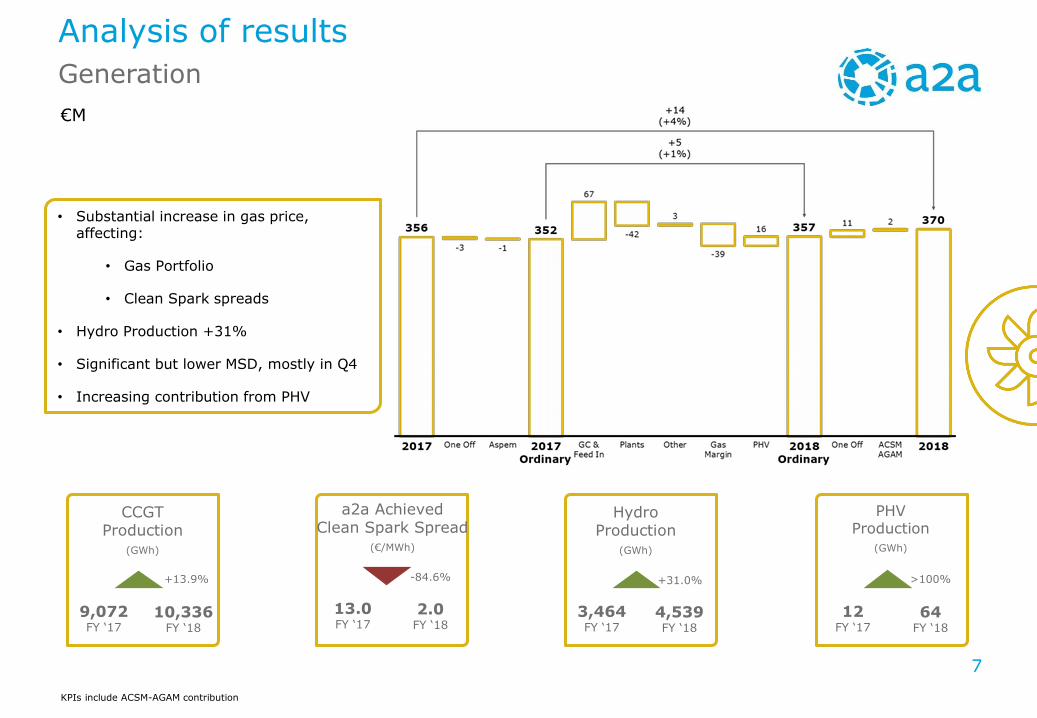
Generation
€M
Analysis of results
• Substantial increase in gas price, affecting:
• Gas Portfolio
• Clean Spark spreads
• Hydro Production +31%
• Significant but lower MSD, mostly in Q4
• Increasing contribution from PHV
CCGTProduction
(GWh)
HydroProduction
(GWh)
PHVProduction
(GWh)
9,072FY ‘17
10,336FY ‘18
+13.9%
3,464FY ‘17
4,539FY ‘18
+31.0%
12FY ‘17
64FY ‘18
>100%
a2a AchievedClean Spark Spread
(€/MWh)
13.0FY ‘17
2.0FY ‘18
-84.6%

8
Free MktCustomer(‘000 EOP)
Market
Analysis of results
Energy Retail
€M
• Higher free market customer base
• Weak winter season (higher temperature)
• Higher free market B2B volumes
• Strong advertising, marketing and sales expenses
GasSales(Mmc)
ElectricitySales(GWh)
+18.2%
1,629FY ‘17
1,925FY ‘18
878FY ‘17
1,202FY ‘18
+36.9% +30.6%
8,289FY ‘17
10,826FY ‘18
LightingPoints
(#000)
214FY ‘17
259FY ‘18
+21.0%
KPIs include ACSM-AGAM contribution

9
Waste
€M€M
Analysis of results
WasteCollection
(Kton)
Waste Treatment
(Kton)
• Collection: lower paper prices and higher disposal costs
• Increasing treatment prices
• Higher volumes (and prices) in the industrial segment
Equivalent EE Sales(GWh)
1,605FY ‘17
1,671FY ‘18
+4.1%
3,360FY ‘17
3,547FY ‘18
+5.6%
2,010FY ‘17
2,056FY ‘18
+2.3%
KPIs include ACSM-AGAM contribution

10
Networks and DH
€M
Analysis of results
* Provisional data, underlying the estimate of allowed revenues of the period
• GAS networks: above average quality premium in 2017
• District Heating: higher volumes and prices, partially offset by negative scenario (CO2)
• Weak winter season (higher temperature)
• IWC: Higher tariffs
RAB* GAS(M€)
Heat Volumes(GWht)
RAB* EE(M€)
1,171FY ‘17
1,395FY ‘18
+19.1%
2,682FY ‘17
2,768FY ‘18
+3.2%
649FY ‘17
646FY ‘18
-0.5%
69FY ‘17
72FY ‘18
+4.3%
KPIs include ACSM-AGAM contribution
DistributedWater
(Mmc)
11
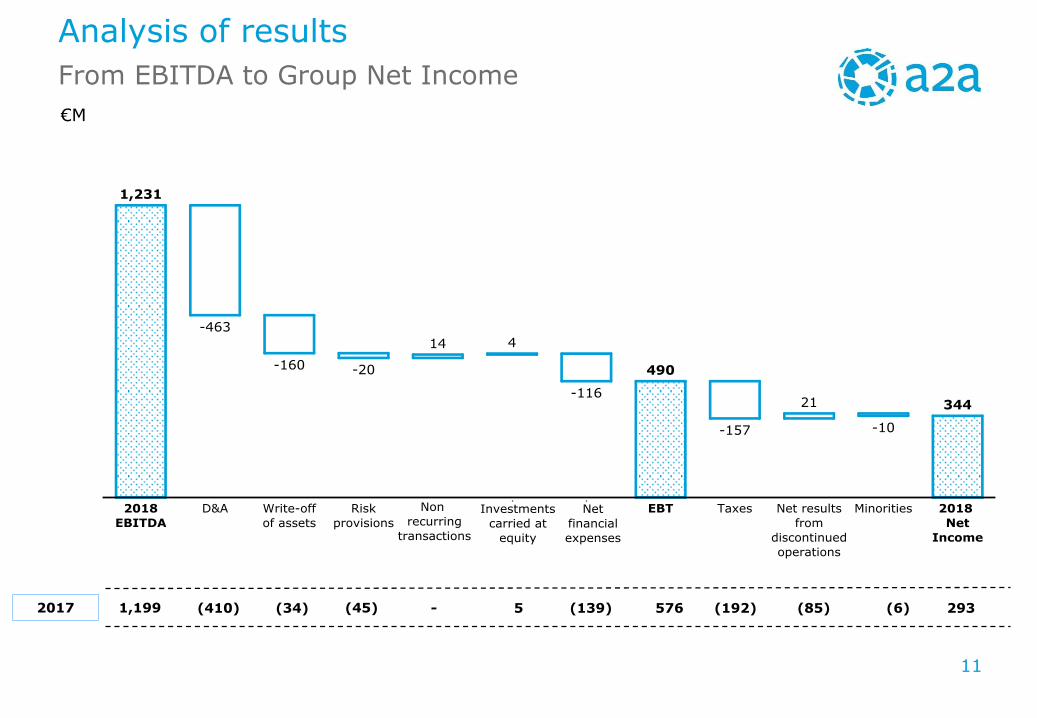
From EBITDA to Group Net Income
Analysis of results
€M
2017 1,199 (410) 576 (85) (6) 2935 (139)(34) (192)-(45)
of

12
Capex
Analysis of results
BREAKDOWN BY ACTIVITY BREAKDOWN BY BUSINESS
€M
+50M€2017
450M€2018
500M€
Change in perimeterACSM AGAM
+21€M
Generation
Market
Waste
Networks & District HeatingSmart City
Corporate

13
Net Free Cash Flow
Analysis of results
(1) Funds from operations after working capital change
€M
-
1,199 109 829 (450) (316) (90)2017 (28) (115)(192)(144) 226(153)
14
ANNEXES
AGENDA
ANALYSIS OF RESULTS
HIGHLIGHTS

15
Reported Ordinary Reported Ordinary
a2a 1199 1127 1231 1160 +32 +3% +33 +3%
Generation 356 352 370 357 +14 +4% +5 +1%Power Generation 309 307 342 335 +33 +11% +28 +9%
Gas Margin 45 44 8 4 -37 -82% -40 -91%
Photovoltaic 1 1 18 18 +17 >100% +17 >100%
ACSM AGAM 1 0 2 0 +1 +100% +0 n.s.
Market 216 164 206 169 -10 -5% +5 +3%Energy Retail 158 137 155 141 -3 -2% +4 +3%
Public Lighting 13 13 13 13 +0 +0% +0 +0%
Energy Solutions 44 14 31 15 -13 -30% +1 +7%
ACSM AGAM 1 0 7 0 +6 >100% +0 n.s.
Waste 261 249 268 266 +7 +3% +17 +7%Collection 72 71 51 54 -21 -29% -17 -24%
Urban Treatment 176 167 197 195 +21 +12% +28 +17%
Industrial Treatment 9 9 17 17 +8 +89% +8 +89%
International Project 2 2 0 0 -2 n.s. -2 n.s.
ACSM AGAM 2 0 3 0 +1 +50% +0 n.s.
Networks 391 383 410 381 +19 +5% -2 -1%Electricity Networks 130 130 126 128 -4 -3% -2 -2%
Gas Networks 140 137 131 128 -9 -6% -9 -7%
Water Cycle 39 40 44 44 +5 +13% +4 +10%
District Heating 78 76 83 81 +5 +6% +5 +7%
ACSM AGAM 4 0 26 0 +22 >100% +0 n.s.
Smartcity 7 7 11 11 +4 57% +4 57%
Other -32 -28 -34 -24 -2 6% +4 -14%
Reported Ordinary
2017 2018 Change
Business Units EBITDA Breakdown
Annexes
€M
*
*
*
*
* ACSM AGAM’s 2017 values refer to spin off (Aspem and mini idro)

16
P&L
Annexes
€M2017 FY 2018 FY
Delta vs
2017
Delta %
vs 2017
EBITDA 1,199 1,231 32 2.7%
D&A (410) (463) (53) 12.9%
Impairment write-off (34) (160) (126) n.s.
Provisions (45) (20) 25 -55.6%
EBIT 710 588 (122) -17.2%
Net Financial
Expenses(139) (116) 23 -16.5%
Associates & JV 5 4 (1) -20.0%
Result from non
recurr. Transactions0 14 14 n.s.
EBT 576 490 (86) -14.9%
Taxes (192) (157) 35 -18.2%
Net Result from
disc. operations(85) 21 106 n.s.
Minorities (6) (10) (4) 66.7%
Group Net Income 293 344 51 17.4%
Ordinary Group
Net Income413 438 25 6.1%
17
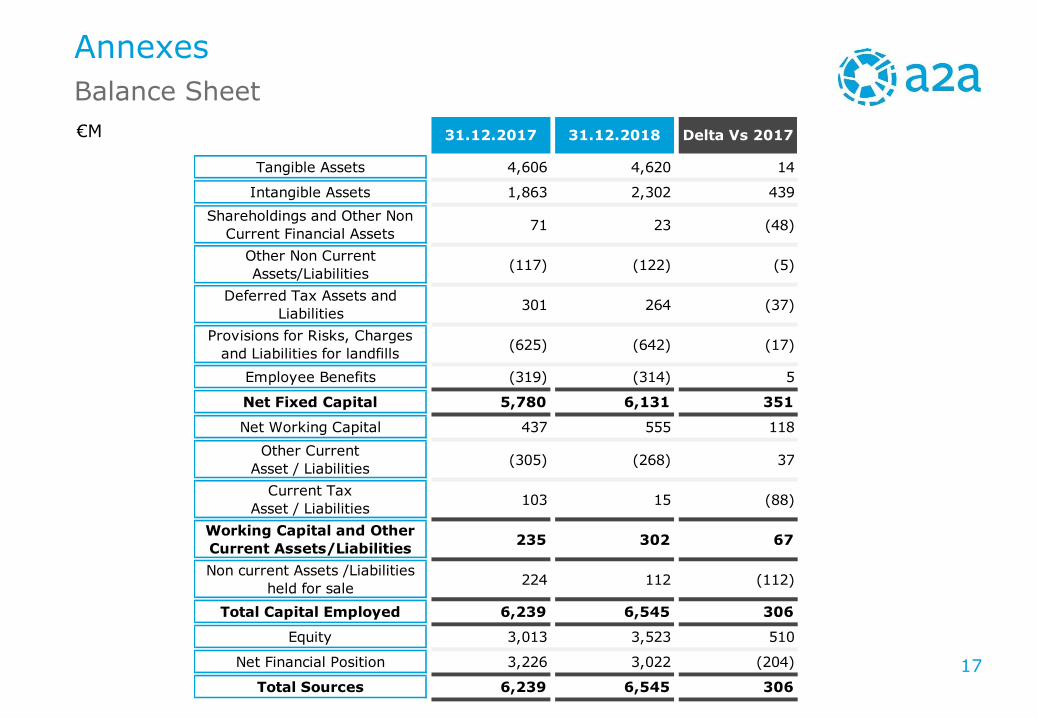
Balance Sheet
Annexes
€M 31.12.2017 31.12.2018 Delta Vs 2017
Tangible Assets 4,606 4,620 14
Intangible Assets 1,863 2,302 439
Shareholdings and Other Non
Current Financial Assets71 23 (48)
Other Non Current
Assets/Liabilities(117) (122) (5)
Deferred Tax Assets and
Liabilities301 264 (37)
Provisions for Risks, Charges
and Liabilities for landfills(625) (642) (17)
Employee Benefits (319) (314) 5
Net Fixed Capital 5,780 6,131 351
Net Working Capital 437 555 118
Other Current
Asset / Liabilities(305) (268) 37
Current Tax
Asset / Liabilities103 15 (88)
Working Capital and Other
Current Assets/Liabilities235 302 67
Non current Assets /Liabilities
held for sale224 112 (112)
Total Capital Employed 6,239 6,545 306
Equity 3,013 3,523 510
Net Financial Position 3,226 3,022 (204)
Total Sources 6,239 6,545 306

18
Energy Scenario
Annexes
(1) Gas at virtual trading point
(2) Pfor 162/14 Oct 2014-Mar 2016.
(3) hourly average for each month
(4) based on gas at virtual trading point with 51% efficiency; includes transport costs
(5) 35% efficiency - includes cost spread on API2 and transport cost
(6) data subject to update by Terna
Average data 2017 FY 2018 FYD % vs
2017
Brent $/bbl 54.8 71.6 31%
CO2 - EU ETS cost €/Tonn 5.8 15.9 n.s.
€/$ €/$ 1.1 1.2 5%
Brent € €/bbl 48.6 60.6 25%
PSV(1) €/MWh 19.6 24.2 23%
AEEGSI Gas Tariff (2) c€/mc 18.1 22.0 21%
Coal € (API2) €/Tonn 74.8 78.0 4%
PUN baseload(3) €/MWh 53.9 61.3 14%
PUN peak(3) €/MWh 61.8 68.0 10%
PUN off-peak(3) €/MWh 49.6 57.5 16%
CCGT gas cost(4) €/MWh 46.4 56.7 22%
Spark Spread CCGT_PSV vs Baseload €/MWh 7.5 4.6 -39%
Spark Spread CCGT_PSV vs Peakload €/MWh 15.3 11.3 -26%
Spark Spread CCGT_PSV vs Off-Peak €/MWh 3.2 0.9 -73%
Clean Spark Spread vs Baseload €/MWh 5.3 -1.4 n.s.
Clean Spark Spread vs Peakload €/MWh 13.1 5.3 -60%
Clean Dark Spread vs Baseload(5) €/MWh 10.6 6.9 -35%
19
(1)
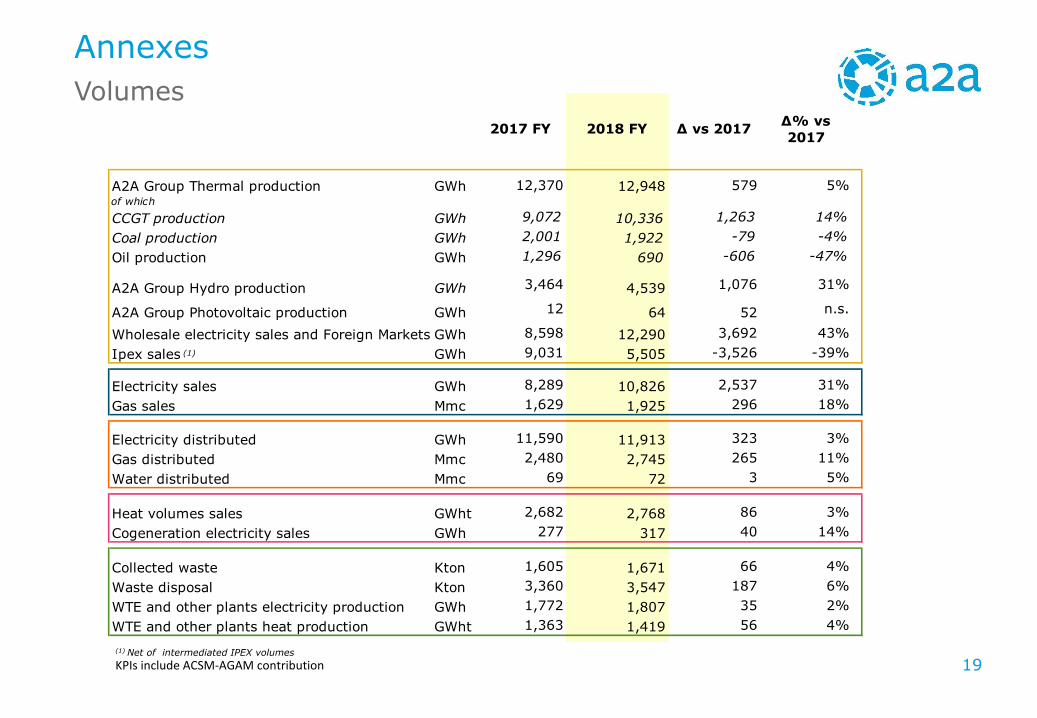
(1) Net of intermediated IPEX volumes
Volumes
Annexes
KPIs include ACSM-AGAM contribution
2017 FY 2018 FY Δ vs 2017Δ% vs
2017
A2A Group Thermal production GWh 12,370 12,948 579 5%of which
CCGT production GWh 9,072 10,336 1,263 14%
Coal production GWh 2,001 1,922 -79 -4%
Oil production GWh 1,296 690 -606 -47%
A2A Group Hydro production GWh 3,464 4,539 1,076 31%
A2A Group Photovoltaic production GWh 12 64 52 n.s.
Wholesale electricity sales and Foreign Markets GWh 8,598 12,290 3,692 43%
Ipex sales GWh 9,031 5,505 -3,526 -39%
Electricity sales GWh 8,289 10,826 2,537 31%
Gas sales Mmc 1,629 1,925 296 18%
Electricity distributed GWh 11,590 11,913 323 3%
Gas distributed Mmc 2,480 2,745 265 11%
Water distributed Mmc 69 72 3 5%
Heat volumes sales GWht 2,682 2,768 86 3%
Cogeneration electricity sales GWh 277 317 40 14%
Collected waste Kton 1,605 1,671 66 4%
Waste disposal Kton 3,360 3,547 187 6%
WTE and other plants electricity production GWh 1,772 1,807 35 2%
WTE and other plants heat production GWht 1,363 1,419 56 4%

20
Bonds
Loans and others
* Excluding ACSM AGAM contribution
Gross debt maturities as of 31 December 2018*
Annexes
€M

21
CONTACTS
A2A Investor Relations Team
Mail: [email protected]
Phone: +39 02 7720 3974
http://www.a2a.eu/en/investor/