
1
KALINGA JAGODA, B.SC, PH.D.
Bissett School of Business, Management 4825 Mount Royal Gate SW
Calgary, AB T3E 3R9, Canada [email protected]
CARLTON-JAMES OSAKWE, B.SC., MBA, PH.D.
Bissett School of Business, Financial Services
4825 Mount Royal Gate SW Calgary, AB T3E 3R9, Canada
NICHOLAS KONSTANTINOV, BBA
192 Ranch Estates Dr NW Calgary, AB T3G 1K6, Canada

2
Abstract
Like most physical investments, pipelines have limited lifespans; natural deterioration such as
corrosion could and often does result in unexpected explosions or leaks. Disasters and terrorism
are other examples that contribute to the high risk of their implementation. Furthermore, despite
the low incident over total pipeline supply ratio, a fraction of failure could yield devastating and
expensive consequences. As a compromise between environmental sustainability and economic
growth, a self-insurance fund has been proposed to relieve concerns and compensate spill clean-
up and remediation efforts. Ideally, this fund will generate an efficient response system that
would contain hazardous material in a timely manner to reduce costs. This paper has introduced
and demonstrated a self-insurance contribution payment scheme attributed to crude oil pipeline
operators. Our proposed model constructed a quarterly contribution payment scheme under risk-
neutral settings to develop a self-insurance fund to cover oil spill clean-up and remediation costs.
The payments are the product of company risk profiles (assessed oil spill incident arrival rates
based on historical performance) and the expected clean-up costs per hundreds of kilometres of
pipeline. Utilising crude oil pipeline spill records provided by the Pipeline and Hazardous
Materials Safety Administration, this paper has provided a practical demonstration of our model.
Keywords: Oil spills, self-insurance, pipelines, model
3
Planning for clean-up: Self-insurance model for managing risk in petroleum pipelines
Pipelines from around the world are proving to be integral in the transportation logistics
of oil products and natural gas. They require low operation costs and produce miniscule pollution
relative to alternative methods such as tankers, trains, or trucks. This strengthens the competitive
advantage amongst operators through cost-effective means in a commodity-based industry. They
are seen as ‘safe’ havens by many insurance specialists (Meckbach, 2013), and the right direction
for countries proactively reducing their carbon footprint (Bjørnmose, Hansen, Roca, & Turgot,
2009). In addition, pipelines dominate in transport efficiency as their consistent capacities satisfy
petroleum production output and demand.
In contrast, this system is also highly capital intensive, inflexible, and unsuitable for all
regions. The high initial costs and slow return on investment necessitates long-term goal
projections, which is unattractive for operators wishing to cross politically unstable zones. This
is a problem for oil-rich regions such as Eastern Europe and the former Soviet-states, where the
threat of terrorism is often put into consideration before such initiatives (Behzadian, Belaud,
Kennedy, Pirdashti, & Tavana, 2012). Most importantly, like most physical investments,
pipelines have limited lifespans; natural deterioration such as corrosion could and often does
result in unexpected explosions or leaks. Avalanches, storms, floods and other disasters are
anticipated and response plans must be structured accordingly (Kurtz, 2010). Despite the low
incident over total pipeline supply ratio, a fraction of failure could yield devastating
consequences.
Many recent attempts to develop the transport infrastructure necessary for expansion in
Canada have been met with severe opposition. TransCanada's Keystone XL extension and

4
Enbridge's Northern Gateway pipeline have encountered strong resistance and political
difficulties, from environmental activists, First Nations' representatives, and farmer and landlord
associations. The former faces the indecisiveness of the American President and much of the
backlash that is against the pipeline's pathway through Nebraskan water reserves (Kashi, 2013;
Wieners, 2013).
The Northern Gateway is in a similar situation, and is fuelled with Enbridge's continued
remediation struggles of its Line 6B Kalamazoo River oil spill in Michigan from July, 2010
(Forest Ethics, n.d.). The proposed pipeline, offering transportation from Bruderheim, Alberta, to
a marine terminal in Kitimat, British Columbia (Enbridge Inc., 2013), is planned to cut through
sensitive mountainous terrain, various water flows, and First Nations territory (Forest Ethics,
n.d.). Despite the relative low risk of pipelines compared with alternative transportation methods
such as trains and trucks, the plan has become a growing dilemma between economic growth and
environmental protection (Meckbach, 2013).
As a compromise, the Northern Gateway joint review panel imposed that the company
must “provide a total coverage of $950 million for the costs of liabilities for, without limitation,
clean-up, remediation and other damages emanating from project operations”. The conditions
also require Enbridge to maintain a core financial coverage of $600 million through means such
as third-party liability insurance.
However, Enbridge is not alone. New regulations will adjure operators of major crude oil
pipelines to supply similar financial capabilities to support the costs of incidents (Meckbach,
2013). As $950 million has historically proved to be more than necessary to cover the average
substantial costs of remediation efforts (Meckbach, 2013), the development of an industry-wide
5
self-insurance program to spread the costs among all operators has been suggested (Cryderman,
2013). Through quarterly contributions to this 'superfund', operators will have the means to cover
costs without relatively capital intensive policies.
This paper will analyse the suggested self-insurance framework through a model inspired
by the deposit-insurance valuation demonstration by Duffie, Jarrow, Purnanandam, & Yang
(2003). It will begin with a literature review of selected studies and reports, a case of Canada’s
current pipeline dilemma, and an overview of the adjusted model. Concluding will be an applied
analysis using the model and raw data extracted from Canadian and American sources, and a
discussion of the results.
Literature Review
Piri (2013) focused on ex-post regulation of incident response and how to maximise
efficiency to reduce the impact of oil spills. The paper concluded that an effective regime is one
that holds the operator liable for all incurred costs, as the operator will perform in the less-costly
matter to secure full efficiency. In this case, the incident response must be supervised by
government official to satisfy environmental safety conditions. The company must prove that it
has the capability to perform adequate incident response actions prior to being issued a license,
and it must have a government approved emergency response plan preceding operations. This
strict liability regime is effective because the operator has self-interests to prevent or reduce
environmental damages due to the high sensitivity of impact toward profit.
Unlike vessel-source oil spills, pipeline spills have no international standards regarding
incident response. Policies vary in their quantification methods for assessing damages, and are

6
not required to include regulations either for the removal of oil, temporary storage of removed
oil, disposal of recovered oil, or environmental remediation. Nonetheless, responsibility is
generally classified in three ways: the operator is fully responsible for combating the oil spill; the
operator must conduct response actions as public authorities assist in the environmental
protection; and the public authorities must fully conduct the response actions (Piri, 2013).
Interference by the public authority is sometimes necessary, such as when the damage is
too great; however, this case leads to exponential costs due to additional administrative
functions. Therefore, it would be beneficial for the operator to avoid government efforts by
optimising the company’s response actions and preventative measures under a strict liability
regime (Piri, 2013).
Some regimes include insurance funds to cover incurred costs after a capped point.
Unfortunately, as contamination may take time to fully restore, operators could decline to
perform properly in due time as the moral hazard is dependent on the insurer. However, moral
hazard could be deterred due to the unpredictable nature of costs. If moral hazard could be
controlled, and if the liability regime covered all costs, then the operator will perform response
actions at the optimal level. If the costs exceed what is provided by the insurance, the incentives
to perform adequately are limited to how far the company could stretch its assets (Piri, 2013).
As an insurance to cover clean-up and remediation costs concerning oil spills, the US
authorised the Oil Spill Liability Trust Fund (OSLTF) through the Oil Pollution Act (OPA)
signed on 1990. This fund has a maximum limit of $1 billion, and functions toward: costs
incurred during clean-up and remediation for the coast guard and Environmental Protection
Agency (EPA), government access to perform remediation efforts and natural resource damage

7
assessments, payments of uncompensated removal costs, and research and development. It is
divided into two funds: the Emergency Fund, and the Principal Fund (United States Coast Guard,
2013).
The Emergency Fund is an annually recurring $50 million used by federal response
coordinators to initiate natural resource damage assessments. In addition, the Maritime
Transportation Security Act of 2002 enables officials to advance up to $100 million from the
Principal Fund in the case of insufficient capital (United States Coast Guard, 2013).
The Principal Fund is used to pay claims, compensate the administration and enforcement
of the OPA, and support research and development. Its revenue is gained through barrel tax,
which has been and is subject to continue increasing from 2009 until 2017, from 5 cents to 9
cents per barrel. Transfers from obsolete pollution funds have totalled $550 million, and U.S.
Treasury investments provide additional income. Those responsible for oil incidents are billed
for costs and damages which, along with fines and civil penalties, make up the remainder of the
Fund’s income (United States Coast Guard, 2013).
In banking, the United States was one of the first countries to implement a nationwide
deposit insurance program. Its deposit insurance is primarily governed by the Federal Deposit
Insurance Corporation (FDIC), an independent arm of the U.S. Congress. It was established in
1933 to provide assurance to depositors that they will be minimally impacted in the case of bank
failures. This is done through implementing a risk-based assessment system, managing the assets
of failed banks, liquidating troubled institutions, and monitoring banking organisations (Jickling
& Murphy, 2010).

8
Current policies enable banks to guarantee up to $250,000 per depositor in the case of a
failure. In circumstances of high systematic risk such as a recession, the FDIC may provide
additional alterations within emergency authority under the Federal Deposit Insurance
Corporation Improvement Act of 1991. For example in 2008, the FDIC declared guarantees on
newly issued senior unsecured debt of banking and trust organisations and on non-interest
deposit transaction accounts. Regulations require bank to draw up liquidation procedures, and
have strict minimum leverage capital requirements (3% and 4% for highly-rated and other
institutions, respectively) (Jickling & Murphy, 2010).
According to Wagster (2006), the application of deposit-insurance in Canada may have
reduced systematic risk in government organisations and increased non-systematic risk in
banking and trust organisations. Historically, high-risk institutions paid higher insurance
premiums than low-risk institutions. Therefore, the proposal of deposit insurance was viewed as
a poor choice by larger banks as it forced safe institutions to subsidise the actions of riskier
institutions through the flat-rate premium. In order to solve this problem, the safe institutions
increased their risk to match those of the riskier organisations.
The deposit insurance method aided this increase as the responsibility of monitoring was
realigned toward the Canadian Deposit Insurance Corporation (CDIC). Large-block shareholders
of banks, who were previously required to monitor each of their investments, were able to
diversify their portfolios without negatively affecting the institutions' share prices as expected
returns were increased (Wagster, 2006).
As suggested in the study, deposit insurance reduced the threat of loss to depositors
perhaps through the decrease in potential bank runs. The standard deviations of market returns

9
were shown to have decreased, therefore proving that systematic risk had been reduced. This
reduction in systematic risk justified the Government to absorb the non-systematic risk costs of
banks and trust companies without any significant increase in compensation (Wagster, 2006).
Despite the decrease in systematic risk, many researchers have agreed that the deposit
insurance model should be reformed (Bodie & Merton, 1993). Bank runs occur because banks
tend to borrow with a short-term perspective, such as demand deposits, and loan in the long-
term, such as mortgages. This creates a balance sheet mismatch which breaks down when
depositors return in large groups to reclaim their funds (McCoy, 2007). Although deposit
insurance significantly reduces the risk of bank runs and stop runs, McCoy (2007) states that its
implementation could also lead to unstable bank crises through an increase in moral hazard to
take risks.
Under explicit deposit insurance banks could capture profits while governments absorb
losses, and lower the incentives for depositors and shareholders to monitor the banks. Therefore,
this model fuels risk-taking and develops a “too big to fail” mindset within the banking industry
(McCoy, 2007).
In contrast to private insurance schemes, deposit insurance schemes do not have coverage
conditions that define preventable, and thus unqualified, risks. It covers all types of failures,
which amplifies the need for risk-reducing features. This could be addressed through coverage
limits based on the types of institutions, the types of deposits, and the maximum amount of
deposits that is guaranteed by the state (McCoy, 2007).

10
Arping (2010) argues that fair pricing is optimal in transparent banking systems, as the
guarantee premia accurately reflects the banks' risk-taking initiatives. Banks under opaque
systems require excessive resources to accurately display their guarantee premia to ensure fair
pricing, therefore risk-taking is a burden.
Boyd & Chang (2002) have studied the interest elasticity of the deposits and the
perceived risk of the bank. In the general equilibrium framework, banks that are perceived as
relatively safe would see positive growth in deposits through interest adjustment. Banks on the
other end of the spectrum will not benefit in this scenario without an increase in their risk profile;
otherwise they will face costs.
Bodie & Merton (1993) maintain that the current system unintentionally encourages
misallocation of investment, redistribution of wealth and income, unnecessary risk-taking, and
maybe even fraud and abuse. Currently, commercial banks perform two functions: execute loans
and guarantees, and take deposits. The loans are made to businesses, households, and
governments, and require thorough, non-public information for risk assessment and valuation.
Therefore the loans are illiquid and strapped with excessive bid-ask spreads.
However, this is creates instability in regards to the second function: accepting deposits.
Banks take two types of deposits from customers: transactional deposits, and savings deposits.
The transactional deposits enable customers to make payments while the banks act as
intermediaries that assess the eligibility of each party to commit with the exchanges. Thus
transactional deposits should be completely default-free (Bodie & Merton, 1993).
11
In short, Bodie & Merton (1993) recommend that deposit insurance should be
collateralised with government securities (eg, U.S. Treasury Bills) or their equivalent to ensure
liquidity. If this is not possible, their second option is to include monitoring fees and risk-based
premiums to deposits backed by volatile assets.
Similarly, Martin (2006) suggests replacing the deposit insurance with liquidity provision
policies set at the central bank. He justifies this by stating that under deposit insurance banks
fully gain from their successful risk-taking, however only partially lose if their risks fail. This
creates the moral-hazard. However, if the central banks were to implement liquidity provision
policies, the banks would be unaware of the results of their investments until after they repay
their loans.
Canadian Predicament
On April 29, 2011, Plains Midstream Canada, a subsidiary of Plains All American
Pipeline, contacted the Energy Resources Conservation Board (ERCB) to report the pipeline
failure and the release of 4500m3 of sweet crude oil from its NPS 20 Rainbow Pipeline at
approximately 20 km from Little Buffalo, Alberta (Energy Resources Conservation Board,
2013).
In the previous evening at around 18:35, Plains' Supervisory Control and Data
Acquisition (SCADA) system detected abnormal behaviour along the pipeline. Alerts continued
until 03:00 the next morning, after the pipeline was shutdown ten minutes prior at 02:50. A
helicopter was dispatched at 07:30 to locate the spill, which was in a muskeg area with no active
water flow, and a Level-1 emergency response plan was initiated by Plains. Stopples were

12
installed upstream and downstream from the tainted pipeline region and efforts were made to halt
the flow (Energy Resources Conservation Board, 2013).
Once contacted, the ERCB downgraded the spill as an alert, based on its significant
distance from residential areas and flowing waterways. However, it was reinstated to a Level-1
emergency following an inspection at 19:00 due to the 8.3 hectare impact to wildlife and
standing water. Environment Canada, Occupational Health and Safety, First Nations and Inuit
Health, and other relevant organisations, including a third-party engineering review firm, were
later contacted. By May 6, over 25 officials from various groups and organisations toured or
supervised the site regularly (Energy Resources Conservation Board, 2013).
The pipeline was approved for operation by August 26, 2011. The total cleanup required
26 contracting firms and 8 equipment suppliers, and on average up to 200 personnel on-site
throughout the response. The investigation concluded that the spill was caused by a failure of
Type B repair sleeves applied in the 1980s by the previous owner, Imperial Oil, which were
notorious for causing problems. Because of previous incidents, the National Energy Board
(NEB) required thorough and regular inspections of the Type B repair sleeves as per license;
unfortunately, the NPS 20 Rainbow Pipeline was out of its jurisdiction and did not either know
or follow these instructions (Energy Resources Conservation Board, 2013).
Canadian pipeline administration is demarcated at provincial and federal jurisdictions. In
Alberta, a province where virtually all of the nation’s oil pipeline activity is located, all intra-
provincial pipelines are monitored by the Alberta Energy Regulator (AER; formerly the ERCB).
Interprovincial or international pipeline activities, including tolls and tariffs, are subject to the
National Energy Board (NEB) (Cuschieri & Deyholos, 2013). Each pipeline proposal is
13
reviewed by the appropriate regulatory body and is subject to various socioeconomic and
environmental factors, including technological and financial feasibility. The regulators are
responsible for monitoring the planning, construction, and operation phases, and for ensuring
environmental protection throughout the lifespan of each project (Enbridge Inc., 2011).
In Canada, there are over 70,000 kilometers of pipeline running through the country and
across international borders to the United States, its main trading partner. It is estimated that
these pipelines transport around $127 billion of natural gas, natural gas liquids, crude oil, and
petroleum products each year. Canada is one of the only countries within the G-8 that has
considerable reserves of oil, and consumes about three quarters of its production levels. The
country is regarded as a net exporter of the product, most of which is transferred to its southern
neighbour (National Energy Board, 2013).
Unfortunately, a recent push in the production and mining of oil in the US has caused
great concern for Canadian policy makers and business owners. In addition to the increased
volatility and downward trend of prices, Canadian oil companies have to face discounted prices
when shipping to American states than otherwise if sent internationally (McCarthy &
Vanderklippe, 2012). With demand growing at high rate in non-OECD Asian countries such as
China, it could be a big opportunity for Canada to expand relationships with those regions
(National Energy Board, 2013).
The demand for petroleum products is increasing, yet its transportation involves an
indirect cost between the opposing forces of risk and reward. On the supposition that pipelines
are indeed the safest and the most cost-efficient out of all other petroleum transportation
methods, there must be compensation to mitigate the risk. One suggestion is a self-insurance

14
fund, provided by operators of pipelines, to assure adequate capital and coverage is available for
immediate response action and complete remediation.
Modelling using the Poisson Process
Consider relatively rare events occurring randomly and sporadically over a period of time
and/or space such as represented by the figure below:
Figure I
The events are called “relatively rare” because no two events will occur at exactly the
same moment in time or space. Examples of such rare events are the number of banks that go
bankrupt in a given month, the number of births of animals in a particular zoo during a year, the
number of calls to a telephone call-center in a one hour period, or the number of pipeline spills
over a three month period. The Poisson process is probably the most widely used random process
for modeling such rare events1.
1 For this process, time is generally expressed in years.
time 0 time t time s
occu
rren
ce
occu
rren
ce
occu
rren
ce
occu
rren
ce

15
Denote N(t) as the random number of occurrences observed within the time period [0, t].
Then, the formal definition of a Poisson process is that it is a non-decreasing stochastic counting
process N with the following properties:2
1) N(0) = 0
2) The process has stationary and independent increments. That is, for any two different
times s and t, let N(t) – N(s) denote the number of claims in the time interval [s, t]. Then
N(t) – N(s) is independent of N(t) – N(0) and the probability distribution of N(t) – N(s)
depends only on the length of the interval t – s
3) The number of occurrences N(t) in any interval [0, t] has a Poisson distribution with
mean λt. That is:
������ = �� = ����exp�−����!
The number λ is called the arrival rate or intensity of the Poisson process. That is, it is the
average number arrivals or occurrences per unit time which means that for any interval of size t,
λt is the expected number of occurrences in that interval. λ is sometimes called the hazard rate as
it also represents the instantaneous probability of the occurrence of an event at any point in time
(t), given no event has occurred prior to that time. In general, λ may be constant or be varying
over time and may also depend on a variety of factors.
2 Alternatively the Poisson process can be viewed as the arrival time or delays between any two occurrences with such a time
having an exponential distribution.

16
Estimating the Poisson arrival rate
Suppose we collect sample of n measured values ki with each value measured over the
same time period. We wish to estimate the value of the parameter λ of the Poisson population
from which the sample was drawn. To calculate the maximum likelihood value, we form the log-
likelihood function, the derivative of L with respect to λ and equate it to zero and solve for λ
yields the maximum-likelihood estimate of λ:
�� = 1�����
���
Thus, �� is just a sample average estimate the true mean arrival rate λ. From the sample,
percentiles or some other measure of position can also be estimated in the usual way to provide
additional descriptive statistics of λ.
Pricing deposit insurance
Duffie et al. (2003) demonstrated the use of a simple reduced form model of deposit
insurance where the default by a bank is the first occurrence of a Poisson process with a constant
arrival rate λ. Here λ is now called the default intensity and the (risk-neutral3) probability of the
bank surviving (not defaulting) up until time t is e–λt. The default intensity of different banks will
be different depending on the riskiness of their loan portfolios, their sensitivity to the state of the
economy, and so on.
3 The model is bases on the risk-neutral pricing approach (Harrison and Kreps, 1979) which uses adjusted probabilities so that the risk-free interest rate can be used as the discount rate. Duffie et al. (2003) demonstrate how to adjust the statistical estimates of the actual probability of default to get the risk neutral estimate.

17
If a bank defaults within the period (0, t), the level of losses that the insurance scheme
will have to pay bank depositors is denoted as L and depends on the dollar amount of assessed
insurable deposits less the percentage amount of these deposits that can be recovered from the
bank (the recovery rate) due to the bank’s level of capitalization. The figure below shows how
default rates and recovery rates have been changing over time. Although they appear to be
correlated, the simple model demonstrated by Duffie et al. (2003) assumes that for any particular
bank, both are constant and that across different banks, they are uncorrelated.
For a particular bank, let its default intensity be λ and the (risk-neutral) mean loss per
dollar of insurable deposit be E*[L] at the end of one year. Then, the current fair market deposit
insurance premium per dollar of insured deposits is:
� = ��∗���
1 !
Here, r is the risk free rate of interest and E*[ ] is the expectation based on risk-neutral
probabilities.
Figure II: Default rates and recovery rates on defaulted banks

18
As an example, suppose for a particular bank, the risk neutral default intensity is 0.02
and, based on the banks capitalization, the FDIC expects to pay out 10 cents on every dollar of
insured deposits if default occurs. Then, the fair-market deposit insurance premium can be
quotes as 0.02×0.1 = 0.002 or 20 basis points per annum. Assuming a risk free rate of zero, if the
bank has 100 million dollars of insured deposits and pays its premiums quarterly, then its deposit
insurance premium would be 0.25×0.002×100,000,000 = $50,000.
Extending the deposit insurance model to pipeline spills
Because both are relatively rare occurrences, the model for deposit insurance can be
extended to determine the superfund contributions for pipeline companies. Let δ be the
annualized arrival rate of pipeline spills per 100 kilometers of pipeline, and C be the cost of
cleanup if a spill occurs. We assume that arrival rates have been estimated across the pipeline
industry and divided by quartiles or some other distributional spacing4. The cleanup cost C will
depend on several factors such as pipeline pressure, valve spacing location of the pipeline and so
on. Pipeline companies can thus be categorized according to their spill risk level and expected
cleanup costs as below:
δ1 (low
risk)
δ3 δ3 δ4 (high
risk)
Heavy cleanup costs
Moderate cleanup
costs
Mild cleanup costs Table I
4 For example the spacing could be in 0.5 standard deviation increments.
19
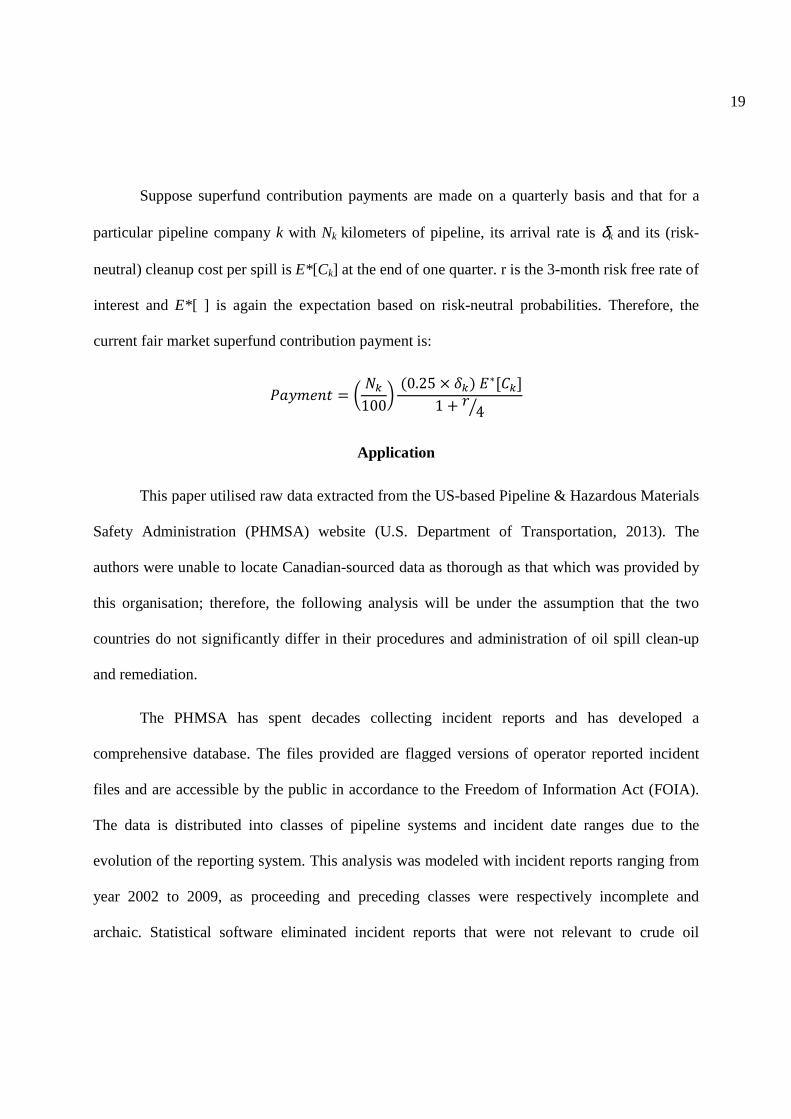
Suppose superfund contribution payments are made on a quarterly basis and that for a
particular pipeline company k with Nk kilometers of pipeline, its arrival rate is δk and its (risk-
neutral) cleanup cost per spill is E*[Ck] at the end of one quarter. r is the 3-month risk free rate of
interest and E*[ ] is again the expectation based on risk-neutral probabilities. Therefore, the
current fair market superfund contribution payment is:
�"#$%�� = & �'100)�0.25 × .'��∗[/']
1 + ! 41
Application
This paper utilised raw data extracted from the US-based Pipeline & Hazardous Materials
Safety Administration (PHMSA) website (U.S. Department of Transportation, 2013). The
authors were unable to locate Canadian-sourced data as thorough as that which was provided by
this organisation; therefore, the following analysis will be under the assumption that the two
countries do not significantly differ in their procedures and administration of oil spill clean-up
and remediation.
The PHMSA has spent decades collecting incident reports and has developed a
comprehensive database. The files provided are flagged versions of operator reported incident
files and are accessible by the public in accordance to the Freedom of Information Act (FOIA).
The data is distributed into classes of pipeline systems and incident date ranges due to the
evolution of the reporting system. This analysis was modeled with incident reports ranging from
year 2002 to 2009, as proceeding and preceding classes were respectively incomplete and
archaic. Statistical software eliminated incident reports that were not relevant to crude oil
20
pipeline spills and that had no reported clean-up or remediation costs. This narrowed the sample
size to 314 reported incidents.
The data was further split into annual quarters, each containing the sum of incidents
within their designated date range. This was a crucial first step in the Poisson distribution
analysis; it further initiated the development of the categorisation of payments per hundreds of
kilometers of pipeline and risk profile. Annual mileage of crude oil pipelines across the USA
between the years 2004 to 2009 was extracted from the PHMSA website and split and converted
into hundreds of kilometers of pipeline per year. The numbers of incidents per quarter were each
divided by their respective annual hundreds of kilometers of crude oil pipeline (years 2002 and
2003 were subject to the data from 2004); this function produced each quarter's arrival rate, δ.
Descriptive statistics of the arrival rates and the total damage costs of each reported
incident were generated. Of the former's statistics, the first quartile, median, and third quartile
were used to represent low, medium, and high risk arrival rates, respectively. Heavy, moderate,
and mild clean-up costs were also designated according to their percentiles.
Finally, to emulate a risk-neutral estimation, each product was divided by one plus the
quarter of the 3-month Canadian Treasury Bill rate. At the time of this writing the 3-month T-
Bill return was at 0.90%.
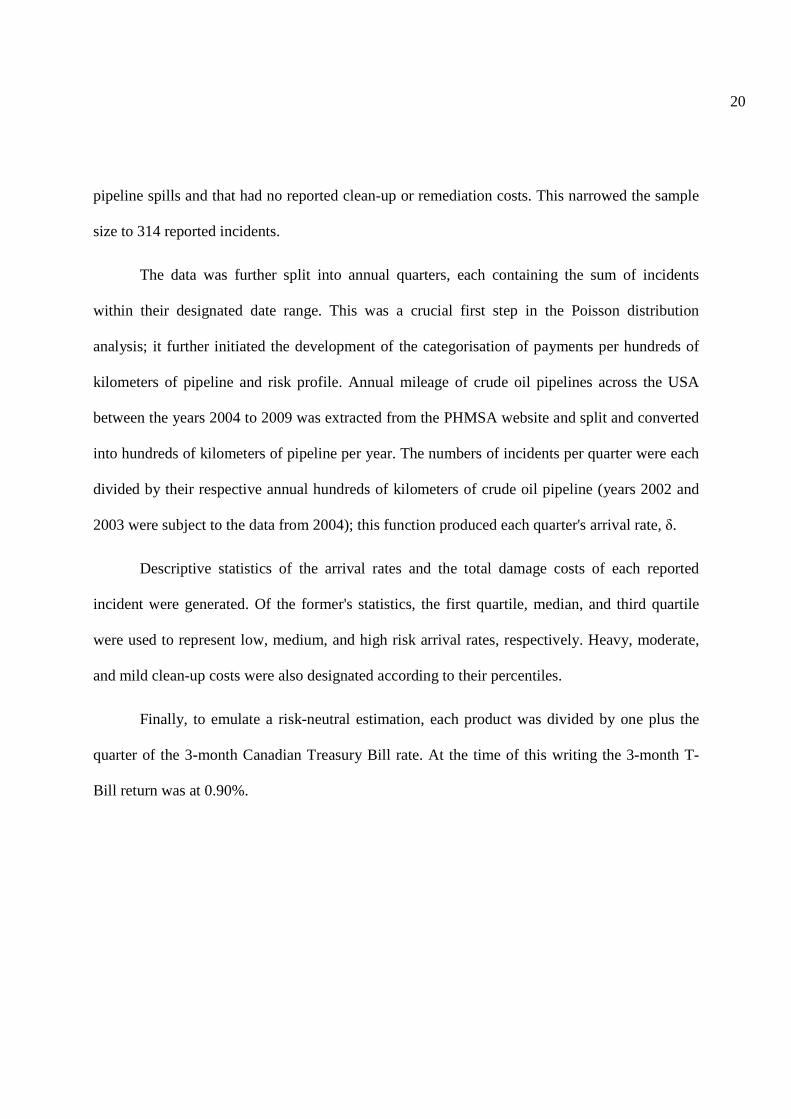
21
Estimated Quarterly Contribution Costs per Hundred Kilometers of
Pipeline
δ 1 (low risk) δ 2 δ 3 Heavy Clean-
Up Cost $12,586.56 $16,688.51 $19,008.67
Moderate
Clean-up Cost $3,240.38 $4,296.42 $4,893.74
Mild Clean-up
Cost $1,238.30 $1,641.86 $1,870.13 Table II
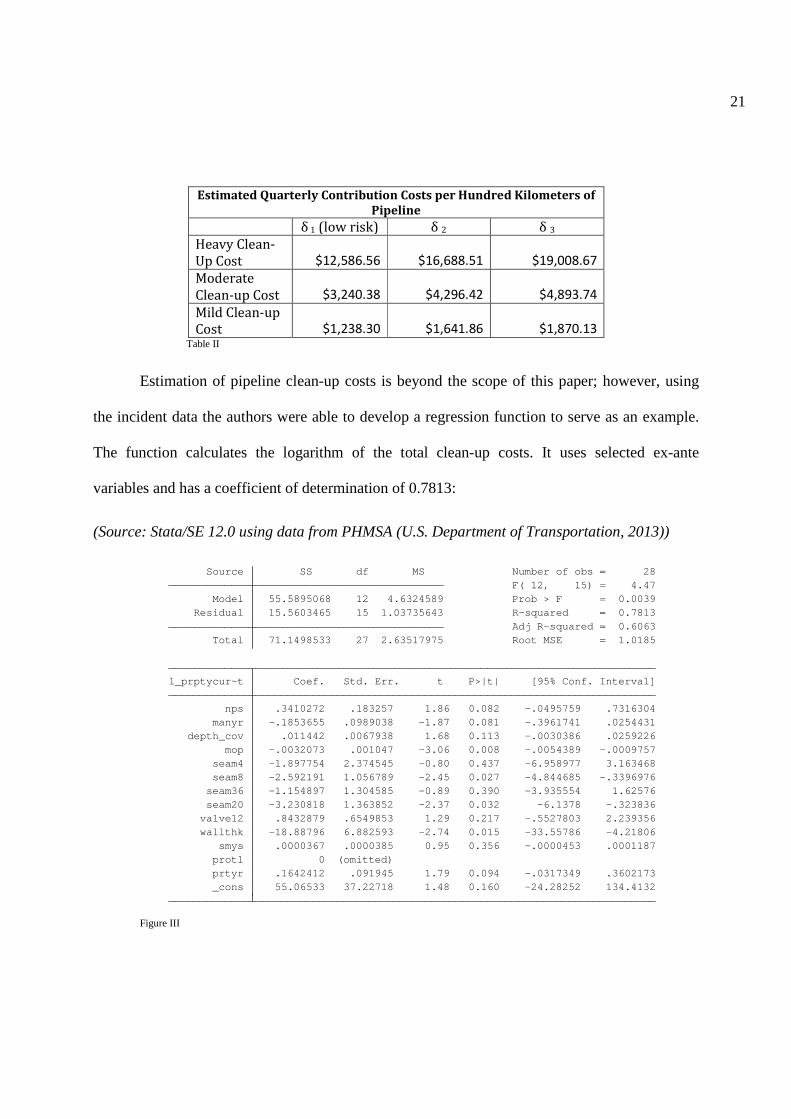
Estimation of pipeline clean-up costs is beyond the scope of this paper; however, using
the incident data the authors were able to develop a regression function to serve as an example.
The function calculates the logarithm of the total clean-up costs. It uses selected ex-ante
variables and has a coefficient of determination of 0.7813:
(Source: Stata/SE 12.0 using data from PHMSA (U.S. Department of Transportation, 2013))
Figure III
_cons 55.06533 37.22718 1.48 0.160 -24.28252 134.4132 prtyr .1642412 .091945 1.79 0.094 -.0317349 .3602173 prot1 0 (omitted) smys .0000367 .0000385 0.95 0.356 -.0000453 .0001187 wallthk -18.88796 6.882593 -2.74 0.015 -33.55786 -4.21806 valve12 .8432879 .6549853 1.29 0.217 -.5527803 2.239356 seam20 -3.230818 1.363852 -2.37 0.032 -6.1378 -.323836 seam36 -1.154897 1.304585 -0.89 0.390 -3.935554 1.62576 seam8 -2.592191 1.056789 -2.45 0.027 -4.844685 -.3396976 seam4 -1.897754 2.374545 -0.80 0.437 -6.958977 3.163468 mop -.0032073 .001047 -3.06 0.008 -.0054389 -.0009757 depth_cov .011442 .0067938 1.68 0.113 -.0030386 .0259226 manyr -.1853655 .0989038 -1.87 0.081 -.3961741 .0254431 nps .3410272 .183257 1.86 0.082 -.0495759 .7316304 l_prptycur~t Coef. Std. Err. t P>|t| [95% Conf. Interval]
Total 71.1498533 27 2.63517975 Root MSE = 1.0185 Adj R-squared = 0.6063 Residual 15.5603465 15 1.03735643 R-squared = 0.7813 Model 55.5895068 12 4.6324589 Prob > F = 0.0039 F( 12, 15) = 4.47 Source SS df MS Number of obs = 28

22
To clarify, the prediction function of l_prptycurrent (the logarithm of the total property
damage and remediation costs adjusted for inflation) utilises several selected variables listed
above. These variables were chosen based on their p-value (P>|t|) and their impact on the overall
function (R-Squared). Generally a p-value less than one is preferable, however there were some
exceptions made due to the effect on the coefficient of determination. The function below was
developed by extracting the coefficients (Coef.) of each variable:
2345657896:5: = 55.06533 .1642412�#%"!3=>3$?3�%��@�A�"22"�@3��+ .0000367�A?%>@=@%C$@�@$D$#@%2CA�!%�4�ℎ�− 18.88796�?@?%H"22�ℎ@>��%AA@�@�>ℎ%A�+ .8432879�CD$$#3=I"2I%�#?%12�− 3.230818�CD$$#3=A%"$�#?%20�− 1.154897�CD$$#3=A%"$�#?%36�− 2.592191�CD$$#3=A%"$�#?%8� − 1.897754�CD$$#3=A%"$�#?%4�− .0032073�$"�@$D$3?%!"�@�4?!%AAD!%�+ .011442�C%?�ℎ3=>3I%!@�@�>ℎ%A� − .1853655�#%"!>3$?3�%��$"�D=">�D!%C�+ .3410272��3$@�"2?@?%A@J%@�@�>ℎ%A�
As a takeaway: provided that there is enough information available, insurance specialists
would have no problem developing reliable estimations. The risk profile could be based on the
specified company and its historical incident arrival rate.
23
Therefore, a company with a low risk profile and a pipeline that is expecting moderate
clean-up costs should pay quarterly contributions at around $3,240.38 per hundreds of kilometers
of pipeline. For example, Company A owns roughly 20,000 km of pipelines; each pipeline has
approximately the same expected clean-up costs at mild levels, and the company has a medium
risk level. It was concluded Company A should contribute around $328,372.41 each quarter or
$1.3 Million per year.
Discussion
While the above calculations proved that it is possible to develop a system of contribution
payments toward the oil-spill superfund using Poisson distribution, there are still limitations that
require work beyond this paper. For instance, the processed data was a hybrid collection of both
American and Canadian sources. In order to be effective in the Canadian system, the data used
for the calculations of the arrival rate and average total costs must be provided by the pipeline
regulatory bodies. Whether in cooperation with the National Energy Board, the provincial
regulators, or another branch designed for the collection of oil spill data, information must be
congruent in order to optimise the accuracy of the payments.
Another setback is the calculation of the expected clean-up costs. The majority of
information provided by the operator incident files was ex-post, therefore unusable for predictor
functions. The remaining information suitable for predictions was not sufficient enough to create
a regression function that could effectively predict expected clean-up costs.
Finally, this paper merely examines the creation of the superfund through established
contribution payments based on risk profiles, estimated clean-up costs, and pipeline lengths.

24
Additional research is required in order to develop policies regarding the utilisation of the fund
to minimalize quality deficiencies, such as moral hazard. The absence of significant penalties
and fines and the realisation of sunk payments into an insurance fund may increase the risk-
taking of operators. This is a crucial problem and may be addressed through insurance caps,
clean-up deductibles, insurance coverage conditions, or fund reimbursement systems.
Conclusion
In conclusion, this paper adjusted the Duffie et al. (2003) valuation model of deposit
insurance using Poisson distribution and applied it toward a self-insurance method for oil
pipeline coverage. It included a literary review of relevant studies and reports, a case preview of
Canadian pipeline controversy, an overview of insurance modeling with Poisson distribution,
and an application and discussion of the model. While this is only a first step in pipeline self-
insurance, the authors are hopeful that this will inspire further research.
25
Reference List
Arping, S. (2010). The pricing of bank debt guarantees. Economics Letters, 108(2), 119-121.
Behzadian, M., Belaud, J., Kennedy, D. T., Pirdashti, M., & Tavana, M. (2012). A hybrid delphi-
SWOT paradigm for oil and gas pipeline strategic planning in Caspian Sea basin. Energy
Policy, 40, 345-360.
Bjørnmose, J., Hansen, D. S., Roca, F., & Turgot, T. (2009, August). An assessment of the gas
and oil pipelines in Europe. Retrieved from
http://www.europarl.europa.eu/RegData/etudes/note/join/2009/416239/IPOL-
ITRE_NT(2009)416239_EN.pdf
Bodie, Z., & Merton, R. C. (1993). Deposit insurance reform: A functional approach. Carnegie-
Rochester Conference Series on Public Policy, 38, 1-34.
Boyd, J. H., & Chang, C. (2002). Deposit insurance: A reconsideration. Journal of Monetary
Economics, 49(6), 1235-1260.
Cryderman, K. (2013, June 18). Enbridge proposes spill fund to ease pipeline fears. The Globe
and Mail. Retrieved from http://www.theglobeandmail.com/report-on-business/industry-
news/energy-and-resources/enbridge-proposes-spill-fund-to-ease-pipeline-
fears/article12620689/
Cuschieri, D., & Deyholos, R. (2013, January). Oil & gas: A comparative guide to the regulation
of oil and gas projects. The European Lawyer. Retrieved from
http://www.torys.com/Publications/Publications/AR2013-1.pdf
Duffie, D., Jarrow, R., Purnanandam, A., & Yang, W. (2003). Market pricing of deposit
insurance. Journal of Financial Services Research, 24(2/3), 93-119.
26
Enbridge Inc. (2011). Pipeline regulations: Canada. Retrieved from
http://www.northerngateway.ca/assets/pdf/General%20Project%20-
%20Regulatory/NGP-FS-01-007_Pipeline%20Regulations%20Canada.pdf
Enbridge Inc. (2013). Route map – Northern Gateway. Retrieved from
http://www.northerngateway.ca/project-details/route-map/
Energy Resources Conservation Board. (2013, February 26). ERCB investigation report: Plains
Midstream Canada ULC, NPS 20 Rainbow pipeline failure, April 28, 2011. Retrieved
from http://www.aer.ca/documents/reports/IR_20130226-PlainsMidstream.pdf
Forest Ethics. (n.d.). The issue – Enbridge’s proposed Northern Gateway pipeline and tanker
project threatens North America. Retrieved from http://forestethics.org/enbridge-issue
Harrison, J., Kreps, D. (1979). Martingales and arbitrage in multiperiod securities markets.
Journal of Economic Theory, 20(3), 381-408.
Jickling, M., & Murphy, E. V. (2010). Who regulates whom? An overview of U.S. financial
supervision. Congressional Research Service. Retrieved from
https://owl.english.purdue.edu/owl/resource/560/10/
Kashi, D. (2013, November 15). Environmental groups' latest weapon against Keystone XL:
How a pipeline explosion is helping the fight against Keystone. International Business
Times. Retrieved from http://www.ibtimes.com/environmental-groups-latest-weapon-
against-keystone-xl-how-pipeline-explosion-helping-fight-against
Kurtz, R. S. (2010). Oil pipeline regulation, culture, and integrity. Public Integrity, 13(1), 25-40.
Martin, A. (2006). Liquidity provision vs. deposit insurance: Preventing bank panics without
moral hazard. Economic Theory, 28(1), 197-211.

27
McCarthy, S., & Vanderklippe, N. (2012, November 12). Canada sees risk in U.S. oil boom. The
Globe and Mail. Retrieved from http://www.theglobeandmail.com/report-on-
business/industry-news/energy-and-resources/canada-sees-risk-in-us-oil-
boom/article5188639/
McCoy, P. A. (2007, February 18). The moral hazard implications of deposit insurance: Theory
and evidence. Retrieved from
http://www.imf.org/external/np/seminars/eng/2006/mfl/pam.pdf
Meckbach, G. (2013). Down the pipe. Canadian Underwriter, 80(8), 28-31.
National Energy Board. (2013). Canadian pipeline transportation system – Transportation
assessment. Retrieved from http://www.neb-one.gc.ca/clf-
nsi/rnrgynfmtn/nrgyrprt/trnsprttn/trnsprttnssssmnt2009/trnsprttnssssmnt2009-eng.html
Natural Resources Canada. (2009). Frequently asked questions. Retrieved from
http://www.nrcan.gc.ca/energy/sources/crude/1287
Piri, M. (2013). Responsibility for response to oil pipeline accidents and its co-relation to the
liability; what would be an effective regime? Retrieved from
https://www.genevaassociation.org/media/623348/ga_15th_eale_seminar_piri.pdf
Polzin, P. E. (2012). Transportation systems key to Montana's energy future. Montana Business
Quarterly, 50(2), 8-11.
Shaffer, E. H. (2006). Canada's oil and imperialism. International Journal of Political Economy,
35(2), 54-71.
United States Coast Guard. (2013). The Oil Spill Liability Trust Fund. Retrieved from
http://www.uscg.mil/npfc/About_NPFC/osltf.asp

28
U.S. Department of Transportation. (2013). Pipeline incidents and mileage reports. Retrieved
from http://primis.phmsa.dot.gov/comm/reports/safety/psi.html
Wagster, J. D. (2006, January 13). Wealth and risk effects of adopting deposit insurance in
Canada: Evidence of risk shifting by banks and trust companies. Retrieved from
http://www.efmaefm.org/efma2006/papers/393153_full.pdf
Wieners, B. (2013, November 13). Have Keystone XL opponents found their best weapon?
Bloomberg Business Week. Retrieved from http://www.businessweek.com/articles/2013-
11-13/have-keystone-xl-opponents-found-their-best-weapon


