Download - James Calenda - mde.state.md.us

August 1, 2016
Mr. Andrew Fan, PE US EPA Region III, 3LC20 1650 Arch Street Philadelphia, PA 19103-2029 Ms. Barbara Brown Project Coordinator Maryland Department of the Environment 1800 Washington Blvd. Baltimore, MD 21230
Re: COKE OVEN AREA INTERIM MEASURES PROGRESS REPORT 2ND QUARTER 2016
Dear Mr. Fan and Ms. Brown:
On behalf of Tradepoint Atlantic and Sparrows Point, LLC, enclosed please find the Coke Oven Area Interim Measures Progress Report for the second quarter of 2016 completed for the Tradepoint Atlantic site. This report was distributed electronically on May 2, 2016 in accordance with the reporting requirements outlined in the US EPA Interim Measures Progress Report frequency letter dated March 26, 2013. Please advise if paper copies are required for your use and we will distribute accordingly.
The report summarizes implementation progress for the interim measures (IMs) that have been developed to address identified environmental conditions at the Coke Oven Area through June 30, 2016. Please contact me at (314) 620-3056 should questions arise during your review of the enclosed progress report.
Sincerely,
James Calenda Project Manager
Enclosure
James Calenda

Former Coke Oven Area Interim Measures Progress Report
2nd Quarter 2016
Page 1 of 15
Introduction
This document presents operational data and monitoring information collected in the 2nd quarter of 2016 for Interim Measures (IMs) that have been installed to address identified environmental conditions at the former Coke Oven Area (COA) Special Study Area at the Sparrows Point Terminal site located in Sparrows Point, Maryland. This progress report summarizes IM performance including data collected from the 2nd quarter of 2016 and is submitted in accordance with reporting requirements outlined in correspondence received from US EPA on March 26, 2013. The following designations are applied in this document to identify the operating IM “Cells” (Figure 1) at the COA:
• Cell 1: Air Sparge/Soil Vapor Extraction (AS/SVE) System in the Former
Benzol Processing Area,
• Cell 2: Air Sparge/Soil Vapor Extraction (AS/SVE) System in the shallow groundwater
zone, groundwater pump and treat (GW P&T) system in the intermediate zone, Former
Coal Basin Area,
• Cell 3: AS/SVE System in “Cove” Area,
• Cell 5: Dual Phase Extraction (DPE) system for the shallow zone, “Turning Basin” side of
former Coke Oven Area,
• Cell 5: Dense Non-Aqueous Phase Liquid (DNAPL) Recovery
• Cell 6: Light Non-Aqueous Phase Liquid (LNAPL) Recovery at the Former Benzol
Processing Area.
As of the end of the second quarter 2016, Cells 1, 2, 3, 5 and 6 remediation systems are operational.
Groundwater and soil gas sampling were conducted during the second quarter of 2016 to assess current conditions and removal efficiencies of the operating IM systems. The results of these sampling events, including trending graphs from IM startup, are detailed in this report. LNAPL removal continued at Cell 6 and DNAPL removal continued at Cell 5 without interruption. Additional detail on the design, operation and groundwater monitoring for these systems is provided in this progress report.

Former Coke Oven Area Interim Measures Progress Report
2nd Quarter 2016
Page 2 of 15
Cell 1: Prototype AS/SVE System in the Former Benzol Processing Area
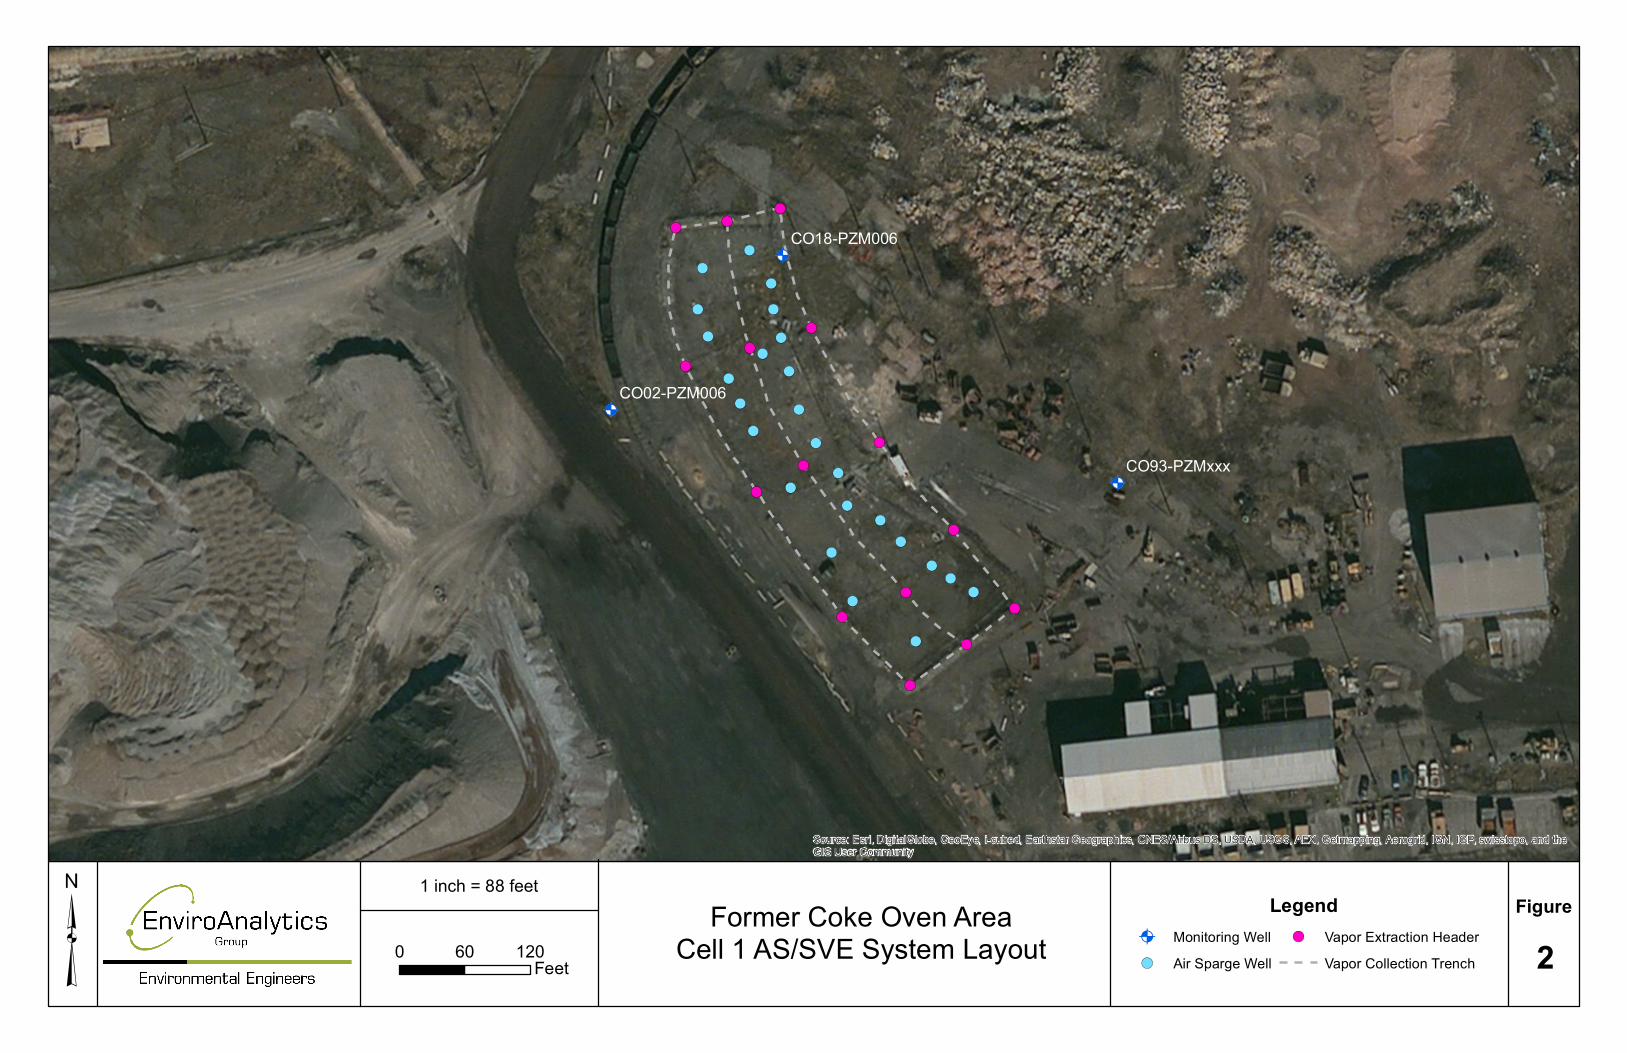
Cell 1 consists of an AS/SVE system installed to remove volatile hydrocarbons that is coupled with vapor destruction via an electric catalytic oxidation (CATOX) unit. Figure 2 shows the system layout of Cell 1 and locations of the major design components including the air sparging wells, vapor collection trenches and groundwater monitoring wells.
2nd Quarter 2016 Operational Performance
The system at Cell 1 underwent reconstruction to the air sparge piping and area layout. Construction was completed beginning of March during the 1st quarter of 2016. Once operations resumed, the air sparge system’s performance was assessed to determine its most effective production settings. The sparge and vapor extraction operated continuously throughout the month of March during the 1st quarter 2016. During the 2nd quarter 2016 based on vapor recovery data, the decision was made to return to operating on a pulsing schedule; where the system is in recovery or on mode for one day and then turned off to let the area rebound for two or three days. This practice was implemented during the first quarter 2013 to improve recovery of hydrocarbons from the subsurface. Operations will continue to be in conformance with the manufacturer’s specifications at all times that soil gases were collected in accordance with the May 20, 2011 modified permit-to-construct conditions as reflected in the Permit to Operate issued to Sparrows Point LLC on December 8, 2014.
Cell 1 experienced down-time due to necessary system repairs from May 21st to June 23rd during the second quarter of 2016. The VFD (variable frequency drive) controlling the SVE vacuum motor failed and the system was inoperable during that period. A new VFD has since been installed and Cell 1 returned to normal operation June 24th.
The hydrocarbon removal rate was calculated to be approximately 0.04 pounds per operating hour (estimated quarterly total of 49.8 pounds). Table 1 also includes a cumulative summary of operational performance since system startup in August 3, 2010. In total, the AS/SVE system at Cell 1 has destroyed approximately 12,574 pounds of recovered hydrocarbons as shown graphically in Figure 3.
Soil gas sample collection occurred during the 2nd quarter of 2016 for laboratory analysis to monitor CATOX unit performance. One untreated soil gas sample for each month were collected in a Suma Canister during the 2nd quarter of 2016 and submitted to Pace Analytical Services, Inc. in Melville, New York for analysis by US EPA Method TO-15.

Former Coke Oven Area Interim Measures Progress Report
2nd Quarter 2016
Page 3 of 15
2nd Quarter 2016 Groundwater Monitoring Results
Groundwater samples were collected on June 23, 2016 from the following wells; the location of the wells are shown on Figure 2:
• CO93-PZM (former BP-MW-09 , upgradient of Cell 1), • CO18-PZM006 (upgradient of Cell 1 at edge of berm), and • CO02-PZM006 (downgradient of Cell 1).
The groundwater samples were submitted to Pace Analytical Services, Inc., located in Greensburg, Pennsylvania for the analyses shown in Table 3. These data indicate benzene is the most prevalent volatile organic compound (VOC) constituent. Since system startup in August 2010, a decreasing total VOC concentration trend is documented at the wells monitored for system performance as illustrated in Figure 4.
A recent increase in VOC concentration was observed in the 4th quarter 2015 and the 1st quarter 2016 data in the Cell 1 monitoring wells. This increase in total VOCs occurred during the restructuring of the cell 1 remediation system and is likely the cause of the recent increase. Monitoring wells CO02-PZM006 and CO18-PZM006 have shown a decrease in concentrations since the system returned to service, but monitoring well CO93-PZM displayed an increase in total VOC concentration as indicated in Figure 4. The analytical data for CO93-PZM will be reviewed and compared to future third quarter data to determine a trend. All other historical trending data for these monitoring wells will continue to be assessed during system operation in future months.

Former Coke Oven Area Interim Measures Progress Report
2nd Quarter 2016
Page 4 of 15
Cell 2: Air Sparge/Soil Vapor Extraction (AS/SVE) System in the Shallow Groundwater Zone, Groundwater Pump and Treat (GW P&T) System in the Intermediate Groundwater Zone, Former Coal Basin Area
Cell 2 consists of an AS/SVE system coupled with vapor destruction via an electric catalytic oxidation (CATOX) unit for volatile hydrocarbon groundwater treatment in the shallow zone and a pump and treat system for recovery of groundwater and volatile hydrocarbon treatment from the intermediate zone. The system design plans were approved by US EPA in correspondence received on September 10, 2013 and began full scale operation in October 2014. Figure 5 shows the system layout of Cell 2 and locations of the major design components including the air sparging wells, vapor collection trenches, intermediate groundwater recovery wells, groundwater injection wells and groundwater monitoring well locations.
AS/SVE System The delivery and recovery systems for the shallow AS/SVE system include the use of air sparge points and a horizontal vapor extraction trench. Eight (8) air sparge points along a 500 feet long stretch were installed near the shore line of Cell 2. Details of the air sparge zone and recovery trench include the following:
• Air sparge zone: 8 – 2-inch diameter AS points @ approximately 56 ft spacing, center to center (C-C)
o Installed to 15 ft -17 ft bgs (bottom of slag fill) o Bottom 2 ft of each point to be screened with 20-slot screen
• Recovery trench
o 500 ft of horizontal, 4-inch diameter perforated pipe (or 20-slot screen) installed to a total depth (TD) of 5 ft
o 5 vertical 4-inch risers spaced every 100 ft, C-C o Top 2 ft is a clay cap o Geotextile fabric @ 2 ft bgs (under clay) o Granular screened slag backfill from 2 ft -5 ft o Horizontal recover piping located approximately 3 ft bgs (above water table)
GW P&T System The pump and treat groundwater system includes a low profile air stripper that then utilizes an oxidizer to destroy all VOC vapors generated prior to exhausting to the atmosphere. The design groundwater flow is for a maximum of 40 gallons per minute (gpm). The oxidizer is sized to handle up to a 600 cubic feet per minute air flow. The recovery and re-injection systems include the use

Former Coke Oven Area Interim Measures Progress Report
2nd Quarter 2016
Page 5 of 15
of six groundwater recovery wells and six groundwater injection wells. The six recovery wells are installed along a 500 feet long stretch near the shore line of Cell 2.
• 6 – 4-inch diameter GW RWs @ approximately 83 ft spacing, C-C o Installed to 40-45 ft bgs (intermediate sand zone) o Bottom 15 ft of each RW screened with 20-slot screen o An electric pump in each RW, resting approximately 7-10 ft above the bottom of the well
• Recovered GW Treatment
o Enters low profile air stripper o Off-gas sent to Electric Oxidizer for destruction o Treated groundwater pumped to six-6 inch diameter re-injection wells screened from 5
to 15 feet in depth for recirculation in shallow GW zone
2nd Quarter 2016 Operational Performance
AS/SVE System
Operational performance of the AS/SVE System at Cell 2 during this reporting period is summarized in Table 4. In summary, the CATOX unit operated for 1,440 hours (66%) during this reporting period. During 2nd quarter 2016, SVE operations were continuous. The system at Cell 2 was operated on a pulsing schedule during the 2nd quarter 2016 reporting quarter. Operations were in conformance with the manufacturer’s specifications at all times that soil gases were collected in accordance with the March 24, 2014 permit-to-construct conditions as reflected in the Permit to Operate issued to Sparrows Point LLC on December 8, 2014.
The hydrocarbon removal rate was calculated to be approximately 0.003 pounds per operating hour (estimated quarterly total of 0.16 pounds). Table 4 also includes a cumulative summary of operational performance since system startup in October 2014. In total, the AS/SVE system at Cell 2 has destroyed approximately 280.80 pounds of recovered hydrocarbons as shown graphically in Figure 3.
Soil gas samples were collected for laboratory analysis to monitor CATOX unit performance. One untreated soil gas sample per month is gathered each quarter. The samples were collected in a Suma Canister and submitted to Pace Analytical Services, Inc. in Melville, New York for analysis by US EPA Method TO-15. The average influent soil gas hydrocarbon concentration was 203 ug/m3 as summarized in Table 5. Hydrocarbon removal calculations were based on the analytical results and the average daily field-measured influent flow rates. The mass removal calculations assume that the samples collected throughout the second quarter are representative of hydrocarbon concentrations for the entire quarter. This assumption is based on the fact that the same air sparge wells and extraction wells were online when the system was operational.

Former Coke Oven Area Interim Measures Progress Report
2nd Quarter 2016
Page 6 of 15
GW P&T System Evaluation
The Cell 2 groundwater pump and treat system was evaluated in the 2nd quarter 2016 with regard to the effectiveness of this system with respect to the mass of volatile hydrocarbons removed from groundwater.
Evaluation of Pump and Treat System Effectiveness
A total of 947,374 gallons of water were extracted from the Cell 2 Area pumping wells and treated during the 2nd quarter of 2016. The average pumping rate for the pump and treat system was 10,526 gpd, or 7.3 gpm.
Operations were in conformance with the manufacturer’s specifications at all times that stripped hydrocarbons were discharged through the CaTOX unit to the atmosphere in accordance with the March 24, 2014 permit-to-construct conditions as reflected in the Permit to Operate issued to Sparrows Point LLC on December 8, 2014. In addition, treated groundwater discharges were in compliance with discharge permit conditions outlined in Discharge Permit 11-DP-3746 issued to Sparrows Point LLC on May 6, 2013. These pumping rates appear to effectively capture the most impacted groundwater beneath Cell 2, as revealed by Figure 7 discussed in the following section.
A total of 416 lbs of benzene, toluene and xylene compounds (btex) and 17.7 lbs of naphthalene were removed and treated during the 2nd quarter of 2016. This total is shown graphically in Figure 3. The following table presents data for influent and effluent (treated) groundwater.
Field ID Analysis Units 13-JAN 28-JAN 4-FEB 22- FEB 21-MAR 22-MAR Quarter Average
GWPT Cell 2 INFLUENT Benzene ug/L 31,000 28,000 48,000 51,000 58,000 65,000 46,833 GWPT Cell 2 INFLUENT Toluene ug/L 3000 2500 3800 3900 5800 7200 4,367 GWPT Cell 2 INFLUENT Ethylbenzene ug/L 0 0 0 0 270 360 105 GWPT Cell 2 INFLUENT Total Xylenes ug/L 700 570 820 890 2100 3390 1,412 GWPT Cell 2 INFLUENT Naphthalene ug/L 3800 1300 1500 970 4300 2100 2,328 GWPT Cell 2 EFFLUENT Benzene ug/L 230 220 140 0 230 55 146 GWPT Cell 2 EFFLUENT Toluene ug/L 23 24 13 0 18 5 14 GWPT Cell 2 EFFLUENT Total Xylenes ug/L 7 7 0 0 7 0 4 GWPT Cell 2 EFFLUENT Naphthalene ug/L 100 120 85 0 140 67 85

Former Coke Oven Area Interim Measures Progress Report
2nd Quarter 2016
Page 7 of 15
The pump and treat system is removing significant amounts of volatile hydrocarbons from groundwater within the intermediate water bearing zone at the current pumping rates, and it is controlling groundwater flow and associated migration within the intermediate water bearing zone.
2nd Quarter 2016 Groundwater Monitoring Results
Groundwater samples were collected in June 2016 from the following wells; the well locations are shown on Figure 5.
• CO27- PZM012 – shallow zone • CO27-PZM046 - intermediate zone • CO36-PZM008 – shallow zone • CO36-PZM043 – intermediate zone • CO37-PZM038 – intermediate zone • CO38-PZM006 – shallow zone • CO38-PZM043– intermediate zone • CO39-PZM007– shallow zone • CO39-PZM042– intermediate zone • CO40-PZM008– shallow zone • CO41-PZM 001– shallow zone • CO41-PZM 036– intermediate zone • CO42-PZM004 – shallow zone
Exception to the wells list as sampled in June is well CO37-PZM003. CO37-PZM003 was not sampled due to the presence of free product first identified in November 2014.
The groundwater samples were submitted to Pace Analytical Services, Inc., located in Greensburg, Pennsylvania for the analyses shown in Table 7. These data indicate benzene is the most prevalent volatile organic compound (VOC) constituent. The VOC concentrations for the 2nd quarter 2016 sampling events are shown for the groundwater wells monitored for system performance in Figure 6A and 6B.
Shallow zone groundwater, with the exception of groundwater monitored at CO41-PZM001, has remained at consistent VOC levels since the first sampling event in 3rd quarter 2014. CO41-PZM001 had a significant increase of benzene during the 2nd quarter 2015 sampling event and had shown a steady decrease in concentrations throughout 3rd and 4th quarter 2015 sampling events. The increase of benzene found in CO41-PZM001 from 1st quarter 2016 sampling data has subsided to previous lower concentration levels from the 2nd quarter data. It may be determined that the groundwater treatment system has had the greatest effect within the subsurface area of the CO41-PZM001 MW location as data from this well reflects system

Former Coke Oven Area Interim Measures Progress Report
2nd Quarter 2016
Page 8 of 15
operation. No other significant increases or decreases in historical trends were present within the shallow zone.
Figure 7 presents a plan view of the concentration of VOCs in the intermediate zone from analytical results from the June 2016 monitoring event. No significant Increases or decreases were noted from the 2nd quarter 2016 groundwater data. These wells will continue to be monitored to assess possible trends associated with operation of the interim measure.
Light non-aqueous product (LNAPL) was encountered in well CO37-PZM003 in the shallow groundwater zone in November 2014. The well was hand baled multiple times recovering approximately 10 gallons of free product. The LNAPL levels were reduced and CO37-PZM003 was then hand baled on a monthly basis. The product level in CO37-PZM003 became trace during the last 2 quarters of 2015. It was then measured for product on a bi-weekly basis throughout the first and second quarters of 2016. For the second consecutive quarter, no product has shown a presence within the monitoring well. CO37-PZM003 will be sampled during the 3rd quarter sampling event.

Former Coke Oven Area Interim Measures Progress Report
2nd Quarter 2016
Page 9 of 15
Cell 3: AS/SVE System in the “Cove” Area
Cell 3 consists of an AS/SVE system coupled with vapor destruction via an electric CATOX unit. Figure 1 shows the location of the Cell 3 AS/SVE treatment area at the COA. The major design components are described in the Cell 3 final design report (Coke Oven Area Interim Measures Cell 3 “Cove” Area Air Sparge/Soil Vapor Extraction System Design), submitted to US EPA on March 1, 2011.
2nd Quarter 2016 Operational Performance
Operational performance of Cell 3 during this reporting period is summarized in Table 8. In summary, the CATOX unit operated for 744 hours (34.1%) during the 2nd quarter of 2016. The system at Cell 3 continues to operate on a pulsing schedule; where the system is in recovery or on mode for one day and then turned off to let the area rebound for two or three days. This practice was implemented to improve recovery of hydrocarbons from the subsurface. Operations continue to be in conformance with the manufacturer’s specifications at all times that soil gases were collected in accordance with the May 20, 2011 modified permit-to-construct conditions.
The hydrocarbon removal rate was calculated to be approximately 0.025 pounds per operating hour (estimated quarterly total of 18.866 pounds). Table 8 also includes a cumulative summary of operational performance since system startup on June 24, 2011. In total, Cell 3 has destroyed approximately 1,680 pounds of recovered hydrocarbons as shown graphically in Figure 3.
Soil gas samples were collected for laboratory analysis to monitor CATOX unit performance. One untreated soil gas sample was collected in a Suma Canister and submitted to Pace Analytical Services. The average influent soil gas hydrocarbon concentration of the three samples taken throughout the 2nd quarter was 48,359 ug/m3 as summarized in Table 9.
Hydrocarbon removal calculations were based entirely on the analytical results and the average daily field-measured influent flow rates. The mass removal calculations assume that the samples collected throughout the 2nd quarter are representative of hydrocarbon concentrations for the entire quarter. This assumption is based on the fact that the same air sparge wells (AS-2 thru AS-12) and extraction wells (V-2 thru V-4) were online when the system was operational. Operations at this Cell will continue to be evaluated in the future to improve system recovery rates.

Former Coke Oven Area Interim Measures Progress Report
2nd Quarter 2016
Page 10 of 15
2nd Quarter 2016 Groundwater Monitoring
Groundwater samples were collected in June 2016 from the following wells (Figure 8):
• CO101-PZM (downgradient of Cell 3), • CO102-PZM (upgradient of Cell 3), • CO103-PZM (upgradient of Cell 3), • CO104-PZM (downgradient of cell 3), • CO30-PZM015 (downgradient of Cell 3).
The groundwater samples were submitted to Pace Analytical for the analyses shown in Table 10. These data indicate that benzene is the most prevalent VOC constituent. Since system startup on June 24, 2011, a generally inconclusive VOC concentration trend is documented, as illustrated in Figure 9. Results from the last 4 quarters for CO103-PZM closely reflect historical concentrations for this well; therefore, it is interpreted that an increasing trend is not apparent in this well as potentially defined in the 3rd quarter of 2014. There were no increases or decreases of significance to any of the groundwater monitoring wells for the 2nd quarter of 2016. Groundwater will continue to be monitored and assessed during system operation in future months. The wells have shown relatively consistent concentrations over the last 2 years.

Former Coke Oven Area Interim Measures Progress Report
2nd Quarter 2016
Page 11 of 15
Cell 5: Dual Phase Extraction (DPE) System for the Shallow Zone, “Turning Basin” side of Former Coke Oven Area Cell 5 consists of a dual phase (vapor and water) system (DPE) with a low profile air stripper followed by vapor phase granular activated carbon (VGAC) for removal and treatment of vapor and dissolved volatile hydrocarbons in the shallow groundwater zone. The system design plans were approved by US EPA in correspondence received on September 10, 2013 and began full scale operation in October 2014. Figure 10 shows the system layout of Cell 5 and locations of the major design components including the dual phase recovery points, treatment system, groundwater injection wells and groundwater monitoring well locations. The recovery and re-injection systems include the use of dual phase (soil vapor and groundwater) recovery wells and six groundwater re-injection wells. Twelve (12) recovery wells were installed along an approximate 500 feet long stretch downgradient of the most recent 10,000 ug/L is contour line for naphthalene (between the naphthalene source area and the eastern shore line along the Turning Basin).
• 12 – 1.5-inch diameter DPE RWs @ approximately 42 ft spacing, C-C o Installed to 15-17 ft bgs (to bottom of shallow slag) o Bottom 2 ft of each RW screened with 20-slot screen o Vapor recovery perforations located between 10-12 ft bgs
• Recovered GW and vapor Treatment
o Enters MS knockout tank to separate air and water phases o Water sent to low profile air stripper o Off-gas sent to VGAC for capture o Treated groundwater pumped to six-6 inch diameter re-injection wells screened from 5
to 15 feet in depth for recirculation in shallow GW zone
2nd Quarter 2016 Operational Performance
Evaluation of Pump and Treat System Effectiveness
A total of 1,407,139 gallons of water were extracted from the Cell 5 Area dual phase extraction wells and treated during the 2nd quarter of 2016. The average recovery rate for the DPE system was 15,634 gpd (10.8 gpm).
Operations were in conformance with the manufacturer’s specifications at all times that stripped hydrocarbons were discharged to the atmosphere in accordance with the March 24,

Former Coke Oven Area Interim Measures Progress Report
2nd Quarter 2016
Page 12 of 15
2014 permit-to-construct conditions as reflected in the Permit to Operate issued to Sparrows Point LLC on December 8, 2014.
A total of 12 pounds (lbs) of benzene, toluene and xylene compounds (btex) and 58 pounds (lbs) of naphthalene were removed during the 2nd quarter of 2016. This total is shown graphically in Figure 3. The following table presents data for influent and effluent (treated) groundwater.
Field ID Analysis Units 18-Apr 19-Apr 27-May 31-May 17-Jun 20-Jun AVG
GWPT Cell 5 INFLUENT
Benzene ug/L 520 490 360 0 330 550 375
GWPT Cell 5 INFLUENT
Toluene ug/L 330 310 210 0 180 280 218
GWPT Cell 5 INFLUENT
Styrene ug/L
110 100 69 0 72 96 74.5
GWPT Cell 5 INFLUENT
Total Xylenes ug/L 490 460 307 0 280 430 328
GWPT Cell 5 INFLUENT
Naphthalene ug/L 5300 5300 3700 800 7300 7,300 4,950
GWPT Cell 5 EFFLUENT
Benzene ug/L 0 0 0 0 0 0 0
GWPT Cell 5 EFFLUENT
Toluene ug/L 0 0 0 0 0 0 0
GWPT Cell 5 EFFLUENT
Total Xylenes ug/L 0 0 0 0 0 0 0
GWPT Cell 5 EFFLUENT
Naphthalene ug/L 0 0 0 0 0 0 0
The DPE system is removing volatile hydrocarbons from groundwater within the shallow water bearing zone at the current recovery rates. The system has shown continual improvement in performance since the first few quarters of operation, mostly attributed to the recent addition of the liquid carbon treatment tanks during the 2nd quarter of 2015. The Cell 5 groundwater treatment system experienced 2 weeks of down-time during the 2nd quarter of 2016 for MS tank repairs and eventual replacement. From 5/24 until 5/31, the cell 5 remediation system was stopped for repairs to the leaking MS tank. From 6/6 until
Former Coke Oven Area Interim Measures Progress Report
2nd Quarter 2016
Page 13 of 15
6/10, the system was stopped for the replacement of the MS tank. No other significant periods of down-time occurred with the system throughout the quarter.
2nd Quarter 2016 Groundwater Monitoring Results
Groundwater samples were collected in June 2016 from the following shallow zone monitoring wells; the well locations are shown on Figure 10.
• CO23- PZM008 • CO24-PZM007 • CO26-PZM007 • CO55-PZM000 • CO56-PZP001 • CO57-PZP002 • CO58-PZM001 • CO59-PZP002 • CO60-PZP001
The groundwater samples were submitted to Pace Analytical Services, Inc., located in Greensburg, Pennsylvania for the analyses shown in Table 11. These data indicate naphthalene is the most prevalent hydrocarbon constituent. The naphthalene concentrations for the 2014-2016 sampling events are shown for the groundwater wells monitored for system performance as illustrated in Figure 11A and 11B. Figure 14A presents shallow groundwater naphthalene concentration trends for wells presumed to be upgradient of the treatment system. No apparent trends are present in the analytical data. This presumed upgradient set of wells will continue to be monitored to further assess possible trends associated with operation of the interim measure in future quarters.
CO26-PZM007 resides within the presumed downgradient group of monitoring wells. The groundwater analyzed from this well during the 1st quarter 2016 sampling event showed an increase in naphthalene concentration. The concentration has since decreased from 12,800 ug/L naphthalene in the 1st quarter data to 2,140 ug/L naphthalene in the 2nd quarter. The 1st quarter concentration increase may have been caused from downtime of the groundwater remediation system for cell 5 during that quarter. This monitoring well will continue to be monitored for trends in future sampling events. Figure 12 presents a plan view of the concentration of naphthalene in the shallow zone from analytical results from the June 2016 monitoring event.

Former Coke Oven Area Interim Measures Progress Report
2nd Quarter 2016
Page 14 of 15
Cell 5: DNAPL Extraction
DNAPL product removal began to be extracted from the Cell 5 area in the latter part of the 4th quarter 2015. DNAPL was extracted from several newly constructed extraction wells that have constructed DNAPL sumps below the screened interval. Compressed air DNAPL skimmer pumps were installed within two specific extraction wells that had shown to produce the greatest amounts of DNAPL: CO123-PZM and CO125-PZM. A 55-gallon drum has been placed next to CO125-PZM and a 500-gallon holding tank was placed at CO123-PZM. Product that is removed from the wells is pumped into the holding containers and taken offsite every 90 days. Table 12 summarizes 1) DNAPL occurrence and recovery observed in monitoring wells for this Cell during the reporting period, 2) the start date of extraction from recovery wells and 3) cumulative DNAPL recovered since the beginning of the interim measure.
The DNAPL was recovered from the following wells:
Well
DNAPL Recovery (gal/lbs) 2nd Qtr 2016 (gal/lbs)
Total thru 2nd Qtr 2016 (gal/lbs)
CO123-PZMxxx 53/509 198/1900 CO125-PZMxxx 0/0 100/960 Total 53/509 298/2860

Former Coke Oven Area Interim Measures Progress Report
2nd Quarter 2016
Page 15 of 15
Cell 6: LNAPL Extraction at the Former Benzol Processing Area The Cell 6 LNAPL monitoring and recovery system was monitored weekly during the 2nd quarter of 2016. Table 13 summarizes; 1) LNAPL occurrence and recovery observed in monitoring wells for this Cell during the reporting period, 2) the start date of extraction from recovery wells and 3) cumulative LNAPL recovered since the beginning of the interim measure. Figure 13 illustrates the well locations. An estimated 770 gallons (5,643 pounds) of LNAPL were recovered during the 2nd quarter 2016, bringing the total recovered LNAPL to 15,398 gallons (112,837 pounds) as of July 6, 2016. Well BP-MW-10 did not produce measurable amounts of LNAPL. LNAPL was recovered from wells in the Cell 6 area as shown below. The LNAPL was recovered from the following wells:
Well
Previous Well Identifier
LNAPL Recovery (gal/lbs) 2nd Qtr 2016 (gal/lbs)
Total thru 2nd Qtr 2016 (gal/lbs)
CO99-PZMxxx RW-04 124/909 1,822/13,352 CO89-PZMxxx BP-MW-05 218/1,598 9,849/72,173 CO92-PZMxxx BP-MW-08 63/462 1,851/13,564 CO95-PZMxxx BP-MW-11 365/2,675 1,756/12,868 CO97-PZMxxx RW-02 0/0 0.8/6 CO98-PZMxxx RW-03 0/0 118/865 CO96-PZMxxx RW-01 0/0 1.3/10 TOTAL 770/5,643 15,398/112,837
Table 14 provides well-specific details concerning the measured depths to LNAPL, the water table, and calculated LNAPL thicknesses for monitoring wells in the Cell 6 area.

TABLES

Cell 1 Second Quarter 2016 Estimated Hydrocarbon Recovery
Table 1Summary of Operation Conditions
Cell 1: Prototype AS/SVE System in Former Benzol Processing AreaFormer Coke Oven Area Interim Remedial Measures
Sparrows Point, LLC
Parameter Units QuantityTotal CATOX Operating Time (April 1, 2016 - June 30, 2016) hours 1,128Overall CATOX Operational Time % 52.2%Estimated Total Hydrocarbons Destroyed pounds 49.829Estimated Hydrocarbon Removal Rate pounds/hour 0.04417
Cell 1 Cumulative Summary of Estimated Hydrocarbon RecoveryParameter Units Quantity
Total ICE/CATOX Operating Time (August 3, 2010 - June 30, 2016) hours 24,220Overall CATOX Operational Time % 55.5%Estimated Total Hydrocarbons Destroyed pounds 12,574Estimated Hydrocarbon Removal Rate pounds/hour 0.52

Units
ug/m3
ug/m3
ug/m3
ug/m3
ug/m3
ug/m3
ug/m3
ug/m3
ug/m3
ug/m3
ug/m3
ug/m3
ug/m3
ug/m3
ug/m3
ug/m3
ug/m3
ug/m3
ug/m3
ug/m3
ug/m3
ug/m3
ug/m3
ug/m3
ug/m3
ug/m3
ug/m3
ug/m3
ug/m3
ug/m3
Notes:VOC concentrations are averages derived from the 3 monthly influent air samples taken during the quarter (one sample taken each month of the quarter)
ug/m3 = micro grams per cubic meterND = Analyte not detected above laboratory reporting limit
BOLD = Analyte detected
Sample ID CATOX Influent
Benzene 64,700
Date Q2 2016Time
Dilution FactorAnalyte TO-15 Volatile Organics
Table 2Summary of Soil Gas Analytical Results (Second Quarter 2016)
Cell 1: Prototype AS/SVE System in Former Benzol Processing AreaFormer Coke Oven Area Interim Remedial Measures
Sparrows Point, LLC
Acetone 21
Bromoform ND2-Butanone (MEK) NDCarbon disulfide 0Carbon tetrachloride NDChlorobenzene NDChloroethane 1
cis-1,3-Dichloropropene ND
Chloroform ND1,1-Dichloroethane ND1,2-Dichloroethane ND
NDtrans-1,2-Dichloroethene ND1,2-Dichloropropane ND
1,1-Dichloroethene
trans-1,3-Dichloropropene NDEthylbenzene 1,0522-Hexanone ND
23,4501,1,1-Trichloroethane ND
Methylene Chloride 44-Methyl-2-pentanone (MIBK) ND1,1,2,2-Tetrachloroethane NDTetrachloroethene 0Toluene
1,1,2-Trichloroethane
o-Xylene 3,595Total Volatile Organics 101,663
NDTrichloroethene NDVinyl chloride NDm&p-Xylene 8,840

CO02-PZM006 CO18-PZM006 CO93-PZMxxxCO02-PZM006 CO18-PZM006 BP-MW-09
6/23/2016 6/23/2016 6/23/2016Analyte Units
1,1,1,2-Tetrachloroethane μg/L ND ND ND 1,1,1-Trichloroethane μg/L ND ND ND 1,1,2,2-Tetrachloroethane μg/L ND ND ND 1,1,2-Trichloroethane μg/L ND ND ND 1,1-Dichloroethane μg/L ND ND ND 1,1-Dichloroethene μg/L ND ND ND 1,2,3-Trichloropropane μg/L ND ND ND 1,2-Dibromo-3-chloropropane μg/L ND ND ND 1,2-Dibromoethane (EDB) μg/L ND ND ND 1,2-Dichlorobenzene μg/L ND ND ND 1,2-Dichloroethane μg/L ND ND ND 1,2-Dichloropropane μg/L ND ND ND 1,4-Dichlorobenzene μg/L ND ND ND 2-Butanone (MEK) μg/L ND ND ND 2-Hexanone μg/L ND ND ND 4-Methyl-2-pentanone (MIBK) μg/L ND ND ND Acetone μg/L ND ND ND Acrylonitrile μg/L ND ND ND Benzene μg/L 205,000 227,000 507,000 Bromochloromethane μg/L ND ND ND Bromodichloromethane μg/L ND ND ND Bromoform μg/L ND ND ND Bromomethane μg/L ND ND ND Carbon disulfide μg/L ND ND 38.2 Carbon tetrachloride μg/L ND ND ND Chlorobenzene μg/L ND ND 17.9 Chloroethane μg/L ND ND NDChloroform μg/L ND ND ND Chloromethane μg/L ND ND ND Dibromochloromethane μg/L ND ND NDDibromomethane μg/L ND ND NDEthylbenzene μg/L 451 57 1,860Iodomethane μg/L ND ND ND Methyl-tert-butyl ether μg/L ND ND NDMethylene Chloride μg/L ND ND NDStyrene μg/L 8.5 ND 1,840Tetrachloroethene μg/L ND ND NDToluene μg/L 2,500 3,700 62,700Trichloroethene μg/L ND ND NDTrichlorofluoromethane μg/L ND ND NDVinyl acetate μg/L ND ND NDVinyl chloride μg/L ND ND NDXylene (Total) μg/L 1,590 1,130 25,000cis-1,2-Dichloroethene μg/L ND ND NDcis-1,3-Dichloropropene μg/L ND ND NDtrans-1,2-Dichloroethene μg/L ND ND NDtrans-1,3-Dichloropropene μg/L ND ND NDtrans-1,4-Dichloro-2-butene μg/L ND ND NDTotal Volatile Organics μg/L 209,550 231,887 598,456
Naphthalene µg/L 392 132 11,900
Notes:
Bold = Analyte Detected
ND = Analyte not detected above laboratory reporting limit
µg/L = Micrograms per liter
Semi-Volatiles
Volatile Organics
Former Sample IDDate
Table 3Summary of Groundwater Analytical Results (Second Quarter 2016)Cell 1: Prototype AS/SVE System in Former Benzol Processing Area
Former Coke Oven Area Interim Remedial MeasuresSparrows Point, LLC
New Sample ID

Cell 2 Second Quarter 2016 Estimated Hydrocarbon Recovery
Table 4Summary of Operation Conditions
Cell 2 AS/SVE SystemFormer Coke Oven Area Interim Remedial Measures
Sparrows Point, LLC
Parameter Units QuantityTotal CATOX Operating Time (April 1, 2016 - June 30, 2016) hours 1,440Overall CATOX Operational Time % 65.9%Estimated Total Hydrocarbons Destroyed pounds 0.16Estimated Hydrocarbon Removal Rate pounds/hour 0.0001
Cell 2 Cumulative Summary of Estimated Hydrocarbon RecoveryParameter Units Quantity
Total ICE/CATOX Operating Time (October 1, 2014 - March 31, 2016) hours 10,032Overall CATOX Operational Time % 65.5%Estimated Total Hydrocarbons Destroyed pounds 280.80Estimated Hydrocarbon Removal Rate pounds/hour 0.028

Units
ug/m3
ug/m3
ug/m3
ug/m3
ug/m3
ug/m3
ug/m3
ug/m3
ug/m3
ug/m3
ug/m3
ug/m3
ug/m3
ug/m3
ug/m3
ug/m3
ug/m3
ug/m3
ug/m3
ug/m3
ug/m3
ug/m3
ug/m3
ug/m3
ug/m3
ug/m3
ug/m3
ug/m3
ug/m3
ug/m3
Notes:VOC concentrations are averages derived from the 3 monthly influent air samples taken during the quarter (one sample taken each month of the quarter)
Sample ID CATOX Influent
Table 5Summary of Soil Gas Analytical Results (Second Quarter 2016)
Cell 2 AS/SVE SystemFormer Coke Oven Area Interim Remedial Measures
Sparrows Point, LLC
Benzene 90
Date Q2 2016Time
Dilution FactorAnalyte TO-15 Volatile OrganicsAcetone ND
Bromoform ND2-Butanone (MEK) NDCarbon disulfide NDCarbon tetrachloride 2Chlorobenzene NDChloroethane ND
cis-1,3-Dichloropropene ND
Chloroform ND1,1-Dichloroethane ND1,2-Dichloroethane ND
NDtrans-1,2-Dichloroethene ND1,2-Dichloropropane ND
1,1-Dichloroethene
trans-1,3-Dichloropropene NDEthylbenzene 42-Hexanone NDMethylene Chloride 104-Methyl-2-pentanone (MIBK) ND1,1,2,2-Tetrachloroethane ND
m&p-Xylene 19
Tetrachloroethene NDToluene 621,1,1-Trichloroethane ND
NDTrichloroethene NDVinyl chloride ND
1,1,2-Trichloroethane
ND = Analyte not detected above laboratory reporting limit
o-Xylene 15Total Volatile Organics 203
BOLD = Analyte detectedug/m3 = micro grams per cubic meter

CO27-PZM012 CO27-PZM046 CO36-PZM008 CO36-PZM043 CO37-PZM038 CO37-PZM003 CO38-PZM043 CO38-PZM006 CO39-PZM007 CO39-PZM042 CO40-PZM008 CO41-PZM001 CO41-PZM036 CO42-PZM004CO27-PZM012 CO27-PZM046 Cell 2-MW1 (S) Cell2-MW8 (I) Cell2-MW9 (I) Cell2-MW2 (S) Cell2-MW10 (I) Cell2-MW3 (S) Cell2-MW4 (S) Cell2-MW11 (I) Cell2-MW5 (S) Cell2-MW6 (S) Cell2-MW12 (I) Cell2-MW7 (S)
6/22/2016 6/22/2016 6/22/2016 6/22/2016 6/22/2016 6/22/2016 6/22/2016 6/22/2016 6/22/2016 6/22/2016 6/22/2016 6/22/2016 6/22/2016 6/22/2016Analyte Units Volatile Organics 1,1,1,2-Tetrachloroethane μg/L ND ND ND ND ND NS ND ND ND ND ND ND ND ND1,1,1-Trichloroethane μg/L ND ND ND ND ND NS ND ND ND ND ND ND ND ND1,1,2,2-Tetrachloroethane μg/L ND ND ND ND ND NS ND ND ND ND ND ND ND ND1,1,2-Trichloroethane μg/L ND ND ND ND ND NS ND ND ND ND ND ND ND ND1,1-Dichloroethane μg/L ND ND ND ND ND NS ND ND ND ND ND ND ND ND1,1-Dichloroethene μg/L ND ND ND ND ND NS ND ND ND ND ND ND ND ND1,2,3-Trichloropropane μg/L ND ND ND ND ND NS ND ND ND ND ND ND ND ND1,2-Dibromo-3-chloropropane μg/L ND ND ND ND ND NS ND ND ND ND ND ND ND ND1,2-Dibromoethane (EDB) μg/L ND ND ND ND ND NS ND ND ND ND ND ND ND ND1,2-Dichlorobenzene μg/L ND ND ND ND ND NS ND ND ND ND ND ND ND ND1,2-Dichloroethane μg/L ND ND ND 799 ND NS ND ND ND ND ND ND ND ND1,2-Dichloropropane μg/L ND ND ND ND ND NS ND ND ND ND ND ND ND ND1,4-Dichlorobenzene μg/L ND ND ND ND ND NS ND ND ND ND ND ND ND ND2-Butanone (MEK) μg/L ND ND ND ND ND NS ND ND ND ND ND ND ND ND2-Hexanone μg/L ND ND ND ND ND NS ND ND ND ND ND ND ND ND4-Methyl-2-pentanone (MIBK) μg/L ND ND ND ND ND NS ND ND ND ND ND ND ND NDAcetone μg/L ND ND ND ND ND NS ND ND ND ND ND ND ND NDAcrylonitrile μg/L ND ND ND ND ND NS ND ND ND ND ND ND ND NDBenzene μg/L 19,400 436,000 22,300 25,400 22,900 NS 9 9,350 8,760 29,300 292 5,170 291,000 661Bromochloromethane μg/L ND ND ND ND ND NS ND ND ND ND ND ND ND NDBromodichloromethane μg/L ND ND ND ND ND NS ND ND ND ND ND ND ND NDBromoform μg/L ND ND ND ND ND NS ND ND ND ND ND ND ND NDBromomethane μg/L ND ND ND ND ND NS ND ND ND ND ND ND ND NDCarbon disulfide μg/L ND ND ND ND ND NS ND ND ND ND ND ND ND NDCarbon tetrachloride μg/L ND ND ND ND ND NS ND ND ND ND ND ND ND NDChlorobenzene μg/L ND ND ND ND ND NS ND ND ND ND ND ND ND NDChloroethane μg/L ND ND ND ND ND NS ND ND ND ND ND ND ND NDChloroform μg/L ND ND ND ND ND NS ND ND ND ND ND ND ND NDChloromethane μg/L ND ND ND ND ND NS ND ND ND ND ND ND ND NDDibromochloromethane μg/L ND ND ND ND ND NS ND ND ND ND ND ND ND NDDibromomethane μg/L ND ND ND ND ND NS ND ND ND ND ND ND ND NDEthylbenzene μg/L 177 979 59.9 71.6 322 NS ND 104 41.2 276 4.4 67 1,200 176Iodomethane μg/L ND ND ND ND ND NS ND ND ND ND ND ND ND NDMethyl-tert-butyl ether μg/L ND ND ND ND ND NS ND ND ND ND ND ND ND NDMethylene Chloride μg/L ND ND ND ND ND NS ND ND ND ND ND ND ND NDStyrene μg/L 215 238 19.1 18.6 540 NS ND 49.4 51.4 464 ND 3.3 474 89.9Tetrachloroethene μg/L ND ND ND ND ND NS ND ND ND ND ND ND ND NDToluene μg/L 7,000 70,000 4,880 4,020 11,900 NS ND 1,970 1,980.0 12,600 123 3,170 116,000 1,700Trichloroethene μg/L ND ND ND ND ND NS ND ND ND ND ND ND ND NDTrichlorofluoromethane μg/L ND ND ND ND ND NS ND ND ND ND ND ND ND NDVinyl acetate μg/L ND ND ND ND ND NS ND ND ND ND ND ND ND NDVinyl chloride μg/L ND ND ND ND ND NS ND ND ND ND ND ND ND NDXylene (Total) μg/L 1,610 18,200 1,210 1,040 2,620 NS ND 722 357.0 2,430 69.5 864 26,000 1,930cis-1,2-Dichloroethene μg/L ND ND ND ND ND NS ND ND ND ND ND ND ND NDcis-1,3-Dichloropropene μg/L ND ND ND ND ND NS ND ND ND ND ND ND ND NDtrans-1,2-Dichloroethene μg/L ND ND ND ND ND NS ND ND ND ND ND ND ND ND trans-1,3-Dichloropropene μg/L ND ND ND ND ND NS ND ND ND ND ND ND ND NDtrans-1,4-Dichloro-2-butene μg/L ND ND ND ND ND NS ND ND ND ND ND ND ND NDTotal Volatile Organics μg/L 28,402 525,417 28,469 31,349 38,282 0 9 12,195 11,190 45,070 489 9,274 434,674 4,557
Naphthalene µg/L 756 13,700 382 562 14,000 NS 0 780 1,570 7,680 376 66.6 190 3,650
Notes:
Bold = Analyte Detected
ND = Analyte not detected above laboratory reporting limit
µg/L = Micrograms per liter
Semi-Volatiles
Former Sample IDDate
Table 7Summary of Groundwater Analytical Results (Second Quarter 2016)
Cell 2Former Coke Oven Area Interim Remedial Measures
Sparrows Point, LLC
New Sample ID

Cell 3 Second Quarter 2016 Estimated Hydrocarbon Recovery
Table 8Summary of Operation Conditions
Cell 3: AS/SVE System in the "Cove" AreaFormer Coke Oven Area Interim Remedial Measures
Sparrows Point, LLC
Parameter Units QuantityTotal CATOX Operating Time (April 1, 2016 - June 30, 2016) hours 744Overall CATOX Operational Time % 34.1%Estimated Total Hydrocarbons Destroyed pounds 18.866Estimated Hydrocarbon Removal Rate pounds/hour 0.025357
Cell 3 Cumulative Summary of Estimated Hydrocarbon RecoveryParameter Units Quantity
Total ICE/CATOX Operating Time (August 3, 2010 - June 30, 2016) hours 18,959Overall CATOX Operational Time % 59.0%Estimated Total Hydrocarbons Destroyed pounds 1,680.4Estimated Hydrocarbon Removal Rate pounds/hour 0.09

Units
ug/m3
ug/m3
ug/m3
ug/m3
ug/m3
ug/m3
ug/m3
ug/m3
ug/m3
ug/m3
ug/m3
ug/m3
ug/m3
ug/m3
ug/m3
ug/m3
ug/m3
ug/m3
ug/m3
ug/m3
ug/m3
ug/m3
ug/m3
ug/m3
ug/m3
ug/m3
ug/m3
ug/m3
ug/m3
ug/m3
Notes:VOC concentrations are averages derived from the 3 monthly influent air samples taken during the quarter (one sample taken each month of the quarter)BOLD = Analyte detectedug/m3 = micro grams per cubic meterND = Analyte not detected above laboratory reporting limit
Sample ID CATOX Influent
Benzene 35,100
Date Q2 2016Time
Dilution FactorAnalyte TO-15 Volatile Organics
Table 9Summary of Soil Gas Analytical Results (Second Quarter 2016)
Cell 3: AS/SVE System in the "Cove" AreaFormer Coke Oven Area Interim Remedial Measures
Sparrows Point, LLC
Acetone 8,600
ND
Carbon disulfide NDCarbon tetrachloride ND
2-Butanone (MEK) NDBromoform
Chlorobenzene ND
trans-1,3-Dichloropropene ND
Chloroethane ND
cis-1,3-Dichloropropene ND
Chloroform ND1,1-Dichloroethane ND1,2-Dichloroethane ND
NDtrans-1,2-Dichloroethene
4-Methyl-2-pentanone (MIBK) ND
ND1,2-Dichloropropane ND
Ethylbenzene 55
Total Volatile Organics 48,359
NDTrichloroethene NDVinyl chloride NDm&p-Xylene 714
1,1-Dichloroethene
1,1,2-Trichloroethane1,1,1-Trichloroethane ND
o-Xylene 337
1,1,2,2-Tetrachloroethane NDTetrachloroethene NDToluene 3,553
2-Hexanone NDMethylene Chloride ND

CO30-PZM015 CO101-PZM CO102-PZM CO103-PZM CO104-PZMCO30-PZM015 MW-CELL 3-1 MW-CELL 3-2 MW-CELL 3-3 MW-CELL 3-4
6/23/2016 6/23/2016 6/23/2016 6/23/2016 6/23/2016Analyte Units
1,1,1,2-Tetrachloroethane μg/L ND ND ND ND ND1,1,1-Trichloroethane μg/L ND ND ND ND ND1,1,2,2-Tetrachloroethane μg/L ND ND ND ND ND1,1,2-Trichloroethane μg/L ND ND ND ND ND1,1-Dichloroethane μg/L ND ND ND ND ND1,1-Dichloroethene μg/L ND ND ND ND ND1,2,3-Trichloropropane μg/L ND ND ND ND ND1,2-Dibromo-3-chloropropane μg/L ND ND ND ND ND1,2-Dibromoethane (EDB) μg/L ND ND ND ND ND1,2-Dichlorobenzene μg/L ND ND ND ND ND1,2-Dichloroethane μg/L ND ND ND ND ND1,2-Dichloropropane μg/L ND ND ND ND ND1,4-Dichlorobenzene μg/L ND ND ND ND ND2-Butanone (MEK) μg/L ND ND ND ND ND2-Hexanone μg/L ND ND ND ND ND4-Methyl-2-pentanone (MIBK) μg/L ND ND ND ND NDAcetone μg/L ND ND ND ND NDAcrylonitrile μg/L ND ND ND ND NDBenzene μg/L 71,600 23,800 23,000 37,900 13.7Bromochloromethane μg/L ND ND ND ND NDBromodichloromethane μg/L ND ND ND ND NDBromoform μg/L ND ND ND ND NDBromomethane μg/L ND ND ND ND NDCarbon disulfide μg/L ND ND ND ND NDCarbon tetrachloride μg/L ND ND ND ND NDChlorobenzene μg/L ND ND ND ND NDChloroethane μg/L ND ND ND ND NDChloroform μg/L ND ND ND ND NDChloromethane μg/L ND ND ND ND NDDibromochloromethane μg/L ND ND ND ND NDDibromomethane μg/L ND ND ND ND NDEthylbenzene μg/L 101 31.8 33.7 78 NDIodomethane μg/L ND ND ND ND NDMethyl-tert-butyl ether μg/L ND ND ND ND NDMethylene Chloride μg/L ND ND ND ND NDStyrene μg/L 19.3 10.2 11.1 16.2 NDTetrachloroethene μg/L ND ND ND ND NDToluene μg/L 4,850 1,630 851 3,190 1.4Trichloroethene μg/L ND ND ND ND NDTrichlorofluoromethane μg/L ND ND ND ND NDVinyl acetate μg/L ND ND ND ND NDVinyl chloride μg/L ND ND ND ND NDXylene (Total) μg/L 1,440 368 372 1,330 NDcis-1,2-Dichloroethene μg/L ND ND ND ND NDcis-1,3-Dichloropropene μg/L ND ND ND ND NDtrans-1,2-Dichloroethene μg/L ND ND ND ND NDtrans-1,3-Dichloropropene μg/L ND ND ND ND NDtrans-1,4-Dichloro-2-butene μg/L ND ND ND ND NDTotal Volatile Organics μg/L 78,010 25,840 24,268 42,514 15
Naphthalene µg/L 19,500 4,040 9,900 18,300 5.3
Notes:
Bold = Analyte Detected
ND = Analyte not detected above laboratory reporting limit
µg/L = Micrograms per liter
Semi-Volatiles
Volatile Organics
Table 10Summary of Groundwater Analytical Results (Second Quarter 2016)
Cell 3: AS/SVE System in the "Cove" AreaFormer Coke Oven Area Interim Remedial Measures
Sparrows Point, LLC
Former Sample IDDate
New Sample ID

CO23-PZM008 CO24-PZM007 CO26-PZM007 CO55-PZM000 CO56-PZP001 CO57-PZP002 CO58-PZM001 CO59-PZP002 CO60-PZP001CO23-PZM008 CO24-PZM007 CO26-PZM007 Cell5-MW1 (S) Cell5-MW2 (S) Cell5-MW3 (S) Cell5-MW4 (S) Cell5-MW5 (S) Cell5-MW6 (S)
6/24/2016 6/24/2016 6/24/2016 6/24/2016 6/24/2016 6/24/2016 6/24/2016 6/24/2016 6/24/2016
Analyte Units
1,1,1,2-Tetrachloroethane µg/L ND ND ND ND ND ND ND ND ND1,1,1-Trichloroethane µg/L ND ND ND ND ND ND ND ND ND1,1,2,2-Tetrachloroethane µg/L ND ND ND ND ND ND ND ND ND1,1,2-Trichloroethane µg/L ND ND ND ND ND ND ND ND ND1,1-Dichloroethane µg/L ND ND ND ND ND ND 0.46 ND ND1,1-Dichloroethene µg/L ND ND ND ND ND ND ND ND ND1,2,3-Trichloropropane µg/L ND ND ND ND ND ND ND ND ND1,2-Dibromo-3-chloropropane µg/L ND ND ND ND ND ND ND ND ND1,2-Dibromoethane (EDB) µg/L ND ND ND ND ND ND ND ND ND1,2-Dichlorobenzene µg/L ND ND ND ND ND ND ND ND ND1,2-Dichloroethane µg/L ND ND ND ND ND ND ND ND ND1,2-Dichloropropane µg/L ND ND ND ND ND ND ND ND ND1,4-Dichlorobenzene µg/L ND ND ND ND ND ND ND ND ND2-Butanone (MEK) µg/L ND ND ND ND ND ND ND ND ND2-Hexanone µg/L ND ND ND ND ND ND ND ND ND4-Methyl-2-pentanone (MIBK) µg/L ND ND ND ND ND ND ND ND NDAcetone µg/L ND ND ND 36.1 ND 134 ND ND NDAcrylonitrile µg/L ND ND ND ND ND ND ND ND NDBenzene µg/L 636 5.3 365 8.2 380 ND 247 9.5 189Bromochloromethane µg/L ND ND ND ND ND ND ND ND NDBromodichloromethane µg/L ND ND ND ND ND ND ND ND NDBromoform µg/L ND ND ND ND ND ND ND ND NDBromomethane µg/L ND ND 3.8 ND ND 7.8 ND 4.2 NDCarbon disulfide µg/L ND ND ND ND ND ND ND ND NDCarbon tetrachloride µg/L ND ND ND ND ND ND ND ND NDChlorobenzene µg/L ND ND 0.3 ND ND ND ND ND NDChloroethane µg/L ND ND ND ND ND ND ND ND NDChloroform µg/L ND ND ND ND ND ND ND ND NDChloromethane µg/L ND ND ND ND ND ND ND ND NDDibromochloromethane µg/L ND ND ND ND ND ND ND ND NDDibromomethane µg/L ND ND ND ND ND ND ND ND NDEthylbenzene µg/L 31.6 5.5 16 ND 15.1 ND 13.8 0.6 6.1Iodomethane µg/L ND ND ND ND ND ND ND 4.3 NDMethyl-tert-butyl ether µg/L ND ND ND ND ND ND ND ND NDMethylene Chloride µg/L ND ND ND ND ND ND ND ND NDStyrene µg/L 21.1 ND 83.7 ND 62 ND 36.7 ND 16.2Tetrachloroethene µg/L ND ND ND ND ND ND ND ND NDToluene µg/L 413 4.1 206 4.3 176 ND 93.2 4.7 25.8Trichloroethene µg/L ND ND ND ND ND ND ND ND NDTrichlorofluoromethane µg/L ND ND ND ND ND ND ND ND NDVinyl acetate µg/L ND ND ND ND ND ND ND ND NDVinyl chloride µg/L ND ND ND ND ND ND ND ND NDXylene (Total) µg/L 474 12.2 344 6 281 ND 218 7.4 123cis-1,2-Dichloroethene µg/L ND ND ND ND ND ND ND ND NDcis-1,3-Dichloropropene µg/L ND ND ND ND ND ND ND ND NDtrans-1,2-Dichloroethene µg/L ND ND ND ND ND ND ND ND NDtrans-1,3-Dichloropropene µg/L ND ND ND ND ND ND ND ND NDtrans-1,4-Dichloro-2-butene µg/L ND ND ND ND ND ND ND ND ND
Naphthalene µg/L 9,640 3,950 2,140 92.2 10,800 0.0 3,610 34.7 892Total Volatile Organics µg/L 11,216 3,977 3,159 147 11,714 142 4,219 65 1,252
Notes:
Bold = Analyte Detected
ND = Analyte not detected above laboratory reporting limit
µg/L = Micrograms per liter
Table 11Summary of Groundwater Analytical Results (Second Quarter 2016)
Cell 5 DPE Groundwater Pump and Treat SystemFormer Coke Oven Area Interim Remedial Measures
Sparrows Point, LLC
New Sample ID
Semi-Volatiles
Former Sample IDDateTime
Volatile Organics

Begin End (gal) (lbs) (a) (gal) (lbs) (a)CO123-PZMxxx 8.33 1-Jan-16 On-going (b) 198 1,900 53 509CO125-PZMxxx 2.08 1-Jan-16 On-going (b) 100 960 0 0CO124-PZMxxx 8.82 na na 0 0 0 0
298 2,860 53 509
Notes:
(a) Weight is calculated based on oil density of 1.15 grams per cubic centimeter.
(b) Skimmer
(c ) Bailing
Total Recovery:
Former Coke Oven Area Interim Remedial MeasuresSparrows Point, LLC
Estimate DNAPL Recovered During Second
Quarter 2016
Table 12
Cell 5: DNAPL Recovery SystemDNAPL Occurrence and Recovery
Well IDDNAPL Occurrence
During Second Quarter 2016 (ft)
Total DNAPL Recovery Period Cumulative Total DNAPL Recovered

Begin End (gal) (lbs) (a) (gal) (lbs) (a)CO99-PZMxxx RW-04 0.37 23-Jul-10 On-going (b) 1,818 13,322 120 879CO89-PZMxxx BP-MW-05 1.09 28-Jan-10 On-going (b) 9,832 72,049 201 1,473CO92-PZMxxx BP-MW-08 0.38 8-Sep-10 On-going (b) 1,851 13,564 63 462CO95-PZMxxx BP-MW-11 1.02 23-Jul-10 On-going (b) 2,176 15,946 360 2,638CO97-PZMxxx RW-02 0.04 28-Jan-11 On-going (c) 0.8 6 0 0CO98-PZMxxx RW-03 0.19 24-Nov-10 On-going (c) 118 865 0 0CO96-PZMxxx RW-01 0.19 28-Oct-11 On-going (c) 1.3 10 0 0CO94-PZMxxx BP-MW-10 0.01 na na 0 0 0 0CO91-PZMxxx BP-MW-07 0.08 na na 0 0 0 0CO90-PZMxxx BP-MW-06 0 na na 0 0 0 0CO100-PZMxxx RW-05 0 na na 0 0 0 0CO93-PZMxxx BP-MW-09 0 na na 0 0 0 0CO19-PZM004 CO19-PZM004 0 na na 0 0 0 0
15,797 115,761 744 5,452Notes:
(a) Weight is calculated based on average BP-MW-05 and BP-MW-08 oil density of 0.878 grams per cubic centimeter, measured by EA (2009) by ASTM Method D1481
(b) Skimmer
(c ) Bailing
(d) Cumulative recovery volumes are calculated using an estimated recovery from 12/28/11 to 1/18/12 as well as 5/24/12 to 6/22/12.
Estimate LNAPL Recovered During Second Quarter
2016
Table 13LNAPL Occurrence and Recovery
Cell 6: LNAPL Recovery System in Former Benzol Processing AreaFormer Coke Oven Area Interim Remedial Measures
Sparrows Point, LLC
Former Well ID
Total Recovery:
Well IDLNAPL Occurrence
During Second Quarter 2016 (ft)
Total LNAPL Recovery Period Cumulative Total LNAPL Recovered

Depth to LNAPL
Depth to Water
LNAPL Thickness
Depth to LNAPL
Depth to Water
LNAPL Thickness
Depth to LNAPL
Depth to Water
LNAPL Thickness
6/30/2016 10.76 11.85 1.09 - 10.06 0 10.62 10.70 0.08
Depth to LNAPL
Depth to Water
LNAPL Thickness
Depth to LNAPL
Depth to Water
LNAPL Thickness
Depth to LNAPL
Depth to Water
LNAPL Thickness
6/30/2016 11.81 12.19 0.38 - 10.35 0 7.86 7.87 0.01
Depth to LNAPL
Depth to Water
LNAPL Thickness
Depth to LNAPL
Depth to Water
LNAPL Thickness
Depth to LNAPL
Depth to Water
LNAPL Thickness
6/30/2016 12.45 13.47 1.02 11.01 11.20 0.19 9.67 9.71 0.04
Depth to LNAPL
Depth to Water
LNAPL Thickness
Depth to LNAPL
Depth to Water
LNAPL Thickness
Depth to LNAPL
Depth to Water
LNAPL Thickness
6/30/2016 8.85 9.04 0.19 9.69 10.06 0.37 - 9.56 0
Depth to LNAPL
Depth to Water
LNAPL Thickness
6/30/2016 - 10.28 0
Table 14Depths (feet) to Water and LNAPL
Cell 6: LNAPL Recovery System in Former Benzol Processing AreaFormer Coke Oven Area Interim Remedial Measures
Sparrows Point, LLC
Date
CO90-PZM
DateCO95-PZM
DateCO98-PZM CO99-PZM CO100-PZM
CO93-PZM
.
Date
CO97-PZM
Date
CO96-PZM
CO91-PZM
CO19-PZM004
CO92-PZM
CO89-PZM
CO94-PZM

FIGURES

Cell 5
Cell 2
Cell 6Cell 1
Cell 3
Source: Esri, DigitalGlobe, GeoEye, i-cubed, Earthstar Geographics, CNES/Airbus DS, USDA, USGS, AEX, Getmapping, Aerogrid, IGN, IGP, swisstopo, and theGIS User Community
³ Figure
1Legend
Former COA IM CellsFormer Coke Oven Area Boundary
Former Coke Oven AreaInterim Measures Cell Locations0 300 600
Feet
1 inch = 350 feet
!(!(!(
!(
!(
!(
!(
!(
!(
!(
!(
!(!(
!(
!(
!(
!(
!(
!(
!(
!(
!(
!(
!(!(
!(
!(!(
!(!(
!(
!(
!(
!(
!(
!(
!(
!(
!(
!(
@A
@A
@A
CO02-PZM006
CO93-PZMxxx
CO18-PZM006
Source: Esri, DigitalGlobe, GeoEye, i-cubed, Earthstar Geographics, CNES/Airbus DS, USDA, USGS, AEX, Getmapping, Aerogrid, IGN, IGP, swisstopo, and theGIS User Community
³ Figure
2Former Coke Oven Area
Cell 1 AS/SVE System Layout0 60 120Feet
1 inch = 88 feetLegend
@A Monitoring Well!( Air Sparge Well
!( Vapor Extraction HeaderVapor Collection Trench

9,4399,5139,5789,5799,580 10,982 11,170 11,869 11,903 12,044 12,275 12,422 12,445 12,449 12,501 12,501 12,501 12,524 12,574
3,4485,039 6,515 6,938 7,129 7,527 7,960
594601609623623 1,304 1,343 1,345 1,352 1,396 1,402 1,429 1,448 1,458 1,479 1,630 1,637 1,662 1,68044 95 168 188 271 349 419
56,79756,79759,80661,36062,744
64,825
70,958 74,175
75,802 76,608 78,858
82,156
88,649 90,198
96,409
102,915106,645
110,309
115,761
0
20,000
40,000
60,000
80,000
100,000
120,000
140,000C
umul
ativ
e H
ydro
carb
on R
ecov
ery
(lbs)
Date
Cell 1
Cell 2
Cell 3
Cell 5
Cell 6
Project
Project Number File Number
Date
PE/RG PM DR
Figure
LEGEND
CUMULATIVE SUMMARY OF ESTIMATEDHYDROCARBON RECOVERYFORMER COKE OVEN AREA
INTERIM REMEDIAL MEASURES
Sparrow Point Terminal, LLCBaltimore, Maryland
June 30, 2016
3

0
200,000
400,000
600,000
800,000
1,000,000
1,200,000
Tota
l VO
C (μ
g/L)
Date
CO02-PZM006
CO18-PZM006
CO93-PZMxxx
Project
Date
PE/RG PM DR
Figure
LEGEND
MEASURED GROUNDWATER VOCCONCENTRATION BY MONTH
CELL 1: PROTOTYPE AS/SVE SYSTEMIN THE FORMER BENZOL PROCESSING AREA
Tradepoint Atlantic Baltimore, Maryland
June 30, 2016
4

!(
!(
!(
!(
!(
!(!(
!(
!(!(
!(!(
!(
!( !(!(
!(
!(
!(
!( !(
!(!(
!(!(
@A
@A
@A
@A
@A
@A
@A
@A
@A
@A
@A
@A
@A
@A
CO27-PZM012
CO42-PZM004
CO41-PZM001
CO40-PZM008
CO39-PZM007
CO38-PZM006
CO37-PZM003
CO36-PZM008
CO27-PZM046
CO41-PZM036
CO39-PZM042
CO38-PZM043
CO37-PZM038
CO36-PZM043
CO48-PZM044
CO47-PZM046
CO46-PZM047
CO45-PZM047
CO44-PZM048
CO43-PZM048
Source: Esri, DigitalGlobe, GeoEye, i-cubed, Earthstar Geographics, CNES/Airbus DS, USDA, USGS, AEX, Getmapping, Aerogrid, IGN, IGP, swisstopo, and theGIS User Community
³ Figure
5Former Coke Oven Area
Cell 2 System LayoutAS/SVE and GW P&T0 50 100
Feet
1 inch = 67 feet Legend@A Monitoring Well Shallow Zone@A Monitoring Well Intermediate Zone!( Groundwater Extraction Well!( Reinjection Well
!( Air Sparge Well!( Vapor Extraction Header
Vapor Collection Trench

0
50,000
100,000
150,000
200,000
250,000
Tota
l VO
C (μ
g/L)
Date
CO27-PZM012
CO36-PZM008
CO37-PZM003
CO38-PZM006
CO39-PZM007
CO40-PZM008
CO41-PZM001
CO42-PZM004
Linear(CO38-PZM006)
Project
Date
PE/RG PM DR
Figure
LEGEND
Tradepoint Atlantic Baltimore, Maryland
June 30, 2016
6A
MEASURED GROUNDWATER VOCCONCENTRATION BY MONTH
CELL 2: GROUNDWATER PUMP AND TREAT SYSTEMSHALLOW ZONE

-100,000
0
100,000
200,000
300,000
400,000
500,000
600,000
700,000
800,000
900,000
Tota
l VO
C (μ
g/L)
Date
CO27-PZM046
CO36-PZM043
CO37-PZM038
CO38-PZM043
CO39-PZM042
CO41-PZM036
Linear(CO38-PZM043)
Project
Date
PE/RG PM DR
Figure
LEGEND
Tradepoint Atlantic Baltimore, Maryland
June. 30, 2016
6B
MEASURED GROUNDWATER VOCCONCENTRATION BY MONTH
CELL 2: GROUNDWATER PUMP AND TREAT SYSTEMINTERMEDIATE ZONE

@A
@A
@A
@A
@A
@A
CO27-PZM046
CO41-PZM036
CO39-PZM042
CO38-PZM043
CO37-PZM038
CO36-PZM043
Source: Esri, DigitalGlobe, GeoEye, i-cubed, Earthstar Geographics, CNES/Airbus DS, USDA, USGS, AEX, Getmapping, Aerogrid, IGN, IGP, swisstopo, and theGIS User Community
³ Figure
7Former Coke Oven Area
Cell 2 Monitoring Wells Intermediate ZoneBenzene Concentrations Q2 20160 75 150
Feet
1 inch = 100 feet Legend@A Monitoring Well Intermediate Zone
25,400 ug/L
436,000 ug/L22,900 ug/L
9.0 ug/L
29,300 ug/L
291,000 ug/L
Monitoring Wells Sampled 6/22/2016

!(
!(!(
!(
!(
!(!(
!(!( !( !( !(
!( !(!(
!(!(
!(!(
!(
@A
@A
@A
@A
CO103-PZM
CO102-PZM
CO101-PZM
CO30-PZM015
Source: Esri, DigitalGlobe, GeoEye, i-cubed, Earthstar Geographics, CNES/Airbus DS, USDA, USGS, AEX, Getmapping, Aerogrid, IGN, IGP, swisstopo, and theGIS User Community
³ Figure
8Former Coke Oven Area
Cell 3 AS/SVE System Layout0 50 100Feet
1 inch = 50 feet Legend@A Monitoring Well Shallow Zone!( Air Sparge Well
!( Vapor Extraction HeaderVapor Collection Trench

0
50,000
100,000
150,000
200,000
250,000
300,000
Tota
l VO
C (μ
g/L)
Date
CO30-PZM015
CO101-PZMxxx
CO102-PZMxxx
CO103-PZMxxx
CO104-PZMxxx
Linear (CO30-PZM015)
Linear (CO101-PZMxxx)
Linear (CO102-PZMxxx)
Linear (CO103-PZMxxx)
Project
Date
PE/RG PM DR
Figure
LEGEND
MEASURED GROUNDWATER VOCCONCENTRATION BY MONTHCELL 3: PROTOTYPE AS/SVE SYSTEM IN THE COVE AREA
Tradepoint AtlanticBaltimore, Maryland
June 30, 2016
9
Cell 3 AS/SVE system started on June 24, 2011

@? @?@?
!(!(!(!(
!( !(
!(
!(
!(
!(
!(
!(
!(
!(
!(
!(
!(
!(
@A
@A
@A
@A
@A
@A
@A
@A
@A
CO125-PZM
CO124-PZM
CO123-PZM
CO26-PZM007
CO24-PZM007
CO23-PZM008
CO60-PZP001
CO59-PZP002
CO58-PZM001
CO57-PZP002
CO56-PZP001
CO55-PZM000
Source: Esri, DigitalGlobe, GeoEye, i-cubed, Earthstar Geographics, CNES/Airbus DS, USDA, USGS, AEX, Getmapping, Aerogrid, IGN, IGP, swisstopo, and theGIS User Community
³ Figure
10Former Coke Oven Area
Cell 5 System LayoutDPE System and DNAPL Recovery Pumps0 125 250
Feet
1 inch = 133 feet Legend@A Monitoring Well Shallow Zone!( DPE Well!( Reinjection Well
GW Extraction Area
@? DNAPL Recovery Well
Naphthalene Source Area

0
2,000
4,000
6,000
8,000
10,000
12,000
14,000
Tota
l VO
C (μ
g/L)
Date
CO23-PZM008
CO24-PZM007
CO55-PZM000
CO56-PZP001
CO59-PZP002
CO60PZP001
Linear(CO56-PZP001)
Project
Date
PE/RG PM DR
Figure
LEGEND
Tradepoint AtlanticBaltimore, Maryland
June 30, 2016
11A
MEASURED GROUNDWATER VOCCONCENTRATION BY MONTH
CELL 5: DPE GROUNDWATER PUMPAND TREAT SYSTEM

0
2,000
4,000
6,000
8,000
10,000
12,000
14,000
16,000
Tota
l VO
C (μ
g/L)
Date
CO26-PZM007
CO57-PZP002
CO58-PZM001
Project
Date
PE/RG PM DR
Figure
LEGEND
Tradepoint AtlanticBaltimore, Maryland
June 30, 2016
11B
MEASURED GROUNDWATER VOCCONCENTRATION BY MONTH
CELL 5: DPE GROUNDWATER PUMPAND TREAT SYSTEM

@A
@A
@A
@A
@A
@A
@A
@A
@A
CO26-PZM007
CO24-PZM007
CO23-PZM008
CO60-PZP001
CO59-PZP002
CO58-PZM001
CO57-PZP002
CO56-PZP001
CO55-PZM000
Source: Esri, DigitalGlobe, GeoEye, i-cubed, Earthstar Geographics, CNES/Airbus DS, USDA, USGS, AEX, Getmapping, Aerogrid, IGN, IGP, swisstopo, and theGIS User Community
³ Figure
12Former Coke Oven Area
Cell 5 Monitoring Wells Shallow ZoneNaphthalene Concentrations Q2 20160 150 300
Feet
1 inch = 150 feetLegend
@A Monitoring Well Shallow Zone
3,950 ug/L
9,640 ug/L
892 ug/L
34.7 ug/L2,140 ug/L
3,610 ug/L
Non Detect
10,800 ug/L
92.2 ug/L
Monitoring Wells Sampled 6/24/2016

@A
@A
@A
@A
@A
@A
@A
@A
@A
@A
@A
@A
@A
@A
@A@A
CO98-PZM
CO99-PZM
CO97-PZM
CO96-PZM
CO95-PZM
CO94-PZM
CO93-PZM
CO92-PZMCO91-PZM
CO90-PZM
CO89-PZM
CO128-PZMCO127-PZM
CO126-PZM
CO100-PZM
CO19-PZM004Source: Esri, DigitalGlobe, GeoEye, i-cubed, Earthstar Geographics, CNES/Airbus DS, USDA, USGS, AEX, Getmapping, Aerogrid, IGN, IGP, swisstopo, and theGIS User Community
³ Figure
13Former Coke Oven Area
Cell 6 Monitoring Well Locations0 50 100Feet
1 inch = 50 feetLegend
@A Monitoring Well Shallow ZoneLNAPL Source Area


