Download - Investor Presentation - September 2011
Investor Presentation
September 2011
2
Disclaimer
• This notice may contain estimates for future events. These estimates merely reflect the expectations of
the Company’s management, and involve risks and uncertainties. The Company is not responsible for
investment operations or decisions taken based on information contained in this communication. These
estimates are subject to changes without prior notice.
• This material has been prepared by Multiplus S.A. (“Multiplus“ or the “Company”) includes certain
forward-looking statements that are based principally on Multiplus’ current expectations and on
projections of future events and financial trends that currently affect or might affect Multiplus’ business,
and are not guarantees of future performance. They are based on management’s expectations that
involve a number of business risks and uncertainties, any of each could cause actual financial condition
and results of operations to differ materially from those set out in Multiplus’ forward-looking statements.
Multiplus undertakes no obligation to publicly update or revise any forward looking statements.
• This material is published solely for informational purposes and is not to be construed as a solicitation or
an offer to buy or sell any securities or related financial instruments. Likewise it does not give and should
not be treated as giving investment advice. It has no regard to the specific investment objectives,
financial situation or particular needs of any recipient. No representation or warranty, either express or
implied, is provided in relation to the accuracy, completeness or reliability of the information contained
herein. It should not be regarded by recipients as a substitute for the exercise of their own judgment.
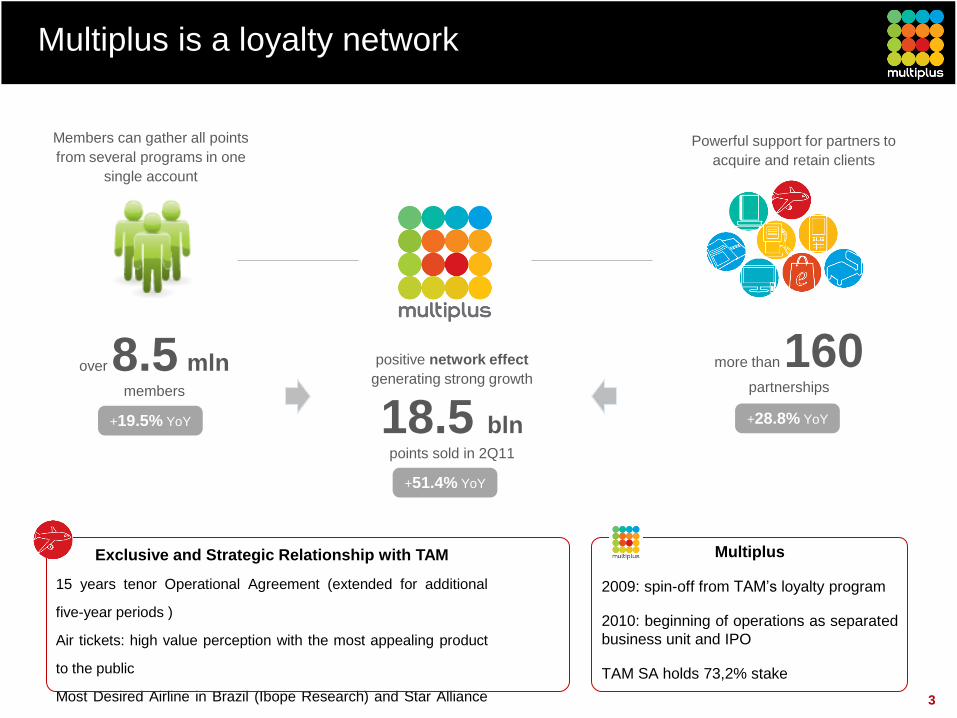
Members can gather all points
from several programs in one
single account
Multiplus is a loyalty network
3
over 8.5 mln members
more than 160 partnerships
+19.5% YoY +28.8% YoY
Powerful support for partners to
acquire and retain clients
positive network effect
generating strong growth
18.5 bln points sold in 2Q11
+51.4% YoY
Exclusive and Strategic Relationship with TAM
15 years tenor Operational Agreement (extended for additional
five-year periods )
Air tickets: high value perception with the most appealing product
to the public
Most Desired Airline in Brazil (Ibope Research) and Star Alliance
member
Multiplus
2009: spin-off from TAM’s loyalty program
2010: beginning of operations as separated
business unit and IPO
TAM SA holds 73,2% stake
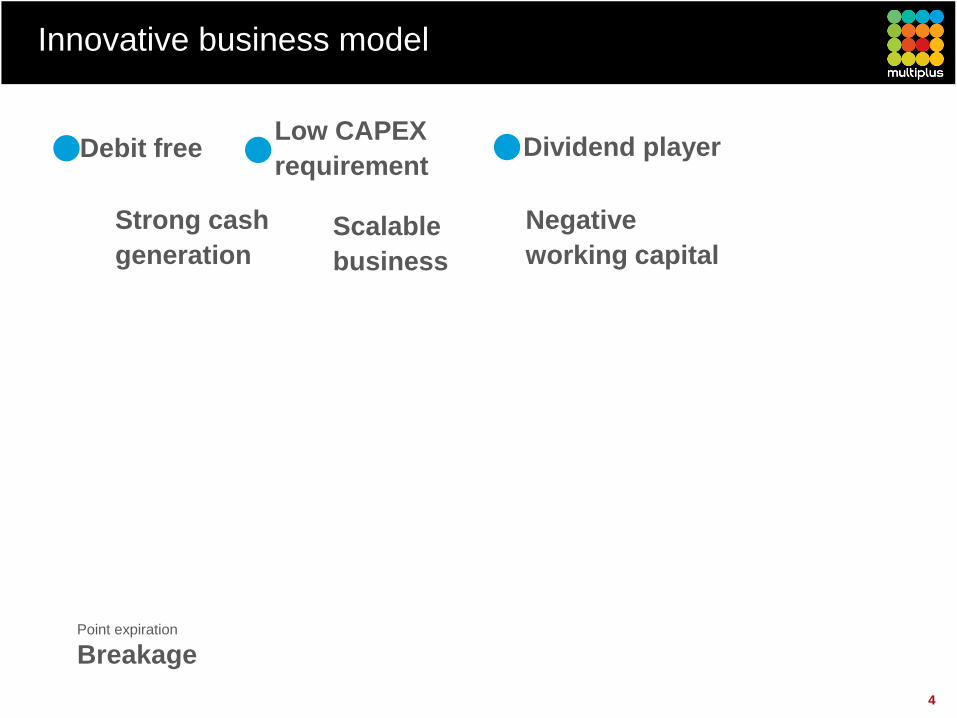
Innovative business model
4
Debit free Dividend player Low CAPEX
requirement
Strong cash
generation
Negative
working capital Scalable
business
Point expiration
Breakage
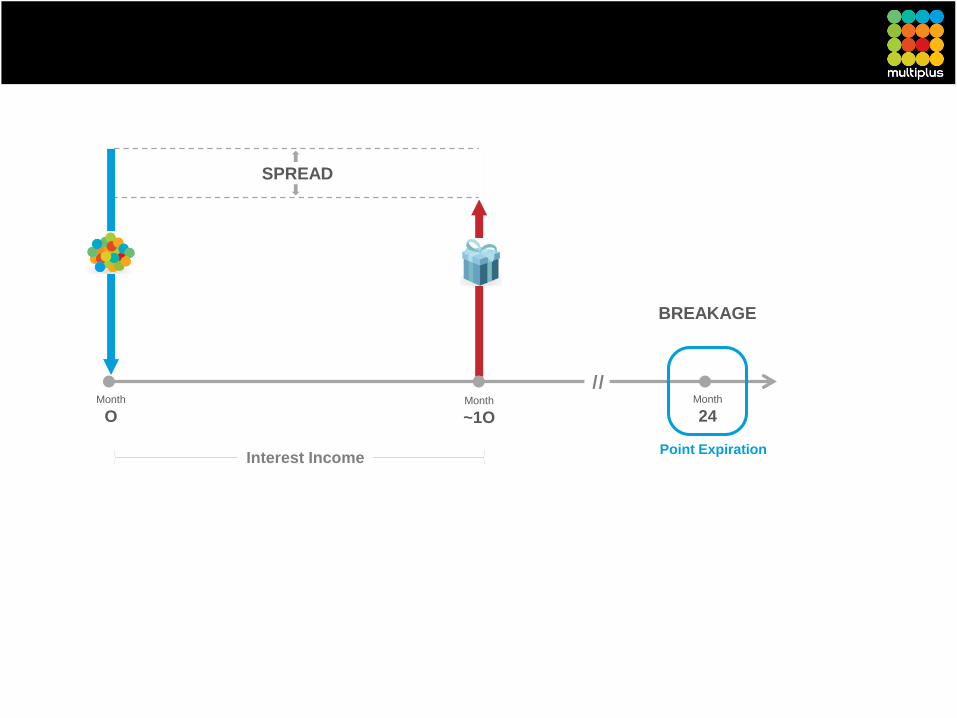
SPREAD
Month
O Month
~1O
Month
24
/ /
BREAKAGE
Point Expiration Interest Income
6
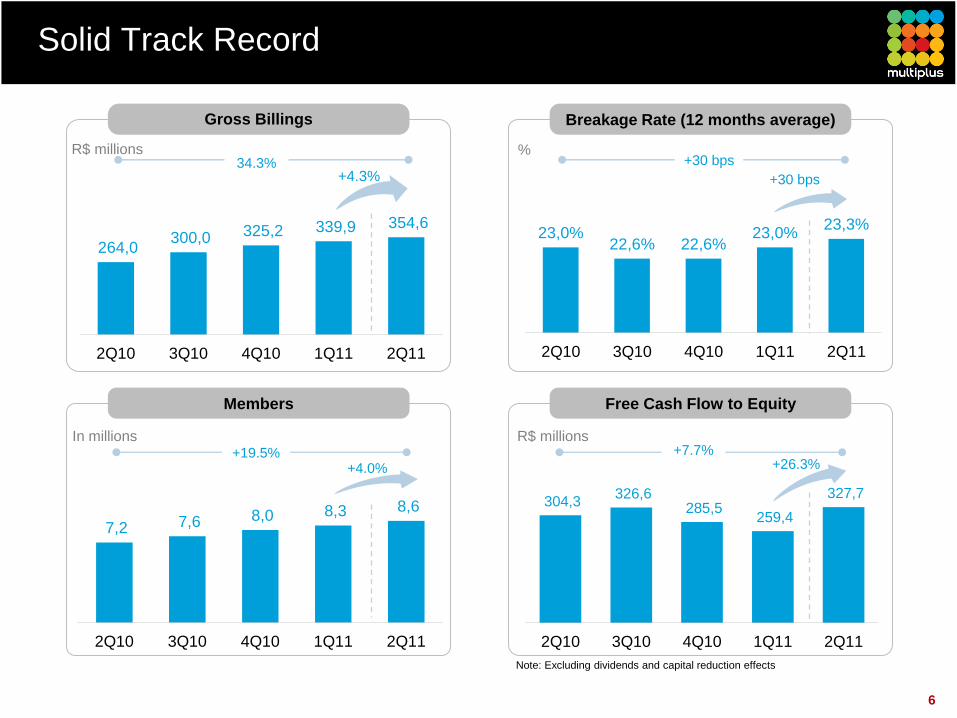
Solid Track Record
R$ millions
Gross Billings
%
Breakage Rate (12 months average)
Members
In millions
Free Cash Flow to Equity
R$ millions
23,0% 22,6% 22,6%
23,0% 23,3%
2Q10 3Q10 4Q10 1Q11 2Q11
+30 bps
+30 bps
7,2 7,6 8,0 8,3 8,6
2Q10 3Q10 4Q10 1Q11 2Q11
+4.0% +19.5%
264,0 300,0 325,2 339,9 354,6
2Q10 3Q10 4Q10 1Q11 2Q11
+4.3% 34.3%
Note: Excluding dividends and capital reduction effects
304,3 326,6
285,5 259,4
327,7
2Q10 3Q10 4Q10 1Q11 2Q11
+7.7% +26.3%
7
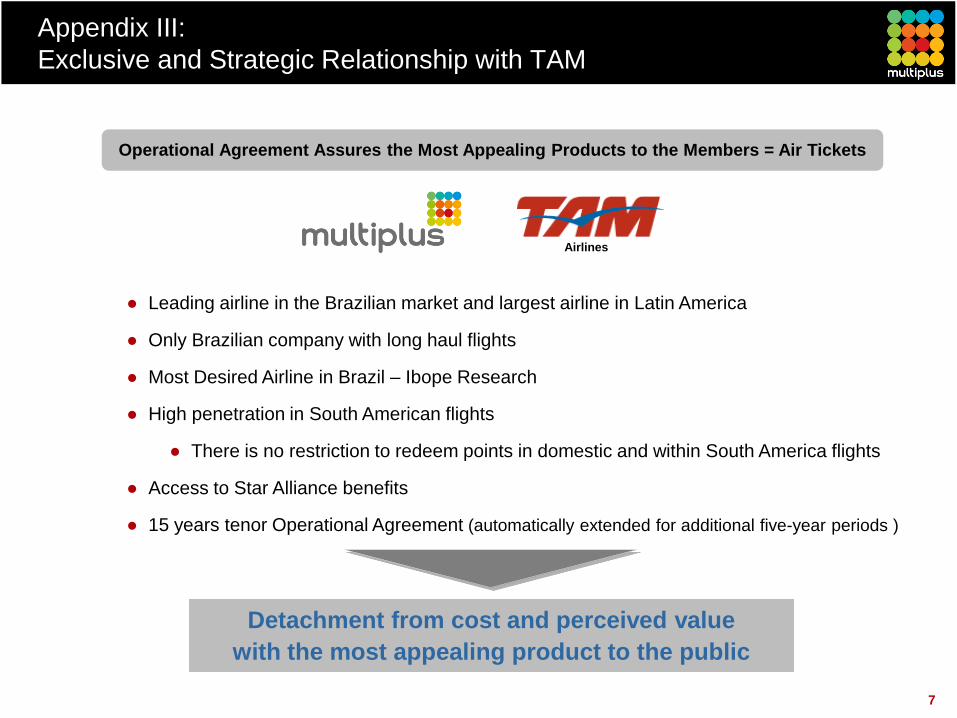
Appendix III:
Exclusive and Strategic Relationship with TAM
● Leading airline in the Brazilian market and largest airline in Latin America
● Only Brazilian company with long haul flights
● Most Desired Airline in Brazil – Ibope Research
● High penetration in South American flights
● There is no restriction to redeem points in domestic and within South America flights
● Access to Star Alliance benefits
● 15 years tenor Operational Agreement (automatically extended for additional five-year periods )
Detachment from cost and perceived value
with the most appealing product to the public
Operational Agreement Assures the Most Appealing Products to the Members = Air Tickets
Airlines
Multiplus
Established as separated business unit in 2009
Beginning of operations and IPO in 2010
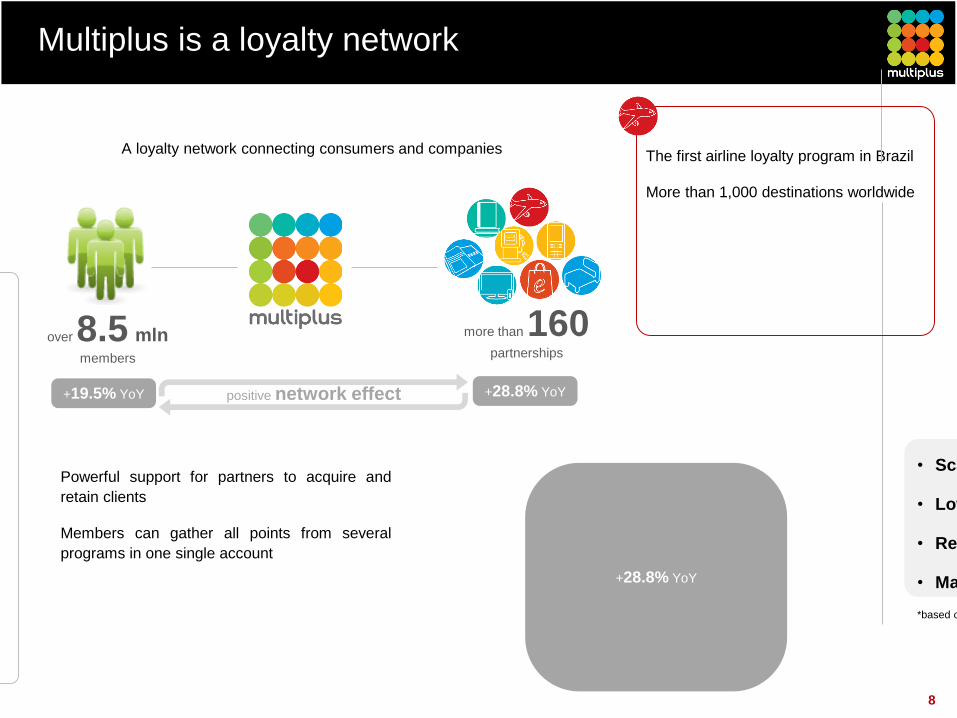
Powerful support for partners to acquire and
retain clients
Members can gather all points from several
programs in one single account
Multiplus is a loyalty network
8
TAM’s Loyalty Program
Launched in 1993 The first airline loyalty program in Brazil
More than 1,000 destinations worldwide
• Scalable business
• Low CAPEX requirement
• Recurring Free Cash Flow
• Market Cap of R$ 4.4 billion*
*based on September 9th 2011
over 8.5 mln members
more than 160 partnerships
positive network effect +19.5% YoY +28.8% YoY
A loyalty network connecting consumers and companies
+28.8% YoY
Multiplus
Established as separated business unit in 2009
Beginning of operations and IPO in 2010
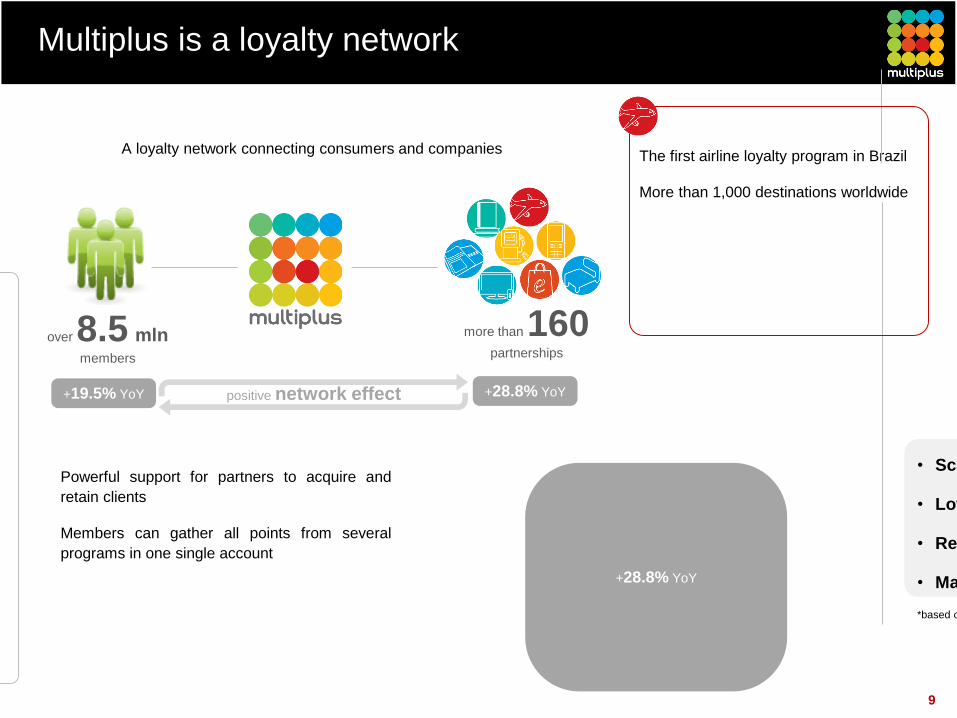
Powerful support for partners to acquire and
retain clients
Members can gather all points from several
programs in one single account
Multiplus is a loyalty network
9
TAM’s Loyalty Program
Launched in 1993 The first airline loyalty program in Brazil
More than 1,000 destinations worldwide
• Scalable business
• Low CAPEX requirement
• Recurring Free Cash Flow
• Market Cap of R$ 4.4 billion*
*based on September 9th 2011
over 8.5 mln members
more than 160 partnerships
positive network effect +19.5% YoY +28.8% YoY
A loyalty network connecting consumers and companies
+28.8% YoY
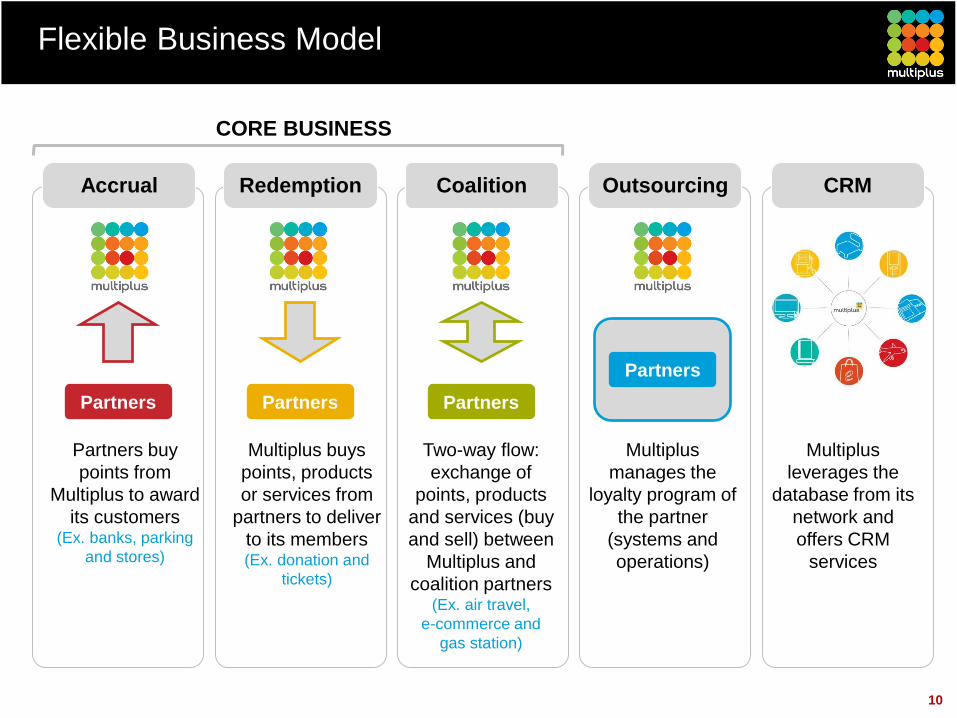
CRM Outsourcing Coalition Redemption
Flexible Business Model
Two-way flow:
exchange of
points, products
and services (buy
and sell) between
Multiplus and
coalition partners (Ex. air travel,
e-commerce and
gas station)
Multiplus
manages the
loyalty program of
the partner
(systems and
operations)
Partners buy
points from
Multiplus to award
its customers (Ex. banks, parking
and stores)
Multiplus
leverages the
database from its
network and
offers CRM
services
Partners Partners Partners
Partners
10
Multiplus buys
points, products
or services from
partners to deliver
to its members (Ex. donation and
tickets)
CORE BUSINESS
Accrual
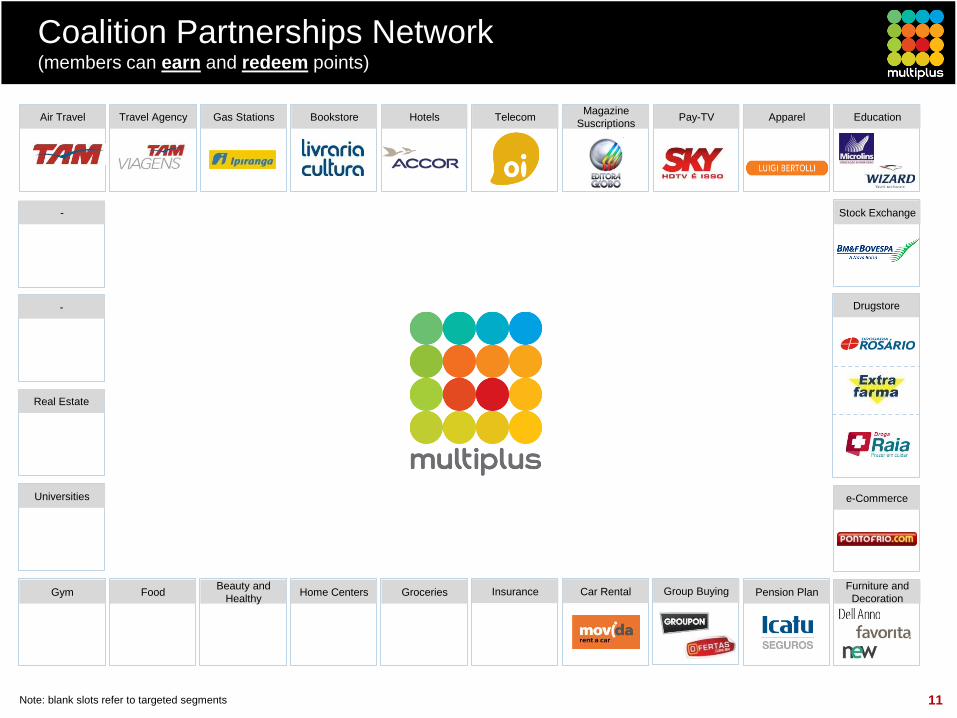
Coalition Partnerships Network (members can earn and redeem points)
11
Pension Plan
Apparel Education Travel Agency Gas Stations Bookstore Magazine
Suscriptions Pay-TV Telecom Hotels Air Travel
-
Universities
Stock Exchange
Furniture and
Decoration Group Buying Food
Beauty and
Healthy Home Centers
-
Groceries Gym
Note: blank slots refer to targeted segments
Drugstore
Real Estate
Insurance Car Rental
e-Commerce
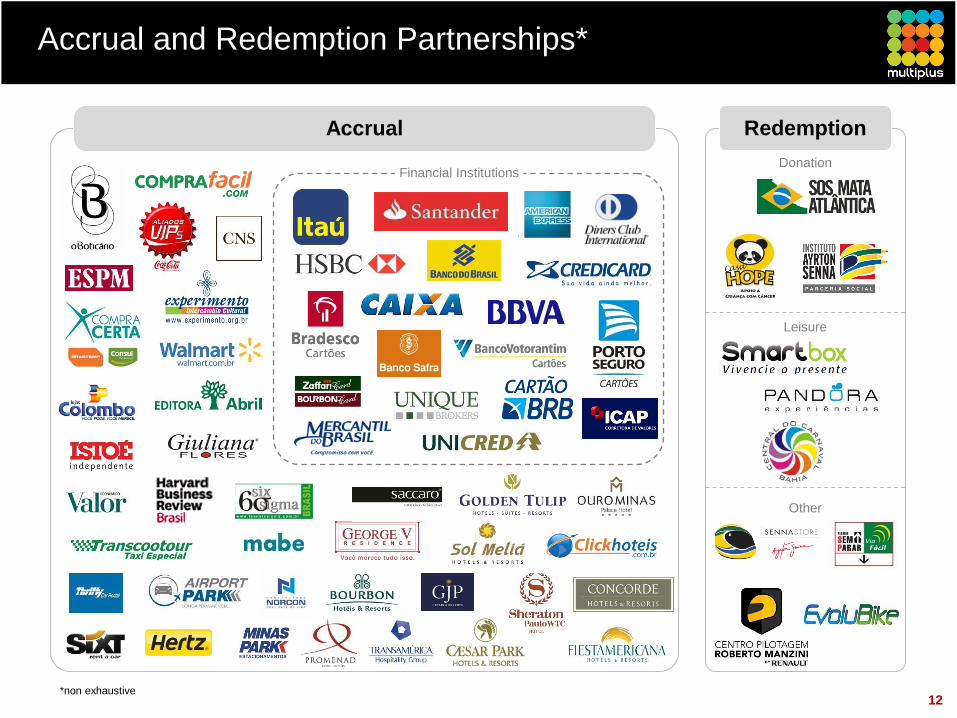
Accrual and Redemption Partnerships*
Redemption Accrual
*non exhaustive
Financial Institutions
12
Donation
Other
Leisure
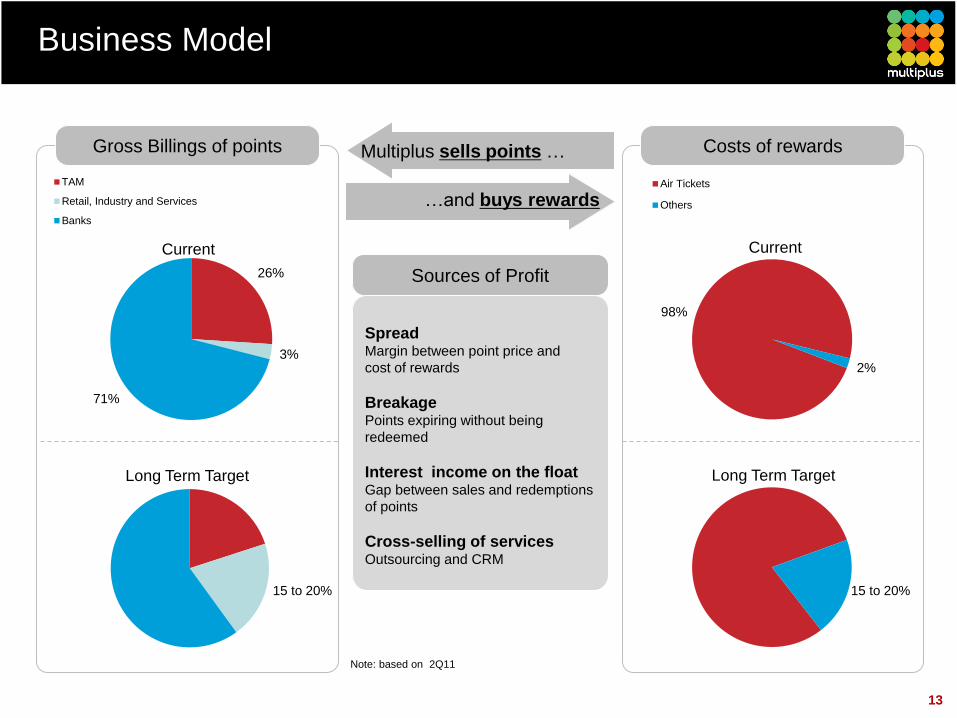
26%
3%
71%
Current
TAM
Retail, Industry and Services
Banks
Business Model
13
Note: based on 2Q11
Sources of Profit
Gross Billings of points Costs of rewards
Long Term Target
98%
2%
Current
Air Tickets
Others
Long Term Target
15 to 20% 15 to 20%
Spread Margin between point price and
cost of rewards
Breakage Points expiring without being
redeemed
Interest income on the float Gap between sales and redemptions
of points
Cross-selling of services Outsourcing and CRM
Multiplus sells points …
…and buys rewards
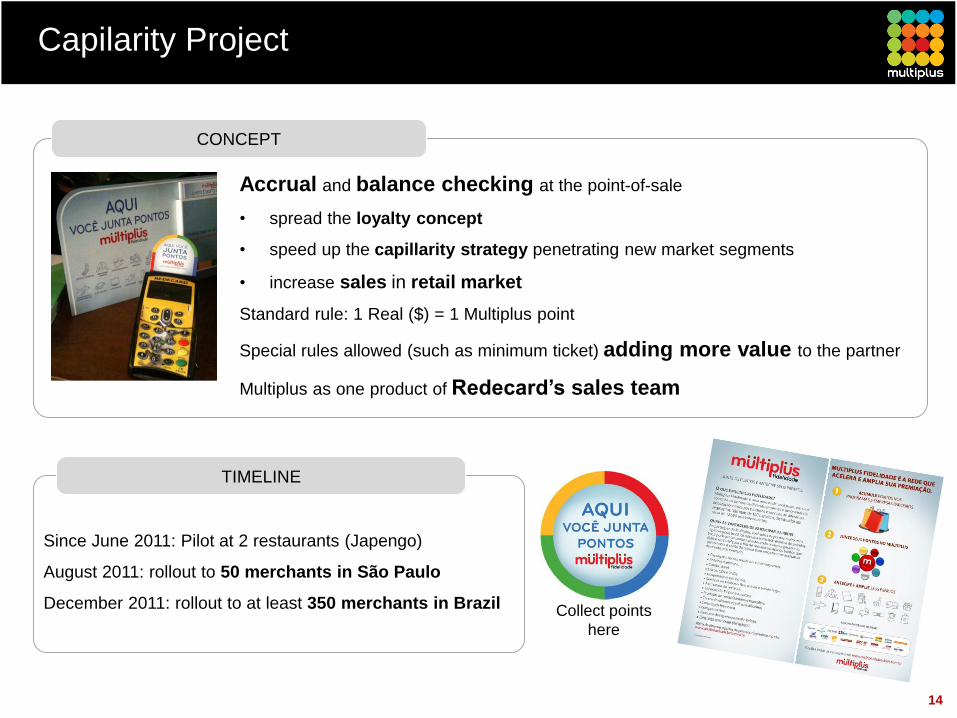
14
Accrual and balance checking at the point-of-sale
• spread the loyalty concept
• speed up the capillarity strategy penetrating new market segments
• increase sales in retail market
Standard rule: 1 Real ($) = 1 Multiplus point
Special rules allowed (such as minimum ticket) adding more value to the partner
Multiplus as one product of Redecard’s sales team
Since June 2011: Pilot at 2 restaurants (Japengo)
August 2011: rollout to 50 merchants in São Paulo
December 2011: rollout to at least 350 merchants in Brazil
CONCEPT
Collect points
here
TIMELINE
Capilarity Project
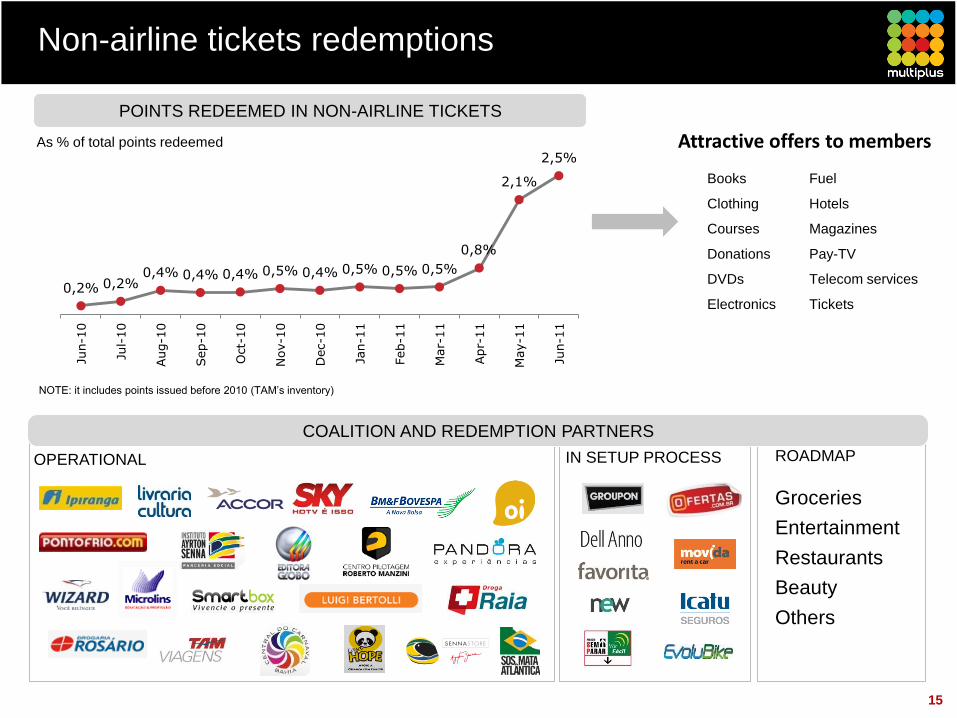
15
Non-airline tickets redemptions
Attractive offers to members
OPERATIONAL IN SETUP PROCESS ROADMAP
COALITION AND REDEMPTION PARTNERS
Groceries
Entertainment
Restaurants
Beauty
Others
Books
Clothing
Courses
Donations
DVDs
Electronics
Fuel
Hotels
Magazines
Pay-TV
Telecom services
Tickets 0,2% 0,2%
0,4% 0,4% 0,4% 0,5% 0,4% 0,5% 0,5% 0,5%
0,8%
2,1%
2,5%
Jun-1
0
Jul-
10
Aug-1
0
Sep-1
0
Oct-
10
Nov-1
0
Dec-1
0
Jan-1
1
Feb-1
1
Mar-
11
Apr-
11
May-1
1
Jun-1
1
POINTS REDEEMED IN NON-AIRLINE TICKETS
As % of total points redeemed
NOTE: it includes points issued before 2010 (TAM’s inventory)
16
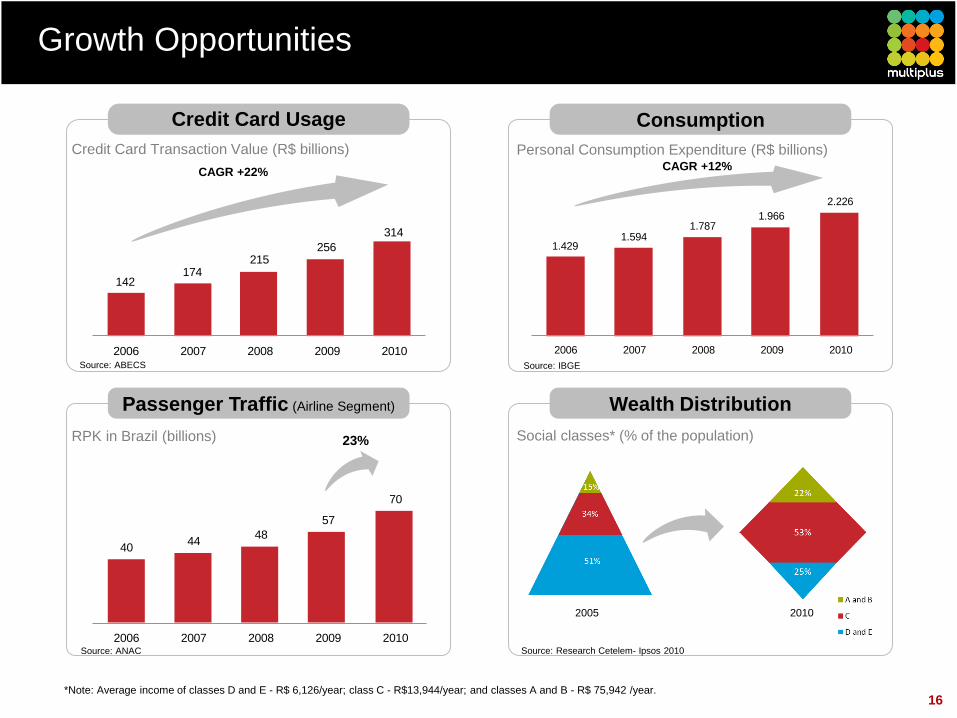
Growth Opportunities
*Note: Average income of classes D and E - R$ 6,126/year; class C - R$13,944/year; and classes A and B - R$ 75,942 /year.
Credit Card Transaction Value (R$ billions)
CAGR +22%
Credit Card Usage
Source: ABECS
Personal Consumption Expenditure (R$ billions) CAGR +12%
Consumption
Source: IBGE
Passenger Traffic (Airline Segment)
RPK in Brazil (billions) 23%
Source: ANAC
Wealth Distribution
Social classes* (% of the population)
Source: Research Cetelem- Ipsos 2010
2005
2010
142174
215256
314
2006 2007 2008 2009 2010
1.4291.594
1.7871.966
2.226
2006 2007 2008 2009 2010
4044
48
57
70
2006 2007 2008 2009 2010
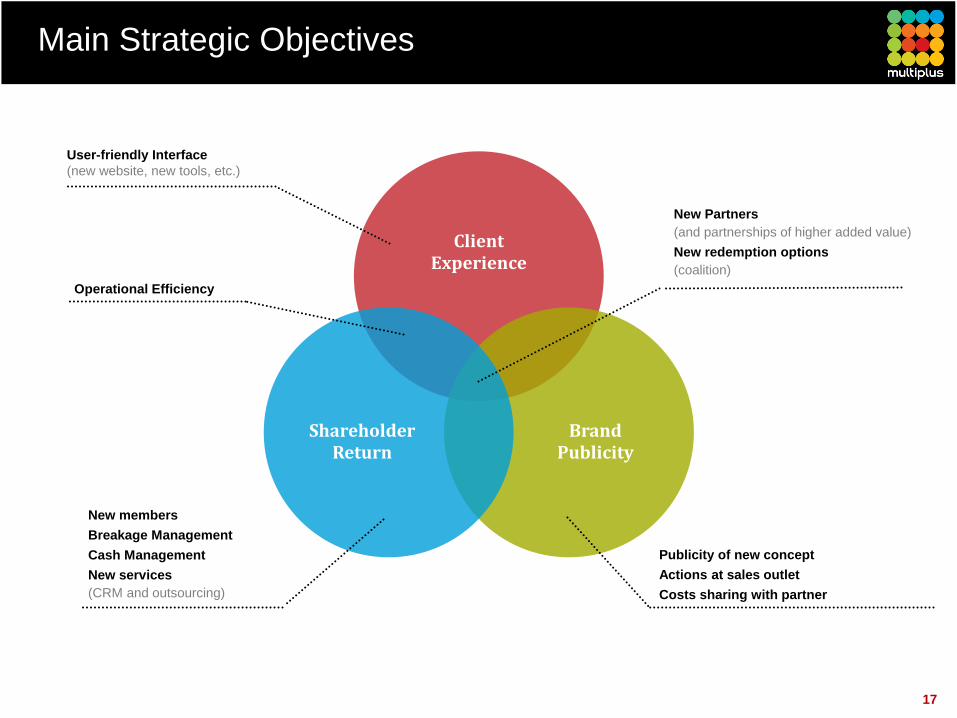
Client Experience
Brand Publicity
Shareholder Return
User-friendly Interface
(new website, new tools, etc.)
Operational Efficiency
New Partners
(and partnerships of higher added value)
New redemption options
(coalition)
New members
Breakage Management
Cash Management
New services
(CRM and outsourcing)
Publicity of new concept
Actions at sales outlet
Costs sharing with partner
Main Strategic Objectives
17
Appendix
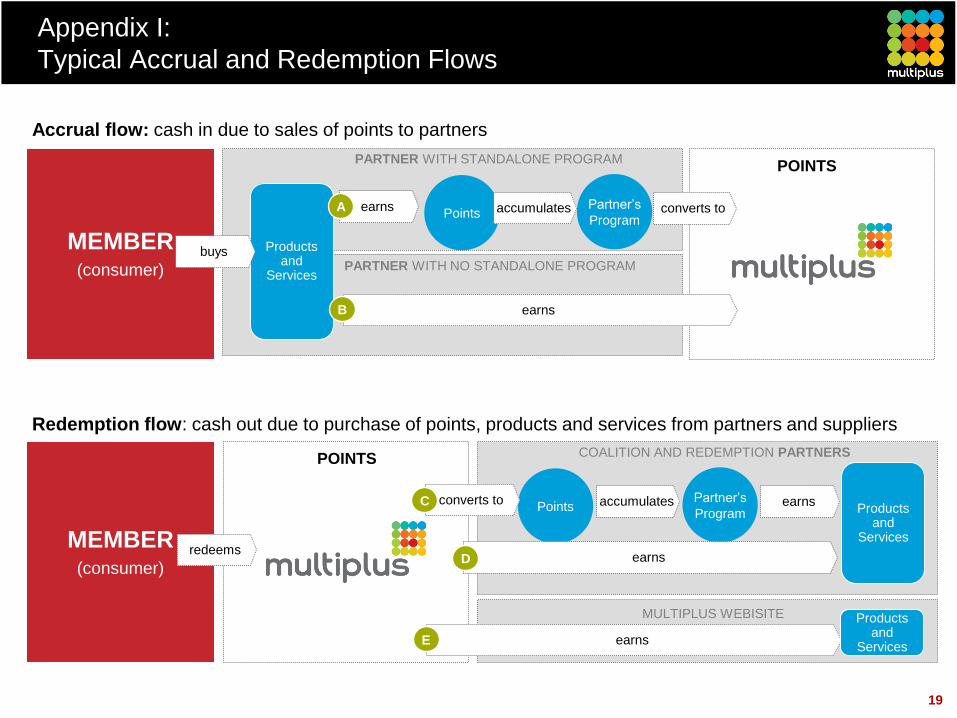
Appendix I:
Typical Accrual and Redemption Flows
19
MEMBER (consumer)
Points earns Partner’s
Program accumulates converts to
PARTNER WITH STANDALONE PROGRAM
PARTNER WITH NO STANDALONE PROGRAM
Accrual flow: cash in due to sales of points to partners
Redemption flow: cash out due to purchase of points, products and services from partners and suppliers
earns
MEMBER (consumer)
Points
redeems
converts to Partner’s
Program accumulates earns
COALITION AND REDEMPTION PARTNERS
earns
Products and
Services
Products and
Services
earns
Products and
Services
buys
POINTS
POINTS
A
B
C
D
E
MULTIPLUS WEBISITE
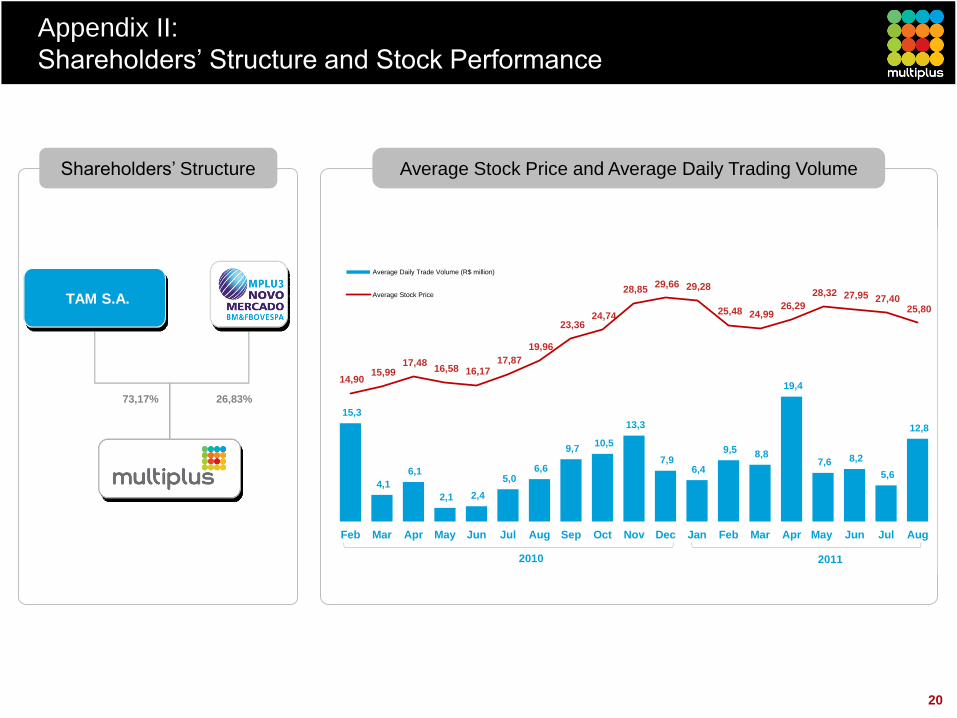
z z 26,83% 73,17%
TAM S.A.
20
Appendix II:
Shareholders’ Structure and Stock Performance
Shareholders’ Structure Average Stock Price and Average Daily Trading Volume
15,3
4,1
6,1
2,1 2,4
5,0 6,6
9,7 10,5
13,3
7,9 6,4
9,5 8,8
19,4
7,6 8,2
5,6
12,8
14,90 15,99
17,48 16,58 16,17
17,87
19,96
23,36 24,74
28,85 29,66 29,28
25,48 24,99 26,29
28,32 27,95 27,40 25,80
Feb Mar Apr May Jun Jul Aug Sep Oct Nov Dec Jan Feb Mar Apr May Jun Jul Aug
Average Daily Trade Volume (R$ million)
Average Stock Price
2010 2011
52,8
46,9
35,7
31,0
27,6 27,3
23,7 23,5
21,0
18,0
15,7
13,4 13,0
9,5 9,4
4,4 3,8 2,3
Fly
Buys N
ZL
Fly
Buys A
US
Qa
nta
s P
rog
ram
AU
S
AirM
iles C
AN
Necta
r U
K
Fly
ing B
lue F
RA
LA
NP
AS
S C
HL
Sky M
iles U
SA
AA
dvan
tage U
SA
Mile
s&
Mo
re D
EU
JA
L M
ileage B
ank J
PN
Ae
ropla
n C
AN
AirM
iles U
K
Necta
r IT
A
Ve
locity A
US
Mu
ltip
lus B
RA
Sm
iles B
RA
Clu
b P
rem
ier
ME
X
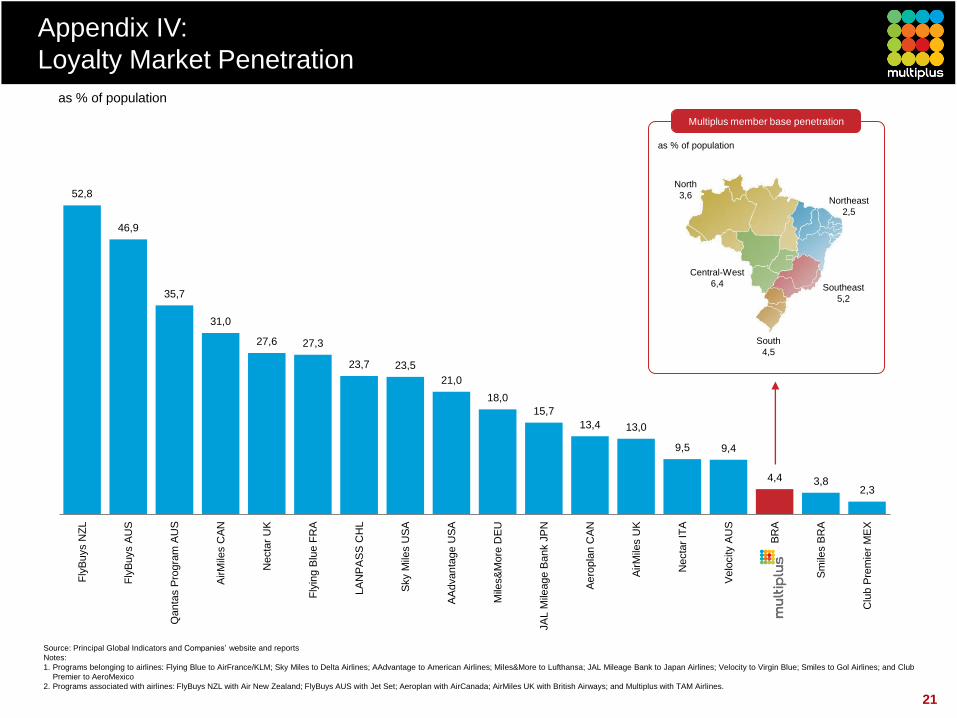
Source: Principal Global Indicators and Companies’ website and reports
Notes:
1. Programs belonging to airlines: Flying Blue to AirFrance/KLM; Sky Miles to Delta Airlines; AAdvantage to American Airlines; Miles&More to Lufthansa; JAL Mileage Bank to Japan Airlines; Velocity to Virgin Blue; Smiles to Gol Airlines; and Club
Premier to AeroMexico
2. Programs associated with airlines: FlyBuys NZL with Air New Zealand; FlyBuys AUS with Jet Set; Aeroplan with AirCanada; AirMiles UK with British Airways; and Multiplus with TAM Airlines.
Appendix IV:
Loyalty Market Penetration
as % of population
as % of population
North
3,6 Northeast
2,5
Central-West
6,4 Southeast
5,2
South
4,5
21
Multiplus member base penetration
22
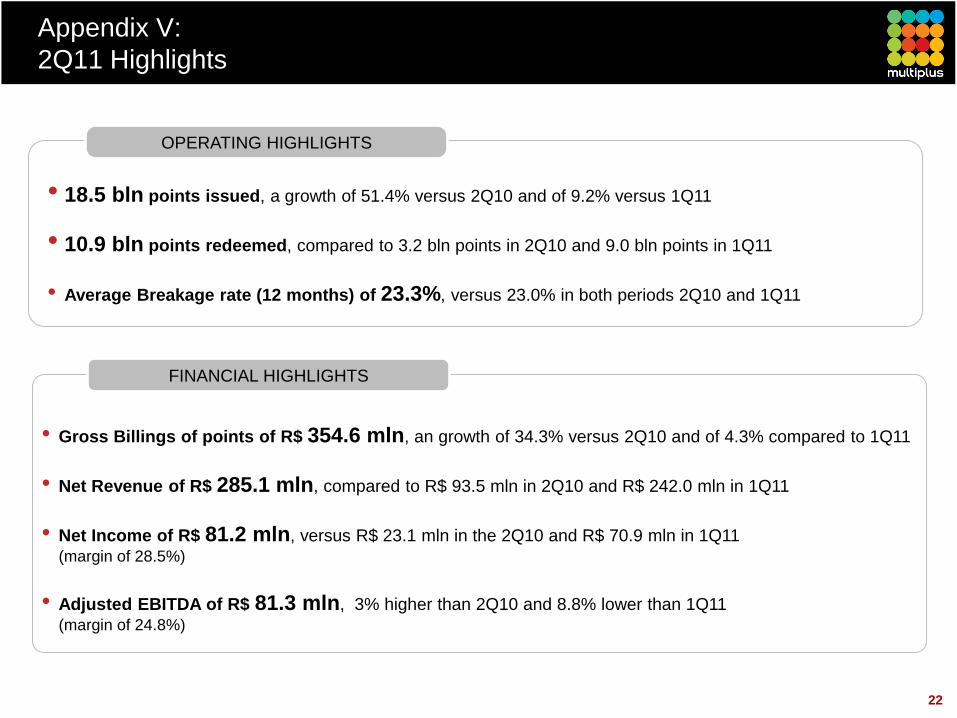
Appendix V:
2Q11 Highlights
OPERATING HIGHLIGHTS
• 18.5 bln points issued, a growth of 51.4% versus 2Q10 and of 9.2% versus 1Q11
• 10.9 bln points redeemed, compared to 3.2 bln points in 2Q10 and 9.0 bln points in 1Q11
• Average Breakage rate (12 months) of 23.3%, versus 23.0% in both periods 2Q10 and 1Q11
FINANCIAL HIGHLIGHTS
• Gross Billings of points of R$ 354.6 mln, an growth of 34.3% versus 2Q10 and of 4.3% compared to 1Q11
• Net Revenue of R$ 285.1 mln, compared to R$ 93.5 mln in 2Q10 and R$ 242.0 mln in 1Q11
• Net Income of R$ 81.2 mln, versus R$ 23.1 mln in the 2Q10 and R$ 70.9 mln in 1Q11
(margin of 28.5%)
• Adjusted EBITDA of R$ 81.3 mln, 3% higher than 2Q10 and 8.8% lower than 1Q11
(margin of 24.8%)
23
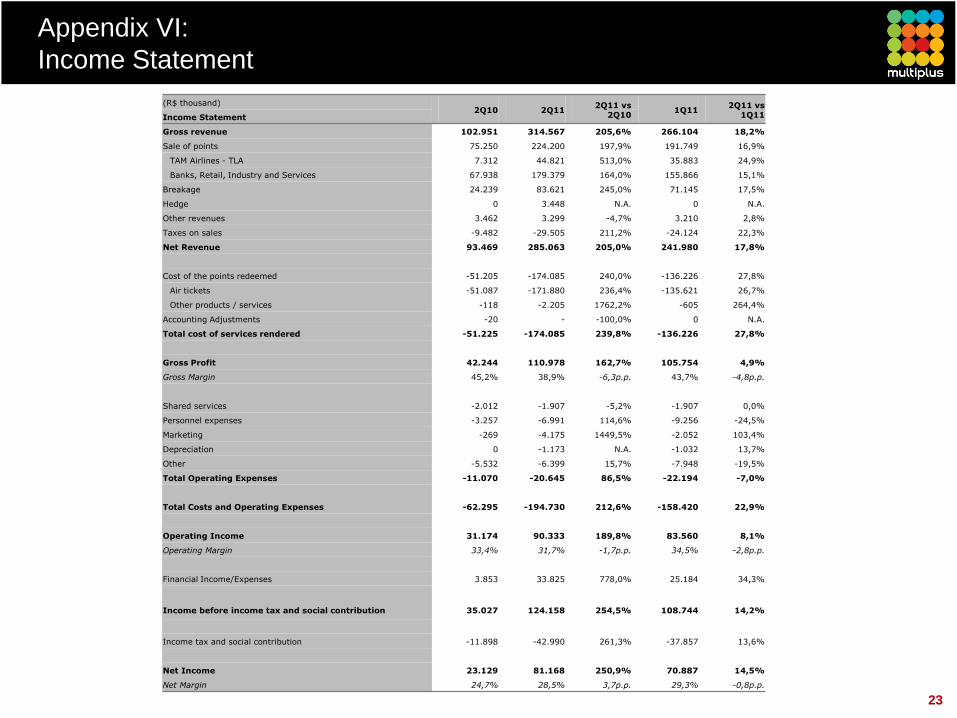
Appendix VI:
Income Statement
(R$ thousand) 2Q10 2Q11
2Q11 vs 2Q10
1Q11 2Q11 vs
1Q11 Income Statement
Gross revenue 102.951 314.567 205,6% 266.104 18,2%
Sale of points 75.250 224.200 197,9% 191.749 16,9%
TAM Airlines - TLA 7.312 44.821 513,0% 35.883 24,9%
Banks, Retail, Industry and Services 67.938 179.379 164,0% 155.866 15,1%
Breakage 24.239 83.621 245,0% 71.145 17,5%
Hedge 0 3.448 N.A. 0 N.A.
Other revenues 3.462 3.299 -4,7% 3.210 2,8%
Taxes on sales -9.482 -29.505 211,2% -24.124 22,3%
Net Revenue 93.469 285.063 205,0% 241.980 17,8%
Cost of the points redeemed -51.205 -174.085 240,0% -136.226 27,8%
Air tickets -51.087 -171.880 236,4% -135.621 26,7%
Other products / services -118 -2.205 1762,2% -605 264,4%
Accounting Adjustments -20 - -100,0% 0 N.A.
Total cost of services rendered -51.225 -174.085 239,8% -136.226 27,8%
Gross Profit 42.244 110.978 162,7% 105.754 4,9%
Gross Margin 45,2% 38,9% -6,3p.p. 43,7% -4,8p.p.
Shared services -2.012 -1.907 -5,2% -1.907 0,0%
Personnel expenses -3.257 -6.991 114,6% -9.256 -24,5%
Marketing -269 -4.175 1449,5% -2.052 103,4%
Depreciation 0 -1.173 N.A. -1.032 13,7%
Other -5.532 -6.399 15,7% -7.948 -19,5%
Total Operating Expenses -11.070 -20.645 86,5% -22.194 -7,0%
Total Costs and Operating Expenses -62.295 -194.730 212,6% -158.420 22,9%
Operating Income 31.174 90.333 189,8% 83.560 8,1%
Operating Margin 33,4% 31,7% -1,7p.p. 34,5% -2,8p.p.
Financial Income/Expenses 3.853 33.825 778,0% 25.184 34,3%
Income before income tax and social contribution 35.027 124.158 254,5% 108.744 14,2%
Income tax and social contribution -11.898 -42.990 261,3% -37.857 13,6%
Net Income 23.129 81.168 250,9% 70.887 14,5%
Net Margin 24,7% 28,5% 3,7p.p. 29,3% -0,8p.p.
24
Appendix VII:
Currency Hedge
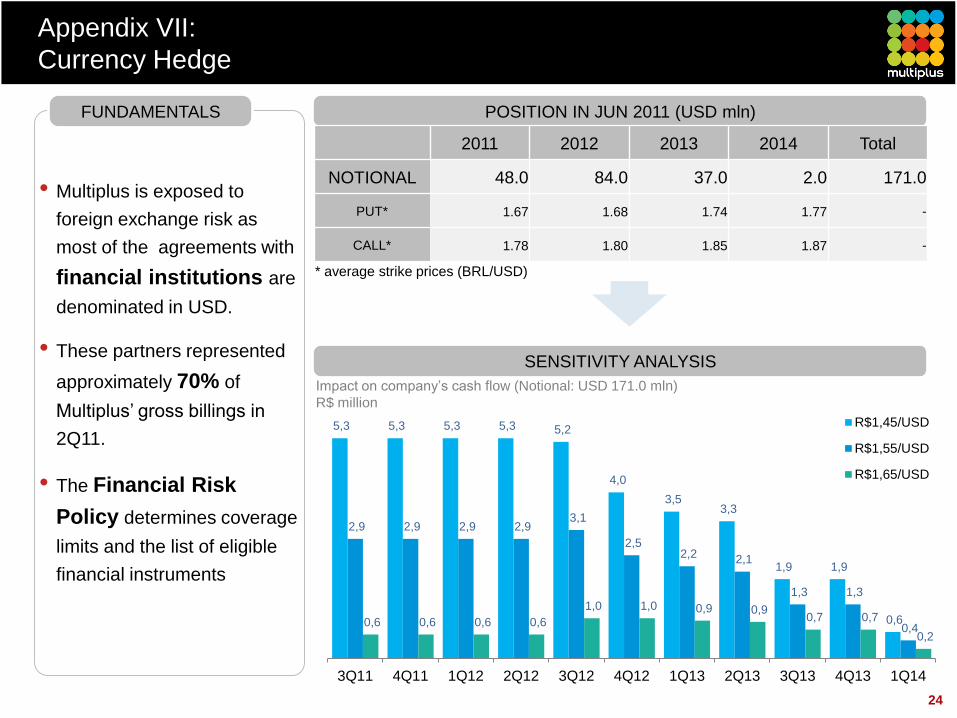
FUNDAMENTALS
• Multiplus is exposed to
foreign exchange risk as
most of the agreements with
financial institutions are
denominated in USD.
• These partners represented
approximately 70% of
Multiplus’ gross billings in
2Q11.
• The Financial Risk
Policy determines coverage
limits and the list of eligible
financial instruments
5,3 5,3 5,3 5,3 5,2
4,0
3,5 3,3
1,9 1,9
0,6
2,9 2,9 2,9 2,9 3,1
2,5 2,2 2,1
1,3 1,3
0,4 0,6 0,6 0,6 0,6
1,0 1,0 0,9 0,9 0,7 0,7
0,2
3Q11 4Q11 1Q12 2Q12 3Q12 4Q12 1Q13 2Q13 3Q13 4Q13 1Q14
R$1,45/USD
R$1,55/USD
R$1,65/USD
SENSITIVITY ANALYSIS
Impact on company’s cash flow (Notional: USD 171.0 mln)
R$ million
POSITION IN JUN 2011 (USD mln)
2011 2012 2013 2014 Total
NOTIONAL 48.0 84.0 37.0 2.0 171.0
PUT* 1.67 1.68 1.74 1.77 -
CALL* 1.78 1.80 1.85 1.87 -
* average strike prices (BRL/USD)
25
Appendix VIII:
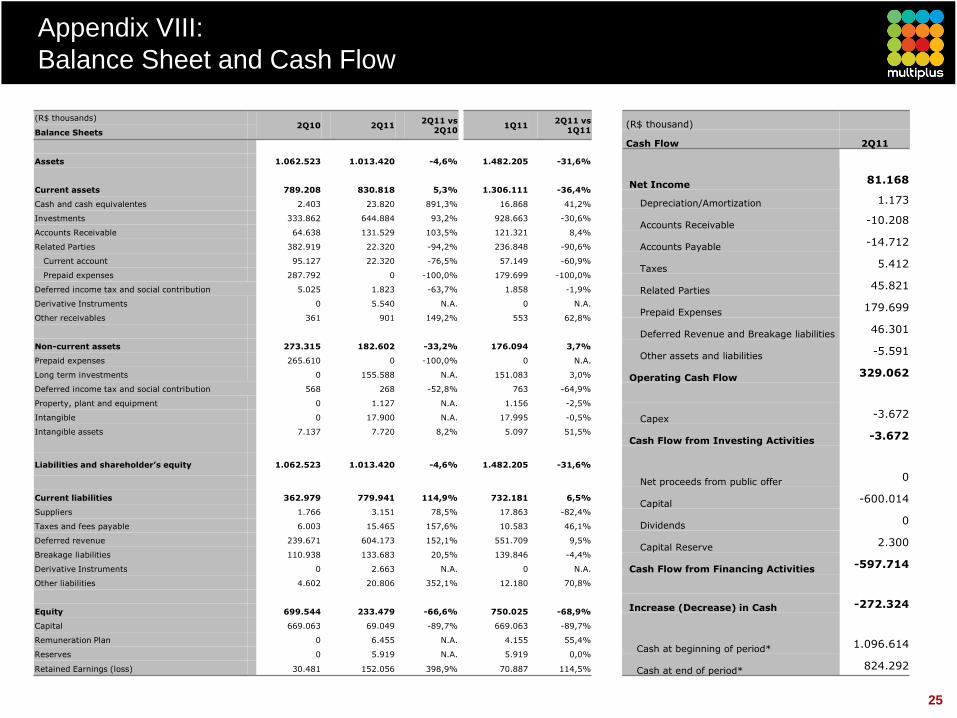
Balance Sheet and Cash Flow
(R$ thousand)
Cash Flow 2Q11
Net Income 81.168
Depreciation/Amortization 1.173
Accounts Receivable -10.208
Accounts Payable -14.712
Taxes 5.412
Related Parties 45.821
Prepaid Expenses 179.699
Deferred Revenue and Breakage liabilities 46.301
Other assets and liabilities -5.591
Operating Cash Flow 329.062
Capex -3.672
Cash Flow from Investing Activities -3.672
Net proceeds from public offer 0
Capital -600.014
Dividends 0
Capital Reserve 2.300
Cash Flow from Financing Activities -597.714
Increase (Decrease) in Cash -272.324
Cash at beginning of period* 1.096.614
Cash at end of period* 824.292
(R$ thousands) 2Q10 2Q11
2Q11 vs 2Q10
1Q11 2Q11 vs
1Q11 Balance Sheets
Assets 1.062.523 1.013.420 -4,6% 1.482.205 -31,6%
Current assets 789.208 830.818 5,3% 1.306.111 -36,4%
Cash and cash equivalentes 2.403 23.820 891,3% 16.868 41,2%
Investments 333.862 644.884 93,2% 928.663 -30,6%
Accounts Receivable 64.638 131.529 103,5% 121.321 8,4%
Related Parties 382.919 22.320 -94,2% 236.848 -90,6%
Current account 95.127 22.320 -76,5% 57.149 -60,9%
Prepaid expenses 287.792 0 -100,0% 179.699 -100,0%
Deferred income tax and social contribution 5.025 1.823 -63,7% 1.858 -1,9%
Derivative Instruments 0 5.540 N.A. 0 N.A.
Other receivables 361 901 149,2% 553 62,8%
Non-current assets 273.315 182.602 -33,2% 176.094 3,7%
Prepaid expenses 265.610 0 -100,0% 0 N.A.
Long term investments 0 155.588 N.A. 151.083 3,0%
Deferred income tax and social contribution 568 268 -52,8% 763 -64,9%
Property, plant and equipment 0 1.127 N.A. 1.156 -2,5%
Intangible 0 17.900 N.A. 17.995 -0,5%
Intangible assets 7.137 7.720 8,2% 5.097 51,5%
Liabilities and shareholder’s equity 1.062.523 1.013.420 -4,6% 1.482.205 -31,6%
Current liabilities 362.979 779.941 114,9% 732.181 6,5%
Suppliers 1.766 3.151 78,5% 17.863 -82,4%
Taxes and fees payable 6.003 15.465 157,6% 10.583 46,1%
Deferred revenue 239.671 604.173 152,1% 551.709 9,5%
Breakage liabilities 110.938 133.683 20,5% 139.846 -4,4%
Derivative Instruments 0 2.663 N.A. 0 N.A.
Other liabilities 4.602 20.806 352,1% 12.180 70,8%
Equity 699.544 233.479 -66,6% 750.025 -68,9%
Capital 669.063 69.049 -89,7% 669.063 -89,7%
Remuneration Plan 0 6.455 N.A. 4.155 55,4%
Reserves 0 5.919 N.A. 5.919 0,0%
Retained Earnings (loss) 30.481 152.056 398,9% 70.887 114,5%
26
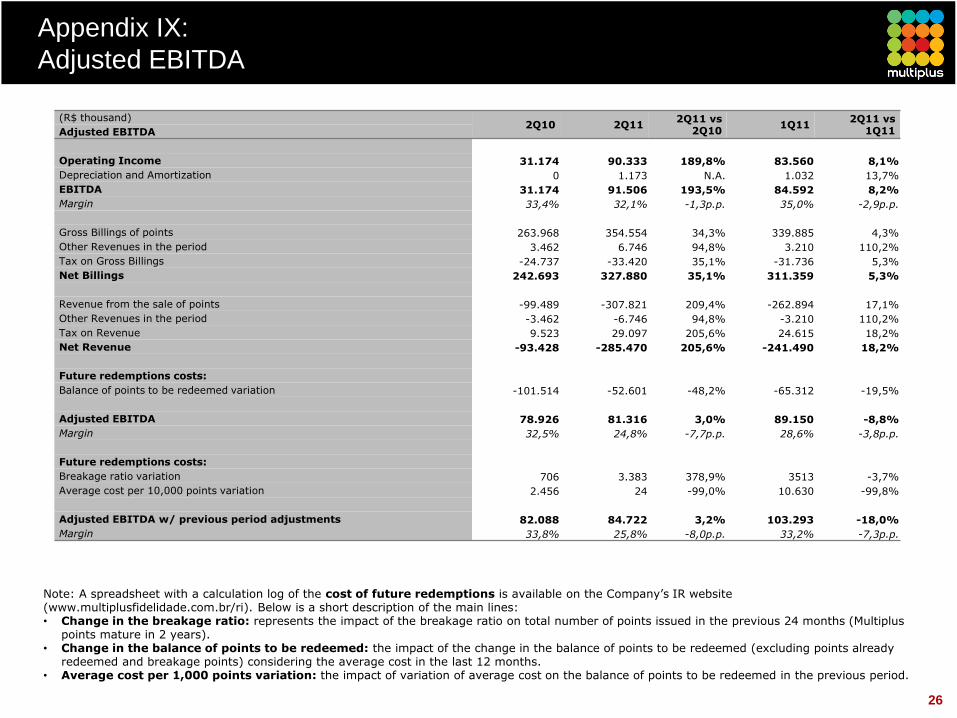
Appendix IX:
Adjusted EBITDA
Note: A spreadsheet with a calculation log of the cost of future redemptions is available on the Company’s IR website (www.multiplusfidelidade.com.br/ri). Below is a short description of the main lines: • Change in the breakage ratio: represents the impact of the breakage ratio on total number of points issued in the previous 24 months (Multiplus
points mature in 2 years). • Change in the balance of points to be redeemed: the impact of the change in the balance of points to be redeemed (excluding points already
redeemed and breakage points) considering the average cost in the last 12 months. • Average cost per 1,000 points variation: the impact of variation of average cost on the balance of points to be redeemed in the previous period.
(R$ thousand) 2Q10 2Q11
2Q11 vs 2Q10
1Q11 2Q11 vs
1Q11 Adjusted EBITDA
Operating Income 31.174 90.333 189,8% 83.560 8,1%
Depreciation and Amortization 0 1.173 N.A. 1.032 13,7%
EBITDA 31.174 91.506 193,5% 84.592 8,2%
Margin 33,4% 32,1% -1,3p.p. 35,0% -2,9p.p.
Gross Billings of points 263.968 354.554 34,3% 339.885 4,3%
Other Revenues in the period 3.462 6.746 94,8% 3.210 110,2%
Tax on Gross Billings -24.737 -33.420 35,1% -31.736 5,3%
Net Billings 242.693 327.880 35,1% 311.359 5,3%
Revenue from the sale of points -99.489 -307.821 209,4% -262.894 17,1%
Other Revenues in the period -3.462 -6.746 94,8% -3.210 110,2%
Tax on Revenue 9.523 29.097 205,6% 24.615 18,2%
Net Revenue -93.428 -285.470 205,6% -241.490 18,2%
Future redemptions costs:
Balance of points to be redeemed variation -101.514 -52.601 -48,2% -65.312 -19,5%
Adjusted EBITDA 78.926 81.316 3,0% 89.150 -8,8%
Margin 32,5% 24,8% -7,7p.p. 28,6% -3,8p.p.
Future redemptions costs:
Breakage ratio variation 706 3.383 378,9% 3513 -3,7%
Average cost per 10,000 points variation 2.456 24 -99,0% 10.630 -99,8%
Adjusted EBITDA w/ previous period adjustments 82.088 84.722 3,2% 103.293 -18,0%
Margin 33,8% 25,8% -8,0p.p. 33,2% -7,3p.p.