
International Center for Leadership in Education
Dr. Willard R. Daggett
Right Now!

International Center for Leadership in Education
Dr. Willard R. Daggett
Tools For ChangeTools For ChangeJJuly 19, 2007uly 19, 2007

• Identify the essential characteristics of successful schools
• Best Practices/Research to assist schools
• Organize into useful tools

Right Now!

Well Positioned
• Long and rich history
• You are not Kodak
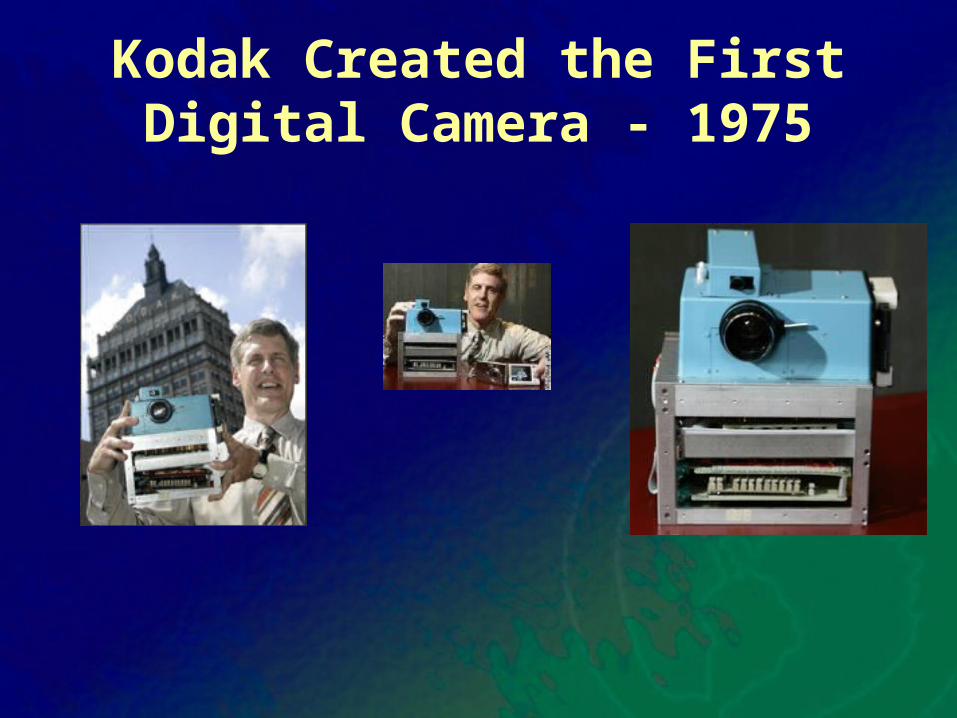
Kodak Created the First Digital Camera - 1975
The Right People

The Right People
In the Right Places

The Right People
In the Right Places
Right Now !

Right Now!

WhyWhy WhatWhat HowHow
Change ProcessChange Process
Skills Gap

Application ModelApplication Model
1.1. Knowledge in one disciplineKnowledge in one discipline
2. Application within discipline2. Application within discipline
3. Application across disciplines3. Application across disciplines
4. Application to real-world 4. Application to real-world predictable situationspredictable situations
5. Application to real-world 5. Application to real-world unpredictable situationsunpredictable situations

WhyWhy WhatWhat HowHow
Change ProcessChange Process

Education exists in the larger context of society.

When society changes – so too must education if it is to
remain viable!

• E-mail• Web pages• Google• iPODs• Laptops• Digital cameras• Doppler radar• Cell Phones• Debit cards

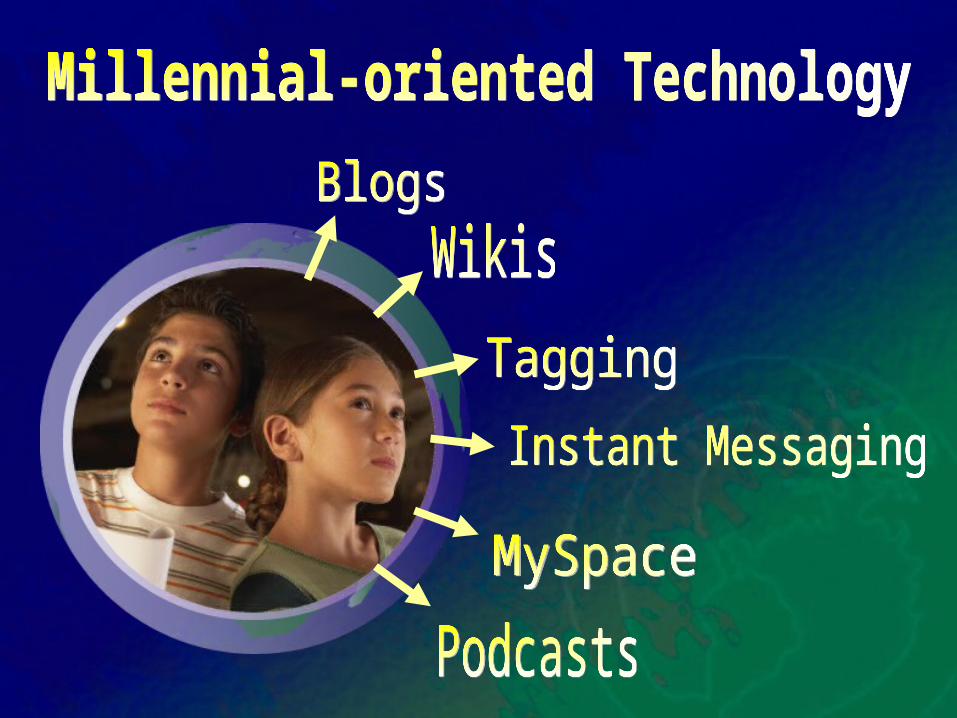
• Blogs
• Wikis
• Tagging
• Text messaging
• MySpace
• Podcasts
• PDAs
• Genetic code
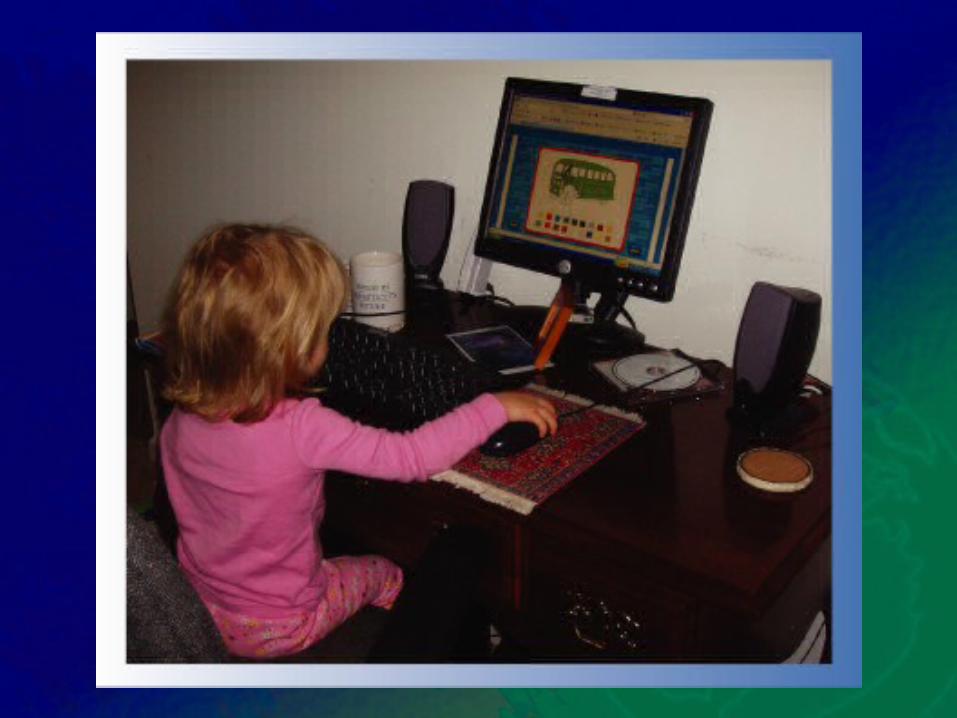


Children Aged 8-14 Help Parents Online…
• Email/pictures – 38%
• Respond to correspondence – 36%
• Get directions – 35%
• Help file income tax online – 14%

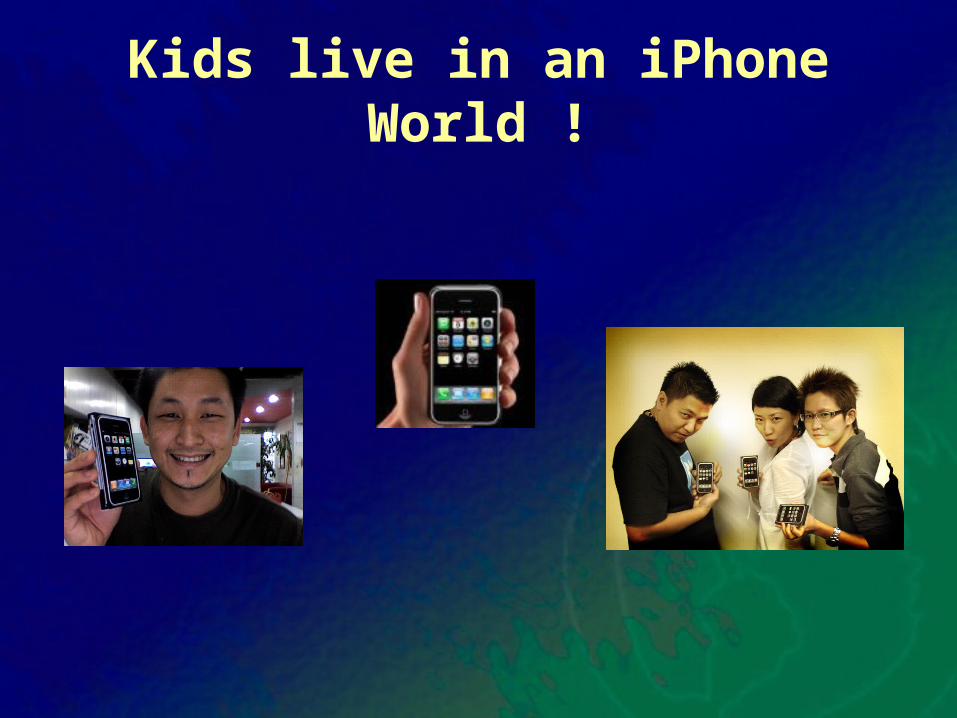
Kids live in an iPhone World !

Today’s YouthToday’s Youth
• Digital Learners
• Multimedia
• Find and manipulate data
• Analyze data and images

ResearchResearch
• Donald Roberts - Stanford• Jordan Grafman – National Institute of
Neurological Disorders• Hal Pashler – University of California• Cheryl Grady – Rothman Research
Center, Toronto• David Meyer – University of Michigan• Claudia Knooz – Duke

MultitaskingMultitasking
• Toggling
• Prefrontal Cortex
• Pew Research

Count the Number of Passes the Count the Number of Passes the White Shirted Team Makes White Shirted Team Makes
Kids live in an iPhone World !
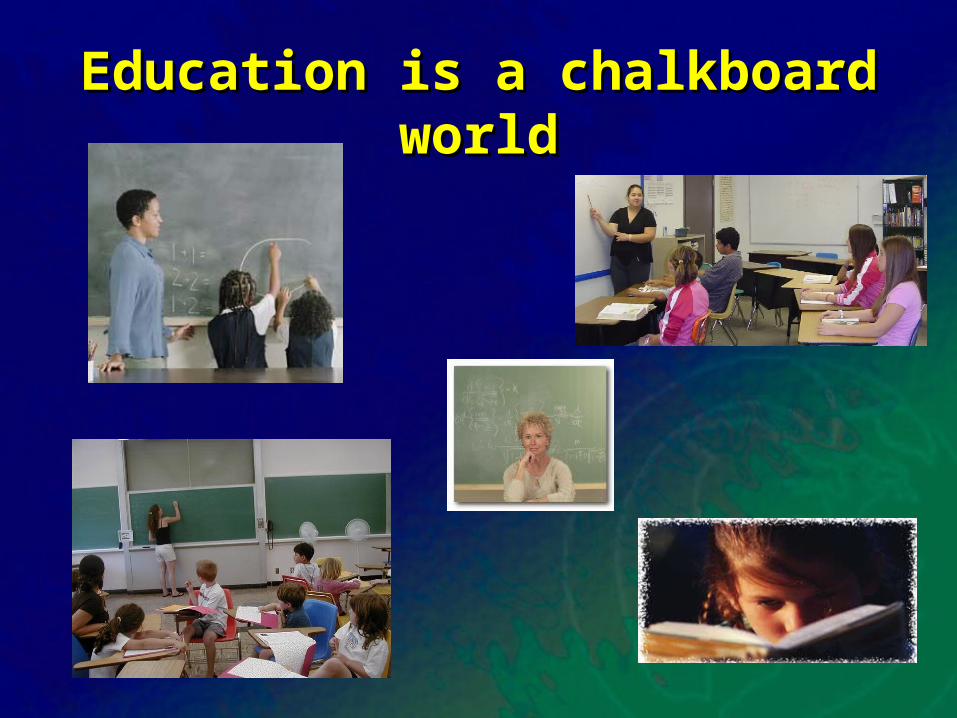
Education is a chalkboard worldEducation is a chalkboard world

Right Now!

Well Positioned
• Long and rich history
• You are not Kodak

Right Now!


Shenzhen
1980 - Fishing Village
2007 -

Port of Shenzhen
Source: Atlantic Monthly
1 / Second
24 / 7

Globalization
• In Developing Economies – Workers are Earning More
• In Developed Economies – Workers are Earning Less
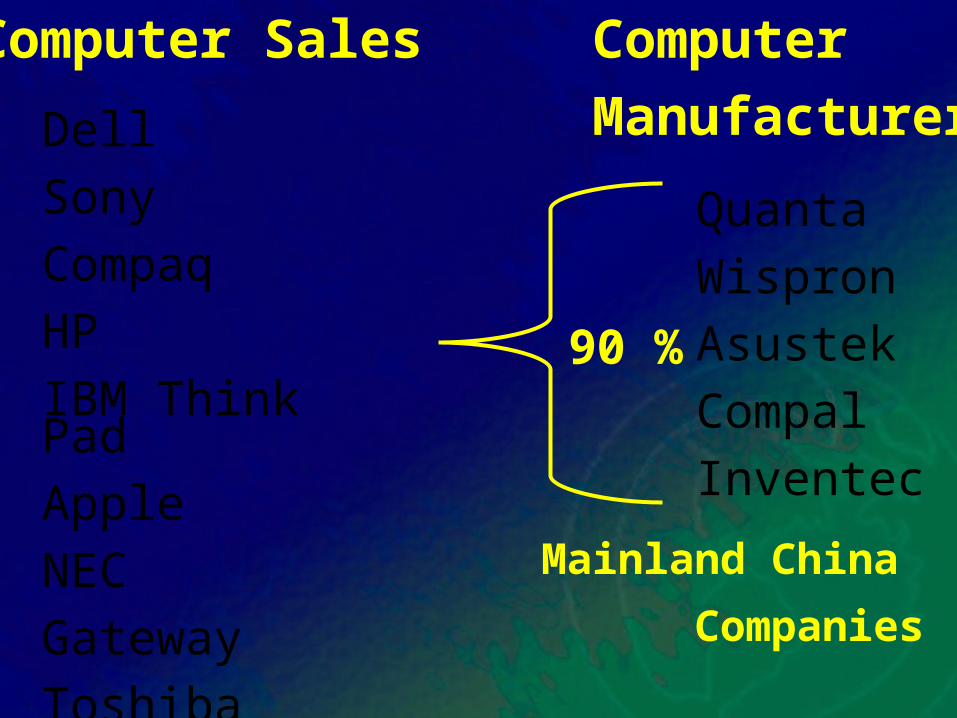
Computer Sales
Dell
Sony
Compaq
HP
IBM Think Pad
Apple
NEC
Gateway
Toshiba
Quanta
Wispron
Asustek
Compal
Inventec
Computer
Manufacturers
Mainland China
Companies
90 %

U.S. Manufacturing Workers
• 1955 One in Four
• 2005 One in Ten

What Technology Did to Manufacturing it is Now Doing to
Service Sector

Cities with 1 Million PeopleCities with 1 Million People
• United States
• Eastern / Western Europe
• China (2006)
• China (2020)
9
36
100 +
160 +

2007 – World Economic Leaders
1. United States
2. Japan
3. England
4. Germany
Source: Goldman Sacks

2040 – World Economic Leaders
1. China2. India3. United States4. Mexico5. Russia6. Brazil7. Germany8. England
Source: Goldman Sacks

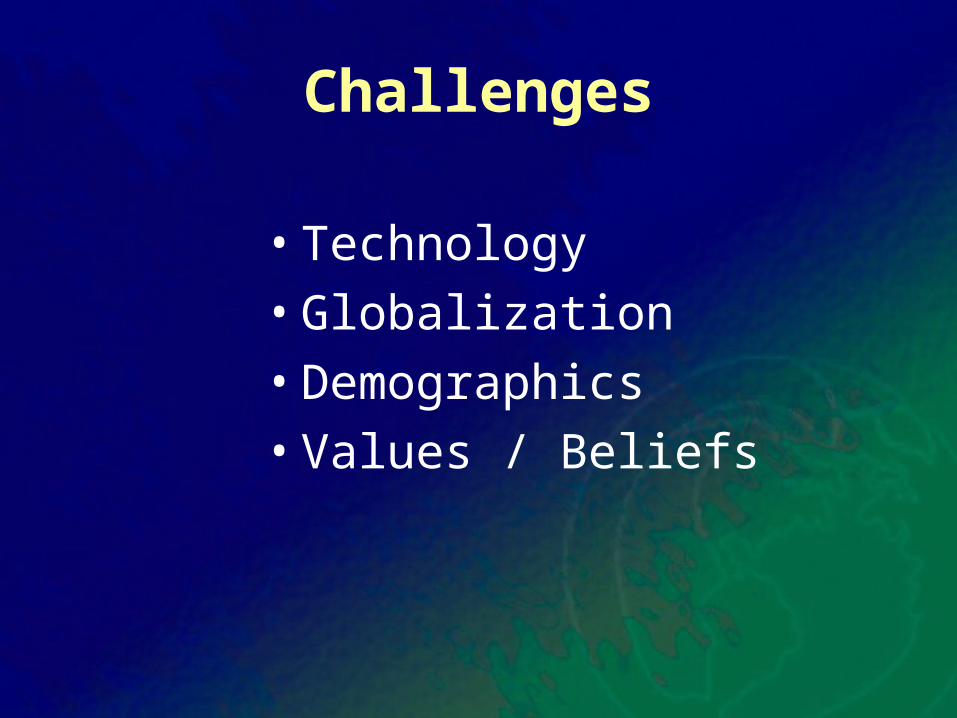
Challenges
• Technology
• Globalization
• Demographics

Start WorkingEnd WorkingLongevity
1900 2000 2100
47
62
77
21
62
1418
107
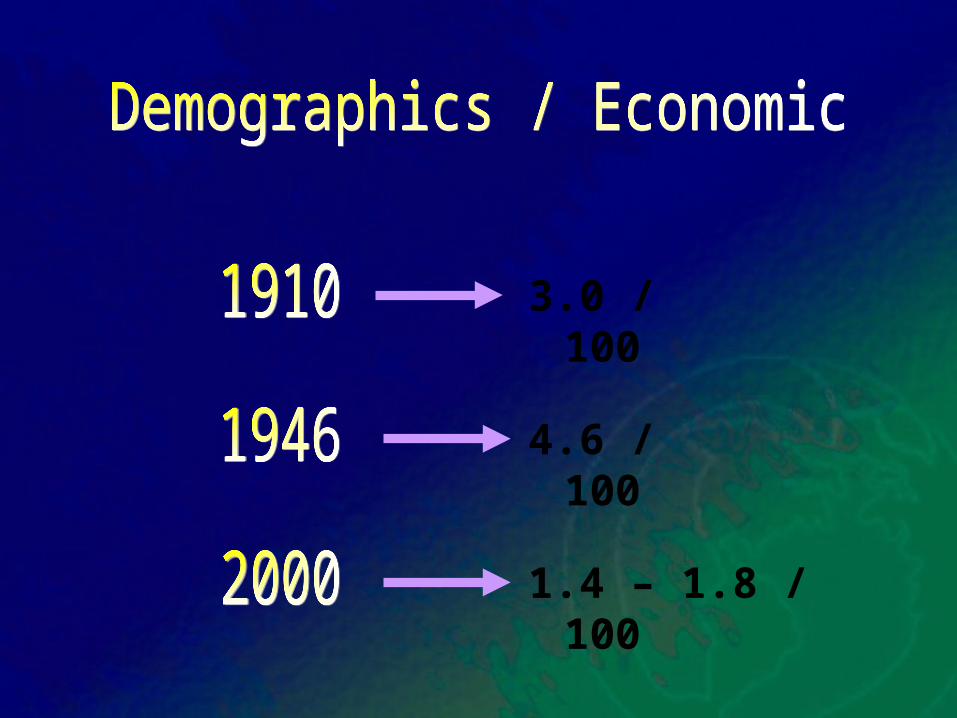
3.0 / 100
4.6 / 100
1.4 – 1.8 / 100

U.S. Foreign-born Population
• 16% Increase Since 2000
• 35.8 Million
Source: Arnold Parker
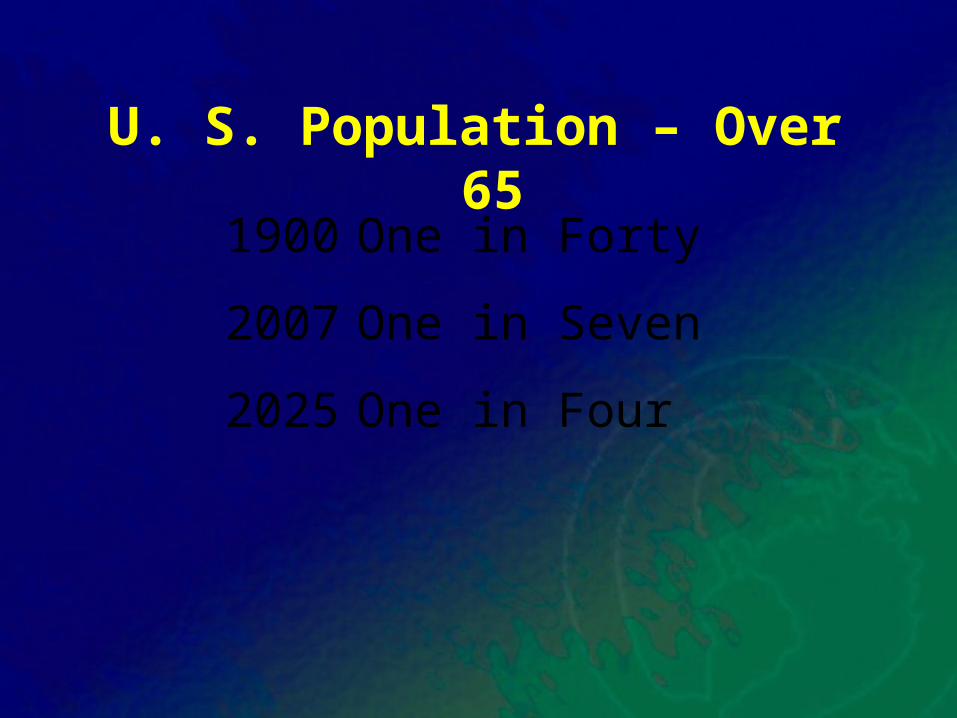
U. S. Population – Over 65
1900 One in Forty
2007 One in Seven
2025 One in Four

Age-wealth DisparityChanges in median net worth and head-of-household
annual income by age group, 1989-2004
-40
-20
0
20
40
60
80
100
35-39 40-44 45-49 50-54 55-59 60-64 65-69 70-74 75-up
NetWorth
Income
Percent
Age Source: USA Today

• Federal Budget 2006 Deficit
$1.3 trillion
$11, 434 per household
$516,348
$31,000 per year for 75 years
• Total per household
• Personal debt$112,403
Source: USA Today
Challenges
• Technology
• Globalization
• Demographics
• Values / Beliefs
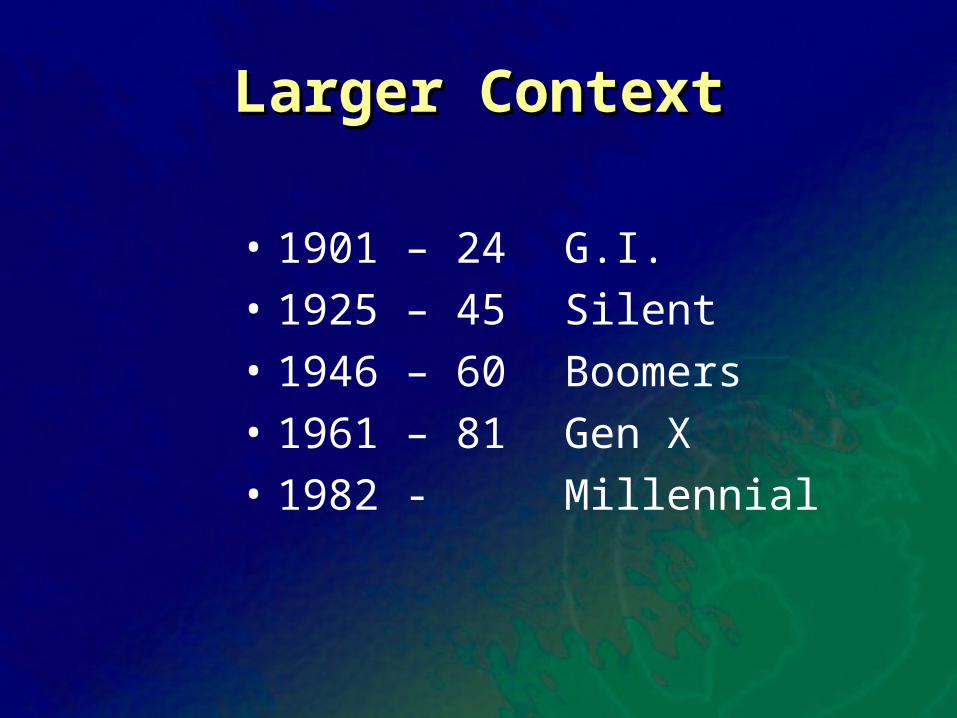
Larger ContextLarger Context
• 1901 – 24G.I.
• 1925 – 45Silent
• 1946 – 60Boomers
• 1961 – 81Gen X
• 1982 - Millennial

WhyWhy WhatWhat HowHow
Change ProcessChange Process

1587 Route 146
Rexford, NY 12148
Phone (518) 399-2776
Fax (518) 399-7607
E-mail - [email protected]
www.LeaderEd.com
International Center for Leadership in Education, Inc.


