1
Information Asymmetry and the Market Response to Open Market Share
Repurchases
Bong Soo Lee
Florida State University
(850) 644-4713
Nathan Mauck
University of Missouri - Kansas City
(816) 235-6113
Abstract
This paper establishes a new, repurchase specific, measure of firm information asymmetry. The
information asymmetry measure is based on causality tests relating repurchase information to
firm returns. Our results indicate that firms with greater information asymmetry see larger
abnormal returns surrounding the announcement of an open market share repurchase. This new
information asymmetry proxy remains a significant explanatory factor for announcement
abnormal returns after controlling for another conventional information asymmetry proxy, firm
size. Repurchase programs are more likely to signal future positive return performance for
smaller firms and relatively larger repurchase programs.
JEL classification: D82; G35
Key words: Payout policy; Open market share repurchases; Information asymmetry; Time series;
Causality

2
1. Introduction
While the market response to open market repurchase announcements is on average
positive, the market responds strongly to some announcements and not strongly to others.1 We
examine if the degree of firm information asymmetry helps to explain the market reaction to
open market share repurchase announcements. Our measure of information asymmetry is unique
in this context and is derived from time series regressions based on Granger (1969) and Sims
(1972). While other information asymmetry proxies in the literature capture some aspects of
information asymmetry, ours is tailored specifically to the repurchase decision. Specifically, our
information asymmetry proxy is based on dynamic causal relations between stock price
performance of firms and the announcement of share repurchases during the period 1990-2011.
Our information asymmetry proxy helps to explain announcement returns even after controlling
for another information asymmetry proxy, firm size.
Market reactions to share repurchases may be related to the perceived motivation and
information of the repurchase. The literature provides evidence of the signaling hypothesis
(Louis and White, 2007). The information signaled is usually assumed to be firm undervaluation
although other motivations for repurchases exist (i.e., issues related to stock-based compensation
plans, reducing excess cash, etc.). The Brav et al. (2005) survey of managers indicates that
undervaluation is the primary reason for repurchasing. However, the literature has not reached a
consensus on whether or not managers are able to time repurchases correctly to take advantage
of periods of mispricing. Ikenberry et al. (1995), Brockman and Chung (2001), Cook et al.
(2004), and Peyer and Vermaelen (2009) conclude that managers are able to time the market
1 Comment and Jarrell (1991), Chan et al. (2004), and Grullon and Michaely (2004), among others, document
positive abnormal returns following the announcement of repurchases.
3
while Dittmar and Field (2013) find that frequent repurchasers, who account for the majority of
repurchases, are unable and likely not attempting to time the market. Similarly, Jagannathan and
Stephens (2003 show that infrequent repurchases show a stronger stock price reaction at
announcement. Yook (2010) shows that repurchase announcement abnormal returns are
positively related to firm undervaluation and that frequent repurchasing firms do not see positive
long-term abnormal returns. Similarly, Babenko et al. (2012) demonstrate that not all
repurchases are credible signals of undervaluation. Further, Dittmar and Field (2013) find that
the market is not able to determine which repurchases signal undervaluation at the time of the
announcement. Regardless of whether or not the average repurchase indicates timing, it seems
clear that some repurchases are informed and others are uninformed. Thus, establishing which
firms have relatively higher levels of information asymmetry in the repurchase decision allows
us to identify which repurchases send credible signals and which do not. Others have examined
conventional and general information asymmetry proxies such as firm size in examining the
market response to share repurchases (Chan et al., 2004). However, we create a repurchase
specific information asymmetry proxy in order to better understand the market reaction to share
repurchase announcement.
The intuition of our information asymmetry measure is straightforward. If a given
repurchase announcement contains predictive information about future stock returns, then it
follows that the repurchase is based on information possessed by the manager and not the
market. In short, firms with higher information asymmetry are more likely to see stronger stock
market returns following the open market repurchase. Thus, our measure of information
asymmetry is based on time series causality regressions for each repurchasing firm in the sample.
Each repurchase announcement is categorized as either an informed or uninformed repurchase.

4
If lagged repurchase information predicts future (6 month) returns, with a statistically significant
causal relation, that repurchase is labeled as informed. Our interpretation of this is that these
informed repurchases are firms where the level of information asymmetry is sufficiently high as
to render the information of the announcement economically meaningful.
Our results indicate that the majority of repurchases are not informed. Depending on the
repurchase measure used, we find that between 7% and 35% of all repurchases are informed. Our
use of the term “informed” in this case is to describe those firms for which the lagged repurchase
variable predicts six month future returns in causality regressions. This is consistent with Dittmar
and Field (2013) who find that most repurchases are by frequent repurchasers and that such
transactions are not at relatively low prices.
Informed repurchases result in higher announcement returns (3.43%) than non-informed
repurchases (2.73%), which indicates that the market generally identifies firms with greater
information asymmetry at the time of the repurchase announcement. The difference between
informed and uninformed CARs is increased for small firms and non-existent for large firms.
Thus, smaller firms who likely have higher levels of information asymmetry may be further
bifurcated based on our more precise measure of information asymmetry. Specifically, the size
of the firm does not fully explain firm level information asymmetry in the context of repurchases
and our time series based measure offers an alternative measure specific to this purpose. Our
results hold when controlling for the size of the repurchase and the frequency of repurchases for
a firm. Finally, we find that relatively larger repurchases and less frequent repurchasers are more
likely to be informed.
5
Our paper is organized as follows. Section 2 considers the motivation for using the
dynamic causal relation between returns and stock repurchase as the proxy for information
asymmetry in stock repurchases. In Section 3, we describe the data and methodology. In Section
4, we present the empirical evidence. Section 5 concludes.
2. Information Asymmetry and Repurchases
The literature evaluating the ability of managers to time repurchases assumes firm
information asymmetry that requires the manager to signal full information to the market. The
market, which is aware of the information asymmetry, responds positively to the announcement
of share repurchases. The explicit link between information asymmetry and the market response
to share repurchases has received less attention. Chan et al. (2004) find that small firms see
larger announcement abnormal returns relative to large firms upon the announcement of a
repurchase program. However, they focus on size as a proxy for likely misvaluation as opposed
to information asymmetry. As the literature has used firm size (Vermaelen, 1981; Corwin, 2003;
Zhang, 2006) to proxy for information asymmetry, it may be inferred that firms with greater
information asymmetry see a relatively larger announcement return. However, size is not a direct
measure of whether or not the repurchasing firm truly possessed information not contained in the
price at the time of the repurchase. The only way to identify truly informed repurchases is by
examining the return performance of repurchasing firms – which is the focus of this paper.
There can be some concerns about using stock returns following repurchases to establish
information asymmetry or to identify which repurchases are truly informed. For instance, it is

6
possible that the positive performance used to establish information asymmetry is due to factors
not signaled by the repurchase, in which case using the performance would yield a potentially
false positive for an informed repurchase. Similarly, it is plausible that a firm correctly signals
undervaluation via a repurchase announcement, but the market does not correct the price in time
for our measure to capture the correction. In short, our measure may commit both Type I and
Type II errors in establishing informed repurchases. However, given that our information
asymmetry proxy is based on a statistical test from causality regressions, the results are unlikely
to be systematically biased.
There may be other problems with our approach. It may be argued that if markets are
efficient, then announcement abnormal returns should correctly signal which repurchases are
informed. However, the literature has established a post repurchase announcement drift that
would suggest that using the announcement abnormal returns is a poor proxy for information
asymmetry (Ikenberry et al., 1995; Grullon and Michaely, 2004; Chan et al. 2004). Chan et al.
(2004) note that “the evidence, however, indicates that the initial market reaction is not a good
predictor of long-term abnormal performance.” This statement is related to their results which
suggest that the initial market reaction is not only incomplete, but actually unrelated to
subsequent return performance. Overall, the literature suggests that the market does not, on
average, price the information of repurchase announcements immediately at the time of the
announcement.
3. Data and Methodology
Data on open market share repurchases is from SDC Platinum. We collect data on all
announced share repurchases from 1980-2011. For each repurchase, we identify the date of the

7
announcement and the size of the announced repurchase. Following Grullon and Michaely
(2004) and Babenko et al. (2012) we do not exclude financial firms from our sample. We
construct two measures of repurchases. The first is a simple indicator which is equal to one if
there is a repurchase announced in a given month and is zero otherwise. The second, which is
consistent with Babenko et al. (2012), is the dollar value of the repurchase divided by the market
value of the firm. Using the dollar value of the repurchase rather than the number of shares
sought is based on data availability in SDC Platinum. Specifically, the dollar value of the
repurchase is nearly always reported (roughly 90% reporting) while the number of shares sought
is rarely reported (less than 25% reporting).
We then link the sample of repurchasing firms to CRSP in order to obtain firm stock
return and market capitalization data. We obtain return data over the period from 1980-2012.
Thus, the CRSP sample exceeds the repurchase sample by one year. This is needed to facilitate
our forward looking causality regressions. Event study cumulative abnormal returns (CARs) are
calculated following Babenko et al. (2012). Specifically, we use a market model approach with
an estimation window of (-252 to -44) and use a three-day event window of (-1 to +1) to
construct CAR. CAR is the difference between the observed return and predicted return based on
the market model.
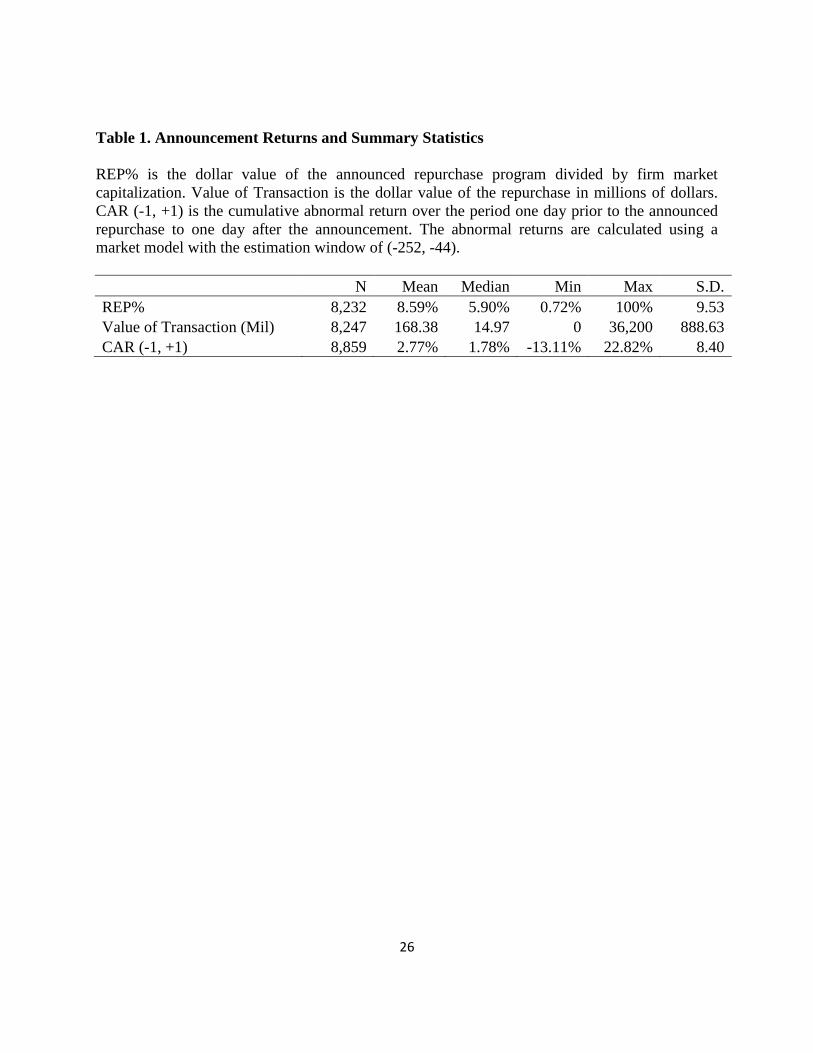
In Table 1 we report summary statistics for the size of the repurchase (repurchase dollar
value divided by firm market value), the value of the repurchase (in millions) and the
announcement CAR. We document that the average repurchase announcement is for 8.59% of
total firm market value, has a value of $168.38 million, and sees an announcement CAR of
2.77%. We note that we are able to calculate announcement abnormal returns for 8,859
8
repurchase announcements over the 1990-2011 period. We compare this to other studies and find
that our sample is consistent with prior work. For instance, Babenko et al. (2012) find 5,827
announcements over the period 1993-2008. Over this same period, we find a very similar number
of deals (6,128) despite the fact that we do not explicitly follow their filtering criteria.
Differences between sample size in Babenko et al. (2012) and our paper are due to our paper
including more years, both before and after the period examined in Babenko et al. We find mean
and median event (event days -1 to +1) cumulative abnormal returns in Table 1 of 2.77% and
1.78%, respectively, which are both statistically significant at the 1% level. The announcement
CAR in Table 1 is consistent with Grullon and Michaely (2004) who find mean and median CAR
over the same three day window (-1 to +1) of 2.71% and 1.82%, respectively, over the 1980 to
1997 period.
[Insert Table 1 Here]
In the appendix, we discuss potential information asymmetry between inside managers
and outside investors and how to test this information asymmetry by applying Sims’ (1972) two-
sided regression based causality test. By using this test and considering different degrees of
information asymmetry, we can tell whether inside managers indeed have information
advantages over outside investors.
Based on the discussions in the appendix, we investigate the relationship between manager’s
share repurchase announcements and past as well as future monthly returns using the following
regression, taking into account possible feedback of share repurchase from past market returns:
(1)
9
where R is the monthly return for a given firm in month t from CRSP. REP is the repurchase
variable which is measured either as an indicator or as a percent of the firm to be repurchased.
Specifically, REP is an indicator equal to one if the current month contains a repurchase and is
zero otherwise. REP% is the percent of the firm to be repurchased in a given month and is equal
to the dollar value of the repurchase divided by the market value of the firm in a given month.
To make inferences about potential information asymmetry, we analyze the
characteristics of the coefficients. Since this causality test can be interpreted as being based on
information asymmetry as discussed above, we interpret a finding of causal relation from share
repurchase to market return as evidence of share repurchase decisions based on information
asymmetry. Based on the discussions in the appendix, we test whether the individual coefficients
of lagged returns are zero to see whether share repurchases Granger-cause returns. Share
repurchase, REP, is said to Granger-cause the return if we reject:
H0: = 0, for all j in (1).
In other words, the share repurchase, REP, Granger-causes the returns if lagged REP can predict
current returns, controlling for past returns. If the null H0: = 0, for all j in (1) is rejected, we
find evidence of market timing using the share repurchase, REP. This specification also allows
us to test the net (cumulative) effect of lagged share repurchase on the market returns.
Specifically, we test:
H0 : = 0 in (1),
which allows us to test for the sign of the causal relation. If we find the net effect (sum of
coefficients, ) is significantly positive, the sign of the causation is consistent with the
10
expectation that managers increase share repurchases in anticipation of an increase in stock
return (i.e., market timing).
As discussed above, our measure of information asymmetry is originally based on two-
sided causality regression developed by Sims (1972). Our time-series model acknowledges
information asymmetry between potentially informed managers and other uninformed investors.
In this situation, repurchase announcements may contain information about future stock returns.
Our model ultimately tests the predictive power of repurchase announcements, which we equate
to information asymmetry.
The causality regression in (1) is conducted for each firm in the sample and as such,
8,859 (7,781) individual regressions are run using REP (REP%) over the full time series of
available returns. An F-test of the cumulative significance of the lagged repurchase terms is
conducted and the P-value of this test is used to determine the predictive power of repurchase
announcements. If the P-value for an individual regression is <0.05 we conclude that the
repurchase announcement is predictive of future returns. The predictive power based on the P-
value is then interpreted as a measure of information asymmetry.
Informed repurchases indicate the presence of information asymmetry at the time of the
repurchase announcement. This approach differs from other information asymmetry measures
such as firm size. While a priori information asymmetry proxies have the advantage of yielding
predictions and possibly tradable results, they are limited in the sense that they capture relatively
crude elements of information asymmetry. For example, a small firm may indeed have a
relatively high degree of information asymmetry, but that fact does not speak to the relative
valuation of that firm. Thus, all repurchases by small firms are not necessarily true signals of
11
undervaluation or other relevant inside information that would alleviate information asymmetry
issues. In fact, the credibility of repurchase announcements has received considerable scrutiny in
the literature. 2 Our measure has the advantage of providing a more specific measure of
information asymmetry that is related to repurchase announcements. Specifically, we determine
which share repurchase announcements are ultimately predictive of positive future return
performance and thus are the most likely cases of relatively high levels of information
asymmetry.
4. Results
In order to establish which repurchase announcements involve firms with a relatively
higher level of information asymmetry, we use firm-by-firm causality regressions of returns and
repurchases as discussed in Section 3. A summary of the results from these regressions is
provided in Table 2.
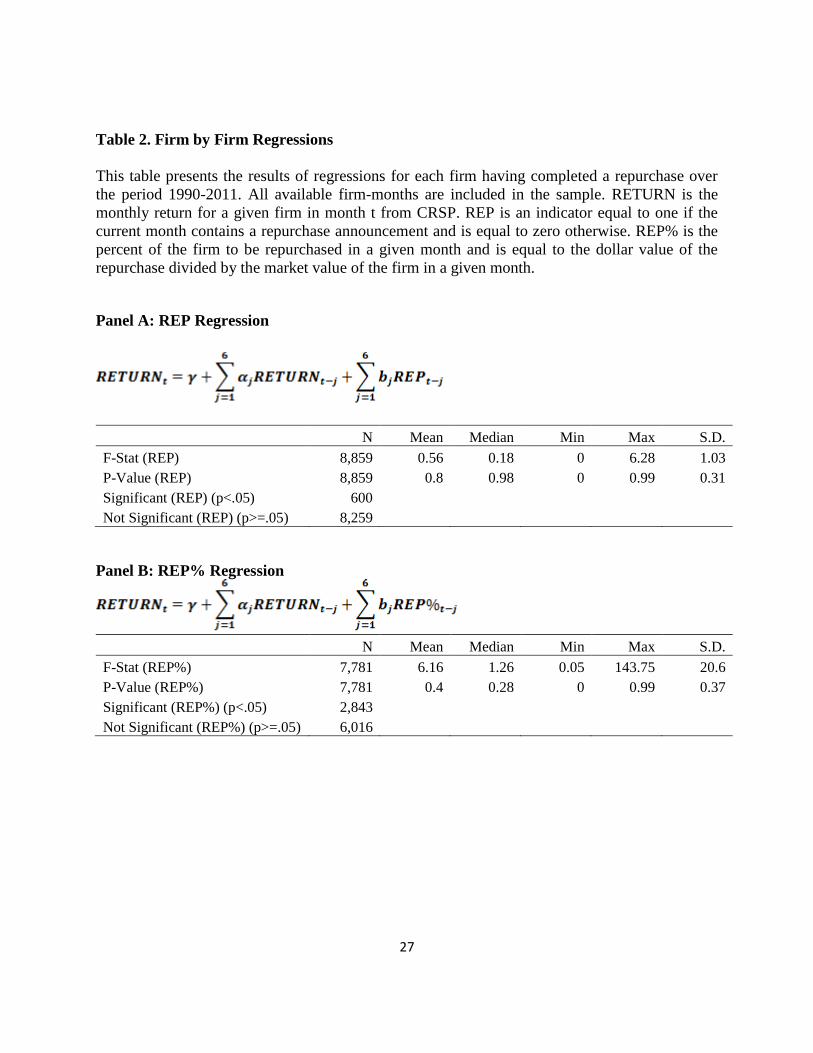
In Panel A of Table 2, we regress current period returns on six month lagged returns and
lagged six month lagged REP which is an indicator equal to one if the month contained a
repurchase announcement and is zero otherwise. There were 8,859 firms repurchasing during the
1990-2011 period for which we were able to conduct this test. The mean and median p-value for
the cumulative effect of the coefficients on the lagged repurchase terms on current returns is 0.80
and 0.98. Thus, the mean and median repurchase announcement is relatively uninformed. In fact,
only 600 out of 8,859 firms are found to have a statistically significant (at a minimum of the 5%
level) predictive ability for lagged repurchases on current returns. Similarly, Dittmar and Field
(2013) find that the majority of repurchases are not able to time firm undervaluation.
2 See for example Babenko et al. (2012).

12
[Insert Table 2 Here]
In Panel B of Table 2, we use REP% as the repurchase variable of interest. REP% is the
dollar amount of the announced repurchase program divided by the market value of the firm.
REP% is commonly used in the literature and may better capture the relative size of the
repurchase.3 This in turn may provide more specific indications of the information contained in
the repurchase announcement. Specifically, one would expect that firms repurchasing a relatively
larger proportion of themselves have relatively more information about the value of their firms.
The results in Panel B of Table 2 indicate more predictive ability of repurchases for
future returns than the results in Panel A of Table 2. The mean and median p-value is 0.40 and
0.28. Additionally, 2,843 of the 7,781 firms examined in Panel B of Table 2 are found to have a
significant cumulative effect of lagged repurchases on current returns.4 While the results in Panel
B do not suggest that most repurchases are informed, they do suggest that many more
repurchases are informed relative to using a simple binary indicator as a repurchase measure as
in Panel A.
While Table 2 establishes a measure of firm-level information asymmetry for repurchase
announcements, it does not address the market reaction at the time of the announcement. To the
extent that efficient markets correctly identify repurchase announcements with the most credible
signals (i.e., those involving firms with the highest levels of information asymmetry), we would
expect that our information asymmetry proxy and abnormal returns would be positively related.
3 See for example Babenko et al. (2012). 4 The difference in sample size between Panel A and Panel B of Table 2 is due to the availability of the dollar value
of repurchases from SDC.
13
We examine event CARs for repurchasing firms based on levels of information
asymmetry in Table 3. Each repurchasing firm is grouped into either the informed or uninformed
category based on the p-value from firm-level regressions in Table 2. The informed group
contains all firms with p-values less than 0.05 from the causality regressions. Panel A of Table 3
presents the results of tests of differences in mean CAR for repurchasing firms based on whether
or not the repurchasing firm is classified as informed. We find, regardless of which definition of
repurchase we use, abnormal returns are higher for informed firms than for uninformed firms.
The difference in CAR for the event window is 0.70% and 0.44% for REP and REP%,
respectively. Thus, firms with greater information asymmetry see higher announcement returns.
This suggests that the market correctly identifies such firms at the time of the announcement. We
compare our results to those of Dittmar and Field (2013) who examine repurchase announcement
returns based on information asymmetry as measured by analyst following and dispersion
measures. They find that firms with greater information asymmetry are more likely to repurchase
at relatively low prices, which may explain the relatively more positive market reaction to such
announcements.
[Insert Table 3 Here]
In Panel B of Table 3, we conduct the same analysis except that we now focus only on
“small” firms, which we define as firms with below median market value for the sample. Size
has been used frequently to proxy for information asymmetry in the literature previously
(Vermaelen, 1981; Corwin, 2003; Zhang, 2006). If firm size completely captures elements of
information asymmetry related to repurchases, then splitting on firm size alone may be enough to
identify informed repurchases. However, if further splitting the sample based on our information

14
asymmetry proxy yields a significant difference in announcement returns between the two
groups, then it suggests that our proxy captures information asymmetry which is particularly
related to the issue of repurchases. We find that the result of Panel A of Table 3 is even stronger
in Panel B. Specifically, the announcement return is 1.60% and 0.62% higher informed
repurchases using REP and REP%, respectively, in the sample using only relatively smaller
firms which are between roughly 50% and 100% larger than in Panel A.
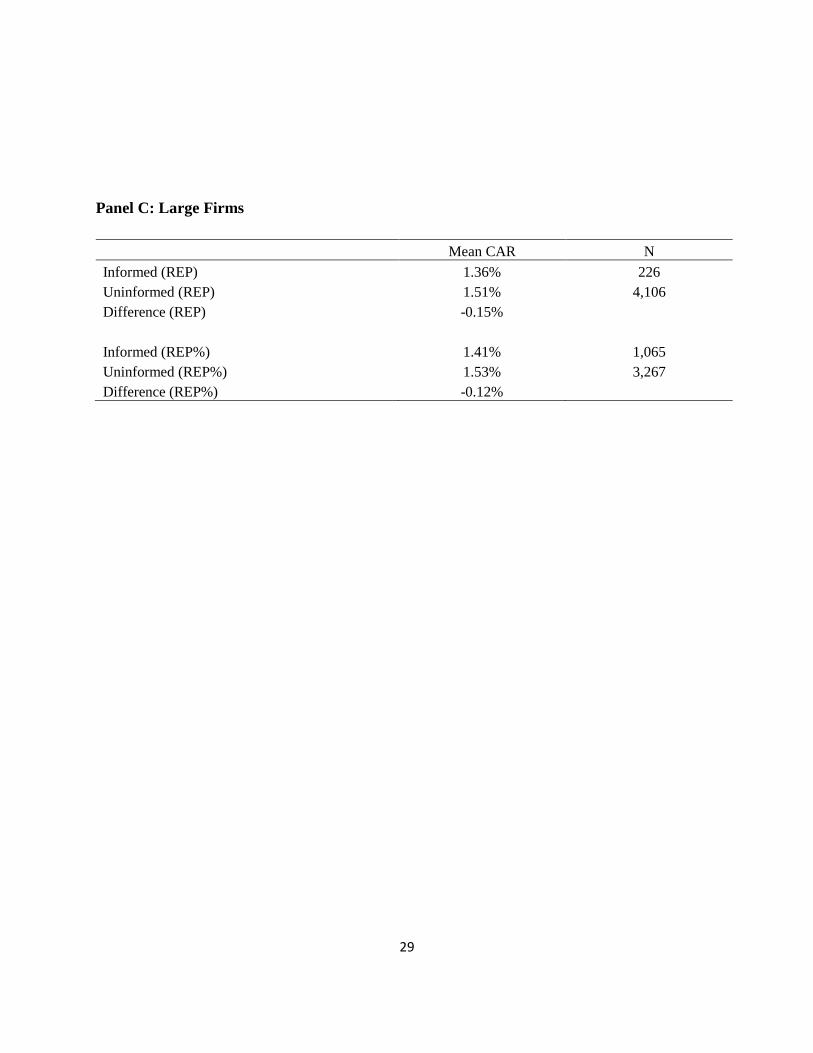
In Panel C of Table 3, we focus only on “large” firms, those with above median market
value for our sample. As hypothesized in Panel B, it may be that size captures the relevant
portions of information asymmetry related to repurchases. However, it may also be true that size
fails to completely capture information asymmetry in this context. The results in Panel C of
Table 3 indicate no statistical difference between announcement returns based on our informed
indicator for large firms, regardless of the repurchase measure used. Thus, at least amongst larger
firms, our information asymmetry proxy does contribute additional understanding relative to a
simple size measure. Overall, this is perhaps not surprising. To the extent that information
amongst larger firms is relatively more homogenous than the dispersion for smaller firms, our
results in Panels B and C are expected. It is also possible that larger firms are relatively more
likely to undertake repurchases for reasons other than undervaluation or other information
signaling. This is consistent with the fact that announcement returns are lower across the board
for larger firms relative to smaller firms. The larger announcement returns for smaller
repurchasing firms is consistent with Chan et al. (2004). Thus, the market in general is less
optimistic about the large firm repurchase announcement, which may be due to less new
information being generated by such an announcement. Still, our causality regression approach

15
indicates that roughly one in four large firm repurchases (using REP%) are informed and the
market does not capture this at the time of the announcement.
Table 4 presents regressions similar in spirit to the analysis in Table 3. Specifically, we
present regression results which use event CARs as the dependent variable. The explanatory
variables include an informed indicator which is one, if the firm’s causality regression
demonstrates that repurchases had predictive power for future returns and is zero otherwise. We
control for the size of the repurchase and conduct the regression for all firms (Panel A), small
firms (Panel B) only and large firms (Panel C) only.
[Insert Table 4 Here]
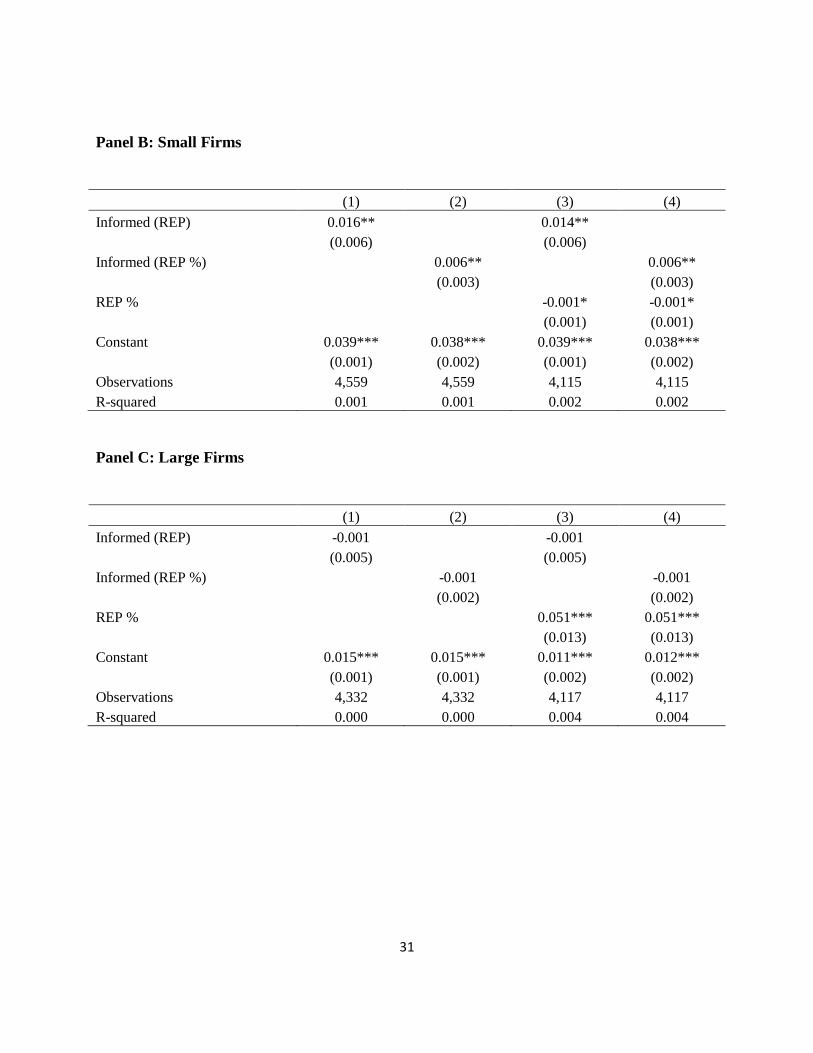
Consistent with the difference in means tests in Table 3, the results in Table 4 indicate
that the informed indicator is positively related to CAR in the regressions including all firms
(Panel A) and small firms (Panel B) but insignificantly related to CAR in the sample of large
firms (Panel C). The incremental value of Table 4 over Table 3 is that in Table 4 we have
demonstrated that the results hold even after controlling for the size of the repurchase. Thus, it
does not appear as though the relative size of the repurchase is driving the results.
In addition to the size of the repurchase program, the frequency of repurchase
announcements may also drive the results documented to this point. This is based on
Jagannathan and Stephens (2003) and Dittmar and Field (2013) who note that the motivations of
frequent repurchasers may differ from less frequent repurchasers. Specifically, Dittmar and Field
(2013) find that firms who repurchase at a higher frequency are not motivated by undervaluation
and do not purchase at relatively low prices. In their analysis of information asymmetry, Dittmar
16
and Field find that firms with greater information asymmetry are better able to purchase at lower
prices. This suggests that firms that repurchase less frequently are relatively better informed.5
We confirm this in Table 5.
In Table 5 we find the CAR drops as the number of repurchase announcements increases.
For instance, the mean CAR for a firm with only one repurchase announcement in the sample is
3.24% compared to a CAR of 1.58% for firms repurchasing four times in the sample period.
Thus, firms that repurchase more often have less informative repurchases.
[Insert Table 5 Here]
In Table 6 we run regressions in which announcement CAR is the dependent variable and
repurchase informed status (equal to one if informed and zero otherwise), repurchase frequency,
and the size of the repurchase are explanatory variables. Consistent with Table 5, we find that the
frequency of repurchase is negatively related to announcement CARs. Further, including the
frequency of repurchase does not change the relation between our informed indicator and CARs.
Specifically, consistent with Tables 3 and 4, the informed indicator is positively related to
announcement CARs in the sample of all firms and small firms.
[Insert Table 6 Here]
In Table 7, we examine the relation between whether or not a repurchase is informed
(dependent variable) and our measures of repurchase frequency and repurchase size (independent
variables). While our informed indicator uses a measure of information asymmetry based on
5 We note that the frequency of repurchasing in Dittmar and Field (2013) is based on actual repurchases while our
measure of repurchase frequency is based on announced repurchases.

17
causality tests, the analysis in Table 7 may suggest characteristics of informed repurchases that
are available a priori.
The results in Table 7 depend on the definition of informed repurchases. When using an
indicator of a repurchase in a given month, rather than the relative size of the repurchase, neither
repurchase frequency nor repurchase size is related to the informed indicator. However, when the
informed indicator is based on the relative size of the repurchase, we find that frequent
repurchasers (larger repurchases) are negatively (positively) related to informed repurchases.
Thus, less frequent and relatively larger repurchasers are more likely to announce repurchase
programs that ultimately are associated with positive returns.
[Insert Table 7 Here]
5. Conclusion
While the initial average response to the announcement of an open market share
repurchase is positive, it is less clear which announcements are true signals of positive future
performance. The signals from an open market repurchase may be more credible in the case of
firms with relatively high levels of information asymmetry. In such a case, the announcement of
the repurchase program may bring the level of information possessed by the managers and the
shareholders closer together.
We create a repurchase specific measure of information asymmetry that is based on
causality tests. The resulting information asymmetry measure is based on the assumption that if
repurchase information predicts future returns, then that repurchase is informed. When we relate
our measure of information asymmetry to abnormal returns following the announcement of open

18
market share repurchases, we find that they are positively related. Thus, firms with relatively
higher levels of information asymmetry are found to be relatively more informed repurchasers.
This result is stronger for smaller firms. Thus, our information asymmetry measure captures
information not contained in firm size. Finally, we document that relatively larger share
repurchase programs and less frequent repurchasers are more likely to be informed and see
higher announcement abnormal returns.

19
References
Babenko, I., Y. Tserlukevich, and A. Vedrashko, 2012, The credibility of open market share
repurchase signaling, Journal of Financial and Quantitative Analysis 47, 1049-1088.
Box, G. E. P. and G. M. Jenkins, 1976, Time series analysis: Forecasting and control, Holden
Day.
Brav, A., J.R. Graham, C.R. Harvey, and R. Michaely, 2005, Payout policy in the 21st century,
Journal of Financial Economics 77, 483-527.
Brockman, P., D. Chung, 2001, Managerial timing and corporate liquidity: Evidence from actual
share repurchases, Journal of Financial Economics 61, 417-448.
Chan, K., D. Ikenberry, and I. Lee, 2004, Economic sources of gain in stock repurchases,
Journal of Financial and Quantitative Analysis 39, 461-479.
Comment, R., and G. A. Jarrell, 1991, The relative signalling power of Dutch-auction and fixed-
price self-tender offers and open-market share repurchases, Journal of Finance 46, 1243–1271.
Cook, D., L. Krigman, and C. Leach, 2004, On the timing and execution of open market
repurchases, Review of Financial Studies 17, 463-498.
Corwin, S. A., 2003, The determinants of underpricing for seasoned equity offers, Journal of
Finance 58, 2249–2279.
Dittmar, A., and L. Field, 2013, Can managers time the market? Evidence using repurchase price
data, Working Paper, University of Michigan and Pennsylvania State University.
Fuller W., 1976. Introduction to Statistical Time Series. New York: John Wiley.
Granger, C. W. J., 1969, Investigating causal relations by econometric models and cross-spectral
methods, Econometrica 37, 424-438.
Granger, C. W. J. and P. Newbold, 1986, Forecasting Economic Time Series, 2nd edition,
Academic Press.
Grullon, G., and R. Michaely, 2004, The information content of share repurchase programs,
Journal of Finance 59, 651-680.
Ikenberry, D., J. Lakonishok, and T. Vermaelen, 1995, Market underreaction to open market
share repurchases, Journal of Financial Economics 39, 181–208.
Jagannathan, M., and C. Stephens, 2003, Motives for multiple open-market repurchase programs,
Financial Management 32, 71-91.

20
Louis, H., and H. White, 2007, Do managers intentionally use repurchase tender offers to signal
private information? Evidence from firm financial reporting behavior, Journal of Financial
Economics 85 (2007), 205–233.
Peyer, U., and T. Vermaelen, 2009, The nature and persistence of buyback anomalies, Review of
Financial Studies 22, 1693-1745.
Sims, C.A.., 1972, Money, income, and causality, American Economic Review 62, 540-552.
Vermaelen, T., 1981, Common stock repurchases and market signaling, Journal of Financial
Economics 9, 139–183.
Yook, K.C., 2010, Long-run stock performance following stock repurchases, Quarterly Review
of Economics and Finance 50, 323-331.
Zhang, X. F., 2006, Information uncertainty and stock returns, Journal of Finance 61, 105–137.

21
Appendix:
Empirical model of a test of asymmetric information based on causality tests (Sims test)
In this appendix, we provide a simple, parsimonious time-series model in which there is
potential information asymmetry between informed inside managers and outside investors so that
we can draw inferences about the market’s reactions to share repurchase announcements. In such
a case, share repurchase decisions by inside managers may contain (or convey) new information
about future stock returns. 6 In fact, some share repurchase decisions may be information events
(i.e., forward-looking), while others may be non-information events (i.e., backward-looking)
with respect to stock returns. The share repurchase decision will be related to future stock returns
when it is an informative event under information asymmetry. The idea is that although informed
inside managers and uninformed outside investors observe the same financial variables such as
current and past stock returns and fundamentals, uninformed outside investors may not fully
recover all the information which informed inside managers use in share repurchase.7 Our model
is useful because it provides a regression model that tests the predictive power of share
repurchase under potential information asymmetry.
Here, we utilize a theorem in time-series econometrics, which states that any time-series
process has both invertible and non-invertible representations [see Fuller (1976, P. 64-66,
Theorem 2.6.4)]. Although stock returns may follow a general ARMA (autoregressive moving
average) process, for expositional simplicity we assume that uninformed outside investors,
observing current and past stock returns, infer a first-order moving average, MA(1), process of
the returns: 8
Rt = (1 – L) ut, < 1.0 , (A.1)
where Rt is the stock return at time t, L is the lag (or backshift) operator (i.e., Ln Rt = Rt-n), and ut
is white noise with var(ut) = u2. The autocovariance functions (ACFs) for this return process
are:
var(Rt) = (1 + 2) u2,
cov(Rt, Rt-1) = - u2,
cov(Rt, Rt-k) = 0, for k 2. (A.2)
6 Here, we focus on the relationship between share repurchases and stock returns. 7 We can capture this intuition in a time-series concept of the non-invertibility of the moving average representation [see Box and Jenkins (1976, p.69) and Granger and Newbold (1986, p.145)]. 8 Any higher-order representation of returns yields the same dynamic relationships with more complicated computations.
22
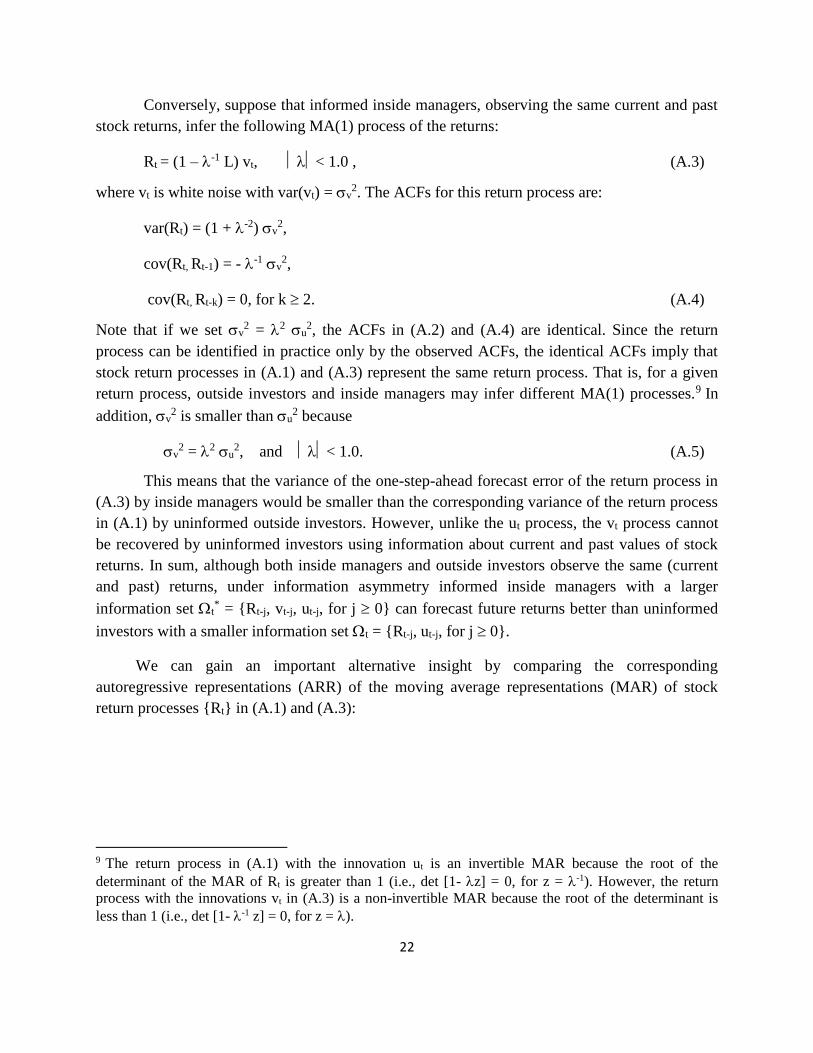
Conversely, suppose that informed inside managers, observing the same current and past
stock returns, infer the following MA(1) process of the returns:
Rt = (1 – -1 L) vt, < 1.0 , (A.3)
where vt is white noise with var(vt) = v2. The ACFs for this return process are:
var(Rt) = (1 + -2) v2,
cov(Rt, Rt-1) = - -1 v2,
cov(Rt, Rt-k) = 0, for k 2. (A.4)
Note that if we set v2 = 2 u
2, the ACFs in (A.2) and (A.4) are identical. Since the return
process can be identified in practice only by the observed ACFs, the identical ACFs imply that
stock return processes in (A.1) and (A.3) represent the same return process. That is, for a given
return process, outside investors and inside managers may infer different MA(1) processes.9 In
addition, v2 is smaller than u
2 because
v2 = 2 u
2, and < 1.0. (A.5)
This means that the variance of the one-step-ahead forecast error of the return process in
(A.3) by inside managers would be smaller than the corresponding variance of the return process
in (A.1) by uninformed outside investors. However, unlike the ut process, the vt process cannot
be recovered by uninformed investors using information about current and past values of stock
returns. In sum, although both inside managers and outside investors observe the same (current
and past) returns, under information asymmetry informed inside managers with a larger
information set t* = {Rt-j, vt-j, ut-j, for j 0} can forecast future returns better than uninformed
investors with a smaller information set t = {Rt-j, ut-j, for j 0}.
We can gain an important alternative insight by comparing the corresponding
autoregressive representations (ARR) of the moving average representations (MAR) of stock
return processes {Rt} in (A.1) and (A.3):
9 The return process in (A.1) with the innovation ut is an invertible MAR because the root of the
determinant of the MAR of Rt is greater than 1 (i.e., det [1- z] = 0, for z = -1). However, the return
process with the innovations vt in (A.3) is a non-invertible MAR because the root of the determinant is
less than 1 (i.e., det [1- -1 z] = 0, for z = ).

23
(A.6)
Note that the innovations {ut} in the uninformed outside investors’ return process are backward-
looking, whereas the innovations {vt} in the informed inside managers’ return process are
forward-looking.
How is this information asymmetry between inside managers and outside investors related
to the dynamic relationship between share repurchase decisions by inside managers and stock
returns (i.e., the predictive power of stock sales)? Suppose that inside managers have an
information advantage in that they can forecast the firm’s future prospects better than
uninformed investors by observing vt. If inside managers apply this information to their share
repurchase decisions, their share repurchase decision, REPt, will be a function of the innovation
vt that they observe but uninformed outside investors do not:
(A.7)
Then, by using vt in (A.6), the share repurchase variable, REPt, and stock return processes will be
related as follows:
(A.7.2)
where j for j = -∞, …, -2, -1, 0, 1, 2, ….∞ is a function of i and
j . That is, the share
repurchase will be a linear combination of future, current, and past returns; thus, it will be
forward-looking. In practice, since inside managers do not have perfect foresight, (A.7.2) will be
(A.8)
In contrast, suppose that inside managers do not have an information advantage or they
simply do not make share repurchase decisions based on their information advantage. Then, the
share repurchase will be a function of ut , the innovation that uninformed outside investors
observe:
(A.9)
0j
jt
j
t
1
t and,R RL) (1u
24
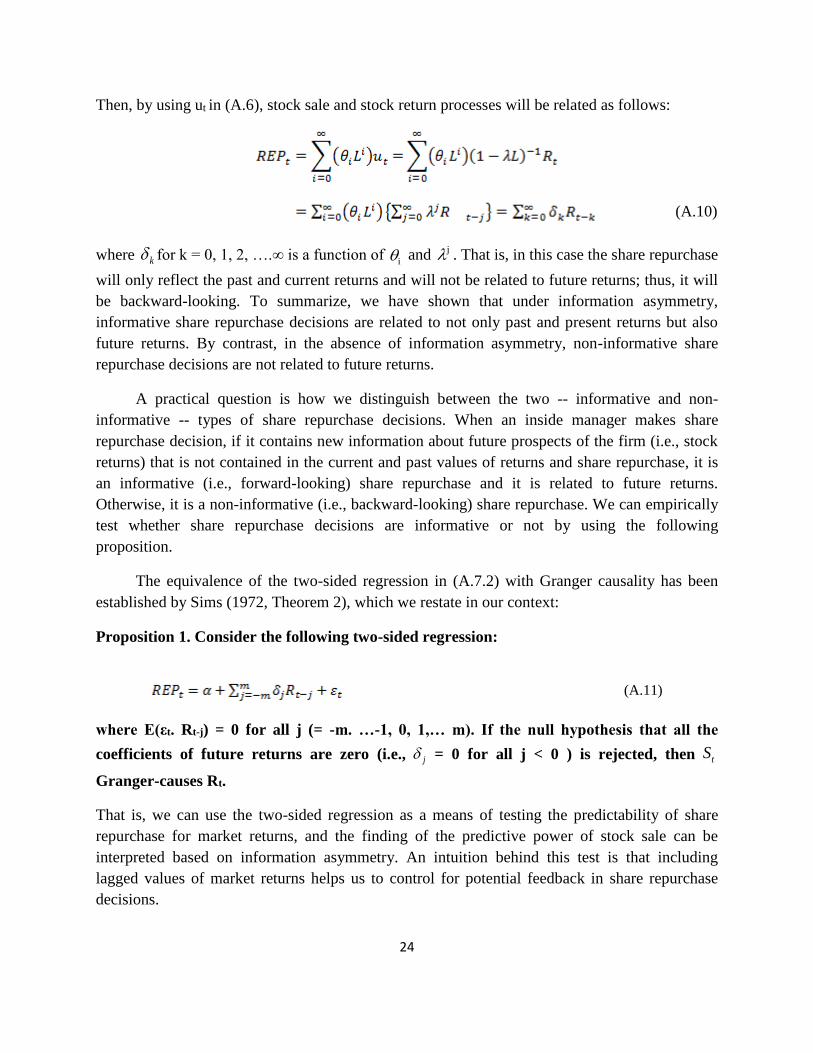
Then, by using ut in (A.6), stock sale and stock return processes will be related as follows:
(A.10)
where k for k = 0, 1, 2, ….∞ is a function of i and
j . That is, in this case the share repurchase
will only reflect the past and current returns and will not be related to future returns; thus, it will
be backward-looking. To summarize, we have shown that under information asymmetry,
informative share repurchase decisions are related to not only past and present returns but also
future returns. By contrast, in the absence of information asymmetry, non-informative share
repurchase decisions are not related to future returns.
A practical question is how we distinguish between the two -- informative and non-
informative -- types of share repurchase decisions. When an inside manager makes share
repurchase decision, if it contains new information about future prospects of the firm (i.e., stock
returns) that is not contained in the current and past values of returns and share repurchase, it is
an informative (i.e., forward-looking) share repurchase and it is related to future returns.
Otherwise, it is a non-informative (i.e., backward-looking) share repurchase. We can empirically
test whether share repurchase decisions are informative or not by using the following
proposition.
The equivalence of the two-sided regression in (A.7.2) with Granger causality has been
established by Sims (1972, Theorem 2), which we restate in our context:
Proposition 1. Consider the following two-sided regression:
(A.11)
where E(εt. Rt-j) = 0 for all j (= -m. …-1, 0, 1,… m). If the null hypothesis that all the
coefficients of future returns are zero (i.e., j = 0 for all j < 0 ) is rejected, then tS
Granger-causes Rt.
That is, we can use the two-sided regression as a means of testing the predictability of share
repurchase for market returns, and the finding of the predictive power of stock sale can be
interpreted based on information asymmetry. An intuition behind this test is that including
lagged values of market returns helps us to control for potential feedback in share repurchase
decisions.

25
Equivalently, the Granger causality in (A.11), which is based on the two-sided regression in
(A.7.2) by Sims (1972, Theorem 2), can be tested by the null hypothesis that j = 0 for all j < 0
based on the following regression, which is based on usual (equivalent) one-sided Granger-
causality tests:
(A.12)
That is, we can use a one-sided Granger causality test in (A.12) as a means of testing the
predictability of the share repurchase for stock market returns, and the finding of the predictive
power of the share repurchase can be interpreted based on information asymmetry. The intuition
behind this test is that including lagged values of market returns helps us to control for potential
feedback in share repurchase decisions.
26
Table 1. Announcement Returns and Summary Statistics
REP% is the dollar value of the announced repurchase program divided by firm market
capitalization. Value of Transaction is the dollar value of the repurchase in millions of dollars.
CAR (-1, +1) is the cumulative abnormal return over the period one day prior to the announced
repurchase to one day after the announcement. The abnormal returns are calculated using a
market model with the estimation window of (-252, -44).
N Mean Median Min Max S.D.
REP% 8,232 8.59% 5.90% 0.72% 100% 9.53
Value of Transaction (Mil) 8,247 168.38 14.97 0 36,200 888.63
CAR (-1, +1) 8,859 2.77% 1.78% -13.11% 22.82% 8.40
27
Table 2. Firm by Firm Regressions
This table presents the results of regressions for each firm having completed a repurchase over
the period 1990-2011. All available firm-months are included in the sample. RETURN is the
monthly return for a given firm in month t from CRSP. REP is an indicator equal to one if the
current month contains a repurchase announcement and is equal to zero otherwise. REP% is the
percent of the firm to be repurchased in a given month and is equal to the dollar value of the
repurchase divided by the market value of the firm in a given month.
Panel A: REP Regression
N Mean Median Min Max S.D.
F-Stat (REP) 8,859 0.56 0.18 0 6.28 1.03
P-Value (REP) 8,859 0.8 0.98 0 0.99 0.31
Significant (REP) (p<.05) 600
Not Significant (REP) (p>=.05) 8,259
Panel B: REP% Regression
N Mean Median Min Max S.D.
F-Stat (REP%) 7,781 6.16 1.26 0.05 143.75 20.6
P-Value (REP%) 7,781 0.4 0.28 0 0.99 0.37
Significant (REP%) (p<.05) 2,843
Not Significant (REP%) (p>=.05) 6,016

28
Table 3. Abnormal Returns and Information Asymmetry
This table presents the results of difference in means tests for each firm having completed a
repurchase over the period 1990-2011. The announcement abnormal return for the repurchasing
firm is compared between informed repurchases and non-informed repurchases. CAR (-1, +1) is
the cumulative abnormal return over the period one day prior to the announced repurchase to one
day after the announcement. The abnormal returns are calculated using a market model with the
estimation window of (-252, -44). INFORMED is an indicator equal to one if the firm causality
regression yielded a p-value of < 0.05 for the six months lagged terms for repurchases. The
(REP) or (REP%) next to INFORMED indicates if the informed indicator is based on a
repurchase indicator or the relative size of the repurchase. SMALL is an indicator equal to one if
the market value of the firm at the time of the repurchase announcement is below the median and
is zero otherwise. REP is an indicator equal to one if the current month contains a repurchase
announcement and is equal to zero otherwise. REP% is the percent of the firm to be repurchased
in a given month and is equal to the dollar value of the repurchase divided by the market value of
the firm in a given month. ***, **, and * represent statistical significance at the 1%, 5%, and 10%
level, respectively.
Panel A: All Firms
Mean CAR N
Informed (REP) 3.43% 453
Uninformed (REP) 2.73% 8,438
Difference (REP) 0.70%*
Informed (REP%) 3.09% 2,420
Uninformed (REP%) 2.65% 6,471
Difference (REP%) 0.44%**
Panel B: Small Firms
Mean CAR N
Informed (REP) 5.48% 227
Uninformed (REP) 3.89% 4,332
Difference (REP) 1.60%**
Informed (REP%) 4.41% 1,355
Uninformed (REP%) 3.79% 3,204
Difference (REP%) 0.62%**
29
Panel C: Large Firms
Mean CAR N
Informed (REP) 1.36% 226
Uninformed (REP) 1.51% 4,106
Difference (REP) -0.15%
Informed (REP%) 1.41% 1,065
Uninformed (REP%) 1.53% 3,267
Difference (REP%) -0.12%

30
Table 4. Abnormal Returns and Information Asymmetry Regressions
This table presents the results of regressions for each firm having completed a repurchase over
the period 1990-2011. The announcement abnormal return for the repurchasing firm is the
dependent variable. Specifically, CAR (-1, +1) is the dependent variable and is the cumulative
abnormal return over the period one day prior to the announced repurchase to one day after the
announcement. The abnormal returns are calculated using a market model with the estimation
window of (-252, -44). INFORMED is an indicator equal to one if the firm causality regression
yielded a p-value of < 0.05 for the six months lagged terms for repurchases. The (REP) or
(REP%) next to INFORMED indicates if the informed indicator is based on a repurchase
indicator or the relative size of the repurchase. REP is an indicator equal to one if the current
month contains a repurchase announcement and is equal to zero otherwise. REP% is the percent
of the firm to be repurchased in a given month and is equal to the dollar value of the repurchase
divided by the market value of the firm in a given month. SMALL is a sub-sample of regressions
if the market value of the firm at the time of the repurchase announcement is below the median.
LARGE is a sub-sample of regressions if the market value of the firm at the time of the
repurchase announcement is above the median. ***, **, and * represent statistical significance at the 1%,
5%, and 10% level, respectively.
Panel A: All Firms
(1) (2) (3) (4)
Informed (REP) 0.007*
0.006
(0.004)
(0.004)
Informed (REP %)
0.004**
0.005**
(0.002)
(0.002)
REP %
-0.001 -0.001
(0.001) (0.001)
Constant 0.027*** 0.026*** 0.027*** 0.026***
(0.001) (0.001) (0.001) (0.001)
Observations 8,891 8,891 8,232 8,232
R-squared 0.000 0.001 0.001 0.001
31
Panel B: Small Firms
(1) (2) (3) (4)
Informed (REP) 0.016**
0.014**
(0.006)
(0.006)
Informed (REP %)
0.006**
0.006**
(0.003)
(0.003)
REP %
-0.001* -0.001*
(0.001) (0.001)
Constant 0.039*** 0.038*** 0.039*** 0.038***
(0.001) (0.002) (0.001) (0.002)
Observations 4,559 4,559 4,115 4,115
R-squared 0.001 0.001 0.002 0.002
Panel C: Large Firms
(1) (2) (3) (4)
Informed (REP) -0.001
-0.001
(0.005)
(0.005)
Informed (REP %)
-0.001
-0.001
(0.002)
(0.002)
REP %
0.051*** 0.051***
(0.013) (0.013)
Constant 0.015*** 0.015*** 0.011*** 0.012***
(0.001) (0.001) (0.002) (0.002)
Observations 4,332 4,332 4,117 4,117
R-squared 0.000 0.000 0.004 0.004

32
Table 5. Abnormal Returns and Repurchase Frequency
CAR (-1, +1) is the cumulative abnormal return over the period one day prior to the announced
repurchase to one day after the announcement. The abnormal returns are calculated using a market model
with the estimation window of (-252, -44). The reported results are based on the number of repurchases a
given firm has announced during the sample period 1990-2011.
One Rep Two Rep Three Rep Four Rep
CAR (-1, +1) 3.24% 2.46% 1.92% 1.58%
N 4,495 3,074 1,110 212

33
Table 6. Information Asymmetry and Repurchase Frequency Regressions
This table presents the results of regressions for each firm having completed a repurchase over the period
1990-2011. The announcement abnormal return for the repurchasing firm is the dependent variable.
Specifically, CAR (-1, +1) is the dependent variable and is the cumulative abnormal return over the
period one day prior to the announced repurchase to one day after the announcement. The abnormal
returns are calculated using a market model with the estimation window of (-252, -44). INFORMED is an
indicator equal to one if the firm causality regression yielded a p-value of < 0.05 for the six months
lagged terms for repurchases. The (REP) or (REP%) next to INFORMED indicates if the informed
indicator is based on a repurchase indicator or the relative size of the repurchase. Rep. Freq. is the
number of repurchase programs announced by a given firm during the sample period. REP% is the
percent of the firm to be repurchased in a given month and is equal to the dollar value of the repurchase
divided by the market value of the firm in a given month. SMALL is a sub-sample of regressions if the
market value of the firm at the time of the repurchase announcement is below the median. LARGE is a
sub-sample of regressions if the market value of the firm at the time of the repurchase announcement is
above the median. ***, **, and * represent statistical significance at the 1%, 5%, and 10% level, respectively.
Panel A: All Firms
(1) (2) (3) (4)
ALL ALL ALL ALL
Informed (REP) 0.007*
0.006
(0.004)
(0.004)
Rep. Freq. -0.006*** -0.006*** -0.007*** -0.006***
(0.001) (0.001) (0.001) (0.001)
Informed (REP %)
0.004*
0.004**
(0.002)
(0.002)
REP %
-0.001 -0.001*
(0.001) (0.001)
Constant 0.038*** 0.037*** 0.038*** 0.037***
(0.002) (0.002) (0.002) (0.002)
Observations 8,891 8,891 8,232 8,232
R-squared 0.004 0.004 0.005 0.005

34
Panel B: Small Firms
(1) (2) (3) (4)
SMALL SMALL SMALL SMALL
Informed (REP) 0.016**
0.014**
(0.006)
(0.006)
Rep. Freq. -0.003 -0.003 -0.004** -0.004**
(0.002) (0.002) (0.002) (0.002)
Informed (REP %)
0.006**
0.006**
(0.003)
(0.003)
REP %
-0.001* -0.001*
(0.001) (0.001)
Constant 0.044*** 0.043*** 0.046*** 0.044***
(0.003) (0.003) (0.003) (0.004)
Observations 4,559 4,559 4,115 4,115
R-squared 0.002 0.001 0.003 0.003
Panel C: Large Firms
(1) (2) (3) (4)
LARGE LARGE LARGE LARGE
Informed (REP) -0.002
-0.001
(0.005)
(0.005)
Rep. Freq. -0.003** -0.003** -0.002 -0.002
(0.001) (0.001) (0.001) (0.001)
Informed (REP %)
-0.002
-0.002
(0.003)
(0.002)
REP %
0.050*** 0.050***
(0.013) (0.013)
Constant 0.020*** 0.020*** 0.015*** 0.016***
(0.003) (0.003) (0.003) (0.003)
Observations 4,332 4,332 4,117 4,117
R-squared 0.001 0.001 0.004 0.004

35
Table 7. Determinants of Informed Repurchases
This table presents the results of regressions for each firm having completed a repurchase over the period
1990-2011. INFORMED is the dependent variable and is an indicator equal to one if the firm causality
regression yielded a p-value of < 0.05 for the six months lagged terms for repurchases. The (REP) or
(REP%) next to INFORMED indicates if the informed indicator is based on a repurchase indicator or the
relative size of the repurchase. Rep. Freq. is the number of repurchase programs announced by a given
firm during the sample period. REP% is the percent of the firm to be repurchased in a given month and is
equal to the dollar value of the repurchase divided by the market value of the firm in a given month.
SMALL is a sub-sample of regressions if the market value of the firm at the time of the repurchase
announcement is below the median. LARGE is a sub-sample of regressions if the market value of the
firm at the time of the repurchase announcement is above the median. ***, **, and * represent statistical
significance at the 1%, 5%, and 10% level, respectively.
Panel A: All Firms
(1) (2) (3) (4)
INF (REP) INF (REP %) INF (REP) INF (REP %)
ALL ALL ALL ALL
Rep. Freq. -0.001 -0.043*** -0.002 -0.047***
(0.003) (0.006) (0.003) (0.006)
REP %
-0.000 0.006*
(0.002) (0.003)
Constant 0.052*** 0.344*** 0.054*** 0.372***
(0.005) (0.011) (0.006) (0.012)
Observations 8,891 8,891 8,232 8,232
R-squared 0.000 0.006 0.000 0.007

36
Panel B: Small Firms
(1) (2) (3) (4)
INF (REP) INF (REP %) INF (REP) INF (REP %)
SMALL SMALL SMALL SMALL
Rep. Freq. 0.005 -0.024** 0.003 -0.028***
(0.005) (0.010) (0.005) (0.011)
REP %
-0.000 0.006*
(0.002) (0.003)
Constant 0.042*** 0.332*** 0.047*** 0.371***
(0.008) (0.016) (0.008) (0.018)
Observations 4,559 4,559 4,115 4,115
R-squared 0.000 0.001 0.000 0.002
Panel C: Large Firms
(1) (2) (3) (4)
INF (REP) INF (REP %) INF (REP) INF (REP %)
LARGE LARGE LARGE LARGE
Rep. Freq. -0.005 -0.047*** -0.005 -0.046***
(0.004) (0.008) (0.004) (0.008)
REP %
-0.005 0.009
(0.043) (0.085)
Constant 0.062*** 0.333*** 0.062*** 0.343***
(0.008) (0.016) (0.009) (0.018)
Observations 4,332 4,332 4,117 4,117
R-squared 0.000 0.008 0.000 0.008


