
Incidence and Impact of Electronic Billing Machines
for VAT in Rwanda∗
Nada Eissa† and Andrew Zeitlin‡
with Saahil Karpe§ and Sally Murray¶
Report submitted by the International Growth Centre
November 2014
Executive Summary
The expansion of the tax base in developing countries is increasingly recognized as an important
policy goal, as an increase in domestic revenue sources promises to reduce aid dependence and
reduce distortionary consequences of taxes on externally traded goods. This paper analyzes the
adoption rate and tax compliance impacts of an innovative program in Rwanda, which introduced
Electronic Billing Machines to strengthen VAT compliance. To do so, we combine quarterly data on
all VAT payments from 2012 through 2014q3 with data on EBM activation over the same period.
During the period studied, EBM adoption rates were have grown rapidly, with 77.8 percent of
tax-paying firms using active EBMs by 2014q3, though this growth is unevenly distributed across
economic sectors. The adoption of an EBM has a statistically and economically significant impact
on VAT payments, raising these by an average of 6.5 percent. These impacts vary substantially
by sector of economic activity, with firms engaged in computing/printing, construction, and retail
sectors experiencing the largest impacts. Taken together, these findings suggest scope for targeting
future encouragement activities toward specific economic sectors, such as construction, with low
adoption rates and high impacts for those that did adopt. In addition, a small-scale ‘mystery
shopper’ exercise suggests that there remains significant scope for improvement in the utilization
of EBMs even among those firms that already have them in place.
∗We wish to thank, without implicating, Richard Dada, Agnes Kanyangeyo, Leonard Rugwabiza Minega, and seminar
participants at the Rwanda Revenue Authority, for guidance and comments on a preliminary draft of this report. All
remaining errors are our own.†McCourt School of Public Policy, Georgetown University and Lead Academic, IGC South Sudan‡McCourt School of Public Policy, Georgetown University and Lead Academic, IGC Rwanda§McCourt School of Public Policy, Georgetown University¶IGC Rwanda
1
In this paper, we assess the incidence and revenue impacts of Electronic Billing Machines on VAT-
paying enterprises in Rwanda. Electronic Billing Machines (EBMs) represent a potentially important
tax administration initiative, aimed at improving VAT compliance by transmitting transaction records
directly to the Rwanda Revenue Authority in real time. The paper makes use of data on both VAT
payments (from 2012q1–2014q3 inclusive) and EBM adoption during the same time to address three
primary questions: what are the characteristics of firms who have adopted EBMs; what has the
overall effect of EBM adoption been on revenue generated from VAT; and how do these impacts vary
by enterprise sector, size, and location.
Our main findings are as follows. We find that adoption through 2014q3 has been rapid and
widespread, arriving at 77.8 percent of active taxpayers in that quarter, though growth has slowed
and adoption rates are low in a few economic sectors in particular. The average impact of EBM
adoption on enterprises’ VAT payments is estimated to be approximately 6.5 percent. Estimated
impacts vary substantially by sector and size. In general, EBM impacts are greater for smaller
firms and for firms in sectors such as printing & computing services, construction, and retail, where
pre-intervention VAT compliance may have been comparatively low. Finally, a small-scale ‘mystery
shopper’ survey reveals that—at least for low-cost goods in Kigali retail stores—EBM utilization is
low, but responsive to consumer requests for formal receipts. Taken together, these findings suggest
that future strategies could appropriately be focused on concentrating the expansion of EBM coverage
on specific sectors where both adoption rates are low and potential impacts are highest, while building
on existing policies to strengthen enterprises’ incentives to report transactions through EBMs.
1 Context
In August 2013, new legislation was introduced in Rwanda, to assist firms’ book-keeping, to level
the playing field amongst all retailers, and, most importantly, to reduce tax evasion for value added
tax (VAT). This legislation, announced in Ministerial Order 002/13/10, and the accompanying Com-
missioner General (CG) rules,1 states that businesses registered for VAT must provide customers,
at each sale, a certified VAT receipt generated by an Electronic Billing Machine purchased from an
Rwanda Revenue Authority (RRA)-approved vendor and activated by RRA. This EBM must consist
in a Certified Invoicing System (CIS) and a Sales Data Controller (SDC) working together.
In time all firms must have and use active, verified, EBM machines. However, the programme
is being rolled out in stages, with firms that must comply announced by intermittent public notices
(with the exception of those awarded exemptions, as described below). By the end of all stages of
notices, every registered business in Rwanda will be legally required to provide a certified EBM receipt
for all sales; if a business does not have EBM installed by their assigned date, they will be due a large
fine.
EBM machines can malfunction, or suffer power outages. If a machine malfunctions, the firm “is
obligated to notify Authority [RRA] as soon as possible and to have the machine repaired within 48
hours, during which period the user must continue issuing hand-written VAT receipts.” Once the
machine is fixed, the sales recorded in these hand-written receipts must be entered into the EBM,
and stored together with the new certified receipts. Likewise, if there is a power failure, hand-written
receipts must be issued until power is restored, at which point they must be entered into the electronic
system.
1For all EBM-related laws and rules, see http://www.rra.gov.rw/rra_article1037.html
2

Certain exemptions from EBM usage and VAT payment are achievable. Firstly, certain items are
tax exempt by law: these must still be processed using EBM, but if entered under the correct code,
are automatically processed at the zero percent tax rate. Exemptions from EBM usage (but not from
VAT) can also be awarded at the firm level through application to RRA. Such firms can be awarded
an exemption from EBM reporting if they can demonstrate that either:
1. their annual sales total less than FRW 1.2m;
2. the vast majority of their sales are VAT exempt, and VAT-qualifying sales are minimal;
3. their VAT-qualifying sales only take place at very limited periods during the year; or
4. their current VAT system is sufficient and using EBMs causes “unfair technical difficulty”.
2 Data
Our analysis draws on two Rwanda Revenue Authority (RRA) data sets.
First, to estimate patterns in VAT payments among EBM- and non-EBM firms, both before and
after adoption of this technology, we make use of data that include the universe of VAT payments
from January 1, 2012 to September 30, 2014. In addition to payment types, dates, and amounts,
these data also include the primary firm activity, which we use to classify firms by sector as described
below. We aggregate VAT payments to the quarterly level, and conduct our analysis at that level.
The data use therefore comprise 9,655 unique firms (defined by the taxpayer ID number) who pay
VAT between 2012q1 and 2014q3, inclusive. Because not every firm has paid VAT in each of these
quarters, the resulting firms comprise an unbalanced panel, paying VAT in a total of 50,768 quarters
in the period and data we study.
Figure 1: Identification of a valid EBM receipt
Source: Rwanda Revenue Authority, “Electronic Billing Machines; Presentation for Foreign Visitors”
3

Second, to assign EBM ‘treatment’ status to each firm in each quarter, we use RRA’s EBM
registration data. These show for each EBM machine (identified by an SDC code), the firm name,
tax identification number (TIN), EBM activation date, EBM personalization date, location, and
product/activity type for the firm to which it belongs. Any single firm may have more than one EBM
machine, in which case a firm has multiple entries and its single TIN is associated with multiple SDC
IDs. This dataset is continuously updated at RRA as EBM registrants come online, and we use a
version up-to-date as of October 27, 2014.
Using these data, we define a firm as ‘treated’ with an EBM in a given quarter if it had at least
one SDC code shown as activated before the last date of that quarter. This approach ensures that
we do not understate EBM impacts by treating a given firm as though it had an active EBM, when
in fact it had only begun the registration process but did not yet have an active machine. However,
since a large number of firms were in the process of complying with EBM requirements as of the end
of the third quarter, 2014, this choice of definition has important implications for the total take-up
numbers that we report. Our take-up numbers should be taken as a lower bound, since they do not
count firms that had begun the registration process by September 30, 2014, but had not yet had their
EBMs fully activated prior to that date.
In the analysis that follows, we make use of three observable, predetermined characteristics of
firms in the RRA data: sector of economic activity, tax center, and pre-program VAT submissions.2
Table 1: Enterprise sectors
VAT, 2012q1sectors RRA activity codes firms mean st. dev.
retail 11 2,161 698,581 2,929,317wholesale 11 1,495 2,494,526 9,527,821construction1 9 1,347 5,493,360 27,924,238other services2 1 901 4,314,311 18,582,958transportation3 20 588 4,783,002 24,961,600business services4 10 448 9,555,305 42,022,100restaurants 4 382 1,665,780 5,283,065computing5 7 241 2,955,765 7,728,985manufacturing 30 183 66,126,192 337,002,080hotels 1 103 10,399,403 35,492,244telecoms 1 63 211,952,224 694,998,208
total 105 7,913 6,167,368 75,998,720
1 Includes architecture, engineering, and construction services. 2 Enterprises in this sector correspond to the RRA
activity code ‘other service activities’. 3 Includes domestic and international freight, as well as clearing agents. 4 Includes
advertising, legal, financial, and management consultancy. 5 Includes computing services, software, and printing.
We define a set of eleven sectors based on the enterprise’s primary activity in RRA’s tax payments
database. There are a total of 170 such activity codes among VAT-paying enterprises between 2012
and 2014 in RRA’s data. Since such a large number would both stretch statistical power and pose
challenges for interpretation, we aggregate these codes into a set of broad categories covering the
largest sectors in the data. These are outlined in Table 1. The 11 sectors that resulted cover all RRA
2In order to estimate causal effects of EBMs by observable subgroups, it is necessary that the characteristics used todefine these subgroups be ‘predetermined’ with respect to the EBM treatment, in the sense that they cannot be affectedby EBM adoption.
4

activity codes with at least 200 firms. As Table 1 shows, the sectors so defined vary in the number
of corresponding RRA activity codes, and in the corresponding number of firms. Table 1 presents
means and standard deviations of VAT payments for all of these firms paying VAT in 2012q1, prior
to the introduction of EBMs.
In our data, geography is proxied by the tax center to which a given enterprise submits its taxes.
Table 2 describes the 31 tax centers to which enterprises in our data submit VAT from 2012q1 through
2014q3.3 This table shows that there is substantial heterogeneity across tax centers. The number of
enterprises submitting VAT to a given tax center ranges from fewer than 10 to 4,627 in the case of
Kigali Small TC. While retail is the most common sector for the majority of tax centers, wholsale,
‘other service activities’, construction, and business services also feature prominently.
We also use deciles of pre-program VAT submissions to examine whether firms who appeared
smaller in pre-EBM data respond differently to the advent of EBMs. To do so, we will focus on
enterprises that submit VAT in 2012q1—again, it is important for identification purposes to use levels
of VAT payment that predate EBM introduction for all firms.
Figure 2: Pre-treatment VAT payments
Notes: Figure shows the distribution of pre-treatment (2012q1) VAT payments. Horizontal axis is on a log scale, with
amounts in FRW indicated. Shaded areas indicate decile groups used in subsequent analysis.
Figure 2 shows the distribution of quarterly VAT payments for 2012q1. The data are highly
skewed, with many firms concentrated at the low end of the payments distribution, so we plot these
on a log scale. The shaded regions of Figure 2 show the deciles that will be used for analytical purposes.
These imply, for example, that firms at the 10th, 50th, and 90th percentiles of the distribution paid
FRW 14,975, FRW 211,631, and FRW 5,861,815, respectively, for that quarter.
3While we will generally interpret this variable as a measure of geography, several of the tax centers apply toenterprises in Kigali; we do not aggregate these since they serve distinct subpopulations by location or by enterprisetype, and because the tax center may be an analytical unit of interest to RRA per se.
5

Table 2: Descriptive statistics by Tax Center
VAT, 2012q1enterprisese sector mean st dev
Bugesera 49 retail 744,804 1,561,984Gasabo 99 retail 1,366,759 3,043,999Gatsibo 13 retail 7,390 .Gicumbi 78 retail 668,334 1,049,748Huye 255 retail 550,430 1,136,456Kabuga 28 construction 3,538,286 9,330,623Kamonyi 3 retailKarongi 91 wholesale 601,548 1,445,434Kayonza 7 retailKicukiro 31 retail 484,426 1,223,653Kigali LTO 273 construction 84,604,676 324,017,948Kigali Medium 1,105 retail 1,646,584 4,387,896Kigali Small 4,627 wholesale 1,198,093 12,143,483Kirehe 28 retail 290,909 403,425Muhanga 291 retail 484,988 1,843,759Musanze 318 retail 848,353 3,839,546Ngoma 163 retail 203,423 478,399Ngororero 7 business services 261,073 297,273Nyagatare 69 wholesale 305,727 557,501Nyamagabe 91 retail 487,424 830,732Nyamasheke 23 retail 315,468 573,601Nyanza 90 retail 244,584 748,586Nyarugenge 351 retail 1,725,786 7,382,548Nyaruguru 1 constructionRubavu 313 retail 1,551,374 3,857,491Ruhango 34 retail 84,559 124,875Rulindo 4 wholesaleRusizi 365 retail 235,816 529,007Rutsiro 1 retailRwamagana 101 retail 2,182,244 10,148,008Top Medium 345 other services 9,549,133 16,559,248
Notes: Variable enterprises gives the total number of enterprises filing taxes at a given tax center over the period
2012q1 - 2014q3 inclusive. Sector is defined as the most common sector among enterprises filing taxes at that tax center.
The final two columns present the mean and standard deviation, respectively, of VAT payments for 2012q1. Note that
not all firms in our data paid VAT in this quarter (some may be more recent enterprises); consequently, there are no
data to compute summary statistics for that quarter for some tax centers.
6
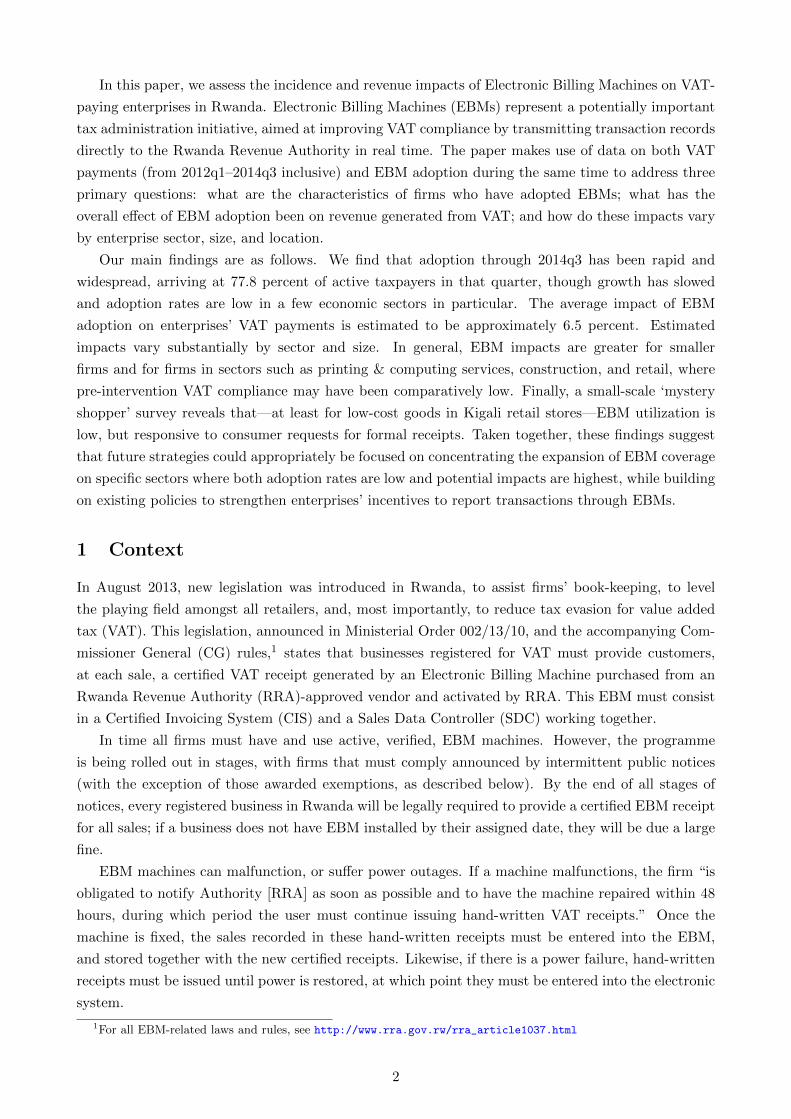
3 Takeup
Total utilization has increased dramatically since the pilot phase of EBMs, continuing through the
first two quarters of 2014, though this pace of expansion appears to have slowed down somewhat in
the third quarter.
Figure 3 illustrates this overall trend. This figure presents the total number of firms who paid VAT
in each quarter, and who had completed the activation process for at least one EBM by the end of
that quarter (this coincides with the definition of EBM ‘treatment’ that we will use to study impacts
in the following section). Thus the numbers reflected for each quarter represent a lower bound on
the number of entrepreneurs who have initiated the process of adopting EBMs; in each quarter, there
will be a number of firms who have begun the process but have not yet achieved the final (activation)
stage by the close of the quarter. Even by this conservative estimate, a total of 3,943 taxpaying firms
had active EBMs by September 30, 2014. This corresponds to 77.8 percent of those who paid VAT
in 2014q3.
Figure 3: Taxpayers with activated EBMs
Notes: Figure counts taxpayers as having activated EBMs in a given quarter if activation date occurs before the close of
that quarter. Consequently, estimated activations by 2014q1 do not include firms that had begun—but not completed—
activation process by April 1, 2014.
In Table 3, we show how the activation rates achieved by September 30, 2014 vary by the sectors
previously defined in Table 1. The first column of this table presents the fraction of VAT-paying
enterprises in each sector who had a fully activated EBM by the close of 2014q3, while the second
column shows firms with either an activated or personalized EBM by the closing date of September
30.4
Completed EBM adoption as of 2014q3 was highest in the hotel and restaurant sectors, at 89.2
and 87.8 percent, respectively, with hotels and wholesalers following suit. Transportation services,
and wholesale and retail trade follow closely behind with high compliance rates. Perhaps surprisingly,
adoption was lowest—at a mere 38.8 percent—in the group of activities that we have defined here as
4Personalization refers to an earlier step in the preparation of EBMs. Thus, all activated firms have a personalizedEBM.
7

‘business services’, which includes legal, financial, management, and advertising consultancy services.
Administrative data also allow us to understand how firm sizes—as measured by pre-EBM VAT
payment levels—are associated with adoption rates. This might suggest whether, for example, financ-
ing constraints for small firms are prohibitive. To assess this, Figure 4 plots average activation rates
for VAT-paying firms across a measure of firm size, for each of the four quarters from 2013q4–2014q3.
We continue to use 2012q1 VAT payments (in logs) as a measure of firm size, since the use of pre-
program VAT levels addresses an endogeneity concern: EBM use itself is likely to change reported
tax liabilities.
Figure 4 shows that, while larger firms were more likely to be early adopters of EBMs, by the
second quarter of 2014 smaller firms had caught up entirely. As of the close of 2014q3, there remained
no systematic relationship between firm size and EBM activation rates.
Taken together, the patterns of growth in EBM adoption suggest that utilization has grown quickly,
but that this growth has begun to slow, with pockets of low compliance in a few sectors. An important,
remaining policy question is the cost effectiveness of the set of policy tools available to RRA to address
the ‘last mile’ challenge of attaining complete coverage, and how these should be targeted. We argue
that such targeting should take into account the heterogeneity in EBM’s impacts across sectors. We
return to this topic after describing these impacts.
4 Average impacts of EBM on VAT payments
To estimate the impacts of EBM on VAT payments, we merge the full set of VAT payments from 2012
onwards with data on the activation date of firms. We estimate impacts at the firm-quarter level,
adjusting for quarterly aggregate shocks and controlling for firm characteristics as outlined in the
discussion of the identification strategy in Subsection 4.1 below. Our preferred estimate, presented
in the empirical results of Subsection 4.2, is that the adoption of EBMs has caused firms to increase
their VAT payments by an average of 6.5 percent.
Table 3: EBM adoption rates by sector, as of 2014q3
activated personalized
retail 82.2 86.8wholesale 84.7 87.9manufacturing 74.6 76.9business services 38.8 40.2transportation 84.8 87.5restaurants 87.8 90.6hotels 89.2 90.5computing 79.8 82.3construction 64.2 68.5telecoms 69.7 72.7other services 73.5 76.5
Notes: Figures reported are the fraction of enterprises that paid VAT in 2014q3 who had an activated or personalized
EBM by the close of that quarter.
8

Figure 4: Firm size and EBM adoption across quarters
Notes: Figure shows the fraction of taxpaying firms with active EBMs in each quarter from 2013q4–2014q3, by their
2012q1 (pre-EBM) VAT payment levels.
4.1 Identification strategy
To estimate the effects of EBM on VAT payments, we employ a variant on a difference-in-differences
estimator. The rich series of data provided by RRA allow us to undertake this estimation with
plausible and relatively mild assumptions about the process by which firms adopted EBMs. In this
section, we provide the technical details of this estimation strategy. Readers interested in the main
results can skip to Section 4.2.
A general framework for understanding our estimation strategy is based on the following charac-
terization of the process generating VAT data:
lnV ATisq = τEBMisq + µs + ηis + γq + qκis + εisq (1)
where lnV ATisq is the log VAT payment of enterprise i in sector s and quarter q.5 In this general
framework, EBMisq is an indicator variable taking a value of one if the firm has an active EBM within
that quarter, or zero otherwise; τ , the causal effect of EBMs, is the primary parameter of interest in
this paper. Equation (1) allows for several forms of unobserved determinants of VAT payments, which
threaten to bias estimates of τ insofar as they may be correlated with EBMisq. Addressing such biases
is the chief objective of our estimation strategy. In particular, µs and ηis are time-invariant shocks
to DGP that are sector (s) and enterprise (i) specific, respectively.6 γq represents a quarter-specific,
5As is common in such analyses, we model the log rather than level of VAT payments because the distribution of thedata is approximately log-normal, implying efficiency gains from doing so; because this specification reduces sensitivityto outliers and puts stronger weight on variation among smaller firms; and because the resulting specification has aconvenient, constant-elasticity interpretation.
6In this sense, the data-generating process of equation (1) is overparameterized, since enterprises do not switch sectorsin these data. We include sector fixed effects for expositional purposes only.
9
aggregate shock to VAT payments, while κis is a time-trend that is specific to enterprise i in sector
s. Finally, εisq is an idiosyncratic, time-varying shock that will be assumed to be uncorrelated with
EBM adoption throughout.
We present three sets of estimates for τ , increasing in their robustness to potential sources of
bias and, consequently, in the plausibility of their assumptions. First, a sector-fixed-effects estimate
exploits only variation (across enterprises and time) within each sector to identify the effects of EBM.
Second, an enterprise-fixed-effects estimate allows arbitrary correlation between unobserved enterprise
(and therefor sector) characteristics and EBM adoption. This is a classic difference-in-differences
estimator (we also include quarter indicators in each of the first two approaches to allow for aggregate
shocks to VAT payments in these periods that may be correlated with EBM adoption). Third, our
most plausibly identified estimator is a ‘triple difference’ estimator that allows for firm-specific time
trends (indicated by κis) to be arbitrarily correlated with EBM adoption. We implement this by
first-differencing the data to estimate
∆ lnV ATisq = τ∆EBMisq + κis + ∆γq + ∆εisq (2)
where the operator ‘∆’ indicates a first difference, e.g., ∆ lnV ATisq = lnV ATisq − lnV ATis,q−1.
Equation (2) will be estimated with fixed effects to capture the firm-specific trends, κis, and with
quarter dummies to capture the (change in) aggregate shocks, ∆γq. In this specification, bias arises
for the estimation of τ only if there are firm-specific, time-varying shocks to VAT payments that are
correlated with the timing of switching into EBM use. While this is certainly not impossible, given
that much of EBM adoption was driven by external pressure, we are reasonably comfortable with the
resulting estimates.
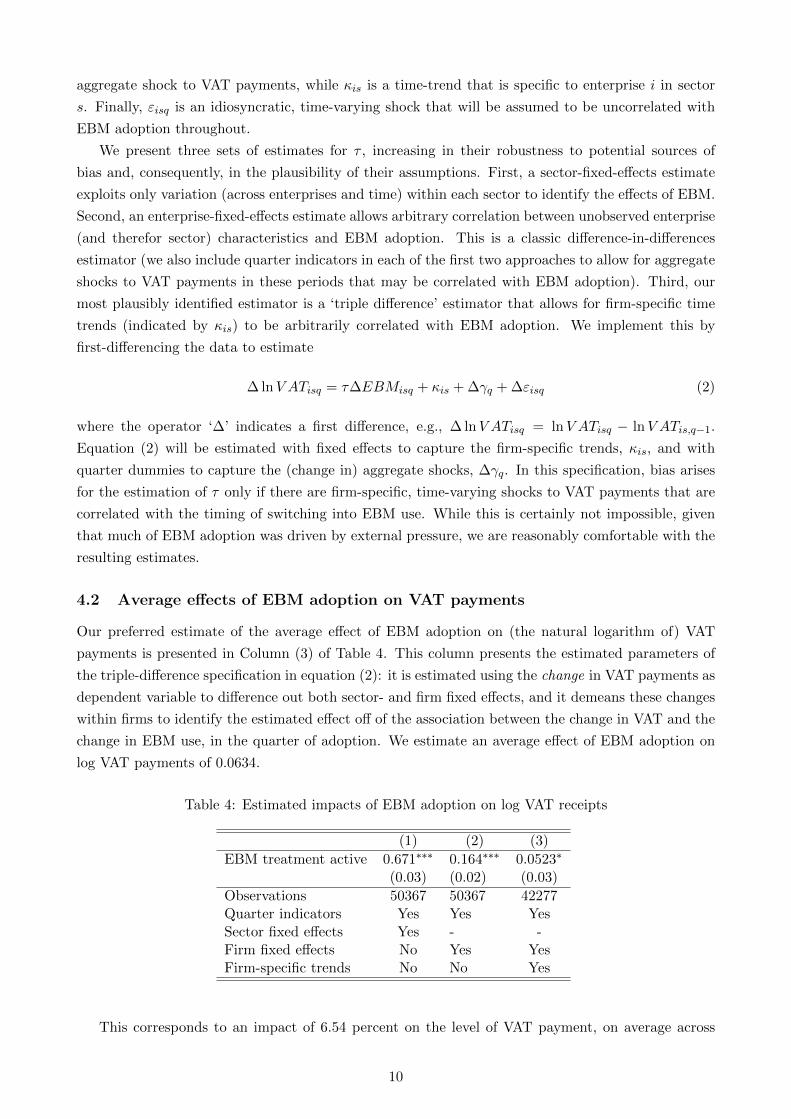
4.2 Average effects of EBM adoption on VAT payments
Our preferred estimate of the average effect of EBM adoption on (the natural logarithm of) VAT
payments is presented in Column (3) of Table 4. This column presents the estimated parameters of
the triple-difference specification in equation (2): it is estimated using the change in VAT payments as
dependent variable to difference out both sector- and firm fixed effects, and it demeans these changes
within firms to identify the estimated effect off of the association between the change in VAT and the
change in EBM use, in the quarter of adoption. We estimate an average effect of EBM adoption on
log VAT payments of 0.0634.
Table 4: Estimated impacts of EBM adoption on log VAT receipts
(1) (2) (3)
EBM treatment active 0.671∗∗∗ 0.164∗∗∗ 0.0523∗
(0.03) (0.02) (0.03)
Observations 50367 50367 42277Quarter indicators Yes Yes YesSector fixed effects Yes - -Firm fixed effects No Yes YesFirm-specific trends No No Yes
This corresponds to an impact of 6.54 percent on the level of VAT payment, on average across
10
firms. To put this in economic perspective, consider that the median firm in the first quarter of 2012
had a quarterly VAT payment of 211,631, so for such a firm the estimated impact of EBM adoption
is FRW 13,841 per quarter, or 55,363 per year. Since enterprises have been asked to cover the costs
of EBM equipment, one way to think about the merits of the EBM approach is to consider how long
it would take for the increased revenue to exceed the up-front costs of the machinery. In the pilot,
the costs of an EBM to the firm were approximately FRW 211,050, which implies that the increase in
VAT payments by the median firm will exceed the costs of the machine in just under four years. For a
firm at the 75th percentile of 2012 VAT, or 1,319,258 per quarter, the impact on VAT payments would
exceed the cost of the EBM equipment in less than a year.7 For larger enterprises—and recalling the
highly skewed distribution of value added—increased VAT payments will exceed machine costs much
sooner. Any ongoing reductions in EBM costs will further this argument, even though the outlay for
small firms may pose a liquidity challenge.
The contrast between these main results and those in columns (1) and (2) is instructive about
the nature of early adoption of EBMs. In particular, controlling for unobserved time-invariant sector
characteristics (column 1), time-invariant firm characteristics (column 2), and firm-specific trends
(column 3) that may be correlated with adoption progressively reduces the estmated effect of EBMs
from an implausibly large value of 0.652 to a reasonable value of 0.0634. This contrast confirms
intuition sectors and firms that have high levels of VAT payment, and that were on comparatively
fast-rising trends in VAT payment, were more likely to be early adopters of EBMs.
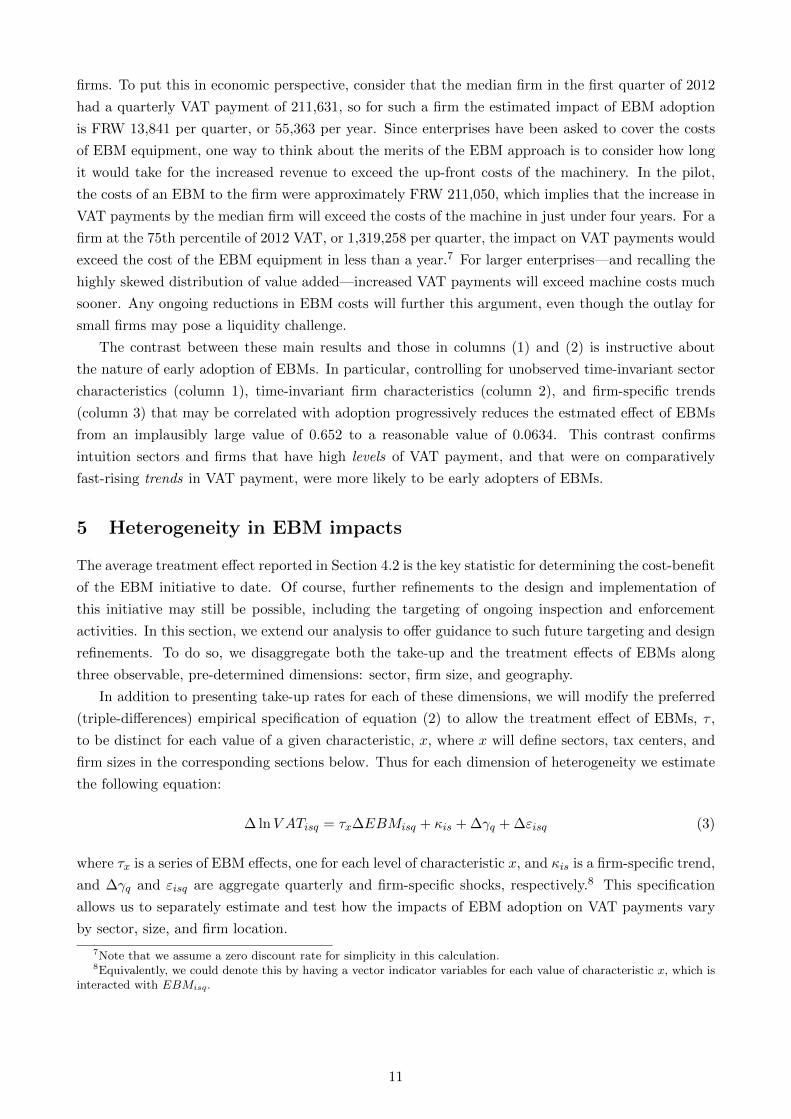
5 Heterogeneity in EBM impacts
The average treatment effect reported in Section 4.2 is the key statistic for determining the cost-benefit
of the EBM initiative to date. Of course, further refinements to the design and implementation of
this initiative may still be possible, including the targeting of ongoing inspection and enforcement
activities. In this section, we extend our analysis to offer guidance to such future targeting and design
refinements. To do so, we disaggregate both the take-up and the treatment effects of EBMs along
three observable, pre-determined dimensions: sector, firm size, and geography.
In addition to presenting take-up rates for each of these dimensions, we will modify the preferred
(triple-differences) empirical specification of equation (2) to allow the treatment effect of EBMs, τ ,
to be distinct for each value of a given characteristic, x, where x will define sectors, tax centers, and
firm sizes in the corresponding sections below. Thus for each dimension of heterogeneity we estimate
the following equation:
∆ lnV ATisq = τx∆EBMisq + κis + ∆γq + ∆εisq (3)
where τx is a series of EBM effects, one for each level of characteristic x, and κis is a firm-specific trend,
and ∆γq and εisq are aggregate quarterly and firm-specific shocks, respectively.8 This specification
allows us to separately estimate and test how the impacts of EBM adoption on VAT payments vary
by sector, size, and firm location.
7Note that we assume a zero discount rate for simplicity in this calculation.8Equivalently, we could denote this by having a vector indicator variables for each value of characteristic x, which is
interacted with EBMisq.
11
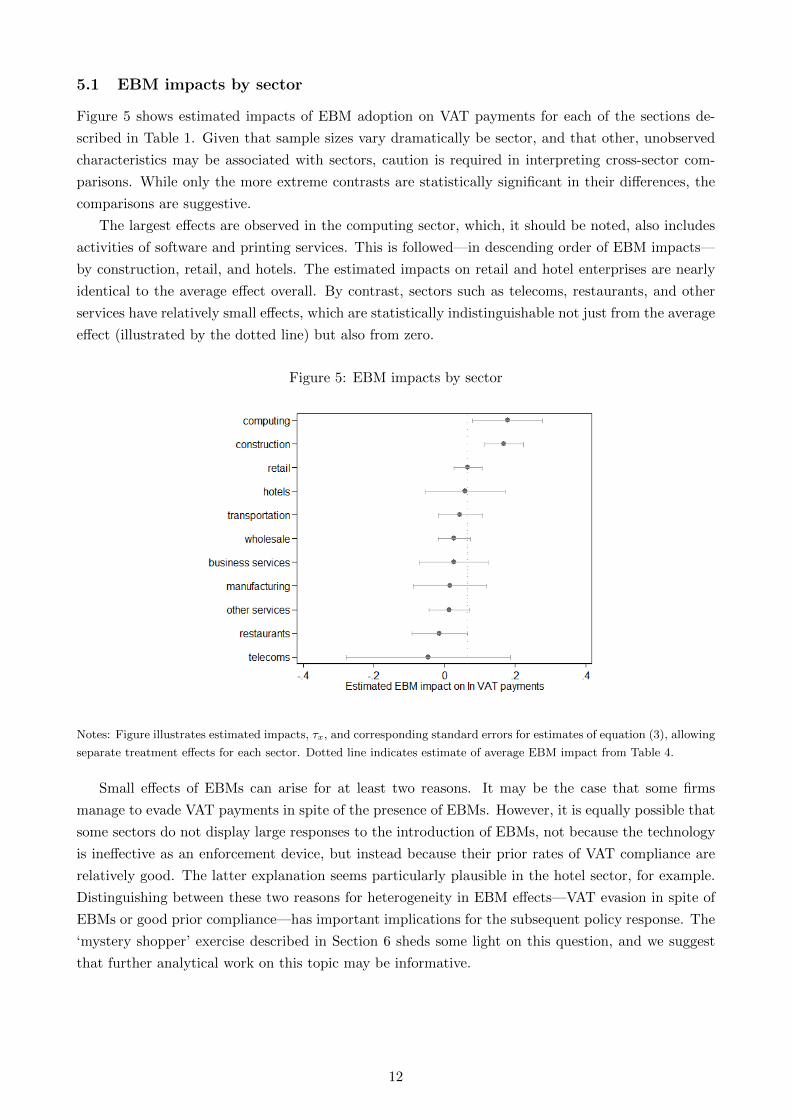
5.1 EBM impacts by sector
Figure 5 shows estimated impacts of EBM adoption on VAT payments for each of the sections de-
scribed in Table 1. Given that sample sizes vary dramatically be sector, and that other, unobserved
characteristics may be associated with sectors, caution is required in interpreting cross-sector com-
parisons. While only the more extreme contrasts are statistically significant in their differences, the
comparisons are suggestive.
The largest effects are observed in the computing sector, which, it should be noted, also includes
activities of software and printing services. This is followed—in descending order of EBM impacts—
by construction, retail, and hotels. The estimated impacts on retail and hotel enterprises are nearly
identical to the average effect overall. By contrast, sectors such as telecoms, restaurants, and other
services have relatively small effects, which are statistically indistinguishable not just from the average
effect (illustrated by the dotted line) but also from zero.
Figure 5: EBM impacts by sector
Notes: Figure illustrates estimated impacts, τx, and corresponding standard errors for estimates of equation (3), allowing
separate treatment effects for each sector. Dotted line indicates estimate of average EBM impact from Table 4.
Small effects of EBMs can arise for at least two reasons. It may be the case that some firms
manage to evade VAT payments in spite of the presence of EBMs. However, it is equally possible that
some sectors do not display large responses to the introduction of EBMs, not because the technology
is ineffective as an enforcement device, but instead because their prior rates of VAT compliance are
relatively good. The latter explanation seems particularly plausible in the hotel sector, for example.
Distinguishing between these two reasons for heterogeneity in EBM effects—VAT evasion in spite of
EBMs or good prior compliance—has important implications for the subsequent policy response. The
‘mystery shopper’ exercise described in Section 6 sheds some light on this question, and we suggest
that further analytical work on this topic may be informative.
12
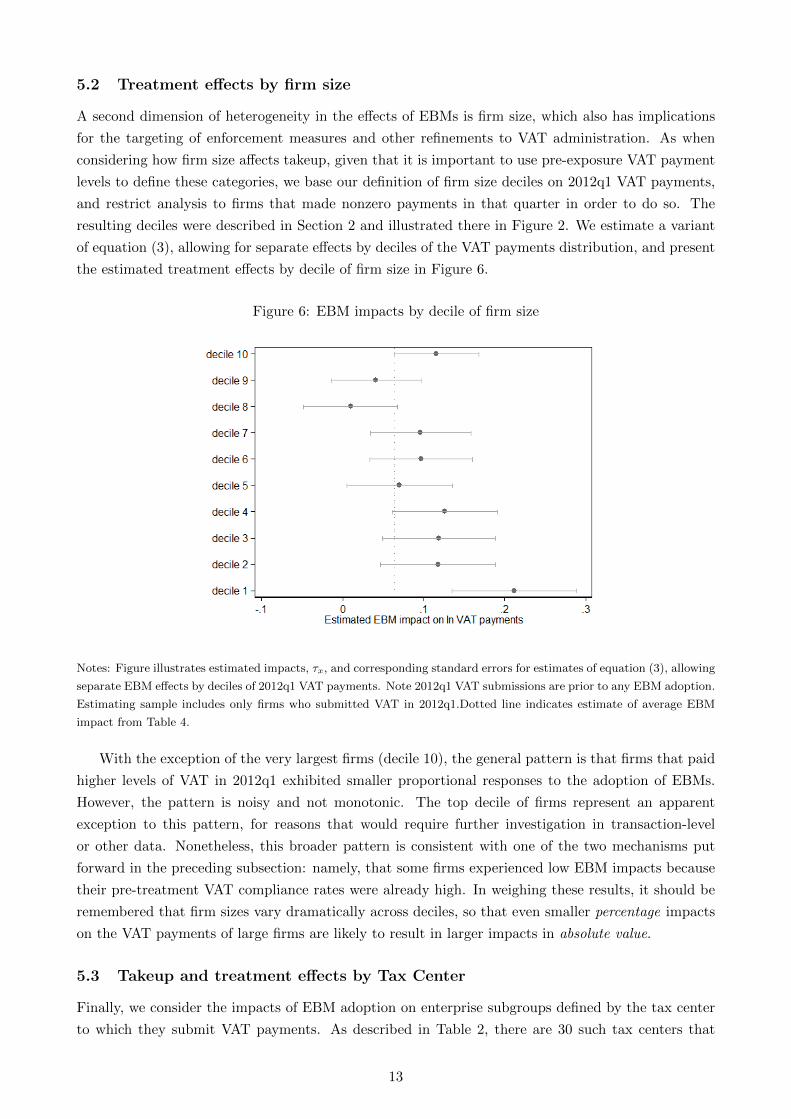
5.2 Treatment effects by firm size
A second dimension of heterogeneity in the effects of EBMs is firm size, which also has implications
for the targeting of enforcement measures and other refinements to VAT administration. As when
considering how firm size affects takeup, given that it is important to use pre-exposure VAT payment
levels to define these categories, we base our definition of firm size deciles on 2012q1 VAT payments,
and restrict analysis to firms that made nonzero payments in that quarter in order to do so. The
resulting deciles were described in Section 2 and illustrated there in Figure 2. We estimate a variant
of equation (3), allowing for separate effects by deciles of the VAT payments distribution, and present
the estimated treatment effects by decile of firm size in Figure 6.
Figure 6: EBM impacts by decile of firm size
Notes: Figure illustrates estimated impacts, τx, and corresponding standard errors for estimates of equation (3), allowing
separate EBM effects by deciles of 2012q1 VAT payments. Note 2012q1 VAT submissions are prior to any EBM adoption.
Estimating sample includes only firms who submitted VAT in 2012q1.Dotted line indicates estimate of average EBM
impact from Table 4.
With the exception of the very largest firms (decile 10), the general pattern is that firms that paid
higher levels of VAT in 2012q1 exhibited smaller proportional responses to the adoption of EBMs.
However, the pattern is noisy and not monotonic. The top decile of firms represent an apparent
exception to this pattern, for reasons that would require further investigation in transaction-level
or other data. Nonetheless, this broader pattern is consistent with one of the two mechanisms put
forward in the preceding subsection: namely, that some firms experienced low EBM impacts because
their pre-treatment VAT compliance rates were already high. In weighing these results, it should be
remembered that firm sizes vary dramatically across deciles, so that even smaller percentage impacts
on the VAT payments of large firms are likely to result in larger impacts in absolute value.
5.3 Takeup and treatment effects by Tax Center
Finally, we consider the impacts of EBM adoption on enterprise subgroups defined by the tax center
to which they submit VAT payments. As described in Table 2, there are 30 such tax centers that
13
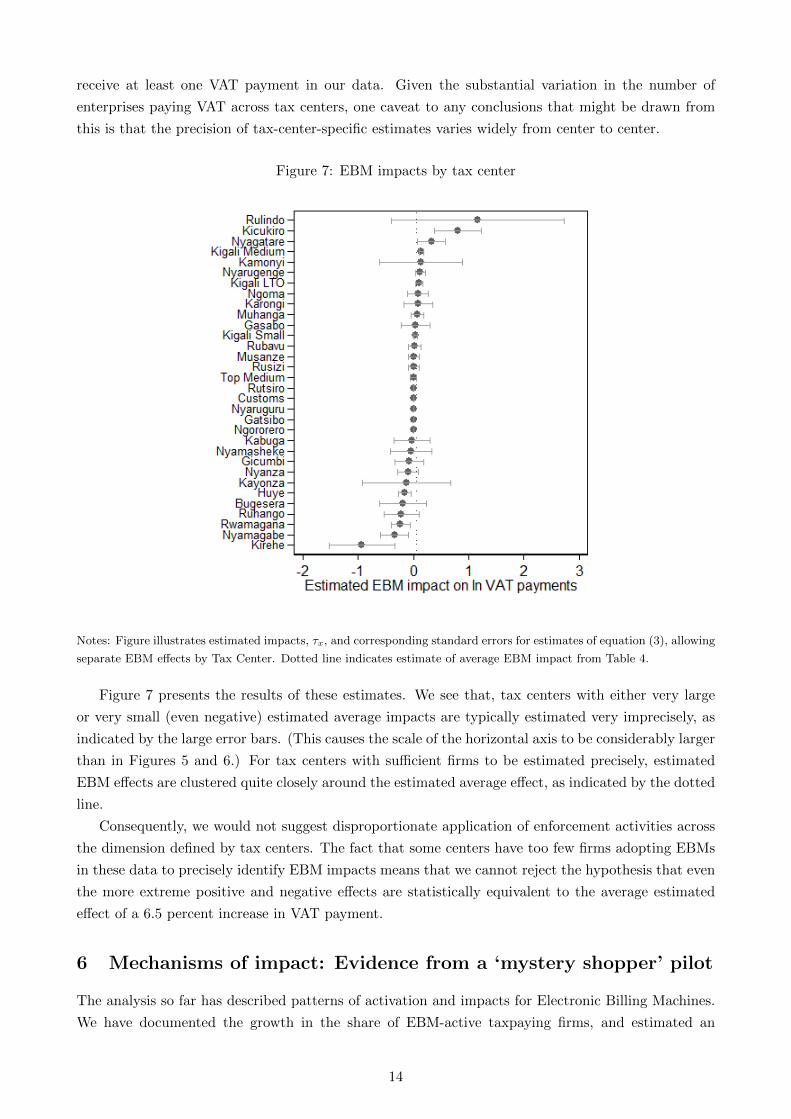
receive at least one VAT payment in our data. Given the substantial variation in the number of
enterprises paying VAT across tax centers, one caveat to any conclusions that might be drawn from
this is that the precision of tax-center-specific estimates varies widely from center to center.
Figure 7: EBM impacts by tax center
Notes: Figure illustrates estimated impacts, τx, and corresponding standard errors for estimates of equation (3), allowing
separate EBM effects by Tax Center. Dotted line indicates estimate of average EBM impact from Table 4.
Figure 7 presents the results of these estimates. We see that, tax centers with either very large
or very small (even negative) estimated average impacts are typically estimated very imprecisely, as
indicated by the large error bars. (This causes the scale of the horizontal axis to be considerably larger
than in Figures 5 and 6.) For tax centers with sufficient firms to be estimated precisely, estimated
EBM effects are clustered quite closely around the estimated average effect, as indicated by the dotted
line.
Consequently, we would not suggest disproportionate application of enforcement activities across
the dimension defined by tax centers. The fact that some centers have too few firms adopting EBMs
in these data to precisely identify EBM impacts means that we cannot reject the hypothesis that even
the more extreme positive and negative effects are statistically equivalent to the average estimated
effect of a 6.5 percent increase in VAT payment.
6 Mechanisms of impact: Evidence from a ‘mystery shopper’ pilot
The analysis so far has described patterns of activation and impacts for Electronic Billing Machines.
We have documented the growth in the share of EBM-active taxpaying firms, and estimated an
14
average impact of approximately 6 percent of this adoption on quarterly VAT declarations. But this
analysis leaves open questions of mechanisms that may be important for policy: Why do some sectors
and firms experience high (or low) impacts when they adopt EBMs? And—if this is driven at least
in part by incomplete utilization of active EBMs—what is the scope for administrative measures to
improve EBM utilization among those firms that already have this technology in place?
To address these issues, we conducted a small-scale ‘mystery shopper’ study, in conjunction with
Laterite. This pilot study conducted a total of 129 visits to EBM-active retail shops in Kigali, using a
sample that we should emphasize is not representative due to the challenge of physically locating firms
based on information in RRA administrative data. In each of these visits, enumerators—instructed
to conduct natural transactions—would purchase goods from a small set of options, including tea,
coffee, soap, and staples, each of which was valued between FRW 500–FRW 2,000.9 In addition,
we embedded a small experiment in this exercise: in (only) half of these visits, selected at random,
enumerators were specifically instructed to ask for a VAT receipt.
Three results of this exercise are striking. First, when unprompted, the fraction of purchases
receiving EBM receipts is very low, at approximately 21 percent. Second, merely asking for a receipt
changes this likelihood substantially: it increases the chances of receiving a receipt by 42 percentage
points. This suggests great potential for investments in consumer-side policies (such as RRA’s VAT
receipt lottery) to increase compliance. Third, results suggest that VAT is being only partially passed
through to consumers. Asking for a receipt raises the price by FRW 111 on average, as against a
mean price of FRW 1300 for goods without recipes. Firms that seek to charge consumers higher prices
in order to comply with VAT in response to EBMs may experience lower demand, if enforcement is
strong and competition with a ‘fringe’ of non-EBM firms is substantial; careful consideration of the
targeting of enforcement activities is therefore crucial to understanding implications for firm growth
and consumer welfare.
7 Conclusions and directions
This report has analyzed the adoption rate and VAT impacts of Electronic Billing Machines among
enterprises in Rwanda. Overall, we find adoption rates to have grown rapidly growing during the
period (through 2014q3) under study, with growth tapering off in the final quarter to an overall
adoption rate of 76 percent in 2014q3. We estimate the average impact of EBM adoption on VAT
payments is approximately 6.5 percent. To put this in perspective, back-of-the-envelope calculations
presented in Section 4.2 suggest that, for the median firm, the increase in revenues would equal the
cost outlay required for the EBM machine itself in just under four years, though the implied mean
payback period is shorter, given the skewed distribution of firm size.
These average results mask substantial heterogeneity in uptake and impacts by size and sector
(though to a much lesser extent by geography), which may form the basis of future targeted encour-
agement activities by RRA. Adoption rates are now roughly balanced across firms sizes (even though
early adopters were disproportionately large firms), so while impacts on VAT payments are slightly
higher for small firms in percentage terms, the relatively little absolute return to doing so, compared
with the regressive nature of the fixed costs of EBM machines, provides little rationale for targeting
smaller firms. Considering heterogeneity by type of economic activity may be more fruitful. While
9To control costs in the study, these goods were chosen both because their up-front costs were not too high, andbecause their prospects for resale were good.
15

EBM takeup is by far lowest among ‘business services’ enterprises, impacts on adopters of this type
are also small. Ideal sectors for efforts to expand EBM coverage are those with both low takeup and
high impacts, such as construction.
A ‘mystery shopper’ exercise suggests that the rate of EBM utilization by firms with active ma-
chines is an alternative, potentially more cost effective margin for administrative efforts. An impor-
tant caveat is that challenges in matching sampled firms from RRA administrative data to physical
premises means that this survey should make no claims to representativeness. Nonetheless, our ev-
idence suggests that, at least for small transactions, the fraction of transactions processed through
EBMs is low—while it is also highly responsive to consumer requests. This suggests a potentially
fruitful avenue for future interventions: EBMs, after all, are perhaps best thought of as a technol-
ogy for changing the cost of auditing. Administrative policies that strengthen either or both of (i)
purchasers’ incentives to request EBM receipts, and (ii) sellers’ perceived risk of audits may yield
comparatively large gains in VAT compliance relative to other types of enforcement activities. Po-
tential policies along these lines include a strengthening of the consumer VAT lottery and the use of
mystery-shopper style inspectors to examine EBM utilization, respectively. This is an area in which
the IGC would be pleased to continue its research partnership with RRA.
16


