
Master Thesis in the field of Quality Technology and Management
Written at Linköping University
Improve project management by using Six
Sigma tools
- An empirical study in Siemens Industrial Turbomachinary
Lin Yang & Guannan Feng
Supervisor: Peter Cronemyr, LiTH
Examiner:Bozena Poksinska, LiTH
Linköping, December 2011
LIU-IEI-TEK-A --11/01243 --SE

ii
Upphovsrätt
Detta dokument hålls tillgängligt på Internet – eller dess framtida ersättare – under 25 år från
publiceringsdatum under förutsättning att inga extraordinära omständigheter uppstår.
Tillgång till dokumentet innebär tillstånd för var och en att läsa, ladda ner, skriva ut enstaka
kopior för enskilt bruk och att använda det oförändrat för ickekommersiell forskning och för
undervisning. Överföring av upphovsrätten vid en senare tidpunkt kan inte upphäva detta
tillstånd. All annan användning av dokumentet kräver upphovsmannens medgivande. För att
garantera äktheten, säkerheten och tillgängligheten finns lösningar av teknisk och administrativ
art.
Upphovsmannens ideella rätt innefattar rätt att bli nämnd som upphovsman i den omfattning
som god sed kräver vid användning av dokumentet på ovan beskrivna sätt samt skydd mot att
dokumentet ändras eller presenteras i sådan form eller i sådant sammanhang som är kränkande
för upphovsmannens litterära eller konstnärliga anseende eller egenart.
För ytterligare information om Linköping University Electronic Press se förlagets hemsida
http://www.ep.liu.se/index.en.asp
Copyright
The publishers will keep this document online on the Internet – or its possible replacement –
for a period of 25 years starting from the date of publication barring exceptional circumstances.
The online availability of the document implies permanent permission for anyone to read, to
download, or to print out single copies for his/her own use and to use it unchanged for non-
commercial research and educational purposes. Subsequent transfers of copyright cannot
revoke this permission. All other uses of the document are conditional upon the consent of the
copyright owner. The publisher has taken technical and administrative measures to assure
authenticity, security and accessibility.
According to intellectual property law the author has the right to be mentioned when his/her
work is accessed as described above and to be protected against infringement.
For additional information about Linköping University Electronic Press and its procedures for
publication and for assurance of document integrity, please refer to its www home page:
http://www.ep.liu.se/index.en.asp
© Guannan Feng and Lin Yang

iii
Abstract
Traditional project management has been implemented by most of the companies in today‟s
business world in order to monitor and control the projects (Tonnquist, 2008). Project
management techniques have been proven for decades and its performance has been maximized
(Heldman, 2011). We think that the PM techniques have gradually reached its limits. For
today‟s companies, it is vital to find a more effective and innovative method which can be
integrated into the project management in order to maintain their competitive advantages
(Pyzdek, 2003).
As a relatively new business management approach and strategy, Six Sigma seeks to improve
the quality of the product and process by using some quantitative methods and tools
(Michalski, 2003). Actually, Six Sigma has been broadly implemented in many companies and
received a positive effect (Pande et al., 2000). However, most of the Six Sigma usage happens
just in the Six Sigma projects and these projects need the great support from the top-
management level and require plenty of resources for training and maintain (Pande et al.,
2002).
The purpose of this thesis is to suggest an approach/methodology for how simple Six Sigma
tools and methods can be combined with the traditional project management. In this case, those
non-Six Sigma projects can still use some easy Six Sigma techniques to maximize the benefits.
In order to achieve this purpose, the following methodologies are implemented: literature
review to identify relative factors including quality, time, cost, communication and customer
satisfaction, surveys and interviews to find out the current situations and problems in Siemens
Industrial Turbo machinery (SIT) project management, empirical studies to develop some
models and methods in which Six Sigma tools are integrated in the project management in SIT.
In this thesis, based on the empirical research of the case company of SIT, we are going to
suggest some Six Sigma tools to be integrated into project management. The research questions
include:
1. How can the selected Six Sigma tools improve the project management?
2. The Pros and Cons of implementing Six Sigma methods and tools in the project
management.

iv
3. What tools of Six Sigma are suitable to increase the performance of the project
management in SIT
As the result of this thesis work, once it is testified it is feasible and fit in the SIT project
management process, we think that there is a great chance it should be amplified and spread to
many more business areas.
Key words: Six Sigma, project management, QFD, FMEA, SIPOC

v
Acknowledgement
The authors would like to thank all the people who had helped and supported us during the
process of writing the master thesis.
During the summer of 2011, we had the chance to study the project management performance
at Siemens Industrial Turbomachinery AB in Finspang. We would like to thanks Ivona
Ljungdell, Saideh Novin Askloef and Maria Johansson, our supervisors at SIT, by providing us
the guidance, meetings and resources. Maria had done a lot of coordination to facilitate the
whole thesis writing process. Our interviewees -the nine project managers from Gas turbine,
Steam turbine and Solution departments and black-belt specialist Greg in SIT had helped us
tremendously with all the questions that we asked and information we need, we would like to
give our special thanks for their time and sincerity.
From the institute of technology at Linköping University, our supervisor Peter Cronemyr and
our examiner Bozena Poksinska had offered us attentive guidance, professional advices and
valuable suggestions during the whole process of the thesis. And the thoughts and arguments
let us to view our findings from a more practical perspective. We also would like to thank our
opponents Jianqi Fu and Bing Han for their useful feedback and improvement comments.
During the study of Six Sigma tools combined with project management, we had been inspired
to learn more about how to set up and implement the quantitative perspective into the project
management activities.
Linkoping, Sweden, Oct. 2011
Lin Yang and Guannan Feng
vi
Table of Content
ABSTRACT ......................................................................................................................... III
ACKNOWLEDGEMENT .................................................................................................... V
1 CHAPTER 1 INTRODUCTION ..................................................................................... 9
1.1 BACKGROUND OF SIX SIGMA AND PROJECT MANAGEMENT ............................................ 9
1.2 THE BACKGROUND OF THE COMPANY ........................................................................... 10
1.3 PURPOSE AND RESEARCH QUESTIONS ........................................................................... 11
1.4 LIMITATIONS ................................................................................................................ 13
1.5 DISPOSITIONS OF REPORT ............................................................................................. 13
1.6 GLOSSARY.................................................................................................................... 14
2 CHAPTER 2 METHODOLOGY .................................................................................. 15
2.1 INTRODUCTION ............................................................................................................. 15
2.2 RESEARCH DESIGN ....................................................................................................... 15
2.3 RESEARCH STRATEGY .................................................................................................. 16
2.3.1 Literature study ...................................................................................................... 16
2.3.2 Data collection and analysis .................................................................................. 16
2.3.3 Survey ..................................................................................................................... 17
2.3.4 Interview ................................................................................................................. 18
3 CHAPTER 3 THEORETICAL FRAMEWORK ........................................................ 20
3.1 SIX SIGMA .................................................................................................................... 20
3.1.1 The concept of Six Sigma ........................................................................................ 20
3.1.2 The history of Six Sigma development .................................................................... 21
3.1.3 The DMAIC process improvement methodology .................................................... 22
3.1.4 Success factors for implementing six sigma programs........................................... 27
3.2 PROJECT MANAGEMENT ............................................................................................... 29
3.2.1 The concept of project and project management ................................................... 29
3.2.2 Triple constraint for project management .............................................................. 30
3.2.3 Quality (Process and Product) ............................................................................... 31
3.2.4 Cost (both expenditure and resources)................................................................... 32
3.2.5 Time/Schedule......................................................................................................... 33
3.2.6 Risk management in project management .............................................................. 33
3.2.7 Communication in project management ................................................................. 36

vii
4 CHAPTER 4 INTRODUCTION OF SIX SIGMA TOOLS ....................................... 40
4.1 QFD ............................................................................................................................ 40
4.1.1 Approach of implementing QFD: .......................................................................... 41
4.2 CTQ ............................................................................................................................ 43
4.3 SIPOC ......................................................................................................................... 44
4.4 FMEA ......................................................................................................................... 47
4.4.1 Traditional FMEA ................................................................................................. 47
4.4.2 Expected cost FMEA .............................................................................................. 51
5 CHAPTER 5 EMPIRICAL FINDINGS ...................................................................... 52
5.1 CURRENT SITUATION OF PROJECT MANAGEMENT IN SIT ............................................. 52
5.1.1 General process map of SIT project management ................................................. 52
5.1.2 Current situation and difficulties of SIT project management .............................. 53
5.2 A MODEL FOR IMPROVING THE UNCLEAR SCOPING AND MISUNDERSTANDING CUSTOMER
NEEDS ................................................................................................................................ 56
5.2.1 The model introduction .......................................................................................... 56
5.2.2 The phase of integrating the model ....................................................................... 57
5.2.3 Example of implementing the model ...................................................................... 59
5.2.4 CTQ Driver Tree Model for Option 2.................................................................... 68
5.2.5 SIPOC model ......................................................................................................... 69
5.3 FMEA MODEL ............................................................................................................. 74
5.3.1 FMEA model in SIT ............................................................................................... 74
5.3.2 Implementing FMEA model ................................................................................... 76
5.4 MODEL OF DEALING WITH THE TIME AND COST PROBLEMS ......................................... 82
6 CHAPTER 6 DISCUSSION .......................................................................................... 86
6.1 PROS AND CONS OF SIX SIGMA TOOLS SUGGESTED ..................................................... 87
6.2 REMARKS OF SIX SIGMA TOOLS USAGE ....................................................................... 89
7 CHAPTER 7: CONCLUSION ...................................................................................... 91
REFERENCE LIST ............................................................................................................. 93
APPENDIX 1: DEMONSTRATION OF THE SURVEY ................................................ 97
APPENDIX 2: EXAMPLE OF THE QUESTIONS AND ANSWERS OF INTERVIEWS
.............................................................................................................................................. 103

viii

9
1 Chapter 1 Introduction
1.1 Background of Six Sigma and project management
In today‟s business world, with the rapid development of the economic globalization, the
international business competition has become increasingly severe (Porter, 2000). In order to
seize more market share, companies set their focus of competition not only on developing the
innovative technologies, but also on the quality of their products. Strengthening the quality
management has been considered by most of the companies as a critical way of enhancing their
competitiveness (Madu and Kuei, 1993).
Thus more and more business corporations are now implementing quality improvement
methodologies such as Lean Production, total quality control and Six Sigma (Dahlgaard and
Dahlgaard-Park, 2006). Among these methodologies, Six Sigma attracts more and more
attention because it has evolved from a focus on achieving the quality level and process
improvement using statistical tool to a comprehensive management framework for managing a
business (Snee and Hoerl, 2002). Six Sigma has become the synonym for improving quality,
reducing cost and increasing customer loyalty (Bertels and Strong, 2003).
The concept of Six Sigma has been introduced by Motorola in 1987 (Henderson and Evans,
2000). Six Sigma has been launched in the very first place as a pure quality management
method and it was designed only for manufacturing and production processes (Brue and
Howes, 2005). However, with decades of development, more and more companies discovered
the advantages of Six Sigma. In 1996, GE set Six Sigma as a kind of management strategy and
implemented this strategy throughout the whole company (Henderson and Evans, 2000). Three
years later, with the help of Six Sigma, GE made the profit of 20 billion USD (Klefsjö and
Bergquist, 2003). Since then, Six Sigma was no longer a simple management method. Many
non-manufacturing companies, such as service enterprises, started to use Six Sigma to improve
quality of service and increase the customer loyalty (El-Haik and Roy, 2005). It has evolved
into an efficient business process optimization. It has become one of the most important
strategies for those companies who are pursuing the excellence of management. Thus, more
and more projects have become pure Six Sigma projects since they were integrated with the
methods, techniques, and personnel of Six Sigma management (Bertels and Strong, 2003).

10
On the other hand, the traditional and classic project management is still playing an important
role in the project-oriented organization, and a small oversight can easily affect the success of
the project (Heldman, 2011). However, many project management methods have failed because
business couldn't measure the effectiveness of the methodology or quantify the value added by
process changes (Harrington, 1991). Six Sigma uses the data with tools and techniques which
companies can use to measure their performance both before and after Six Sigma projects
(Bertels and Strong, 2003). Business can integrate Six Sigma into project management. The
standard DMAIC process which stands for Define, Measure, Analyze, Improve and Control can
be followed to reduce probability of failures, human errors and oversights (Shankar, 2009). The
errors can be reduced in DMAIC by using the statistical tools and techniques such as fishbone
diagram, Ishikawa diagram, Design of experiments, process flow diagram and others (Pyzdek,
2003).
There is considerable literature on both of Six Sigma (Bertels and Strong, 2003; Brue and
Howes, 2005; Michalski, 2003) and project management (Heldman, 2011; Schwalbe, 2008;
Tonnquist, 2008), while the research on the relationship between them or how to combine them
is limited and doesn‟t provide enough details. Six Sigma is based on the strategic goals of
continuous improvement as a tool to bring significant and lasting change in the targeted and
important projects(Sandholm and Sörqvist, 2002). As the competition increasing by the minute,
the need for project management by integrating Six Sigma will be more in the days to come.
Based on the characteristics of the project management and methodologies of Six Sigma, it is
vital to discuss how the Six Sigma can be used to improve the project management, such as
optimizing the project processes, minimizing the defects and costs, and improving the customer
satisfaction (Tonnquist, 2008).
1.2 The background of the company
Siemens Industrial Turbomachinery AB (SIT AB) located in Finspong Sweden belongs to the
oil and gas division within energy sector of Siemens AG, and it is a leading supplier for a wide
range of products, solutions and services for the power generation, transmission and
distribution (SIT, 2010). Before they were called Siemens in 2003, they had several names
which were STAL, STAL Laval, ASEA STAL, ABB STAL and Alstom Power. The main
products they deliver are steam and gas turbines, turn-key power plants and service and

11
components for heat and power generation. The turbines are the power sources not only for
producing electricity, steam and heat, but also for the compressors and pumps, mainly in the oil
and gas industry. This facility in Finspong employs around 2700 employees and the annual
turnover is 10 billion Euros (Siemens, 2009; SIT, 2010).
The quality system of the SIT AB was certificated according to ISO 9001:2000, and their
guiding principles are high efficiency, low service costs and low environments impact. They
regard quality as the products and services delivered in a timely manner by full filled the agreed
commercial terms.
SIT is divided into 2 business units, the service unit and the unit of Industrial Power Turbines.
In this paper we just focus on the unit of Industrial Power Turbines. Under this unit there are
three department which are Gas turbine (GT), Steam Turbine (ST), and Solution (SOL).
The project is the main way to perform the turbine production and the project managers are
responsible for the delivery of the project. Usually each project manager is responsible for 3 or
4 project at the same time. For both of the units, business excellence division is in charge of the
quality management such as Six Sigma, and total quality management. As so for, Six Sigma
method has gain remarkable success in the service unit; however, SIT didn't use the Six Sigma
tools into the production unit project management so much. Here comes the exploration of this
topic.
1.3 Purpose and research questions
We have seen that Six Sigma may have the great potential of bringing significant benefits to
improve the project management and various companies all over the world are interested in
applying Six Sigma tools in their project management. However, using Six Sigma tools is
based on the analysis and research of the data that the company has performed. In the
manufacturing process, applying Six Sigma is not hard in manufacturing environment since the
process of manufacturing is fixed and the customer‟s demands on the quality are clarified and
easy to be measured. In the project management, project managers face many contingency
problems whose resolutions are not always there. Often, project managers cannot find a

12
successful case to follow. The working progress is hard to be measured by accurate data. Thus
the Six Sigma tools are rarely used in the field of project management.
Moreover, the projects are either pure Six Sigma projects which follow the methods, techniques
of Six Sigma management and contain Six Sigma expertise, or pure traditional and classic
project management which has nothing to do with Six Sigma. These two extreme managements
both have some disadvantages. For Six Sigma projects, they require plenty of resources of the
organizations and for traditional projects, the outcome and performance are sometimes not
guaranteed. Based on this fact, we are trying to figure out a way of integrating some of the Six
Sigma ideas and methods into project management in order to improve the performance of
project management to some extent, and in the meanwhile, the cost and resources would not be
too high as the pure Six Sigma projects require.
In this thesis, based on the empirical research of the case company of SIT, we are going to
suggest some tools in Six Sigma field to be integrated into the project management. This thesis
will help us to improve the awareness and understanding of implementing Six Sigma in project
management.
Our research questions are as following:
- What tools of Six Sigma can be suggested to increase the performance of the project
management in SIT?
We conduct some surveys and interviews to create a picture of the main problems in SIT. Then
we develop some selection criteria for choosing the appropriate Six Sigma tools for the
improvement of project management.
- How can the selected Six Sigma tools improve the project management?
Most importantly, once we have the right and suitable Six Sigma tools for the projects, we dig
deeper to gain a clear view of how the Six Sigma tools can improve the project management
performance in detail.
- The Pros and Cons of implement Six Sigma methods and tools in the project management.

13
We assume that the outcome of implementing Six Sigma methods in the project management is
not only positive. There are some negative effects too. We find out what the Pros and Cons are
so that we can gain a deeper understanding.
1.4 Limitations
The first limitation comes from the generalizability of the result. Since the research was
conducted in one company, this implies the limitation of the generalizability from this case to
other companies. The research questionnaire was developed by the authors and supervisors,
thus the subjective bias could exist. The further study can be carried out more completely in a
long term study.
The second limitation could be the methodology. Due to the time duration limitation, it was
hard to avoid all the deficiencies in conducting the research. According to Marc and Miller
(2008), the credibility of the research can rely on the reliability, validity and objectivity. During
the interviews we have conducted with the project managers, the notes were made instead of
the voice recorder due to confidentiality problems. And taking notes by hand may influence the
objectivity. To minimize the bias and the impact of personal interpretations and perceptions, a
supervisor from SIT and a facilitator from university were located in the interviews also. The
final empirical data was integrated from notes of four persons. For ensuring the validity and
reliability, the questions in the interviews were checked by the supervisor in SIT to ensure they
are aligned with the purpose of the study.
1.5 Dispositions of report
The disposition of the report is as following: Chapter 1 describes the background of the topic,
the purpose, research questions and limitations.
In Chapter 2, the methodology that was used to conduct the research is presented, and the
methodology includes literature review, survey and interview. These approaches direct the way
to solve the research questions that we propose in the last chapter.
Chapter 3 is the theoretical framework derived from the literature review. In this chapter, the
academic research about the project management and Six Sigma is presented. Based the

14
literature review, we create a general understanding of project management and Six Sigma, and
based on this understanding we suggest the solution for the proposition questions.
In Chapter 4, we introduce several Six Sigma tools which we consider can be used in the
project management to improve the performance of PM. Chapter 5 presents the empirical
findings we have gathered in SIT. We describe several current project management situations
and problems which we have found during our thesis work in SIT. Then we make our
suggestions and recommendations of implementing specific Six Sigma tools to improve the
current performance of PM. We also provide some simple example for explaining how these
tools can be implemented.
1.6 Glossary
SIT: Siemens Industrial Turbomachinery AB
SS: Six Sigma
GT: Gas Turbine department in SIT
SU: Steam Unit department in SIT
SOL: Solution department in SIT
VOC: Voice of Customer
QFD: Quality Function Deployment
CTQ: Critical To Quality
SIPOC: Suppliers, Inputs, Process, Outputs and Customers
FMEA: Failure Model Effect Analysis
RPN: Risk Priority Number

15
2 Chapter 2 Methodology
2.1 Introduction
This chapter presents the research methodology of the master thesis. We describe research
approach that we have chosen and the procedure that we collected data. The limitation with the
possible source of divaricators to ensure the study‟s reliability and validity are also explained in
this chapter.
2.2 Research design
The first step was to identify and understand the research background and the initial proposal of
the possible tools of Six Sigma to improve the project performance. The problems were
described and identified through the discussion with the supervisors at the university and the
case company. Based on the problem description and corrected proposal of the research
questions, an extensive literature was selected and discussed in the analysis process.
The empirical data was then collected through the surveys and interviews with 9 project
managers (3 from Steam turbine, 3 from Gas Turbine, and 3 from Solution). Besides the 9
managers, we had a two-hour meeting with the Master Black Belt from SIT to gain deeper
understanding of six sigma implementation in SIT. After the data collection, the analysis was
conducted within the context of the theoretical background and aimed at answering the research
questions. Then the conclusions were developed as the final part of the thesis after the
suggestions and recommendations of improvement about SS tools. The outline of the reports
followed the procedure of the research in subsequence. The Figure 1 reveals the structure of the
thesis.

16
Figure 1: the process of the research
2.3 Research strategy
2.3.1 Literature study
In order to have a fully understanding of the previous work which has been done by other
researchers, a literature review has been conducted. Generally, two main fields have been
studied, which are Six Sigma and Project Management. In the Six Sigma field, we mainly
reviewed the concept and development history of Six Sigma, the classic model of Six Sigma,
and the success factors for implementing Six Sigma programs. In the project management field,
we focused on the main elements which PM contains, such as: quality control, cost control,
time control, risk management, and communications in PM. The search of some research
papers has been conducted in different databases, such as Academic Search Premier and
Google scholar. We also referred to some books and journals which were provided by the
library of Linköping University and by our supervisor Peter Cronemyr.
2.3.2 Data collection and analysis
The selection of an appropriate approach to collect data ensures the quality of data. For data
collection, the study intends to analyze and compare multiple projects in similar manner to find
out the general and urgent problems within the project management in SIT. There were nine
interviews in total. These nine interviewees were performed with project managers of Gas
Turbine department, Steam Turbine department, and Solution department. They were selected
with the help of the project director in SIT. Nine project managers filled out a survey
Conclusion
Suggestions and recomendations
Analysis
Data collection (Survey and Interview)
Literature review
Reaserch purpose
Background/problems

17
questionnaire with six aspects of project implementation, and then the results were analyzed.
Based on the analysis, an interview based on each result from survey was performed with each
project manager to achieve deeper understanding of the problems within the projects. The
analysis strategy was primarily based on the qualitative data (Lekvall and Wahlbin, 2008) that
was collected through surveys and interviews.
The data collection includes two parts, the primary and secondary data. The primary data was
collected through the direct contacts with the project managers using survey and interviews.
The secondary data was collected through the other data sources such as website,
documentation from SIT. The detailed data collection is presented as bellow.
2.3.3 Survey
The survey questionnaire was developed based on the understanding of the relevant theory
derived from the literature (Groves et al., 2009). During the process of designing the survey,
the following five principles were always kept in mind to ensure the quality of the questions.
- What is the aim of the question?
- Is the scope of the question proper?
- Are there unstated or misleading assumptions?
- Can the respondents answer this question in an adequate manner or to an adequate degree?
- Are the scales clear?
The first version of the questionnaire was developed in the Six Sigma language including the
key factors of successful implementation of SS, the usage of tools in SS and the result of
implementing SS in project management. After the first meeting in SIT, the questionnaire was
modified to the language of project management. It should be noted that the aim of the
questionnaire was to study the current problems in project management and the potential tools
of SS to solve these problems, thus the survey questions should cover both of the topics. The
second version of the questionnaire was consistent of the background information of the
respondents and six important aspects of the project implementation, which were cost, time,
quality, customer satisfaction, risk and opportunity and communication. The questions for the
six aspects were passed several rounds of the revision and refinements before the questionnaire
was distributed. The survey questionnaire was enclosed in Appendix 1.
18
The samples of the respondents were determined on the basis of filling the information
requirements for the research, thus nine managers (3 from GT, 3 from SU and 3 from SOL)
were chosen as the samples in this survey. The questionnaire was delivered by e-mail. In order
to increase the response rate, the authors‟ supervisor Saideh Novin Askloef in SIT distributed
the questionnaires. All the respondents replied and the response rate was 100%.
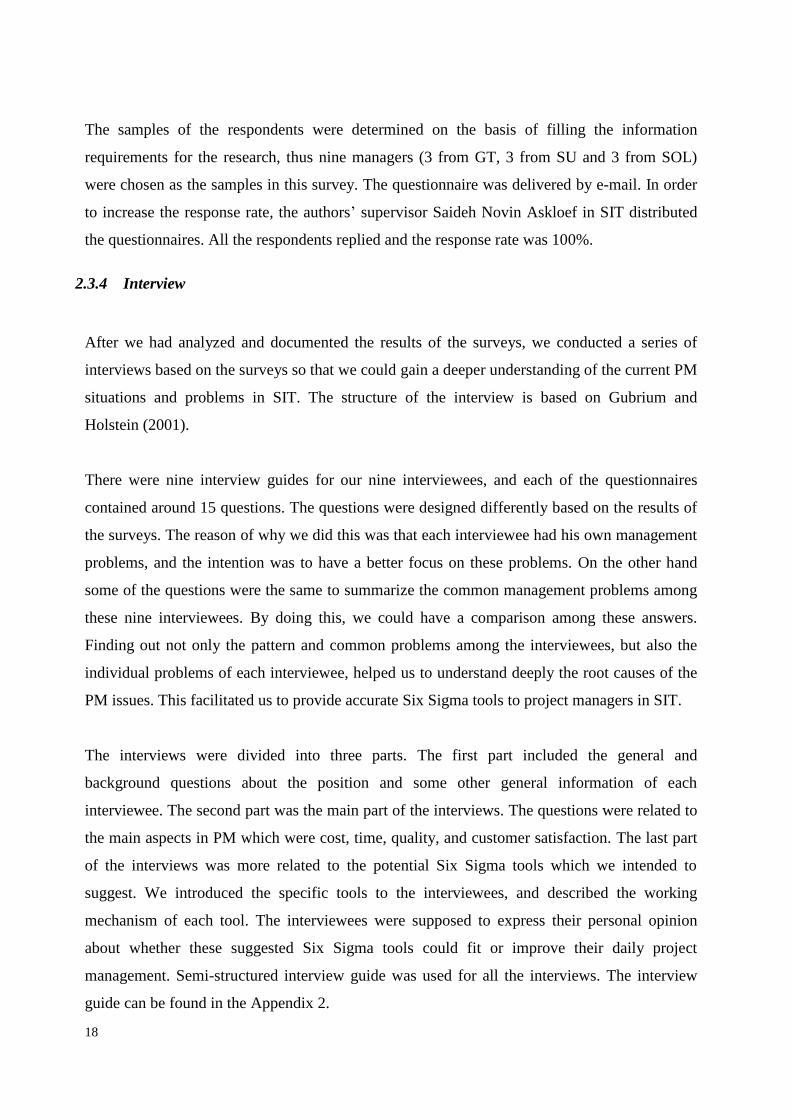
2.3.4 Interview
After we had analyzed and documented the results of the surveys, we conducted a series of
interviews based on the surveys so that we could gain a deeper understanding of the current PM
situations and problems in SIT. The structure of the interview is based on Gubrium and
Holstein (2001).
There were nine interview guides for our nine interviewees, and each of the questionnaires
contained around 15 questions. The questions were designed differently based on the results of
the surveys. The reason of why we did this was that each interviewee had his own management
problems, and the intention was to have a better focus on these problems. On the other hand
some of the questions were the same to summarize the common management problems among
these nine interviewees. By doing this, we could have a comparison among these answers.
Finding out not only the pattern and common problems among the interviewees, but also the
individual problems of each interviewee, helped us to understand deeply the root causes of the
PM issues. This facilitated us to provide accurate Six Sigma tools to project managers in SIT.
The interviews were divided into three parts. The first part included the general and
background questions about the position and some other general information of each
interviewee. The second part was the main part of the interviews. The questions were related to
the main aspects in PM which were cost, time, quality, and customer satisfaction. The last part
of the interviews was more related to the potential Six Sigma tools which we intended to
suggest. We introduced the specific tools to the interviewees, and described the working
mechanism of each tool. The interviewees were supposed to express their personal opinion
about whether these suggested Six Sigma tools could fit or improve their daily project
management. Semi-structured interview guide was used for all the interviews. The interview
guide can be found in the Appendix 2.

19
All nine interviews were conducted in SIT with the supervision by Maria Johansson and Ivona
Ljungdell. Each interview lasted about one hour. Since we had signed the confidentiality
agreements with Siemens, the whole process of the interviews was not tape-recorded; instead,
we took notes of each answer. In order to prevent the misunderstanding and faulty data during
the interviews, our supervisor Maria Johansson and the interviewer Ksenia also took notes of
each answer. In the analysis phase, we have combined all the notes together, so that we could
have the information from the interviews as accurate as possible.

20
3 Chapter 3 Theoretical Framework
3.1 Six Sigma
3.1.1 The concept of Six Sigma
Technically, sigma is a Greek letter which is written as σ. It is a statistical unit and used both as
a symbol and a metric of process variation. Process performance equals Six Sigma when the
variation in the individual process or product characteristic gives no more than 3.4 defects per
million opportunities (Yang, 2003). Compared to the 3σ which has 66,807 defects per million
opportunities, 6σ is a considerably high standard and goal; however, this ultimate goal is
unattainable for most industries and companies. The different yield under different level of
sigma is shown as below (Table 1):
Sigma (σ) DPMO Yield (%)
1 691,500 30.85
2 305,837 69.15
3 66,807 93.32
4 6,210 99.38
5 233 99.977
6 3.4 99.99967
Table 1: Different yield under level of sigma
Six Sigma is also considered as quality management methodology. If a manufacturing or
service process is strictly controlled by Six Sigma, then this process hardly has many defects.
Coming to a higher level, Six Sigma is not only a simple quality management methodology, but
it also contains many concepts, thoughts, methods, and tools which are combined together to
help us achieving the target of business excellence (Yang, 2003).
There is considerable literature which defines Six Sigma in many different ways. Tomkins
(1997) defines Six Sigma as “a program aimed at the near-elimination of defects from every
product, process and transaction.” Lowenthal (2002) considers that Six Sigma focuses on two
things: the customer‟s requirements and the processes meant to fulfil those requirements. Park
21
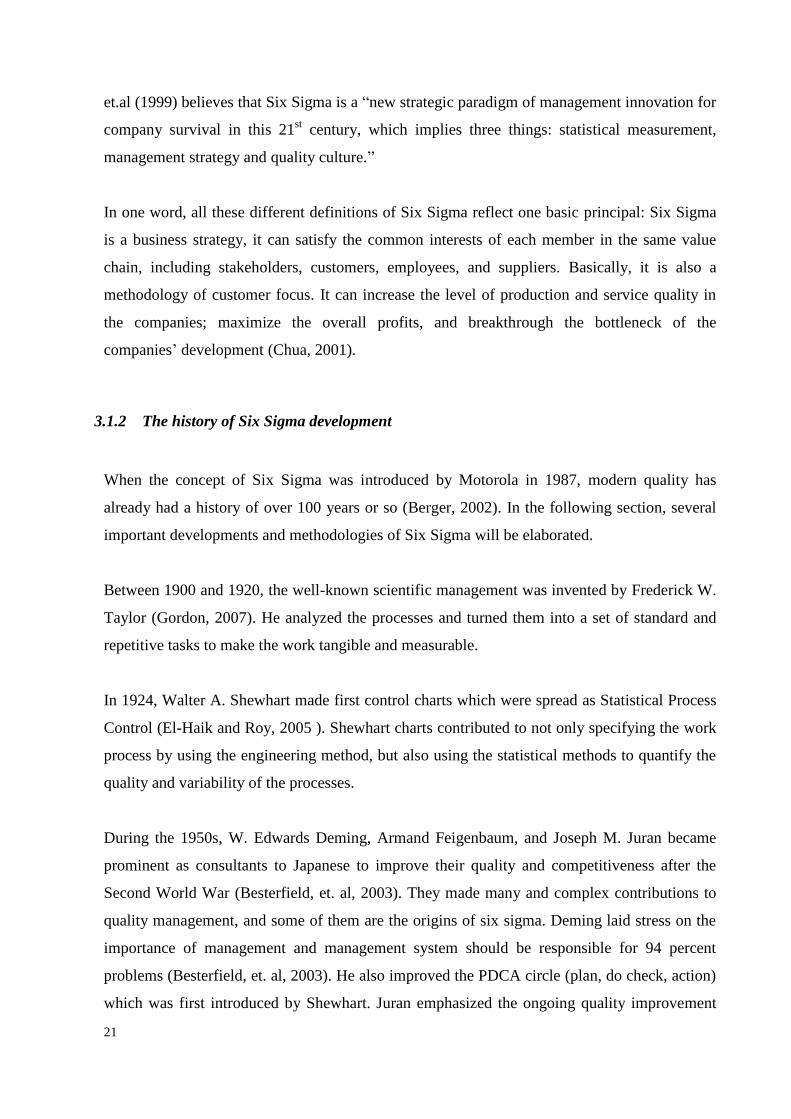
et.al (1999) believes that Six Sigma is a “new strategic paradigm of management innovation for
company survival in this 21st century, which implies three things: statistical measurement,
management strategy and quality culture.”
In one word, all these different definitions of Six Sigma reflect one basic principal: Six Sigma
is a business strategy, it can satisfy the common interests of each member in the same value
chain, including stakeholders, customers, employees, and suppliers. Basically, it is also a
methodology of customer focus. It can increase the level of production and service quality in
the companies; maximize the overall profits, and breakthrough the bottleneck of the
companies‟ development (Chua, 2001).
3.1.2 The history of Six Sigma development
When the concept of Six Sigma was introduced by Motorola in 1987, modern quality has
already had a history of over 100 years or so (Berger, 2002). In the following section, several
important developments and methodologies of Six Sigma will be elaborated.
Between 1900 and 1920, the well-known scientific management was invented by Frederick W.
Taylor (Gordon, 2007). He analyzed the processes and turned them into a set of standard and
repetitive tasks to make the work tangible and measurable.
In 1924, Walter A. Shewhart made first control charts which were spread as Statistical Process
Control (El-Haik and Roy, 2005 ). Shewhart charts contributed to not only specifying the work
process by using the engineering method, but also using the statistical methods to quantify the
quality and variability of the processes.
During the 1950s, W. Edwards Deming, Armand Feigenbaum, and Joseph M. Juran became
prominent as consultants to Japanese to improve their quality and competitiveness after the
Second World War (Besterfield, et. al, 2003). They made many and complex contributions to
quality management, and some of them are the origins of six sigma. Deming laid stress on the
importance of management and management system should be responsible for 94 percent
problems (Besterfield, et. al, 2003). He also improved the PDCA circle (plan, do check, action)
which was first introduced by Shewhart. Juran emphasized the ongoing quality improvement

22
for a succession of projects based on the customer satisfaction and dissatisfaction, and believed
the top management involvement was critical. Feigenbaum defined TQM (total quality
management) as a system to ensure production and service at the most economical levels while
meeting customer satisfaction (Besterfield, et. al, 2003).
The first generation of six sigma appeared during late 1980s and early 1990s and it was part of
continuous improvement and total quality management (Bertels & Strong, 2003). This Six
Sigma process improvement included mainly four steps: measure-analyze-improve-control. But
this approach didn‟t succeed because of the lack of leadership support. The second generation
emerged at Alliedsignal in 1994 (Bertels & Strong, 2003). The mainly difference between the
first and second generation is the integration of voice of customer. In the second generation, a
new step called “define” was added by GE in 1995 (Bertels & Strong, 2003). In this step, the
data for customer needs and requirements is collected to identify the critical quality attributes to
improve customer satisfaction. Thus the DMAIC methodology now widely used in six sigma
implementations was shaped. Finally, the combination of DMAIC, process management and
service design (Design for Six Sigma, DFSS) was implemented in the company not only in
quality management but as a business strategy (Bertels & Strong, 2003).
3.1.3 The DMAIC process improvement methodology
The DMAIC methodology is one of the most recognized features of Six Sigma, and is one of
the most widely tested and merited approaches to bottom-line focused process improvement
available today (Pyzdek, 2003). Many companies all over the world apply this methodology in
their manufacturing or service processes in order to minimize the defects. This methodology is
consisting of five phases: Define, Measure, Analyze, Improve, and Control.
Phase 1 (Define): this phase is the starting point of the whole process. The main target of this
phase which we have summarized based on the information Pyzdek (2003) provided is to figure
out the issues as following:
- Select the right project.
- Who are the customers?
- What are the customer‟s demands or requirements?

23
- Identify the customer‟s Critical-To-Quality.
- Develop the project and team charter
The common tool used in this phase is called the fishbone diagram (Speegle, 2009). It is a
simple x-y cause and effect model where x stands for the input factors and y stands for output
variable. We need to designate at least one characteristic which we would like to improve
through this process. They are marked as y in the fishbone diagram. For each y that has been
identified, it is extremely important that the project group acquire a thorough understanding of
the customer requirements for this characteristic (Magnusson et al, 2003). The fishbone
diagram is shown as Figure 2 (Magnusson et al, 2003):
Figure 2: The fishbone diagram
Phase 2 (Measure): The first activity of the measure phase is concerned with identifying for
each y a number of input factors, xs which might influence y. In reality there are two types of xs,
which are control factors and noise factors. Control factors can be controlled physically, as
opposed to noise factors that are considered to be uncontrollable, too costly to control, or not
desirable to control (Magnusson et. al, 2003). The goal of this phase is to describe the
opportunity for improvement and quantify the baseline performance, is to identify the
deficiencies and defects in the whole process through the measurement (Gupta, 2004). The
managers need to decide what kind of measurement they intend to use to get the actual data,
such as sample size, the duration of the measurement. With these actual data, managers can
discover those processes which have significant deviation compared to the standards, and those
Process
X1 X2 X3
INPUT
FACTORS
Control
Factors
INPUT
FACTORS
Noice
Factors
OUTPUT

24
which have a large space to be improved. The common tool here is also the fishbone diagram in
which we can get a clear picture of causes and effects.
Phase 3 (Analyze): In this phase, managers use various tools and statistical methods to analyze
the actual data which they have collected. After the analysis, they will find out all causes which
affect the outputs and identify those root causes which affect the outputs significantly.
According to Gupta (2004), the common tools used in this phase are Pareto Analysis, Cause-
and-Effect Analysis, Multi-vary Analysis, and FMEA. Analyse phase makes the preparation
and sets up the target for the next phase: Improve.
Phase 4 (Improve): This phase is related to selecting those product performance characteristics
which must be improved to achieve the goals (Park, 2003). These goals could be minimize or
eliminate the defects and waste during whole production process. All of these goals are
identified in the “Define” phase according to the customers‟ requirements and demands. The
previous phases: Define; Measure, and Analyze, is the preparation for the “Improve” phase in
order to find a way to maximize the profits of the enterprise. It requires the Six Sigma project
teams to come up with as many feasible solutions as possible. Team members can gather
around, discuss and evaluate all those solutions through the mind storm. Finally, they select one
or some the most suitable solutions and set up the implement plan.
Phase 5 (Control): Once the solution has been implemented the y should be monitored to make
sure that the improvement targets for y have been achieved (Magnusson et. al, 2003). In this
last phase of the DMAIC methodology, keeping monitoring the performance of the new
improved process is vital. The goal of this phase is to promote and keep the continuous
improvement meanwhile to prevent the backwards. Team members usually achieve this goal by
using Statistical Process Control (SPC) methods (Park, 2003).
The most advantages of DMAIC methodology are summed up as follows:
- Expose the real problems. DMAIC is a systematic quality management approach of
removing the appearance and examining the inner characteristics of the process (Pande
et.al, 2002).

25
- Concentrate on the customers. From the beginning to the end of DMAIC, customer
focus is one of the most important aspects. In this way, it is easier to reach the
customers‟ requirements and improve the customers‟ satisfaction(George, 2003).
- Based on the facts. All the phases are implemented base on the facts and actual data.
This is very important especially when it comes to the quality improvement and control
of the products and services (Pande et.al, 2002).
- Continuous and sustainable improvement process. What DMAIC provides us is not a
one-way process; it is more like a round improving process in which the previous
knowledge and experiences are valuable for the optimizing the process continuously, in
order to achieve the business excellence (Pande et.al, 2002).

26
The flowchart for DMAIC methodology is shown as below in Figure 3.
Figure 3: The DMAIC flowchart (Park, 2003)
YES
Modify Design?
Improve
Process
Capability OK?
OK?
Control
Define
Measure
Process
Capability OK?
NO
Analyze
YES
Redesign
YES
NO
NO

27
3.1.4 Success factors for implementing six sigma programs
The success factors of Six Sigma project implementation have been identified by several authors.
Schön (2006) suggested six most important factors of Six Sigma implementation based on the
literature review of Henderson and Evans (2000), Goldstein (2001), Antony and Banuelas
(2002), Sandholm and Sörqvist (2002) and Pande et. al. (2000). The six factors suggested by
Schön include management commitment; focus on training; project selection; strategy for
implementation; linking Six Sigma to business strategy and focus on results. Snee and Hoerl
(2002) also identified three successful attributes of the Six Sigma implementation by comparing
the very successful and less successful projects. These three successful factors are committed
leadership, use of top talent, and support infrastructure. The less successful projects didn‟t have
management commitment, but only the supportive leadership; they didn‟t have the formal
appointment of the Black Belt; and there was no formal supportive infrastructure such as “no
formal project selection and process, only part time resource available and not involved in the
financial system (Snee and Hoerl, 2002).”
Jones et al. (2010) stated the role of Black Belt as a success factor. He argued that the roles of
Black Belt are used differently in different organizations, and it would be helpful to measure the
degree of Black Belt dedicated to Six Sigma or the degree that they split their time in Six Sigma
and management activities. Schroeder et al. (2008) mentioned Black Belt can help to fill the gap
between the top management and Six Sigma project team.
From the literature above, the top management and the supportive system are important to
implement Six Sigma successfully. Choo et al. (2007a&b) argued that the improvement of
quality is affected by both the quality methods and psychology variables and they also tested
these variables on the six sigma implementation. Thus the implementation from an
organisational learning perspective (Wiklun et.al, 2002) is necessary to be taken into
consideration. They stated that all the aspects of implementing Six Sigma such as the knowledge
in behavioural science should be implemented rather than implementing DMAIC merely. The
Black Belts and Master Black Belts should have the training on change management besides the
usual training on statistical methods. When Black Belt and Master Black Belt master the
knowledge of quality and management, this organization could reach the goal of facilitating the
organizational learning.

28
Figure 4: Conceptual framework for Six Sigma implementation (Jones et al., 2010)
Jones et al. (2010) proposed a conceptual framework for Six Sigma implementing with
reference to both contextual elements (e.g. leadership) and methodological techniques (e.g.
DMAIC). The role of executive support is facilitated by Black Belt (Jones et al., 2010), and
Black Belt are champions that direct and manage Six Sigma initiatives (Schroeder et al., 2008).
“ While top management is not directly involved in Six Sigma implementation, it is believed
that through supporting and empowering Black Belts top management can accelerate the
progress of Six Sigma implementation” (Jones, et al., 2010) The model is shown in Figure 4.
Executive
commitment
Financial
responsibility
Black Belts
roles
DMAIC
Plan
Do
Act
Check
Performance

29
3.2 Project management
3.2.1 The concept of project and project management
The definition of project varies from one company to another. In some cases, the word is used
loosely to describe any task, exceptional or recurring. Thus, a “project” could mean any routine
that demands time (Thomsett, 2010). Tonnquist (2008) has pointed out that the project is a
temporary organization which is appropriate when there is a need for coordination between
various parts of the company. It has 4 criteria:
- Specific goal: a unique assignment;
- Specific time period;
- Specific resources;
- Unique work arrangements: temporary organization
This temporary organization is created within the company and enables the company to keep the
strong focus on customer value through the goal management. In the project, the project manager
has the full authority and responsibility of the planning, execution, and closing of the
organization (Tonnquist, 2008). Key project management responsibilities include creating clear
and attainable project objectives, building the project requirements, and managing the triple
constraint for projects, which is cost, time, and quality (Tonnquist, 2008).
Project management is the science of organizing the components of a project, whether the project
is development of a new product, the launch of a new service, or a marketing campaign
(Tonnquist, 2008). It is the discipline of planning, organizing, securing, and managing resources
to achieve specific goals. No matter what type of project, project management typically follows
the same pattern:
- Definition
- Planning
- Execution
- Control
- Closure

30
However, although the project is relatively independent from the line production within the
company, a successful project management result is depended not only on the internal
management but also on the cooperation between the line production and the project team.
During this period, line managers create value through improving individuals‟ skills and
processes, while project managers create value through delivering results and changes
(Tonnquist, 2008). It requires an intensive collaborative work among the company
management, line manager, project manager, and the individual employees. Looking back to
many fail cases of project management, two major reasons are:
- Unclear internal project control and management;
- Inefficient collaboration among the top management, line manager, project manager, and
employees.
3.2.2 Triple constraint for project management
One major challenge of each project is making the project work and be relatively successful
within the Triple Constraint (Tonnquist, 2008). The Triple Constraint (Figure 5) contains three
elements which are quality (both process quality and product quality), cost (both expenditure
and resources) and time (schedule). These three elements of a project are connected with each
other. If one of these elements is restricted or extended, the other two elements need also then
be either extended/increased in some way or restricted/reduced in some way. There needs to be
a balance between these three elements that only when fully understood by the Project
Manager, allows for the successful planning, resourcing and execution of a project. These
are the key elements of a successful project and these are the things that will determine whether
or not you have successfully managed a project.
Tonnquist (2008) explained that a project manager has to know which factor is most important
in the project, and where it is possible to compromise if the project does not stick to the plan.
One famous approach of prioritizing is to rank the triple constraints by sharing 100% among:
Quality____% Time____% Cost____%

31
Figure 5: Triple constraint in project management
The prioritization needs to be done in the early phase of the project and this can only be
completed by communicating with the clients, both internally and externally. Project manager
gathers all the team members to have a thorough discussion and ensure a full understanding of
the project. If, for instance, the top priority of one specific project lies with the Time, it
indicates that the delivery time (schedule) is more important than the other two in this project.
Now, we are going to look a bit more closely at the three elements which build up the Triple
Constraint:
3.2.3 Quality (Process and Product)
This element includes quality planning, quality control and quality assurance. Quality planning
involves identifying which quality standards are relevant to the project and preparing plans that
will satisfy the requirements. Quality control is the appraisal of specific project outcomes to
determine if they comply with quality requirements and taking corrective action if non-
compliance is found. Quality assurance is the periodic review of actual project performance to
ensure that quality plans have been implemented and that quality procedures are being followed
correctly. Quality assurance also involves taking corrective action if non-compliance with
established procedures is found or modifying the quality plan if quality control results show
that it is inadequate. (Tonnquist, 2008)
Quality
Time Cost
Prioritize
32
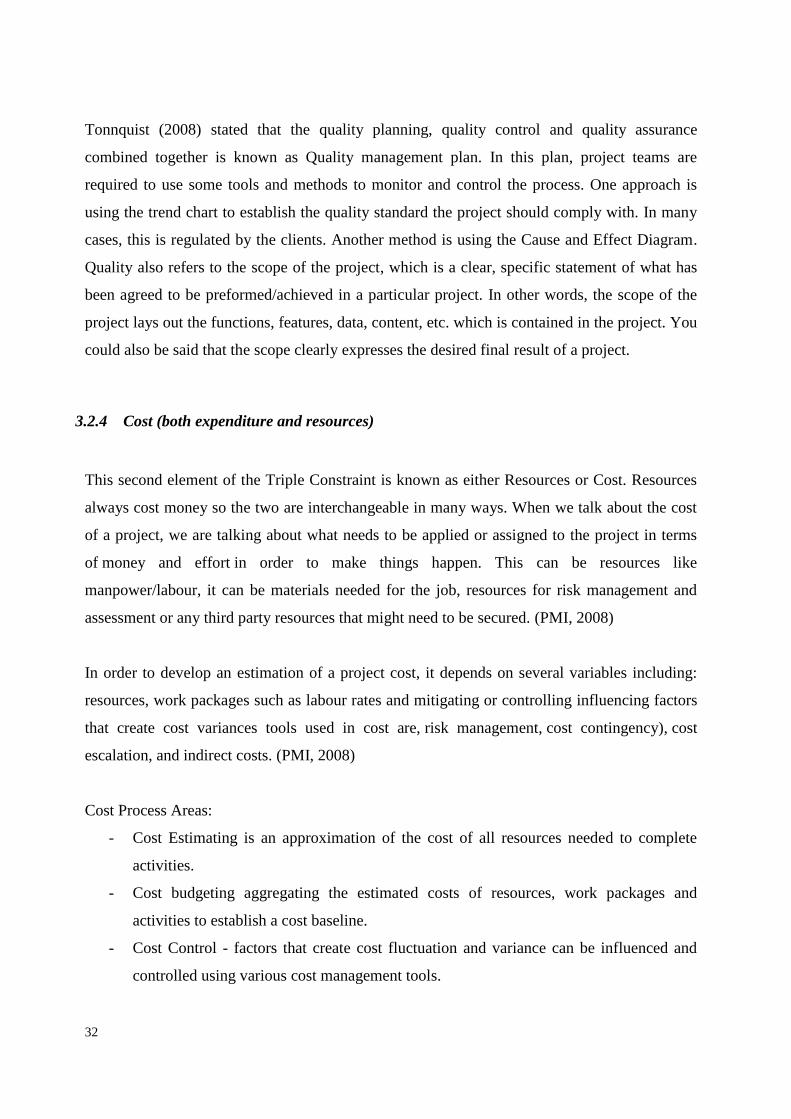
Tonnquist (2008) stated that the quality planning, quality control and quality assurance
combined together is known as Quality management plan. In this plan, project teams are
required to use some tools and methods to monitor and control the process. One approach is
using the trend chart to establish the quality standard the project should comply with. In many
cases, this is regulated by the clients. Another method is using the Cause and Effect Diagram.
Quality also refers to the scope of the project, which is a clear, specific statement of what has
been agreed to be preformed/achieved in a particular project. In other words, the scope of the
project lays out the functions, features, data, content, etc. which is contained in the project. You
could also be said that the scope clearly expresses the desired final result of a project.
3.2.4 Cost (both expenditure and resources)
This second element of the Triple Constraint is known as either Resources or Cost. Resources
always cost money so the two are interchangeable in many ways. When we talk about the cost
of a project, we are talking about what needs to be applied or assigned to the project in terms
of money and effort in order to make things happen. This can be resources like
manpower/labour, it can be materials needed for the job, resources for risk management and
assessment or any third party resources that might need to be secured. (PMI, 2008)
In order to develop an estimation of a project cost, it depends on several variables including:
resources, work packages such as labour rates and mitigating or controlling influencing factors
that create cost variances tools used in cost are, risk management, cost contingency), cost
escalation, and indirect costs. (PMI, 2008)
Cost Process Areas:
- Cost Estimating is an approximation of the cost of all resources needed to complete
activities.
- Cost budgeting aggregating the estimated costs of resources, work packages and
activities to establish a cost baseline.
- Cost Control - factors that create cost fluctuation and variance can be influenced and
controlled using various cost management tools.

33
3.2.5 Time/Schedule
Time, in project management, should be planned to its smallest detail. The amount of time
required to complete each and every component of a project is analyzed. Once analysis has
taken place, those components are broken down even further into the time required to do each
task. Obviously from all of this we are able to estimate the duration of the project as well as
what and how many/much resources need to be dedicated to that particular project. For
analytical purposes, the time required to produce a deliverable is estimated using several
techniques. One method is to identify tasks needed to produce the deliverables documented in
a work breakdown structure or WBS. The work effort for each task is estimated and those
estimates are rolled up into the final deliverable estimate.
The tasks are also prioritized, dependencies between tasks are identified, and this information is
documented in a project schedule. The dependencies between the tasks can affect the length of
the overall project (dependency constrained), as can the availability of resources (resource
constrained). Time is different from all other resources and cost categories.
According to PMBOK the Project Time Management processes include: Activity Definition,
Activity Sequencing, Activity Resource Estimating, Activity Duration Estimating, Schedule
Development, and Schedule Control.
3.2.6 Risk management in project management
Risk management is a structured approach which consists of “risk identification, a qualitative
way of risk analysis, a quantitative way of risk analysis and risk response plan” (Vose, 2008).
Contingency response with extra time/cost buffer for unseen events can be a wise decision based
on the experience from previous project execution.
Risk identification
Risk event is the event that may have a negative impact on the project. The first step is to
identify the risk (Tonnquist, 2008). Usually brainstorming is an excellent way to identify and
discover the potential risks. The phases of pre-study and planning of project need to be

34
implemented before risk planning and response planning. Consequently there are many available
resources for identifying the potential risk events. And the project team members should use
these resources as much as possible. The resources include “project charter, the work breakdown
structure, the SWOT analysis (Strength, Weakness, Opportunity and Threat), the requirement
specification, the time and resource estimates, resource and staffing planning, stakeholder
analysis, the chosen solution” (Tonnquist, 2008). Among these resources, the SWOT analysis
method has the priority for project risk identification during preparation. The treats and
weaknesses of SWOT should be eliminated or minimized by experienced planning. Some threats
and weakness may probably not be eliminated. All the identified risks should be documented and
stated in the project planning.
The categorization of the risk events is also recommended. This can make the risk event more
clear and facilitate the process of risk response plan. The risk categories may include: technique
and execution risks, project management risks, organizational risks, external risks and etc (Zaval
and Wagner, 2011).
Quantitative risk analysis
Both the probability of the risk events and the impact of the consequence will have the
influence on the project (Molenaar et al., 2010). Thus the risk value of the project should be
calculated based on both factors, which can be shown as "probability” multiplied “impact”.
Both probability and impact are rated on the scale from one to five and one is the lowest and
five is the highest (Figure 6). The project manager will make risk response plan based on the
risk value. Usually a group of members need to be assigned for risk analysis with the risk
mitigation plan. To analysis the risk level, the team should insert the result into the risk matrix
as shown in Table 3. After calculation, the risks which are located in the upper right corner
have been responded via risk response planning. Usually the mitigation should be done before
project initiation if the score is above 20. And the risk with high impact values also should be
migrated (Tonnquist, 2008).

35
Figure 6: Risk value
The risk with the higher priority may need deeper analysis. The impact of the risk extends to the
product quality, resource and project schedule influence (Kendrick, 2009). The Table 3 is the
matrix of risk with these three parameters. This matrix table can illustrate which of the risk
consequence has the highest influence.
Risk Probability 1 to 5
Impact 1 to 5
Risk value P X I =
Risk response
Q T R Q T R
Table 3: Risk matrix with quality, time and resource
Risk response plan
The risk response plan is the strategy for dealing with the potential risk to ensure the project
success (Heldman, 2011). Usually the strategies for risk response are as following:
- Avoid risk
- Transfer risk
- Mitigate risk
- Accept risk
Probability
1 < 20%
2
3 50%
4
5 >80%
Impact
1 Low
2
3 Medium
4
5 High
Hig
h
5 10 15 20 25
4 8 12 16 20
IMP
AC
T
Med
ium
3 6 9 12 15
2 4 6 8 10
Low
1 2 3 4 5
<20%
50%
>80%
PROBABILITY
Table 2: Probability and impact matrix (Tonnquist, 2008)

36
3.2.7 Communication in project management
The purpose of communication is to reach the communication goals for all the stakeholders and
express clearly of what the manager want to the different stakeholder to know, feel and do
(Tonnquist, 2008). And it is one of the important tasks for project managers.
Communication model
The basic communication process is shown in
Figure 7 (Tonnquist, 2008), and this model is based on the model of Lasswell, Shannon and
Weaver (1949). Communication is a two-way flow while the information can be transferred in
one direction (Narula, 2006). When sender and receiver have information transmission between
each other, communication happens. To achieve an effect in this communication model, the
senders send the information of the current situation of the project and obtain the response from
the receivers (Tonnquist, 2008). All of these information transmission and feedback exchange
need be based on one purpose; otherwise the communication would be meaningless. Right and
precise encoding and decoding in this model can be a vital process to avoid the
misunderstanding. Thus it is important the senders and receiver speak the “same language” and
the message can be interpreted as the way it was meant to be. A communication way which is
comprehended by both sides can facilitate the communication process.
Feedback from the receiver can be a good signal of the success of the communication (Stewart et
al., 2007). Based on the feedback from information receiver, the senders can evaluate the effect
of this communication and also can improve the process continuously. The interference
sometimes can interrupt the communication both in transmission and feedback. This can obstruct
the communication result from the wanted purpose.

37
Figure 7: The basic communication process
Communication plan
It is importance to establish a regular communication system in project. This can facilitate the
process of sending the information to the target groups in an appropriate manner ( Heldman,
2011). By planning with the information flows, the risk of making mistakes and the
misunderstanding between the members can be minimized. The communication plan can make
sure the information that the project mangers want to distribute correctly.
Table 4 is an example of the communication plan in the project (Tonnquist, 2008). Six parts
should be included which are who-receiver, why, what, how, when and who-sender. In the
example, there are suggested situations in each column, and the whole plan should contain the
practical situation for each project. Four methods/systems can be important to implement the
project communications which are reports system, meetings system, project office and project
portal.
Who-receiver Why What How When Who-
responsible
All project
members
Establish the
project with
the important
Pre study
Requirements
Project plan
Project
meetings
Reports
Pre-planed Project
manager
Sponsor
Sender Message Encoder Decode
r
Receiver
Who What How Who
Effect
Why
Feedback
Interference

38
Table 4: Communication plan (Tonnquist, 2008)
A vital part of project communication is about progress and performance reporting (Schwalbe,
2008). The project manager needs to obtain the information from the team members about what
they have accomplished and how much time they have used. This information is important for
the right decisions of the project managers. Failing of the performance reporting, a risk may
happen, such as the wrong perception from the steering committee and sponsors about the
project progress (Schwalbe, 2008). The report from team members to project manager should
include resource or activity level, result and time reporting (Tonnquist, 2008). The report from
project manager to sponsor or steering committee can be a little different, which should include
the overall project activity, result and time and cost reporting.
There are different kinds of meetings to be scheduled in the project planning phase. Project
meeting should be held regularly, at least once a week. Steering committee meeting should also
be held regularly, especially during the tollgates and unforeseen events (Tonnquist, 2008).
Project office is the locations that can keep the group members work together (Block and Frame,
2001). Usually the wall of the office is used for the changes and results continuously updated on
daily bases. This generates an image for the group members about the task and the prioritization.
Project portal is a virtual office for project team. It is the administrative platform where the
project documentation stored and shared (Srikantaiah et al., 2010). The convenient web service
stakeholders
Clients Deliver
decision
documentation
Budget and
calculation
Online project When
needed
Client
Reference
group
Distribute the
finical reports
Resource
requirements
Demonstration
presentation
Continuously Project team
members
Partners Show how
much the
project
accomplished
Status
Finical
outcome
Revision
Final report
Quality
assurance
managers
Line
organization
Exchange
lessons
learned
Project
review
experience

39
can easily control the file access to different group people. And it is also possible to access with
no territorial restrict. This platform can facility the communication within the project efficiently.

40
4 Chapter 4 Introduction of Six Sigma Tools
4.1 QFD
QFD (Quality Function Deployment) is also known as the House of Quality matrix (Akao,
1990). It is a systematic approach to design based on a close awareness of customer desires,
coupled with the integration of corporate functional groups. It is also an important tool for
translating customer requirements, demands, and expectations into appropriate design and
product characteristics (Michalski, 2003). It requires to be integrated with the product
development teams, cross-functional communications and teamwork in the planning,
engineering, and manufacturing activities and aligns them to achieve quality and customer
satisfaction (Michalski, 2003).
The 3 main goals in implementing QFD are (Akao, 1990):
1. Prioritize spoken and unspoken customer wants and needs.
2. Translate these needs into technical characteristics and specifications.
3. Build and deliver a quality product or service by focusing everybody toward customer
satisfaction.
Quality Function Deployment has helped to transform the way many companies (Akao, 1990):
• Plan new products
• Design product requirements
• Determine process characteristics
• Control the manufacturing process
• Document already existing product specifications
QFD uses some principles from Concurrent Engineering in that cross-functional teams are
involved in all phases of product development (Michalski, 2003). Each of the four phases in a
QFD process uses a matrix to translate customer requirements from initial planning stages
through production control (Becker Associates Inc, 2000). We are going to introduce how these
four phases work in a QFD process in the following section.

41
Each phase or matrix represents a more specific aspect of the product's requirements.
Relationships between elements are evaluated for each phase (Akao, 1990). Only the most
important aspects from each phase are deployed into the next matrix.
Ultimately the goal of QFD is to translate often subjective quality criteria into objective ones that
can be quantified and measured and which can then be used to design and manufacture the
product (Akao, 1990).
The chart below is the template of the QFD (Park, 2003). In the left column which is marked
yellow, is the list of Voice of Customer (VOC). In the upper row which is marked blue is the list
of Quality Characteristics (QC) of a product. In the middle section which is marked green is the
Rate of Co-relationship between VOC and QC. QC stands for any functional or appearance
characteristic which can be used for measuring the quality of product or process. Weighting is
the importance rate of each VOC; it should be determined based on the actual needs and
requirements of the customers. The main goal is to calculate the total score of improving rate of
VOC and improving effect of VOC.
QFD
Wei
ghti
ng
QC
Impro
vin
g r
ate
of
VO
C
Impro
vin
g
effe
ct o
f V
OC
VO
C
Improving Rate of QC
Total score
Table 5: The general model of QFD
4.1.1 Approach of implementing QFD:
Below is one specific approach of implementing QFD. This is also based on the knowledge
which Sakao (2010) provided.

42
Phase 0: Gather and prioritize the customers’ needs/VOC
The phase 0 in a QFD project is to determine what market segments will be analyzed during the
process and to identify who the customers are. In this phase, practitioners should mainly do two
things. First, they should collect the VOC from the customer, through negotiations and meetings.
Then they should give each of the VOC an importance rate base on the actual needs of the
customers, so that all the VOC can be prioritized. These group rates will be used later in the
relationship matrix.
Phase 1: Determine which kind of quality characteristic is more important
In the first phase of QFD, the team needs to identify the Quality Characteristics of the product.
Then they should identify the rate of co-relationship between VOC and QC through meetings
and discussions. The last step which the team should do is to do some easy math to calculate the
relative weight of each QC. This group of weights will be used later in the phase 2.
Phase 2: Translate QC into key components of the product
The first step in phase 2 is to identify the key components of the product. Then, based on the
same theory in phase 1, the team needs to give the rate of co-relationship between key
components and QC. According to the data input, the team further needs to calculate the relative
weight on key components. This group of rate will also be used in the phase 3 of QFD process.
Phase 3: Generate design or improving options and calculate the rates
In this phase, the team generates several design or improving options of the product according to
the results of the first two phases, and calculate the improving rates on QC of each option. The
rates will be used in the phase 4 of QFD process.
Phase 4: Test the effect of each option based on the VOC, and then compare them
In the phase 4, the team needs to take the improving rate on QC, which is calculated in the phase
3, back to the VOC, to testify the improving effect of each option based on the VOC. Finally,

43
compare among the several options according to the VOC, and draw the conclusion about which
option has a better improving effect on the production.
4.2 CTQ
CTQs (Critical to Quality) are the most important, measurable characteristics of the finished
product or process whose performance standards or specification limits must be met in order to
satisfy the customer (Michalski, 2003; White, 2006). CTQs represent the product or service
characteristics that are defined by the customer (internal or external). They may include the
upper and lower specification limits or any other factors related to the product or service. A CTQ
usually must be interpreted from a qualitative customer statement to an actionable, quantitative
business specification (White, 2006).
The measurement takes place not only on the finished products but also during the whole
process. Examples of the measurable characteristics of a product would be like length, width,
and height, and product performance measurements like capacity, write time, or error
performance (White, 2006). Examples of the measurable characteristics of a process would be
like duration and time consuming, expenditure and cost, etc. Establishing CTQs is vital for a
company to meet customer needs and keep up with the competition.
The purpose of Critical-To-Quality trees is to convert customer needs or wants to measurable
requirements for the business to implement. The figure shown below is an example of the CTQ
tree. It has five main aspects which are Need, Diver, CTQs, Measurement, and Target. The
project team members need to sit together and conduct the discussions and meetings, in order to
identify these five aspects accurately.
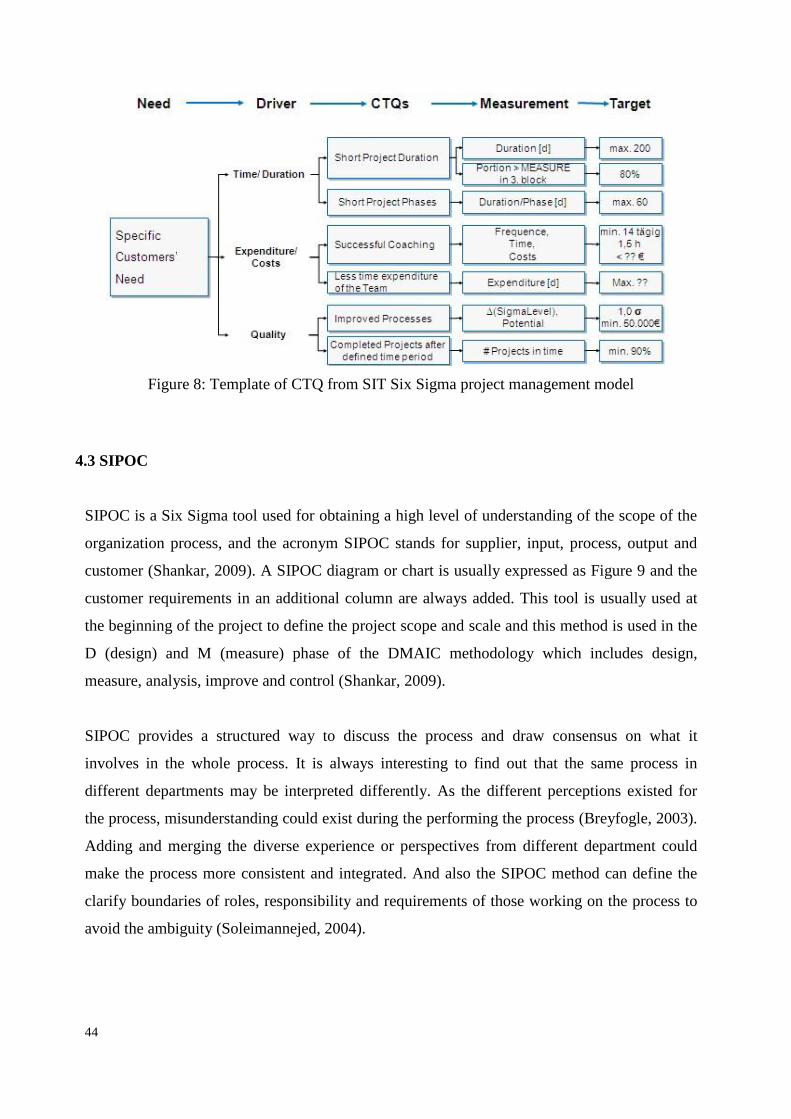
44
Figure 8: Template of CTQ from SIT Six Sigma project management model
4.3 SIPOC
SIPOC is a Six Sigma tool used for obtaining a high level of understanding of the scope of the
organization process, and the acronym SIPOC stands for supplier, input, process, output and
customer (Shankar, 2009). A SIPOC diagram or chart is usually expressed as Figure 9 and the
customer requirements in an additional column are always added. This tool is usually used at
the beginning of the project to define the project scope and scale and this method is used in the
D (design) and M (measure) phase of the DMAIC methodology which includes design,
measure, analysis, improve and control (Shankar, 2009).
SIPOC provides a structured way to discuss the process and draw consensus on what it
involves in the whole process. It is always interesting to find out that the same process in
different departments may be interpreted differently. As the different perceptions existed for
the process, misunderstanding could exist during the performing the process (Breyfogle, 2003).
Adding and merging the diverse experience or perspectives from different department could
make the process more consistent and integrated. And also the SIPOC method can define the
clarify boundaries of roles, responsibility and requirements of those working on the process to
avoid the ambiguity (Soleimannejed, 2004).

45
Figure 9: SIPOC diagram (Shankar, 2009)
As the traditional SIPOC diagram is divided into blocks with one direction connection, the
communication between company, customers and suppliers can be in poverty. The problems
can happen from the beginning and detected at the end, thus the internal and external feedback
loops can be added referring to Michalski (2003). The aim of the feedback loops is to minimize
the misunderstanding problems by increasing the communication within and out of project.
Based the synchronization of parallel metrics with the traditional SIPOC model, an improved
model can be advised to take into the implementation (Smith et al., 2008). This model can
synchronize the quality, cost and time metrics with the process inputs, process and outputs. The
control of the metrics can be taken during the whole process. The model can be shown as in
Table 6.
SIPOC Diagram
Supplier Input Process Output Customer
Step 1 Step 2 Step 3

46
Table 6: SIPOC model with parallel metrics
Step 1: The team use brainstorming or meetings to develop a SIPOC diagram, list out the
interconnected five blocks of the suppliers, input activities and resources, process, out activities
and products, customers. This can be taken as the traditional SIPOC process (Shankar, 2009).
Step 2: The internal feedbacks can be made between the long-term relationship suppliers and the
project execution from input and output (Michalski, 2003). The suppliers can always participate
into the interactive process to quickly solve the problems that may happen. External feedback
loop contains the communication between the customer, supplier and the input of the projects
(Michalski, 2003). The involvement of the customer can minimize the misunderstanding
problems from the project initiation. However, confidentiality can be a big problem here. Thus to
what extend should the communication goes into can be a critical issue to consider carefully.
Step 3: Synchronize the quality, cost and risk metrics with the process inputs, process and
outputs (Smith et al., 2008). The input figures can come from the CTQ model result. The data is
divided into detail steps in the process phase. The output metrics is the target value in the CTQ
result. The buffers for data estimation are suggested to reach the targets value with less deviation.
SIPOC Diagram
Supplier Input Process Output Customer
Item Input metrics Process metrics Output metrics Response plan
Quality
Cost
Time

47
Step 4: Use the diagram as a guide to find out potential problems and process improve
suggestions (Rath & Strong, 2005).
4.4 FMEA
FEMA stands for Failure Model Effect Analysis and is “a technique used to identify, prioritize,
and eliminate potential failures from the system, design or process before they reach the
customer” (Stamatis, 2003). It helps the team to identify the potential failure of the modes
based on the experience from the product design or process (Borror, 2008), enabling the project
to defect and design the failure with the minimum of effort to reduce the time and cost spent.
4.4.1 Traditional FMEA
The most wildly used FMEA is the Mil-Std-1629A procedure, which was developed by Navy
in 1974 (Brue & Howes, 2005). The task of FMEA can be divided into three categories:
identify failures, prioritize failures and reduce risk as in Table 7 (Kmenta & Ishii, 2000).
Table 7: Three major tasks of FMEA
The elaborate procedure of the FMEA spreadsheet is illustrated in Figure 10 (McDermott et al.,
1996). This form can provide all the important information about the FMEA to be a good
communication tool.
FMEA
Task
Result
Identify
failures:
Describe Failures: Causes - Failure
Modes - Effects
Prioritize
Failures
Assess Risk Priority Numbers (RPN):
RPN = failure occurrence ×effects
severity× detection difficulty
Reduce
Risk
Reduce risk through: reliability, test
plans, manufacturing changes,
inspection, etc.

48
Item /
Function
Potential
Failure
mode
Potential
Effects of
Failure
S
(severity
rating)
Potential
Cause(s)
O
(occurre
nce
rating)
Current
controls
D
(detectio
n rating)
CRIT
(critical
characte
ristic
RPN (risk
priority
number)
Recomm
ended
actions
Responsi
bility and
target
completi
on date
Action
takenNew S New O New D
New
RPN
Traditional FMEA Worksheet
Figure 10: The traditional FMEA Worksheet
According to the basic of FMEA, the detailed implementation of traditional FMEA worksheet is
shown as follows (McDermott et al., 1996):
Step 1: review the process
All the group members should have the same understanding of the process. If they are
conducting a product FMEA, they should have a review of the product and see the physical or
the prototype of the product. If the process FMEA is conducted, the team members should have a
review of the detailed flowchart and physically go through the whole process flows. The experts
of the product or the process are recommended to help the team with the problems that may
occur.
Step 2: brainstorm potential
Team members should participate in the brainstorming meeting with a list of their ideas. And it
is better for each member to focus on one element, for example: people, material, methods and
etc. This will result in a thorough list of potential failure modes.
Step 3: list potential effects of each failure modes
With the possible failure modes listed out, the team review each failure mode and identify the
potential effects of the failure. There can be only one effect for some failure modes, while
several effects for the others.
Step 4, 5 and 6: assigning severity, occurrence and detection ratings
Occurrence (O) –how often is the failure mode happened?
Severity (S) - how serious is the result effect?
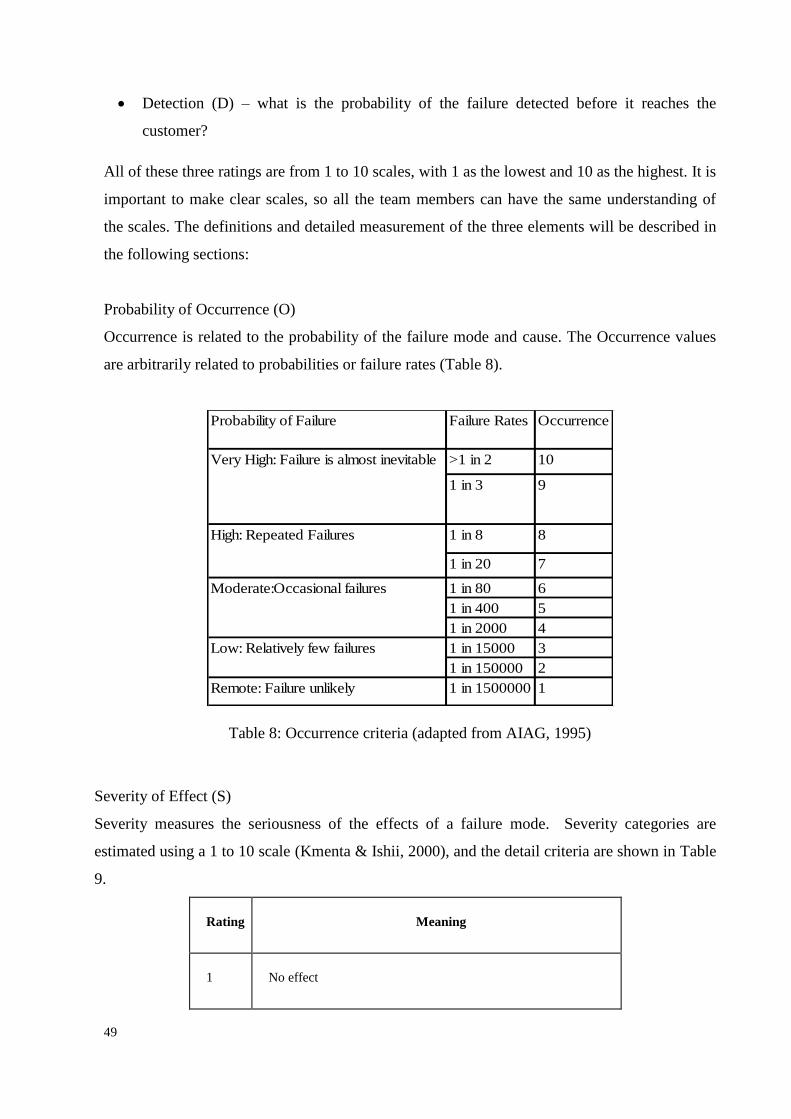
49
Detection (D) – what is the probability of the failure detected before it reaches the
customer?
All of these three ratings are from 1 to 10 scales, with 1 as the lowest and 10 as the highest. It is
important to make clear scales, so all the team members can have the same understanding of
the scales. The definitions and detailed measurement of the three elements will be described in
the following sections:
Probability of Occurrence (O)
Occurrence is related to the probability of the failure mode and cause. The Occurrence values
are arbitrarily related to probabilities or failure rates (Table 8).
Table 8: Occurrence criteria (adapted from AIAG, 1995)
Severity of Effect (S)
Severity measures the seriousness of the effects of a failure mode. Severity categories are
estimated using a 1 to 10 scale (Kmenta & Ishii, 2000), and the detail criteria are shown in Table
9.
Rating Meaning
1 No effect
Probability of Failure Failure Rates Occurrence
>1 in 2 10
1 in 3 9
1 in 8 8
1 in 20 7
1 in 80 6
1 in 400 5
1 in 2000 4
1 in 15000 3
1 in 150000 2
Remote: Failure unlikely 1 in 1500000 1
High: Repeated Failures
Moderate:Occasional failures
Low: Relatively few failures
Very High: Failure is almost inevitable

50
2 Very minor (only noticed by discriminating customers)
3 Minor (affects very little of the system, noticed by average
customer)
4/5/6 Moderate (most customers are annoyed)
7/8 High (causes a loss of primary function; customers are
dissatisfied)
9/10 Very high and hazardous (product becomes inoperative;
customers angered; the failure may result unsafe operation and
possible injury)
Table 9: Severtity criteria (Kmenta & Ishii, 2000)
Detection (D)
Detection definition: What is the chance of the customer catching the problem before the
problem results in catastrophic failure? The rating decreases as the chance of detecting the
problem is increased, for example: 10 means the problem is almost impossible to detect and on
the contrary, 1 means the problem is almost certain to detect (Palady, 1995).
Step 7: calculate the risk priority number for each effect and prioritize the failure modes
The RPN (Risk Priority Number) used to access risk is calculated based on the three criteria:
RPN = O (Occurrence) × S (Severity) × D (Detection)
O, S and D are rated on 1 to 10 scales. The big risk priority number stands for high priority
level.
Step 8: take action to eliminate or reduce the high risk failure modes
The team members should make some plans or actions to reduce or eliminate the high risk
failure modes.

51
Scenario Function/ Requirement Potential Failure Modes Potential Causes of Failure
Probability
Occurrence
Local Effects End Effects
on Product, User, Other
SystemsC
ost
Severity
Dete
ction
exp. C
ost
RP
N
4.4.2 Expected cost FMEA
The RPN number has no clear meaning, and O, S and D can have different meanings for each
FEMA, so it is hard to sharing the data between different companies.
Recently there are some criticisms about the original FMEA, such as FMEA is performed too
late and doesn‟t affect the key product and process decisions (McKinney, 1991), FMEA often
missed the key failures (Bednarz et al., 1988) and Harpster (1999) considered that RPN is not a
good measurement of risk. Steven Kmenta (2002) proposed a scenario-based FMEA by using
expect cost (Figure 11). According to the risk definition in Webster‟s dictionary, risk is the
possibility of loss or injury. He found that occurrence is related to probability; severity is
related to the cost and there are too many confusing definitions for detection. Thus he proposed
a new way to measure the risk –“expected cost”.
Expected cost= (probability) × (cost)
Figure 11: The cost-expected FMEA model
Based on this model, the priority can be given based on different focus. While the situations
such as high RPN number with low expected cost and low RPN number with high expected
cost happen, the decision for the priority of the risks and response plans can be made based on
the overall consideration.

52
5 Chapter 5 Empirical Findings
5.1 Current situation of project management in SIT
Our surveys and interviews have been designed based on the six important aspects of the
project implementation as we explained above; which are cost, time, quality, customer
satisfaction, risk and opportunity, and communication. The methodology will help us
understand the current situation and difficulties which the project managers and team members
are facing in their daily management works.
5.1.1 General process map of SIT project management
First of all, Figure 12 is showing the general process map of SIT project management.
Figure 12: General process map of SIT project management
After we have conducted the surveys and interviews, we have gained a general and clear
understanding of how the projects in SIT work. Normally, a whole project in SIT contains three
phases, which are sales phase, project execution phase, and warranty phase. In our case, we
only focus on the first two phases. The Figure 12above shows every step the team members

53
should do in these two phases. After each step, there is a milestone, which is shown as PM100,
PM200 and etc. These milestones are set in order to facilitate the team members to review the
work previously. There are also three Quality Gates (QGs). They are used for checking out all
the work which has been done between the two QGs, and to make sure that everything of the
project is still under control. There is a common idea among the project managers that the
difference between QG and Milestone is that QG is more formal than Milestone. A Milestone
may be conducted by individual. On the contrary, QG has to be conducted in a formal meeting
by the whole team. The main work which should be done in QG is to fill out the checklists,
review the schedule, and do the written documentations.
5.1.2 Current situation and difficulties of SIT project management
From the results of the surveys and interviews, we have summarized 5 common management
difficulties which most of the 9 interviewed project managers have stated. Due to the
confidentiality issue, in the following text, we use the expression of “GT/ST/SOL + Number”
to refer to the different manager in different department who was interviewed by us, such as:
ST2 referring to the second manager in Steam Turbine department who was interviewed. These
management problems are:
- Unclear project scoping
Unclear scoping is mostly reflected as no clear project boundary. Project members
sometimes are confused about who should do what at when. Manager GT2 said that there
were lots of specifications and some were easy to be missed. Manager GT3 stated the
contract was not been studied in detail in the early phase of the project. Manager ST1 pointed
out that sometimes the lack of investigation with clients and sales teams caused the unclear
scoping. Talking about the improvement methods, most of the managers suggested that they
needed a more detailed planning and action in project scoping, such as more communication,
feed-back from clients, suppliers and sales team, more internal meetings and brainstorming,
more investigation in the early phase. Manager SOL3 indicated that his team was using a
management tool: ABA-list to define the scope and customers‟ needs. He also pointed out
that this tool was not detailed enough. Some of the important specifications were missing in

54
this tool, such as the definition of the handover from sales to project teams. Many problems
occurred during the handovers. Furthermore, there was not an interface control in this tool.
- Misunderstanding the customers’ needs
Sometimes the project teams misunderstood what the customers‟ really wanted and caused
the customer unsatisfied. For this reason, Manager SOL1 stated that the team missed some of
the customer requirements. Manager GT3 said customers were not really involved in the
projects. The communication among the customers, sales, and project teams were lacking.
According to these facts, some managers made suggestions for improvement. Manager GT2
said that project teams should quantify the customers‟ needs in order to get a more clear
understanding of VOC. Manager GT3 suggested that customers need to get involved in the
projects, and more meetings for exchanging the information should be conducted.
- Risk assessment and response
Some of the project managers seldom had a clear strategy of dealing with the risks which
they were facing. They stated that some project teams seldom conducted the risk
identification and measurement after they have received the risk list from the sales teams.
Therefore, the response to the risk was not efficient or proper. However, some of the project
teams were dealing with the risks proactively. SOL3 stated that after their team received the
risk list from sales, they would sit together, conduct the risk assessment, and add more risks
based on their own situation. During the process of assessment, all the team members
participated. According to the explanation of these nine project managers, the frequency of
the risk assessment conducted by the project team was different. Some of them assessed the
risks monthly, while others did this every three months. Most of the project teams use Risk
Matrix, a formalized tool in SIT, to analyze the value and probability of the risks. All these
activities were conducted in PACT, Project Acceleration via Coaching and Teamwork. It was
the workshop meeting, and was mandatory for level A and B projects in GT and SOL, and
level C projects in ST. During these workshop meetings, project teams did project planning,
target identification, making project chart, risk assessment, stakeholder analysis,
communication and organizational chart. As for the improvement of the risk assessment,
both SOL3 and GT2 indicated that it was very important to gather all the team members
together and have the discussions. During the discussions, team members should share the

55
knowledge and personal experience with each other. GT2 also said that risk assessment was
not that hard, the hardest part was to let everyone in the team to be aware of the potential
risks and get prepared. Some of the managers felt positive if there was a more detailed tool
for assessing the risks and response even if they have already had a proper strategy when
dealing with the potential risks, since they intended to continuously improve the performance
of risk assessment.
- Late and wrong delivery
This is a problem mentioned by most of the project managers. Manager SOL1 pointed out
there were incomplete or missing parts of the product (bolts, clamps, small items) which
caused the wrong delivery. The internal reason can be that all parts of the system were not
defined well (no detailed items and parts list), while no inspection from the sub-suppliers
before the delivery can be the external reason. Manger SOL2 mentioned that there is no
common way of reporting from sub-suppliers. Manger ST1 suggested that a periodical
review with sub-suppliers was necessary. Manger GT3 mentioned that two different time
schedules were used in production and sales phase for one project.
The current tool that most of the managers used for time control was Gantt chart in the
program of MS-project. Although most of the managers were satisfied with this tool, there
were some problems. Manager SOL2 said that it was difficult to reschedule the Gantt chart,
and manager SOL3 pointed out that only Gantt chart was not sufficient and a link should be
made between the sub-supplier schedule and the whole project schedule.
- Cost problems
Most of the managers have done the reviews of project costs quarterly. The cost estimation
is under good control by the managers due to the fact that the degree of the cost sensitivity of
the customer is low. However, some problems still exist in the cost estimation and a more
detailed description of them follows.
Due to time issues, manager GT3 and SOL1 mentioned that too much material need to be
delivered. The change of the material price from sub-suppliers would lead to the wrong
estimation. Manager GT2 mentioned there was always something missing in the sales phase
and manger SOL2 said that the cost estimation in the sales phase was not made based on the
consideration of the production and clear scope, thus the deviation of the cost estimation

56
could happen. Bad updates from sale phase to the project execution phase could also be one
of the major problems related to cost. The reason for this could be no clear responsibility
among the project team members. Since SIT is a company with business distributed all over
the world, manager SOL3 mentioned the difficulty to manage unplanned activities due to
culture difference, such as tax regulations, policies and different component standards. He
made suggestions for building a relationship with the local company, setting up the platform
of the learning lessons from different countries.
The current tools used are PROCON, Material Index and SCS checklist. PROCON is a tool
for cost estimation in sales phase, but it is badly updated because unclear responsibility for
updating and also the cost differs over time. Material Index is used to smooth the cost buffer
in budget. The project managers usually do the cost estimation manually, and based on the
checklists from SCS systems. SCS is a tool from sales phase, used to make cost estimation
based on the value of each component in the database checklist.
5.2 A Model for improving the unclear scoping and misunderstanding customer needs
5.2.1 The model introduction
Based on the first two PM problems which are unclear project scoping and misunderstanding
the customers‟ needs, we provide a model which we think can to some extent improve the
current situation in SIT project management. This model is called: “VOC-CTQ-SIPOC” in
which we implement some of the Six Sigma tools we have explained in Theoretical
Framework.
Figure 13 below is the working process of this model.
Figure 13: Working process of the VOC-CTQ-SIPOC model
According to this model, the first step is to gather the customers‟ needs and requirements from
the sales phase. In order to have accurate information about the VOC, the project team still

57
needs to have a thorough communication with the sales team. After the list of VOC is verified,
in the second step, the project team should transfer the list of VOC to CTQ which are the key
measurable characteristics of a product or process whose performance standards or
specification limits must be met in order to satisfy the customer. In the process of transfer, QFD
is being used. We think that QFD is a proper tool for quantifying the data, and having an
accurate understanding of the customers‟ needs and requirements. In the third step of this
model, after the project team has the CTQ, they can generate the chart of SIPOC based on the
information which CTQ provides to have a clearer project charter and scoping.
5.2.2 The phase of integrating the model
From the statement of the PM problems in SIT we can see that unclear scoping and customer
dissatisfaction problems often happen in the early phase of the project. We also know that it is
very important that the project team can solve as many problems as they can in the early phase
of the project. The Figure 14 below is the co-relationship among the Freedom of action,
Product knowledge, and Modification cost.
Figure 14: Co-relationship among Freedom of action, Product knowledge and Modification
cost
As the project is on the processing, the modification cost goes up dramatically, and the team‟s
freedom of action decreases. A common idea is that it is always better to improve the current

58
situation as early as possible. According to this idea, we decide to integrate the VOC-CTQ-
SIPOC model into the very early phase of the Siemens project plans. The Figure 15 below
shows the integration of VOC-CTQ-SIPOC model into the general process of Siemens project
management.
Figure 15: Integration of VOC-CTQ-SIPOC into general SIT project management
The precise integrated position of VOC-CTQ-SIPOC model should be between the first Quality
Gate of the project execution and the process of Detailed Planning, which also is between
Milestone PM100 and PM200. In this phase, the project team has just received all the
information from the sales phase in the process of Project Handover. In order to get the
accurate detailed data of the customers and products, a communication feed-back loop between
the sales team and project team should be embedded. The project team use formal and informal
ways, such as meetings, e-mails to communicate with the sales team during and after the
Project Handover.
Fully understanding of the handover information is very important for the implementing the
VOC-CTQ-SIPOC model.

59
5.2.3 Example of implementing the model
After all the work explained above has been done correctly, it is time for the project team to
implement the model in the Detailed Planning phase. In order to have a better understanding of
how this model works, we generate a simple example of the whole working process.
We take Hair Dryer, a kind of simple electric equipment for daily use, as the example. First, we
should know the key components of the Hair Dryer, which are:
- Motor: transform the electricity into motion energy
- Heater: increase the temperature of the air
- Package / Housing
Now, we use QFD to transfer the VOC into CTQ.
Phase 0: Gather and prioritize the customers’ needs/VOC.
After conducting feed-back communication with the sales team, the project team has gathered
all the customers‟ information which includes the VOC. Normally the VOC contains dozens of
the customers‟ needs. We only list 5 of them in order to simplify the example and make it
easier to understand. The Table 10: The list of VOC below is the list of the VOC.
LIST OF THE VOC IMPORTANCE RATE
1 The Hair Dryer must operate safely. 9
2 The Hair Dryer must operate quietly. 9
3 The Hair Dryer must dry the hair quickly. 3
4 The Hair Dryer must be good-looking. 3
5 The cost must be low. 1
Table 10: The list of VOC
In these five VOC, first four of them, are related to the product quality, and the last one of them
is more related to the process quality which refers to the performance of process, such as

60
delivery time and cost control. The next step is to prioritize the importance of each VOC; the
project team should conduct meetings with sales team, use methods of brainstorming to
eventually set the importance rate. In the table above, 9 points stand for very important, 3 point
stand for medium important and 1 point stand for less important.
Phase 1: Determine which kind of quality characteristic is more important.
QC has to be determined by the project team members through discussions and meetings, etc.
In our case, we listed four QCs of the hair dryer which are rotation speed, material used, air
temperature and number of parts. In this phase, the project team needs to transfer the
importance rate of VOC into relative weight of QC to see which kind of QC is more important.
The Table 11 below is the presentation of the QFD phase I of our example. It shows the co-
relationship between the VOC and QC. The correlation rate, which is shown in the yellow
section, is marked by the team members after they have the efficient knowledge exchange and
brainstorming. The rating theory is the same as the theory of the importance rate of VOC. 9
points represent high rate of relation, while 0 point represents no relation.
The calculation procedure is explained below:
1. Calculate the raw score of each Quality Characteristic. For example: Raw Score of Rotation
Speed (RS1) equals the sum of Weighting of each VOC (Weighting VOC) multiply Co-
relationship rate (Rate Co-relationship) between Rotation Speed and each VOC.
1 9 3 9 9 3 9 3 0 1 0 135VOC Co relationshipRS Weighting Rate
2. Normalize the Raw Score of QC into percentage number. After the calculation, the team has
got a group of data which is called Relative Weight of each QC. This group of data is the
percentage number which the sum is 1, and will be used in the next phase of QFD.

61
Quality Characteristic
QFD
Phase I
Wei
ghti
ng
Rota
tion s
pee
d
Mat
eria
l
Air
tem
per
ature
Num
ber
of
par
ts
VO
C
Operate safely 9 3 9 3 3
Operate quietly 9 9 3 3
Dry quickly 3 9 1 9
Good-looking 3 3 9
Low cost 1 3 3
Raw score 135 123 54 84
Relative weight 0.34 0.31 0.14 0.21
Table 11: QFD Phase I: translate VOC into QC
Phase 2: Translate QC into key components of the product.
In this phase, the project team needs to consider the co-relationship between QC and the key
components of the hair dryer. Then, based on the relative weight which they have got from the
phase I, the team can calculate another group of relative weight of each key component which
is shown in the lower-right row of the table. This group of relative weight is also percentage
number and will be used in the phase III of QFD.
The calculation procedure is explained below:
1. Calculate the raw score of each Key Components. For example: Raw Score of Housing (RS1)
equals the sum of Relative weight from Phase I(Weight P1) multiply the Co-relationship rate
(Rate Co-relationship) between Compressor and each QC.
2 1 0.34 0 0.31 9 0.14 0 0.21 3 3.43P Co relationshipRS Weight Rate
2. Normalize the Raw Score of Key Components into percentage number. After the calculation,
the team has got a group of numbers which is called Relative Weight of each Key

62
Component. This group of number is the percentage number which the sum is 1, and will be
used in the next phase of QFD.
QFD
Phase II
Rel
ativ
e w
eight
from
Phas
e I
Key Components
Moto
r
Hea
ter
Housi
ng
QC
Rotation speed 0.34 9
Material 0.31 3 3 9
Air temperature 0.14 1 9
No. of parts 0.21 3 3
Raw score 4.77 2.16 3.43
Relative weight 0.46 0.21 0.33
Table 12: QFD phase II: translate QC into Key components
Phase 3: Generate design or improving options and calculate the rates
In phase III, the project will generate some design and improving options through the
discussions and meetings, and then testify the improving rate of QC of each option. In our case,
we generate two options, which are:
Option 1: change the shape and material of the heater
Option 2: Redesign and improve the housing, in order to reduce the noise.
Table 13 below is the testifying result of Option 1. Due to the fact that the modification of
Option 1 is only occurring in the heater, the team just needs to focus on the improvement of
heater; the rest of the two key components have not been taken into consideration. After the
team has marked the co-relationship rate between QC and Key components, the improving rate
of QC can be calculated. We should note that the numbers of improving rate of QC are not
percentage. The higher numbers the team gets, the more effect they can expect. Based on the

63
same theory, Table 14 is the testifying result of Option 2. The improving rate of QC will also be
used in the last phase of QFD.
The calculation procedure is explained below:
For example in Table XX: The improving rate of Material(IRmaterial) equals the Rate of Co-
relationship (Rate Co-relationship) between Heater and Material divided by the sum of Material in
Phase II (SumMaterialP2) .
2
30.2
3 3 9
Co relationship
material
materialP
RateIR
Sum
QFD
Phase III(Option 1: change the shape and
material of the heater)
Key Component
Impro
vin
g r
ate
of
QC
Moto
r
Hea
ter
Housi
ng
QC
Rotation speed 0.00
Material 3 0.20
Air temperature 9 0.90
Number of parts 1 0.17
Table 13: QFD Phase III: testifying result of Option 1
QFD
Phase III(Option 2: redesign the housing)
Key Component
Impro
vin
g r
ate
of
QC
Moto
r
Hea
ter
Housi
ng
QC
Rotation speed 0.00
Material 9 0.60
Air temperature 1 0.10
Number of parts 3 0.50
Table 14: QFD Phase III: testifying result of Option 2

64
Phase 4: Test the effect of each option based on the VOC, and then compare them.
In the last phase of QFD, the project team should take the improving rate of QC in phase III
back into VOC, in order to test the improving effect of each option. When the team gets the
final score of each option, they need to compare among them to identify the advantage and
disadvantage of each option which will facilitate the team to choose a proper option based on
VOC. The tables below: Table 15 and Table 16 show the final results of potential options. The
total score of each option has been marked in red in the lower-right row of the table. The total
score do not have an upper limit which means the higher one option gets, the better it fits to the
improvement based on VOC. In our case, Option 1 gets 5.18 points while Option 2 gets 7.94
points. Our preliminary conclusion is: generally, if the team design or improve the Hair Dryer
by following the instructions of Option 2, the customers will be satisfied with the final product
than the team follow the Option 1.
The calculation procedure is explained below:
For example: Improving rate of Operate Safely(IRos) equals the sum of Co-relationship Rate of
Operate Safely and each QC (Rate Co-relationship) multiple Improving Rate of QC from Phase III
(IRP3), then be divided by the sum of Co-relationship Rate of Operate Safely and each QC
(SumOS)
3 0 3 0.2 9 0.9 3 0.17 30.278 0.28
3 9 3 3
Co relationship P
OS
OS
Rate IRIR
Sum
QFD
Phase IV (Option 1)
Wei
ghti
ng
QC
Imp
rovi
ng
rate
of
VO
C
Imp
rovi
ng
effe
ct
of
VO
C
Ro
tati
on
sp
eed
Mat
eria
l
Air
te
mp
erat
ure
Nu
mb
er o
f
par
ts
VO
C
Operate safely 9 3 9 3 3 0.28 2.50
Operate quietly 9 9 3 3 0.07 0.66
Dry quickly 3 9 1 9 0.44 1.31
Good-looking 3 3 9 0.18 0.53
Low cost 1 3 3 0.18 0.18

65
Improving Rate of QC 0.00 0.20 0.90 0.17
Total score of option 1 1.15 5.18
Table 15: QFD Phase IV: final score of Option 1 according to VOC
QFD
Phase IV (Option 2) W
eighti
ng
QC
Imp
rovi
ng
rate
of
VO
C
Imp
rovi
ng
effe
ct
of
VO
C
Ro
tati
on
sp
eed
Mat
eria
l
Air
tem
per
atu
re
Nu
mb
er o
f
par
ts
V
O
C
Operate safely 9 3 9 3 3 0.40 3.60
Operate quietly 9 9 3 3 0.22 1.98
Dry quickly 3 9 1 9 0.08 0.24
Good-looking 3 3 9 0.53 1.58
Low cost 1 3 3 0.55 0.55
Improving Rate of QC 0.00 0.60 0.10 0.50
Total score of option 2 1.77 7.94
Table 16: QFD Phase IV: final score of Option 2 according to VOC
Outputs of QFD
The Figure 16 and Figure 17 are the two kinds of comparison outputs after the team have
conducted all phases of QFD.
Figure 16 is the improvement comparison between Option 1 and Option 2 with each VOC
respectively. In our case, except for the “drying quickly”, the improving rate of Option 2 is
higher in the rest of the VOC which Option 1 improves. It means that if the project team
chooses the Option 2 as the solution to design or improve the hair dryer, the customer would be
more satisfied than they choose Option 1.
Figure 17 is the total improvement comparison between Option 1 and 2, considering the
weighting of each VOC. It gives the project team another angle to look into the improvement of

66
VOC. In our case, Figure 16 also shows that if the project team follows the Option 2 to design
or improve the hair dryer, they might receive a better customer feedback than Option 1.
Selection of the option
Based on the outputs which these two charts provided, the project team can decide to choose
option 2 as the product improvement direction which is “Redesign and improve the housing, in
order to reduce the noise”. From this point, the major focus of the whole project team will be
set on improving the product characteristics which are related to housing of hair dryer. In our
case, the product characteristics which are related to housing are hardness of the material,
thickness of material, number of parts, and of course, the cost and time-used of improving the
housing. The project team has a common knowledge that redesigning and improving these
product characteristics will improve the VOC significantly. Therefore, in the next section of
project which is setting up the CTQ, the project team will identify these characteristics as the
CTQ.
Figure 16: Output of improving rate of VOC
0 0.1 0.2 0.3 0.4 0.5 0.6
Low cost
good-looking
dry quickly
operate quietly
operate safely
Option 1
Option 2
Improving rate of VOC

67
Figure 17: Output of total improvement of VOC
Why we choose QFD
We should note that there are plenty of methods for transforming VOC to CTQ; others are
Pareto chart, surveys, etc. QFD is just one of them. The reason of choosing QFD as the tool and
method for transforming VOC to CTQ is that we think such a quantitative tool measuring the
VOC would more accurately provide legitimate information to the project team preventing
them from going to the wrong direction. We summarize three benefits which QFD provides:
1. Quantitative data facilitates the project team to understand the VOC accurately, assures that
the target of design and improvement is identical with the customer‟s requirements.
2. Gaining the knowledge about which part‟s modification will improve the customers‟
satisfaction significantly. Focus on the more important parts.
3. The outputs of QFD are the inputs of CTQ. QFD facilitates the project team to identify the
CTQ closely depended on the VOC. In our hair dryer case, the basic process is shown
below in Figure 18.
Figure 18: The basic process of QFD to CTQ
0.00
1.00
2.00
3.00
4.00
5.00
6.00
7.00
8.00
9.00
Option 1 Option 2
Operate safely
Oprate quietly
Dry quickly
Good-looking
Low cost
Total Improvement of VOC

68
5.2.4 CTQ Driver Tree Model for Option 2
As we mentioned before in the tool description of CTQ, the target of CTQ is to convert
customer needs and demands to measureable requirements for the business to implement.
After the project team has conducted the QFD to find the best option, it can proceed into the
next section which is identifying the CTQs of the Hair Dryer based on the information QFD
provided. The Table 17 below is an example of how to identify the CTQ. We should note that
all the work must be done by team members. They should use any method necessary to finish
this section, such as regular meetings, benchmarking, surveys, interviews with expertise and
customers.
The project team divides the driver into three main CTQs, which are Design/Quality, Cost, and
Time. Each one of the CTQ should be furthermore divided into several Sub-CTQs. For
instance, hardness and thickness of the plastic and metal are two Sub-CTQs for the product
characteristics which are related to housing. Once the Sub-CTQs have been identified, the
project team need to set up the measurement, current value, and target value. Take the thickness
of the metal as an example, the thickness of the metal of the current product is 1.6mm, through
regular meeting and expertise advises, the project team has decided to increase the thickness to
1.8mm. Therefore, this kind of improvement can reduce the noise, to some extent, and also
make the hair dryer operate more safely. Based on the same theory, the current housing
contains 25 individual units which the project team thinks that it should be reduced to 20
individual units, so that the hair dryer could have a better appearance, and also reduce the
noise, due to the vibration of the joints reduced.
The Table 17 below is the demonstration of the CTQ Driver Tree of our case.

69
Table 17: Demonstration of the CTQ Driver Tree
5.2.5 SIPOC model
The purpose of using SIPOC is to reach a common understanding within the team by using the
system approach. By using SIPOC, the roles, task responsibility and system requirements are
clarified. The metrics from CTQ can be spread into the five blocks of the SIPOC diagram. Thus
the metrics can be paralleled with the process to give a clear overview of the process.
Suggestions for SIPOC in SIT process map
SIPOC can be used after the sales phase, before the project initiation. In the process map of SIT,
it is suggested to locate between PM100 and PM200 (Figure 19). After the project opening and
clarification, the project team performs the detail planning, and SIPOC can be done during the
detail planning to give an overview of the project scoping. The PACT and the kick-off meeting
can be the good ways to implement SIPOC model. As the modification cost would be very high
at the late period of the whole project, it is suggested to implement the SIPOC in the early phase
and clarify the scoping and responsibility of supplier, input, process, output and customer.

70
When the project is complicated or in large scale, it can be a large number of activities if all of
them are listed out in detail on the diagram. This can make the whole project lousy and the group
members may lose interest in reading and understanding the diagram. As it is performed during
the detailed planning, the SIPOC diagram can summarize the major activities based on the
analysis of each detailed activities. Make SIPOC focus on the major activities can make the
diagram clear and give an overview of the whole project. This big picture can make all the group
members speak the same “language” and decrease the misunderstanding between the members
with different functions. Thus the misunderstanding problem of the cross functional team can be
solved based on the same understanding of the clear scoping diagram.
Figure 19: The suggestion of implementing SIPOC in process map
If the supplier has a long-term relationship with the company, the internal feedback loop can be
added with the link of the supplier and the input and output of the project. The input and output
of the project can always give feedback with the supplier to check the schedule and the
requirement for the raw material of the product. The suppliers can always participate into the
interactive process to give customized service that suits the company. This can make continuous
improvement for the relationship with the suppliers. The external feedback loop is between the
customer and input of the project. Collecting the voice of the customer can be the foundation for

71
the product improvement. After analysing the voice of customer and understanding the
customers‟ really need, all these needs can be transferred into the characteristics of product. All
of the metrics from the customer voice and product improvement can be used as the data for the
input of the project. The confidentiality can be a big problem as the depth of feedback loop needs
to be considered and discussed carefully before initiated. The schedule of the internal and
external meeting and reporting system should be planned and clear responsibility should be
assigned.
SIPOC diagram for Option 2
SIPOC diagram for Option 2 is shown in Table 18. The five blocks of SIPOC are identified by
the project team members through kick-off meetings. Supplier, input, process, output and
customer can be listed out and the diagram is approved by all the group members from different
functions. This consensus can prevent the misunderstanding of the group members with
different functions.
As in this option 2, the company needs to produce the new package of the hair dryer. The mainly
supplier is the material supplier, such as plastic and metal. Then the company uses the material
and the new design solution of the package as the inputs of the whole project. The main process
can be product design and test, manufacturing and product delivery. The output includes the new
housing/package of the hair dryer and the new design solution accompanying with the final
product. The customer can be the company who requires the order or the customer who buys the
product.
The indicators from the CTQ can be used in the parallel metrics below the five blocks. The
current values are the input metrics for the quality, time and cost. The target value of the CTQ
can be set up as the future output metrics. The process metrics are the metrics that divided into
the detailed activities with smaller numbers. For example, the design time in planning is 35 days
in total, which can be divided into modelling with 20-25 days and model test with 5-10 days in
the process metrics. The buffers for time estimation aim at reaching the target time with less
deviation. The situation is the same for the quality and cost. The synchronization of the quality,
cost and risk metrics with SIPOC five blocks can list out the metrics to give the project members
the overview of the whole project.

72
After finishing the diagram, some corrections of the wrong estimation from the detail planning
can be checked through the communication between different function members. Some potential
problems that have not been noticed before may arise to the surface. The project manager can
based on this diagram find the improve suggestion on the process development.

73
SIP
OC
Dia
gra
m
Su
ppli
erIn
put
Pro
cess
Ou
tpu
tC
ust
omer
Mat
eria
l sup
plie
rPl
asti
c 1.
Pro
duct
des
gin
and
test
New
pro
duct
des
ign
Ord
er c
ompa
ny
Des
ign
team
Met
al2.
Man
ufac
turi
ng
New
hou
sing
Prod
uct d
esgi
n3.
Pro
duct
del
iver
y
Inte
rna
l F
eed
back
loo
p
Ex
tern
al
Fee
dba
ck l
oop
Item
In
put
met
rics
Pro
cess
met
rics
Ou
tpu
t m
etri
csR
espo
nse
pla
n
Har
dnes
s of
Pla
stic
= 70
DM
ater
ial (
plas
tic)
am
ount
of P
art N
o. 1
= 5
00 g
Har
dnes
s of
Pla
stic
= 75
DM
ater
ical
bac
kup
supp
lier
Qu
alit
yH
ardn
ess
of M
etal
= 15
0HB
Har
dnes
s of
pla
stic
con
trol
> 7
0 D
Har
dnes
s of
Met
al=
130H
B
Thic
knes
s of
Pla
stic
=1.3
mm
Thic
knes
s of
pla
stic
con
trol
>1.
3 m
mTh
ickn
ess
of P
last
ic=1
.5 m
m
Thic
knes
s of
Met
al=1
.3m
mM
ater
ial (
met
al) a
mou
nt o
f Par
t No.
2=
550
gTh
ickn
ess
of M
etal
=1.8
mm
No.
Of p
arts
=25
Uni
tet
c…N
o. O
f par
ts=2
0 U
nit
Des
ign
Mod
ellin
g co
st=
3200
€M
ater
ial o
f pla
stic
cos
t= 1
000-
1100
€D
esig
n M
odel
ling
cost
= 30
00 €
Risk
cos
t bac
kup
Cos
tD
esig
n La
bor c
ost =
510
0 €
Mat
eria
l of m
etal
cos
t= 1
100-
120
0€D
esig
n La
bor c
ost =
500
0 €
Man
ufac
turi
ng m
ater
ial c
ost=
2500
€La
bor c
ost <
620
0 €
Man
ufac
turi
ng m
ater
ial c
ost=
2300
€
Man
ufac
turi
ng L
abou
r cos
t = 3
200€
Mod
el c
ost <
320
0 €
Man
ufac
turi
ng L
abou
r cos
t = 3
000€
Des
ign
tim
e= 3
5 D
1. D
esgi
n m
odel
ing
tim
e be
twee
n 20
-25
DD
esig
n ti
me=
30
DBu
ffer
tim
e ba
ckup
Tim
eM
anuf
actu
ring
tim
e= 1
2D2.
Mod
el te
st ti
me
betw
een
5-10
DM
anuf
actu
ring
tim
e= 1
0 D
3. M
anuf
actu
ring
set
up
tim
e be
twee
n 1-
2 D
4. M
anuf
actu
ring
ope
rate
tim
e 8-
9 D
T
able
18:
SIP
OC
dia
gra
m f
or
Opti
on 2

74
5.3 FMEA model
The risk problems from the result of interviews and surveys in the SIT project could be list out
as following:
#1: Seldom identify the risks
#2: Seldom estimate the risks
#3: Receive the risks from Sales phase, however, not dealing with them properly
Current tools used for the risk identification and control are
Risk Matrix: is a brainstorming with the team members during the PACT.
PACT: is an internal workshop (usually used in the level C project in steam turbine, while
this method in gas turbine is optional) and held after 5-6 weeks of handover. The group
members need to read the contracts and prepare ten issues before PACT and the structure,
planning, charter, risk and opportunity, stakeholder, schedule and communication process
would be discussed during the pact. Result of contract reading, lessons learned.
Clamato: is a database that the customer claims located in.
5.3.1 FMEA model in SIT
- Why
Based on the situation in SIT, the tool that we suggest to use is the cost-expected FMEA
model. The major objectives of using FMEA are to identify failure, prioritize the failure
mode and reduce risk. Two numbers are important in the FMEA model; these are RPN
(Risk Priority Number) and expected cost. RPN is based on the occurrence, severity and
detection and expect cost is based on the probability and the cost for failure modes. Both
of them can give the criteria to prioritize the risk. This can facilitate to make decision
through more comprehensive consideration from different perspective.
- when
The FMEA can be done during the detailed planning phase, which is between PM100 and
PM200. Usually the failure identification is performed by project manager, with the

75
checklist of the previous risks and the experience. The project members can make some
additions if some vital risks are missing. The value for the occurrence, severity and
detection are estimated based on the experience, and the deviation can be large easily. To
minimize the deviation, the value can be decided after the discussion of the whole project
team and the approval of the project manager.
Figure 20: FMEA in the process map of SIT
- How
Identify the functions, all the possible failure modes for each function, the causes for
each failure mode and the local effects on the product, user and systems. This results in
two diagrams of product and process.
Estimate the occurrence, severity and detection, based on the causes and local effects of
all the scenarios. Estimate the cost for each scenario and the probability of the scenario
identified.
Calculate the PRN and the expected cost. RPN = Occurrence × Severity × Detection,
Expected cost = Probability × cost.
Place the result of RPN and expected cost in ascending order. If cost budget is tight, the
expected cost number can be the criteria to depend on. If the quality of the project is
more important, the emphasis can be spent on the risk priority number.

76
5.3.2 Implementing FMEA model
The case of hair dryer will be used to exemplify FMEA in this chapter. The FMEA are divided
into product FMEA and process FMEA, and the aim is to make the failure mode analysis both
for the product and process failure modes. The two diagrams are shown in Table 19 and Table 20.
Detailed descriptions of analysis process are stated below.
Product FMEA
Two functions were randomly picked as the simple examples of the hair dryer product, which are
converting electricity to rotation and heating the air. Based on the two functions, 7 scenarios
were identified from the possible failure modes and the potential causes of the failure.
For function of converting electricity to rotation, there were two potential failure modes, no
rotation and low rotation. Three causes exist for no rotation, which are power failure, motor
failure and obstruction impeding the rotor and two causes are listed out for low rotation, which
are rotor/stator misalignment and friction increasing. The function of heating the wind can have
no heating and low heating failure modes with the causes of heater failure and thermal resistance.
The value for each item is according to the experience and the criteria of O, S, and D. The
occurrence number is the frequency of the scenario. The severity numbers were estimated based
on the local/end effects. The detect number is the chance to find this failure. The probability was
calculated from the occurrence. It changes the occurrence numbers into decimal numbers. The
cost can be the value for the whole failure scenario. The final step is to use the equations of
expected cost and RPN mentioned before and to multiply the probability with cost and multiply
occurrence, severity and detection. The product FMEA table is shown in Table 19.

77
Pro
du
ct
FM
EA
S
cen
ari
o
Fu
nct
ion
/
Requ
irem
e
nt
Po
ten
tia
l
Fa
ilu
re
Mo
des
Po
ten
tia
l
Ca
use
s o
f
Fa
ilu
re
Probability
Occurrence
Lo
cal
Eff
ect
s /E
nd
Eff
ect
s o
n
Pro
du
ct,
Use
r,
Oth
er
Sy
stem
s
Cost (SEK)
Severity
Detection
exp. Cost
RPN
1
con
vert
ele
ctri
ty t
o
rota
tio
n
No
rota
tio
nM
oto
r fa
ilu
re0
.00
16
No
en
erg
y
tra
nfo
rma
tio
n3
08
40
.03
19
2
2
con
vert
ele
ctri
ty t
o
rota
tio
n
No
rota
tio
n
Po
we
r
fail
ure
0.0
01
6N
o a
ir f
low
70
95
0.0
72
70
3
con
vert
ele
ctri
city
to r
ota
tio
n
No
rota
tio
n
Ob
str
uct
ion
imp
ed
ing
the
ro
tor
0.0
00
14
Mo
tor
ove
rhe
ate
d2
59
10
.00
25
36
4
con
vert
ele
ctri
city
to r
ota
tio
n
Low
rota
tio
n
Ro
tor/
sta
tor
mis
ali
gn
me
n
t0
.01
8
No
ise
ge
ne
rati
on
30
21
0.3
16
5
con
vert
he
at
to
rota
tio
n
Low
rota
tio
n
Fri
ctio
n
incr
ea
sin
g0
.11
0Lo
w e
ffic
ien
cy2
03
12
30
6
He
ati
ng
the
win
d
No
he
ati
ng
He
ate
r
fail
ure
0.0
01
6N
o h
ea
tin
g w
ind
15
66
0.0
15
21
6
7
He
ati
ng
the
win
d
Low
he
ati
ng
He
ate
r
the
rma
l
res
ista
nce
0
.01
8
No
ad
jus
tab
le
he
ati
ng
win
d1
53
40
.15
96
Tab
le 1
9:
Pro
duct
FM
EA

78
Process FMEA
Six functions were picked for the process of FMEA, which are phasing the material, dispatch the
material, manufacturing, delivery and warranty. 9 scenarios were identified from the possible
failure modes and the potential causes of the failure based on the six functions.
For function of phasing the material, there were two potential failure modes, wrong material and
not qualified material. Two causes can be the wrong order and not properly chosen suppliers. If
the material dispatch has some problems, the material won't be on site. The main reason for this
can be not clear responsibility for the dispatching. Thus the effects of failure in material dispatch
can be lack of resources to produce, and the whole manufacturing process can not start. The
manufacturing failure modes are the scenarios of the defective product and machine broken
down. This can cause the quality problems and production stop. The material failure can have
high severity. The transportation has the delivery wrong and late. No inspection before transport
and using the wrong transporting way can cause both customer dissatisfaction and product return.
If no warranty service or inappropriate or deficient warranty is provided in the after - sale service,
the customer requirements can't be met and this can cause the customer dissatisfaction of the
product as result.
The value for each item is according the same criteria as in the product FMEA analysis. The
process FMEA table is shown in Table 20:

79
Pro
cess F
ME
A
Scen
ario
Fu
ncti
on
/
Requ
irem
en
t
Pote
nti
al
Fail
ure M
odes
Pote
nti
al
Cau
ses
of
Fail
ure
Probability
Occurrence
Local
Eff
ects
/En
d
Eff
ects
on
Produ
ct,
User,
Oth
er
Cost (SEK)
Severity
Detection
exp. Cost
RPN
1
Pu
rch
as
ing
the
ma
teri
al
Wro
ng
ma
teri
al
wro
ng
ord
er
0.0
00
01
2
Ne
w
ma
teri
al
ne
ed
ed
pu
rch
as
ed
50
00
96
0.0
51
08
2
Pu
rch
as
ing
the
ma
teri
al
No
t q
ua
lifi
ed
ma
teri
al
Su
pp
lie
r n
ot
we
ll
cho
se
n0
.00
16
Low
qu
ali
ty
pro
du
cts
40
00
62
47
2
3
Dis
pa
tch
th
e
ma
teri
al
Ma
teri
al
no
t
on
sit
e
Un
cle
ar
res
po
sib
ilit
y fo
r
dis
pa
tch
0.0
00
14
Re
so
urc
e
no
t re
ad
y5
00
04
40
.56
4
4
Ma
nu
fact
uri
ng
De
fect
ive
pro
du
ct
Ma
chin
e
op
ert
aio
n
pro
ble
ms
0.0
18
Low
qu
ali
ty6
00
42
66
4
5
Ma
nu
fact
uri
ng
Ma
chin
e
fail
ure
Ma
chin
e b
rok
en
do
wn
0.0
00
01
2
Pro
du
ctio
n
stu
p1
00
00
84
0.1
64
6
Pro
du
ct
de
live
ryD
eli
very
la
te
Wro
ng
tra
ns
po
rta
ion
wa
ys0
.00
00
12
Cu
sto
me
r
dis
sa
tis
fa
ctio
n
30
05
20
.00
32
0
7
Pro
du
ct
de
live
ryD
eli
very
wro
ng
No
in
sp
ect
ion
of
pro
du
ct0
.01
8
Pro
du
ct
retu
rne
d4
00
91
47
2
8W
arr
an
tyN
o w
arr
an
ty
No
re
sp
on
sib
le
con
tact
0.0
00
14
Cu
sto
me
r
dis
sa
tis
fa
ctio
n
20
02
20
.02
16
9W
arr
an
ty
Wa
rra
nty
no
t
we
ll p
rovi
de
d
Se
rvic
e n
ot
me
eti
ng
cu
sto
me
r
req
uir
me
nts
0.0
18
Cu
sto
me
r
dis
sa
tis
fa
ctio
n
10
04
21
64
Tab
le 2
0:
Pro
cess
FM
EA

80
Ascending sort of the RPN number
The final results of the two important variables which are expected cost and RPN are used for
prioritizing the risks. Thus ascending sort or descending sort of one variable is necessary for
clear vision of the trend for another variable. In this example, ascending of the RPN numbers
was made. The focus on RPN and the value of RPN is used as the indicator to prioritize the risk.
The expected-cost value is another aspect for consideration. Keep an eye on the damage cost
besides the occurrence, severity and detection numbers. The table after ascending sort of RPN
number is shown in Table 21.
Table 21: FMEA result with RPN in increasing order
Result analysis
After sorting the RPN number in ascending order, a histogram combined with points chart was
generated in Figure 21 and Figure 22. For the product RPN, scenario 7 is larger that scenario 5
while expected cost scenario 5 is more than scenario 7. Making the decision based on different
Product FMEA
Scenario exp
. C
ost
RP
N
4 0.3 16
5 2 30
3 0.0025 36
7 0.15 96
1 0.03 192
6 0.015 216
2 0.07 270
Process FMEA
Scenario exp
. Cos
t
RP
N
8 0.02 16
6 0.003 20
3 0.5 64
4 6 64
5 0.1 64
9 1 64
2 4 72
7 4 72
1 0.05 108

81
perspectives can facilitate the risk priority. If the budget of the project is tight, it is necessary to
take actions to avoid the high cost risk happening.
Figure 21: Product FMEA result
Figure 22: Process FMEA result
0
0.5
1
1.5
2
2.5
0
50
100
150
200
250
300
4 5 3 7 1 6 2
Exp
ect
ed
co
st
RP
N n
um
be
r
Scenario number
Product FMEA
exp. Cost
RPN
0
1
2
3
4
5
6
7
0
20
40
60
80
100
120
8 6 3 4 5 9 2 7 1
Exp
ect
Co
st
RP
N n
um
be
r
Scenario
Process FMEA
exp. Cost
RPN

82
5.4 Model of dealing with the Time and Cost problems
Unlike the unclear scoping problem, customer satisfaction problem, and the cost problem, the
last two problems which are Time and Cost problems are much tougher and trickier to be
handled. The controlling of time and cost is running through the whole life-time of the project.
It is a systematic approach which requires great efforts and collaboration from many different
departments and cross-functional teams within the company. When a tiny part of schedule or
expenditure has been changed; it may lead to a larger part of change such as rescheduling the
rest of the timeline and re-estimating the production cost. Due to its complexity, we do not
think it is feasible or efficient for the project teams to use some specific and simple Six Sigma
tools to improve the current time and cost management situation in Siemens. For instance,
control chart is an appropriate Six Sigma tool monitoring and controlling the cost change.
However, it is relatively complicated which needs the users to be well trained. It would require
more efforts from more expertise personnel and more budgets.
In our point of view, we suggest that the Six Sigma expertise and professionals should be
involved into early phase of the project planning. In SIT, the project teams conduct the PACT
in the planning phase. PACT is the Project Acceleration via Coaching and Teamwork. It is not
just a tool; instead, it is more like a method or approach with the workshop meetings. During
the meetings, the project teams do: project planning, target identification, making project chart,
risk assessment, stakeholder analysis, communication and organizational chart, project process
and lessons learned. PACT is mandatory for level A and B projects in G.T and SOL
department, and level C project in S.T department.
Our recommendation is that Six Sigma expertise should be involved in the early planning phase
of the project by participating in the PACT. Thus, Six Sigma expertise will acquaint the
detailed knowledge of the project which will facilitate them to find the root causes of the
problems whenever the time and cost are out of control or have the tendency of losing control.
These expertise need to monitor and control the time and cost issues throughout the whole
project. Whenever they feel the process is losing control, the Six Sigma expertise will use their
experiences and knowledge to intervene, looking for the root causes of the process and product
fault, identifying them, and eventually eliminating them, to make the process and product go
back on track once again.

83
Figure 23 below is the general process of the Six Sigma expertise involved in the project in the
Detailed Planning phase to monitor and manage the cost and time issues.
Figure 23: Model of Six Sigma expertise involved in the project to control the time and cost
We also provide the simplified control chart which we think it may be used in some small or
less complex projects. This kind of project we define as:
Similar projects as the teams have conducted. The general model of the previous project is
still applies for the on-going projects. The level of difference of considerably low.
Projects with low risks, low level of technological innovation.
In this kind of projects, it may not be necessary for the Six Sigma expertise to be involved. The
project team can use this simplified control chart to control the cost. In order to have a clearer
picture about how this chart works, we generate an easy example for the explanations.
Due to the facts that we have signed the confidentiality agreement with SIT, we cannot use the
actual data from projects in SIT as our example. The table below is the fabricated data of cost
which we generated. In the first row, we list the initial cost from Month 1, Year 1 to Month 12,
Year 1. The second row is the actual cost from Month 1, Year 1 to Month 12, Year 1. The third
Project Handover from sales
Detailed Planning
Acceptance
Id the problems
Project Control
Yes
No
Yes
QG1
QG2
Six Sigma expertise
involve
Time and cost
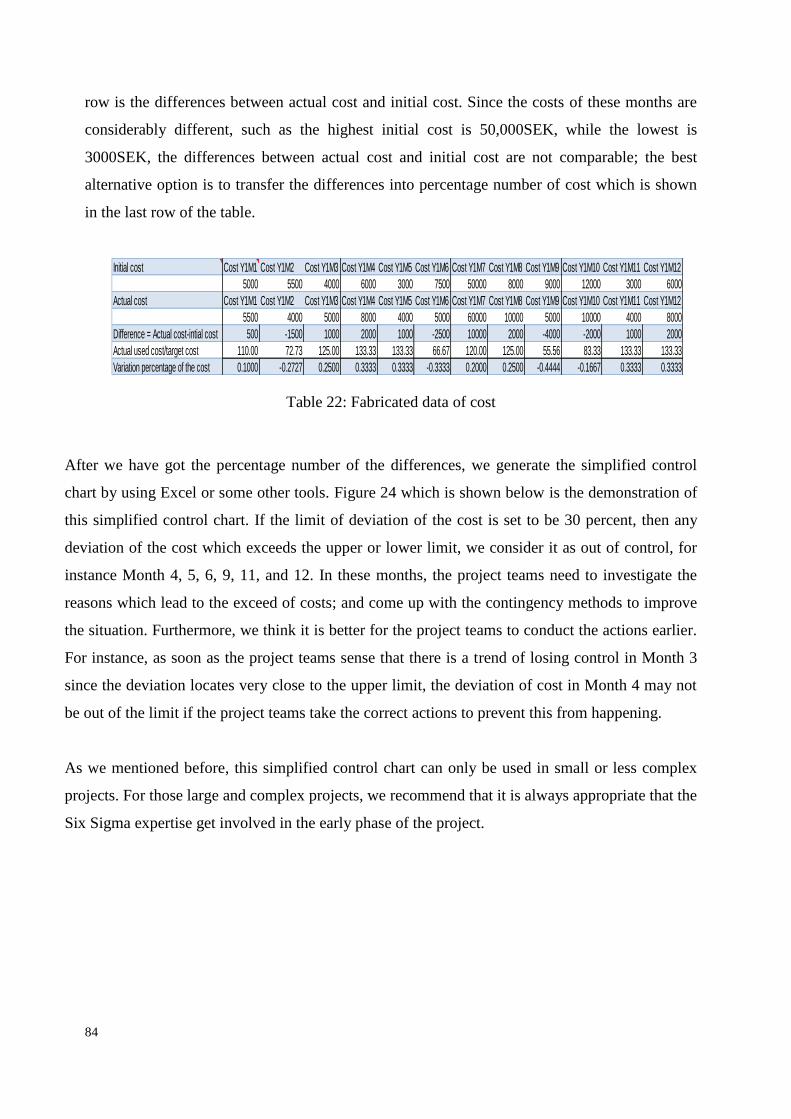
84
row is the differences between actual cost and initial cost. Since the costs of these months are
considerably different, such as the highest initial cost is 50,000SEK, while the lowest is
3000SEK, the differences between actual cost and initial cost are not comparable; the best
alternative option is to transfer the differences into percentage number of cost which is shown
in the last row of the table.
Table 22: Fabricated data of cost
After we have got the percentage number of the differences, we generate the simplified control
chart by using Excel or some other tools. Figure 24 which is shown below is the demonstration of
this simplified control chart. If the limit of deviation of the cost is set to be 30 percent, then any
deviation of the cost which exceeds the upper or lower limit, we consider it as out of control, for
instance Month 4, 5, 6, 9, 11, and 12. In these months, the project teams need to investigate the
reasons which lead to the exceed of costs; and come up with the contingency methods to improve
the situation. Furthermore, we think it is better for the project teams to conduct the actions earlier.
For instance, as soon as the project teams sense that there is a trend of losing control in Month 3
since the deviation locates very close to the upper limit, the deviation of cost in Month 4 may not
be out of the limit if the project teams take the correct actions to prevent this from happening.
As we mentioned before, this simplified control chart can only be used in small or less complex
projects. For those large and complex projects, we recommend that it is always appropriate that the
Six Sigma expertise get involved in the early phase of the project.
Initial cost Cost Y1M1 Cost Y1M2 Cost Y1M3 Cost Y1M4 Cost Y1M5 Cost Y1M6 Cost Y1M7 Cost Y1M8 Cost Y1M9 Cost Y1M10 Cost Y1M11 Cost Y1M12
5000 5500 4000 6000 3000 7500 50000 8000 9000 12000 3000 6000
Actual cost Cost Y1M1 Cost Y1M2 Cost Y1M3 Cost Y1M4 Cost Y1M5 Cost Y1M6 Cost Y1M7 Cost Y1M8 Cost Y1M9 Cost Y1M10 Cost Y1M11 Cost Y1M12
5500 4000 5000 8000 4000 5000 60000 10000 5000 10000 4000 8000
Difference = Actual cost-intial cost 500 -1500 1000 2000 1000 -2500 10000 2000 -4000 -2000 1000 2000
Actual used cost/target cost 110.00 72.73 125.00 133.33 133.33 66.67 120.00 125.00 55.56 83.33 133.33 133.33
Variation percentage of the cost 0.1000 -0.2727 0.2500 0.3333 0.3333 -0.3333 0.2000 0.2500 -0.4444 -0.1667 0.3333 0.3333

85
Figure 24: Simplified control chart based on the data from Table 22
-0.5000
-0.4000
-0.3000
-0.2000
-0.1000
0.0000
0.1000
0.2000
0.3000
0.4000
1 2 3 4 5 6 7 8 9 10 11 12
86
6 Chapter 6 Discussion
In today‟s business world, as the rapid growing of the global economy, most of the companies
have put their concentration not only on the innovation of the technology, but also on the
quality of the products (Porter, 2000). With the concept of Six Sigma that has been introduced
by Motorola, more and more manufacturing companies have implemented Six Sigma in their
process of production (Dahlgaard and Dahlgaard-Park, 2006).
Plenty of research and literatures have analyzed the Six Sigma projects and traditional project
management separately (e.g. Bertels and Strong, (2003)). However, the research on the
relationship between them or how to combine them is limited and doesn‟t provide enough
details (Sandholm and Sörqvist, 2002). Six Sigma project can bring the higher performance
with a higher quality level, while the corresponding cost of project is much higher (Bertels and
Strong, 2003). On the other hand, the traditional project management uses lower cost but the
quality and performance of the project cannot be guaranteed. This thesis‟s aim was combining
the two different management methodologies together, trying to provide a new managerial way
in which the performance and quality of the projects can be ensured, meanwhile the cost is
maintaining low. Through the empirical study, we focused on providing some specific Six
Sigma tools which can be integrated in the general process of the project management in SIT
Six Sigma is used as a tool for continuous improvement in many large manufacturing and
producing companies (Sandholm and Sörqvist, 2002). One important part of the Six Sigma
methodology is using statistical methods to identify the problems, and find out the root causes,
and finally improve the whole performance. However, unlike the goods quality, the project
management performance is hard to measure.
In this thesis we presented three models to solve five problems of project management in
Siemens Industrial Turbomachinery AB. The three models are the VOC-CTQ-SIPOC model,
the FMEA model, the model of Six Sigma expertise. The five problems include unclear project
scoping, customer satisfaction problems, risk problems, cost problems and late and not
completed delivery. For the five problems in project management in SIT, each model can
facilitate to solve one or two problems (Figure 25).

87
Figure 25: Three models for five problems
The discussion of the proper implementation of these models will be made in this chapter. The
model shown in Figure 25 suggested the tools that are suitable for solving each problem.SIT
are proceeding to implement the model into several projects. While implementing the tools, it is
valuable to find the strength and weakness for each tool – to know what can be implemented
well and what can be improved for the future.
6.1 Pros and Cons of Six Sigma tools suggested
During our research and analysis, we have found that there were some strength and weaknesses
of the recommended tools which we have listed out in Table 23.
The upside of QFD is that it is a quantitative tool which can be used for measuring the VOC in
a more accurate way. Based on the quantitative data that QFD provides, the project team can
better understand the customers‟ real needs. Furthermore, QFD is a step-by-step method which
facilitates the users to track the process finding out the error once the process has gone to the
wrong direction. As for the disadvantages of QFD, it is more complicated than any other tools,
and there are lots of calculations need to be done by the project teams.
Another tool that we suggested was CTQ. The advantage is that through the process of CTQ,
the project team can identify the critical points which are vital to the product or process, so that
the project teams can put their focus mainly on these critical points instead of covering up that

88
whole area. However, as the projects progress, some less important points to the product or
process which are often ignored by project teams may change into the critical points. If the
project teams still not put their focus on these points, it would jeopardize the project.
As for the strength of SIPOC, a clear project boundary can reach a common understanding of
the responsibility within the project teams; and also decrease the misunderstanding between the
members in the different functional units. The weakness of SIPOC is that it would get very
complex when the project is big, because too much data needs to be input into the chart of
SIPOC.
We see two advantages of FMEA. The risk identification method has taken RPN and expected
cost into consideration, so that the risk prioritization is more seasonable than the old ways.
Also, FMEA has different failure modes for the same function, which make the estimation
more precise. However, if the user is lacking experience, it could easily miss the failure mode.
Tool Strength
Weakness
QFD
(Quality Function
Deployment)
1. Quantitative tool, measuring
the VOC in a more accurate
way.
2. Understand the customer needs
properly
3. Step-by-step method, facilitate
the users to track the process.
1. More complicate than other tools,
lots of data collection and
calculations have to be done
CTQ
(Critical to
Quality)
1. Visualize the points about what
is vital to the Quality.
2. Guide the right direction of the
project.
1. Easy to have a tendency of making
the team ignores some less
important points.
2. Over time and under some specific
circumstances, these less important
points will become to the CTQs.
SIPOC
(Supplier, Input
Process, Output,
Customer)
1. Reach a common
understanding of the project
within the project team.
2. Decrease the misunderstanding
between the members with
different functions
3. Continuous feedback loops
with the customer and supplier
1. Confidentiality can be a big
problem; to what extent should the
company have the feedback
internally and externally.
2. If the project is too big, it would be
very complex with the SIPOC data
input.

89
FMEA
(Failure Mode
Effect Analysis)
1. Combined RPN and expected
cost to prioritize the risk
2. Have different failure modes
for the same function, which
make the estimation more
precise.
1. The number of scenarios can be
large if the functions are described
too detailed.
2. Could easily missed the failure
mode if lack of experience.
Table 23: Strength and weakness for each tool
6.2 Remarks of Six Sigma tools usage
Based on the strengths and weaknesses identified, each recommendation should be made
individually. In table 24, the underlying causes for the weakness can be found and some
suggestions were made to avoid these weaknesses. The remarks for each model are also listed
out in Table 24. Each model is not just using one or two specific tools; it is more about how to
combine these tools with the project team and project execution.
For implementing these models and methods into several SIT project, we have generalized
several remarks which the project teams should keep in mind. For example, the model of VOC-
CTQ-SIPOC should be integrated in the general process of PM in SIT. Since QFD is more
complex than any other tools, the quality manager in the project needs to be trained in this tool.
CTQ must be updated and controlled so that if some of the less important points become
important, the project team member notice the change in the very first place. In order to avoid
that there are too much data input in the chart of SIPOC, the project team should just focus on
the major activities.
For FMEA, there are two remarks we should be aware of. First, the identification process is
different from the traditional one, so the project team should not miss the vital scenarios which
might be less important in the traditional process of FMEA. Second, the value for O, S, D and
cost are based on estimation, the project team should decrease the variation of estimation as
much as possible.
At last, for the involvement of Six Sigma expertise, we think it is important to let the Six Sigma
expertise involved in the projects in the very beginning of the execution phase. Furthermore, a
thorough and frequent communication between Six Sigma expertise and project teams is
needed.

90
Model Remarks
VOC—CTQ—SIPOC
1. The process need to be integrated in the general process of PM
in SIT.
2. Quality manager in project (QMiP) need to be trained the using
skills, especially QFD.
3. Quality manager in project (QMiP) need to control and update
the CTQ, in case it changes.
4. SIPOC should be focus on the major activities.
FMEA
1. Not missing the vital sceniros 2. The value for O, S, D and cost are based on estimation, the
team should decrease the variation of estimation as much as possible.
Involvement of Six Sigma
expertise
1. Six Sigma expertises should get involved in PM in the very early phase of project execution.
2. The communication between Six Sigma expertise and project teams can be frequent and thorough.
Table 24: Remarks for each model

91
7 Chapter 7: Conclusion
The purpose of this thesis is trying to make suggestions and recommendations for
improvements of the project management performance by using some specific Six Sigma tools
in SIT. In order to reach this purpose, we proposed three research questions. The first research
question was: based on the current situation and problems of project management in SIT, what
kind of Six Sigma tools can be recommended to improve the performance of project
management; the second research question mainly focused on the approaches of implement of
these tools; the third one concentrated on the advantages and disadvantages of these tools.
In the theoretical framework, we have done some literature reviews regarding to the knowledge
of Six Sigma and project management. In the Six Sigma section, we have reviewed the
development history of Six Sigma and a classic process model of Six Sigma which was called
DMAIC. According to these theories, we have gained the basic idea and concentration of Six
Sigma. In the project management section, we have reviewed some common understanding
knowledge such as the triple constraints, risk management as well as the communication issues.
In order to address the first research question properly, some empirical approaches have been
conducted.
1. Based on the theoretical study of Six Sigma and project management, we have developed the
survey which was aimed at identifying the current situation and problems of project
management in SIT. The survey was mainly divided into several sections: background
information of the respondents; questions about the project management which contained six
parts: cost, time, quality, customer satisfaction, risks and opportunities, and communication.
With the help of our supervisors, we distributed the survey to nine project managers from
three departments in SIT and received all of the answers.
2. According to the information we gathered from the surveys, we have conducted a series of
interviews with the same project managers who responded our surveys. The target of
conducting the interviews was to have a deeper understanding of the current PM situations
and problems in SIT.

92
3. After we have had the detailed knowledge and information regarding to the PM problems, we
started to analyze them and tried to recommend some proper Six Sigma tools aiming to
improve the current situation.
Dealing with the second research question, due to the facts that we have signed the
confidentiality agreement with SIT, we could not implement these Six Sigma tools into some
actual on-going projects. Thus, we have generated an easy understanding example to
demonstrate the implement approaches. We chose hair dryer as our product. Our target was to
improve the performance of project of redesign the hair dryer. We have developed three models
and methods for implementing these Six Sigma tools. The first model was called “VOC-CTQ-
SIPOC”, it was aimed for addressing the unclear project scoping problem and improve the
customer satisfaction; it contained four Six Sigma tools which were VOC, QFD, CTQ, and
SIPOC. The second one was actually only one tool: FMEA for dealing with the risk problems.
The last model was the involvement of Six Sigma expertise in order to have a total control of
the time and cost change.
As for the third research question, we have discussed the advantages and disadvantages of each
Six Sigma tool in the discussion chapter. We further posed some remarks regarding to usage
and implementation of these Six Sigma tools.
Finally, regarding to the limitation of this thesis, due to the fact that we have not received the
implementing-test feedbacks of the actual performance of these Six Sigma tools in the real
projects, we think that there might be some slight differences when integrating these tools into
the PM process in SIT. Therefore, it would need extra efforts to discuss about which tools are
appropriate and how they are going to be implemented. Additionally, this thesis only focuses
on addressing the specific problems which are occurring in SIT. However, the problems
occurring in SIT are concluded based on the traditional and classic knowledge of project
management, and they are, to some extent, happening in other companies as well. Still, further
research should be need for expanding the scope of implementation.

93
Reference list
1. Akao, Y., 1990. Quality Function Deployment, Productivity Press. Cambridge MA.
2. Antony, J. and Banuelas, R., 2002. Key ingredients for the effective implementation of
Six Sigma programme, Measuring Business Excellence, Vol. 6 pp. 20–27.
3. Automotive Industry Action Group, 1995. Potential Failure Modes and Effects
Analysis (FMEA). Reference Manual, Detroit, MI.
4. Berger, R. W., 2002. The Certified quality engineer handbook, Milwaukee, WI: ASQ
Quality Press.
5. Bertels, T. and Strong, L., 2003. Rath & Strong's Six Sigma Leadership Handbook. John
Wiley Blackwell.
6. Besterfield, D. H., Besterfield-Michna C., Besterfield G. H., 2003. Total quality
management. Prentice Hall.
7. Block and Frame, 2001. The project office: a key to managing projects effectively.
Financial World.
8. Borror C., 2008. The certified quality engineer handbook. ASQ Quality Press.
9. Breyfogle, F., 2003. Implementing six sigma: smarter solutions using statistical methods.
John Wiley and Sons.
10. Brue & Howes, 2005. The McGraw-Hill 36-hour course Six Sigma. McGraw-Hill
Professional. Competitive Advantage, Vol. 2, No. 4, pp. 404–428.
11. Choo, A.S., Linderman, K.W., and Schroeder, R.G., 2007a. Method and context
perspectives on learning and knowledge creation in quality management. Journal of
Operations Management, 25, 918–931.
12. Choo, A.S., Linderman, K.W., and Schroeder, R.G., 2007b. Method and psychological
effects on learning behaviors and knowledge creation in quality improvement projects.
Management Science, 53, 437–450.
13. Dahlgaard, J. J. and Dahlgaard-Park, S. M., 2006. Lean production, six sigma quality,
TQM and company culture, The TQM Magazine, Vol. 18 Iss: 3, pp.263 – 281.
14. Erick C. Jones, Mahour Mellat Parast, and Stephanie G. Adams, 2010. A framework for
effective Six Sigma implementation. Total quality management, Vol. 21, No. 4, April
2010, 415-424
15. El-Haik, B. and Roy, D. M., 2005. Service design for Six Sigma: A roadmap for
excellence. Willey Interscience Publication, Hoboken New Jersey.Forum Magazine, Vol.
2, pp. 17–22.

94
16. Geogre, M., 2003. Lean Six Sigma for Service: How to Use Lean Speed and Six Sigma
Quality to Improve Services and Transactions. McGraw-Hill; 1 edition.
17. Goldstein, M. D., 2001. Six Sigma program Success Factors, Six Sigma Forum
Magazine.
18. Gordon, J., 2007. The Pfeiffer Book of Successful Leadership Development Tools.
Pfeiffer publication.
19. Groves et al., 2009. Survey methodology. John Wiley&Sons, Inc, Hoboken, New Jersey.
20. Gubrium and Holstein, 2001. Handbook of interview research: context&method. Sage
publications Inc, California.
21. Gupta, P., 2004. Six Sigma Business Scorecard: Ensuring Performance for Profit.
McGraw-Hill
22. Harrington, H. J., 1991. Business process improvement: The breakthrough strategy for
total quality, productivity, and competitiveness. McGraw-Hill, New York.
23. Heldman, 2011. PMP Project Management Professional Exam Study Guide. John Wiley
& Sons, Inc., Indianapolis, Indiana.
24. Henderson, K. M. and Evans, J. R., 2000. Successful implementation of Six Sigma:
benchmarking General Electric Company, Benchmarking: An International Journal, Vol.
7.
25. Kendrick, T., 2009. Identifying and Managing Project Risk: Essential Tools for Failure-
Proofing your project. AMACOM, New York.
26. Klefsjö, B., Bergquist, B. and Edgeman, R.L., 2003. „Six Sigma and Total Quality
Management: different day, same soup?‟, Int. J. Six Sigma and Competitive Advantage,
pp.06.
27. Kmenta & Ishii, 2000, Scenario-Based FMEA: A Life Cycle Cost Perspective. ASME,
Baltimore, Maryland.
28. Madu, C. N. and Kue, C., 1993. Introducing strategic quality management. Elsevier Ltd.,
Volume 26, Issue 6, Pages 121-131.
29. McDermott R. et al., 1996. The basics of FMEA, Productivity Press. McGraw-Hill
Professional.
30. Michalski W., 2003. Six Sigma Tool Navigator: the master guide for teams. Productivity
Press.
31. Molenaar et al., 2010. Guidebook on risk analysis tools and management practices to
control Transportation Project Costs. National Cooperative Highway Research Program.

95
32. Narula, 2006. Handbook of communication: models, perspectives, strategies. Nice
Printing Press, Delhi.
33. Palady, P., 1995. Failure Modes and Effects Analysis: Predicting & Preventing Problems
Before They Occur. PT Publications, West Palm Beach, FL.
34. Pande, P. S., Robert P., Neuman, Cavanagh R. R., 2002. The Six Sigma way team
fieldbook: an implementation guide for project improvement teams. McGraw-Hill
Professional.
35. Pande, P.S., Neuman, R.P. and Cavanagh, R.R., 2000. The Six Sigma Way: How GE,
Motorola and Other Top Companies are Honing Their Performance, New York.
36. Park, S. H., 2003. Six Sigma for Quality and Productivity Promotion. Asian Productivity
Organization.
37. Porter M. E., 2000. Location, Competition, and Economic Development: Local Clusters
in a Global Economy. Economic Development Quarterly, vol. 14 no. 1 15-34.
38. PMI, 2008. A Guide to the Project Management Body of Knowledge. Fourth Edition.
Project Management Institute, Upper Darby, PA.
39. Pyzdek, T., 2003. The Six Sigma Project Planner: A Step-by-Step to Leading a Six
Sigma Project Through DMAIC. McGraw-Hill Companies, Inc.
40. Rath & Strong and Thomas Bertels, 2003. Rath & Strong's six sigma leadership
handbook. New Jersey, John Wiley & Sons.
41. Sandholm, L., Sörqvist, L., 2002. 12 Requirements For Six Sigma Success, Six Sigma
forum magazine.
42. Schön, K., 2006. Implementing Six Sigma in a non-American culture. International
Journal of Six Sigma and Competitive Advantage 2006 - Vol. 2, No.4 pp. 404 - 428.
43. Schroeder, R.G, Linderman, K., Liedtke, C., and Choo, A.S., 2008. Six Sigma: Definition
and underlying theory. Journal of Operations Management, 26, 536–554.
44. Schwalbe K., 2008. Introduction to Project Management. College learning.
45. Shankar, R., 2009. Process improvement using Six Sigma: a DMAIC guide. ASQ Quality
Press.
46. Smith et al., 2008. Enlisting Lean Six Sigma in the Army Acquisition Process. Defense
AT&L.

96
47. Snee, R. D., and Hoerl, R. W., 2002. Leading Six Sigma: A Step-by-Step Guide Based on
Experience with GE and Other Six Sigma Companies. Financial Times Prentice Hall.
48. Soleimannejed,F., 2004. Six Sigma, Basic Steps & Implementation. Author House.
49. Speegle, M., 2009. Quality Concepts for the Process Industry. Second Edition. Cengage
Learning.
50. Srikantaiah et al., 2010. Convergence of Project Management and Knowledge
Management. Scarecrow Press.
51. Stamatis D., 2003. Failure mode and effect analysis: FMEA from theory to execution.
ASQ Quality Press.
52. Stewart, G., Kock, C. D., Smit, M., Sproat, B., Storrie, G., 2007. Communicating for the
Professions. Mega Digital.
53. Thomsett, M. C., 2010. The Little Black Book of Project Management. Third Edition.
American Management Association
54. Tonnquist, B., 2008. Project management. Bonnier Utbildning.Vol. 1, pp. 36–45.
55. Vose, D., 2008. Risk analysis: a quantitative guide, 3rd edition. Risk media Ltd, France.
56. White, B., 2006. Using a Spec Document, the Customer Voice, and a QFD Matrix to
Generate a CTQ List. QFD Institute.
57. Wiklund, H. and Sandvik-Wiklund, P., 2002. Widening the Six Sigma concept: An
approachto improve organizational learning. Total Quality Management, vol. 13, no. 2, p
p. 233-239.
58. Yang, K., 2003. Design For Six Sigma: A Roadmap For Product Development. McGraw-
Hill Companies, Inc.
59. Zaval and Wagner, 2011. Project Manager Street Smarts: A Real World Guide to PMP
Skills. John Wiley & Sons, Inc., Indianapolis, Indiana

97
Appendix 1: Demonstration of the survey
Instructions
Hello!
We are master students from Linköping University and now writing our thesis
in Siemens Industrial Turbomachinery AB in Finspång. Our thesis topic is about
“How to improve the project management by using Six Sigma”. We would
like to give you some questions and those answers will be used as a proof in our
thesis.
Thank you!
Lin and Guannan
Part 1: General Information
1. Your division: _________________________
Your position: _________________________
2. Please rank the importance of these three aspects (Cost, Time, Quality and customer
satisfaction) during the project management. 1.___________;
2.___________;
3.___________;
4.___________
If the total amount is 100%, please specify each
Cost ____% Quality ____% Time_____% Customer Satisfaction __%
3. Was the six sigma project implemented before? Yes No
If yes, please give the percentage of the following results of Six Sigma implementation
in project management? (Total sum is 100%)
No effect _______%
Negative effect _______%
Small Improvement _______%
Significant Improvement________%
Part 2: Questions about project management
Notice: The options “0 1 2 3 4” stand for “Never Rarely Sometimes
Often Always”)
Cost
1. How often is the budget estimation correct?

98
0 1 2 3 4
2. How often do you have cost follow-up and review, including audition and control?
0 1 2 3 4
3. Please scale the frequency of the expenditure of budget
Overspending 0 1 2 3 4
Under spending 0 1 2 3 4
Appropriate spending 0 1 2 3 4
4. Name some factors which you think is causing the significant deviation from the budget
estimation:
5. How do you solve these problems?
Time
1. How often is a detailed schedule prepared which includes activities, activity duration estimation,
milestone and etc? (0:none-5:often)
0 1 2 3 4
2. Please scale the frequency of the project delivery time
Overdue 0 1 2 3 4
On time 0 1 2 3 4
Before deadline 0 1 2 3 4
3. Name some factors which you think is causing the significant deviation from the prepared
schedule:
4. How do you solve these problems?

99
Quality
Definition
• Quality planning involves identifying which quality standards are relevant to the project and preparing
plans that will satisfy the requirements.
• Quality control (QC) is the appraisal of specific project outcomes to determine if they comply with
quality requirements and taking corrective action if non-compliance is found.
• Quality assurance (QA) is the periodic review of actual project performance to ensure that quality
plans have been implemented and that quality procedures are being followed correctly. QA also
involves taking corrective action if non-compliance with established procedures is found or modifying
the quality plan if QC results show that it is inadequate.
1. How do you feel about the implementation situation of quality planning method?
Not satisfied Tolerate Neutral Satisfied
2. How do you feel about the implementation situation of QC method?
Not satisfied Tolerate Neutral Satisfied
3. How do you feel about the implementation situation of QA method?
Not satisfied Tolerate Neutral Satisfied
4. Typical quality problems happened most in SIT projects, including product and process quality:
Customer Satisfaction
1. How often are the following types of customer involvement happening in the projects
-Transactional 0 1 2 3 4
(Only in the early phrases, design for customer)
- Facilitative 0 1 2 3 4
(In the early and testing phrases and occasionally others, design with customer)
-Integrative 0 1 2 3 4
(In all phrases, design by the customers)

100
2. How often do you use the following methods for the Voice of Customer research?
-Open source method 0 1 2 3 4
-Focus groups / meetings 0 1 2 3 4
-Surveys 0 1 2 3 4
-Participation of customer in the development team 0 1 2 3 4
-Interviews 0 1 2 3 4
3. Please evaluate how often the following aspects cause the customer dissatisfaction.
- Meet the functional requirements 0 1 2 3 4
-Availability (deliver in time) 0 1 2 3 4
-Durability 0 1 2 3 4
-Innovativeness 0 1 2 3 4
-Prices worth the overall value 0 1 2 3 4
4. Typical problems that affect customer satisfaction:
Risk and Opportunities
Definition
Risk: events or uncertainties which may affect the project in a negative way.
1. How often is the risk identified during project planning phrase?
0 1 2 3 4
2. How often is the risk estimation during the execution? (quantitative method to measure the value
of the risks and prioritize them)
0 1 2 3 4
3. How often is the risk response plan prepared?
0 1 2 3 4
4. How often did the risk happen in the projects?
0 1 2 3 4
5. Name the risk which happened the most: __________________________________
6. Name the risk which had the significant impact: ____________________________
7. Tools which you currently use dealing with risk:______________________________
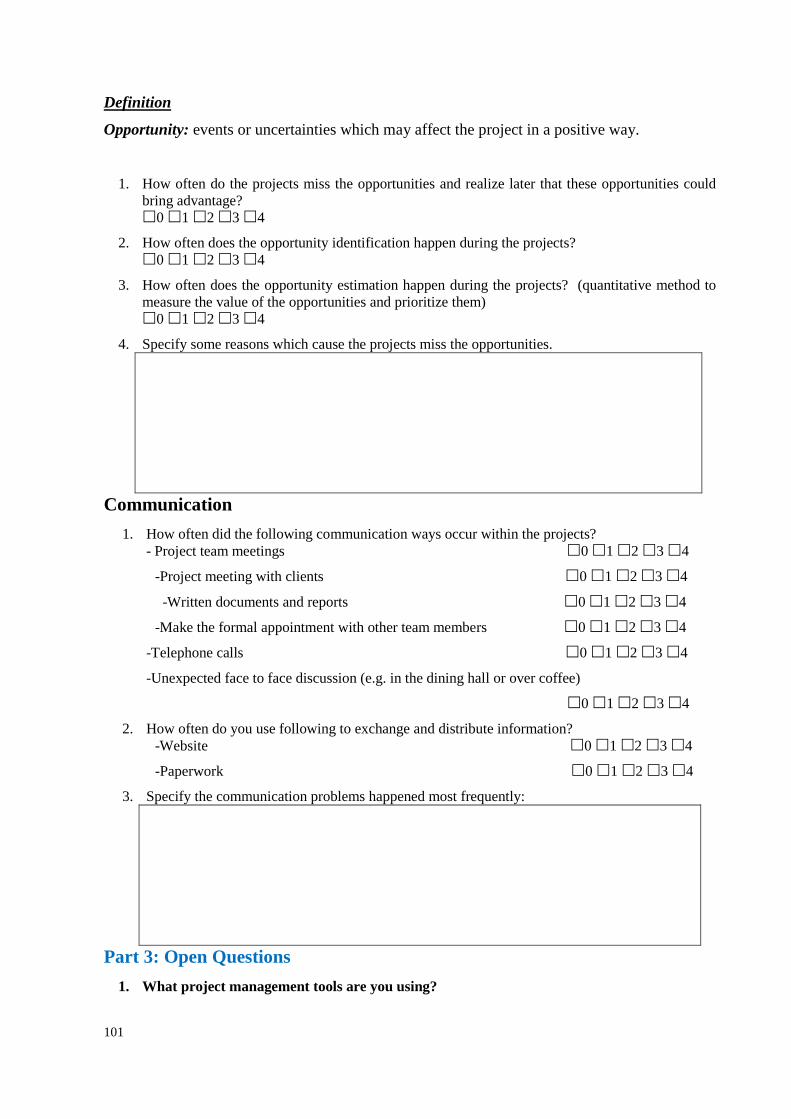
101
Definition
Opportunity: events or uncertainties which may affect the project in a positive way.
1. How often do the projects miss the opportunities and realize later that these opportunities could
bring advantage?
0 1 2 3 4
2. How often does the opportunity identification happen during the projects?
0 1 2 3 4
3. How often does the opportunity estimation happen during the projects? (quantitative method to
measure the value of the opportunities and prioritize them)
0 1 2 3 4
4. Specify some reasons which cause the projects miss the opportunities.
Communication
1. How often did the following communication ways occur within the projects?
- Project team meetings 0 1 2 3 4
-Project meeting with clients 0 1 2 3 4
-Written documents and reports 0 1 2 3 4
-Make the formal appointment with other team members 0 1 2 3 4
-Telephone calls 0 1 2 3 4
-Unexpected face to face discussion (e.g. in the dining hall or over coffee)
0 1 2 3 4
2. How often do you use following to exchange and distribute information?
-Website 0 1 2 3 4
-Paperwork 0 1 2 3 4
3. Specify the communication problems happened most frequently:
Part 3: Open Questions
1. What project management tools are you using?

102
2. Are there any other tools that would be useful? Any suggestions?
3. Do you know any six sigma tools that could be useful in project management?
4. Anything else you want to put forward/comment on?

103
Appendix 2: Example of the questions and answers of
interviews
Background questions
As we know there are four management levels in Siemens career Model, can you tell me
which level are you now? (Project director, senior PM, PM, project coordinator)
PM
Which level of the projects do you usually carry out? (A-F)
Most projects are level C, few are level B. The contracts are ranged between 10M-100M
Euro.
You usually in charge a whole project or just a part of the project, like the installation,
commissioning or other phrases in the project process?
The whole execution phase of the projects
From contact signing to the project closure (PM080-PM650). 6 projects ongoing, too many,
4 is perfect.
Cost
The survey indicates that you consider the cost is the most aspects among these four. However,
the projects have a low rate on the estimating cost correctly and spending budget appropriately
even if you follow-up and review the budget spending frequently. You mentioned some
reasons: wrong data input in the cost tools and limitation of time during the sales phase.
The questions are:
1. What kind of tools you are using?
Two stakeholders: management (interested in financial ) and customers (time and quality are
important aspects, cost is not so much important.)
Methods: receive project and budget received, follow up each quarter and month (if major
deviation). It works fairly well; there is buffer cost overrun – 90% of cost overrun is our
fault, 10% is from customers.
2. Are you satisfied with the performance of these tools? / Are these tools difficult to handle?
Improve: errors will be for sure
Always something missed in the sales phase;
Issues from purchasing: database can be improved. It is changing now.
3. What facts cause the wrong input data in these tools? Can it be avoid? How do you think?
Timing, hard to foresee the cost, these things can be accepted
Difficult to accept: budget changes for engineers working hours.
Due to the legislation problems, you mentioned a better feedback from old projects and
standardization will be helpful to solve these.
4. What actions have you used to improve the feedback already? Have these methods
documented, standardized, or quantified in order to have a better way to review? How?
Feedback: no official forum and documentation, no place for sharing information.
Most of the feedback is informal.
Have lesson learned database. Keep it simple because PMs do not have much time.
5. You have the comprehensive global program which is called PM@Siemens. It is used for
standardization and documentation. How do you think they are working in your projects?
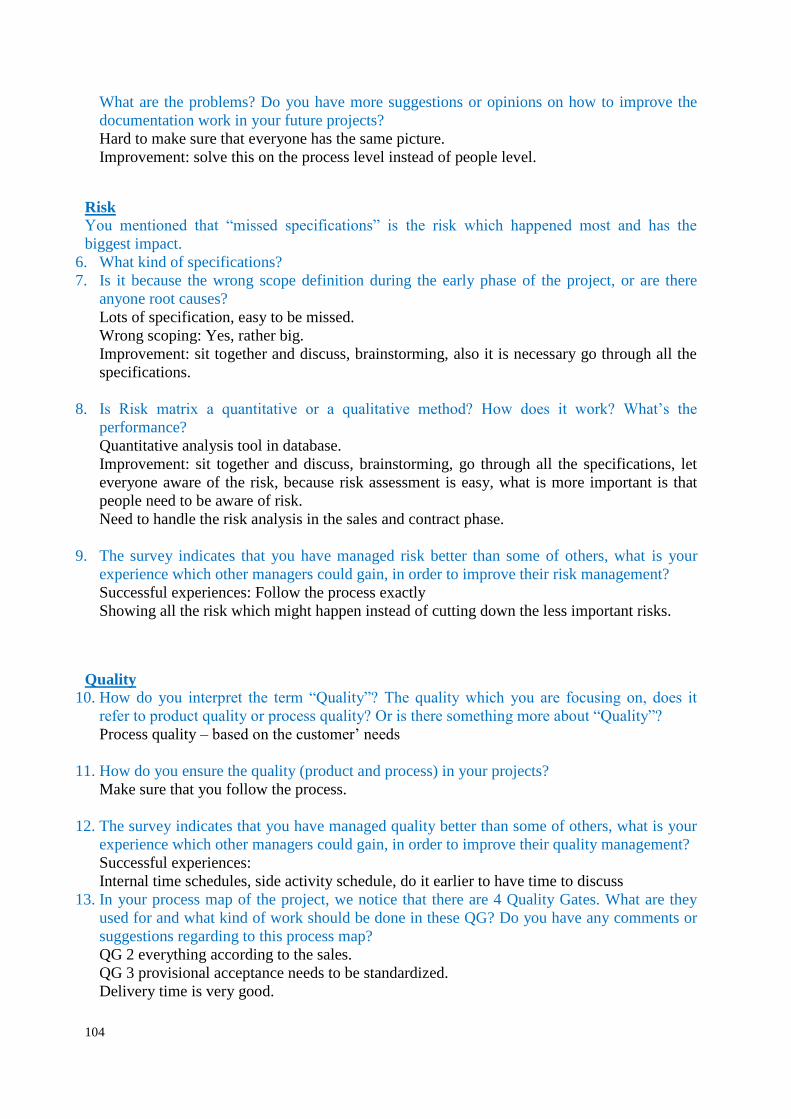
104
What are the problems? Do you have more suggestions or opinions on how to improve the
documentation work in your future projects?
Hard to make sure that everyone has the same picture.
Improvement: solve this on the process level instead of people level.
Risk
You mentioned that “missed specifications” is the risk which happened most and has the
biggest impact.
6. What kind of specifications?
7. Is it because the wrong scope definition during the early phase of the project, or are there
anyone root causes?
Lots of specification, easy to be missed.
Wrong scoping: Yes, rather big.
Improvement: sit together and discuss, brainstorming, also it is necessary go through all the
specifications.
8. Is Risk matrix a quantitative or a qualitative method? How does it work? What‟s the
performance?
Quantitative analysis tool in database.
Improvement: sit together and discuss, brainstorming, go through all the specifications, let
everyone aware of the risk, because risk assessment is easy, what is more important is that
people need to be aware of risk.
Need to handle the risk analysis in the sales and contract phase.
9. The survey indicates that you have managed risk better than some of others, what is your
experience which other managers could gain, in order to improve their risk management?
Successful experiences: Follow the process exactly
Showing all the risk which might happen instead of cutting down the less important risks.
Quality
10. How do you interpret the term “Quality”? The quality which you are focusing on, does it
refer to product quality or process quality? Or is there something more about “Quality”?
Process quality – based on the customer‟ needs
11. How do you ensure the quality (product and process) in your projects?
Make sure that you follow the process.
12. The survey indicates that you have managed quality better than some of others, what is your
experience which other managers could gain, in order to improve their quality management?
Successful experiences:
Internal time schedules, side activity schedule, do it earlier to have time to discuss
13. In your process map of the project, we notice that there are 4 Quality Gates. What are they
used for and what kind of work should be done in these QG? Do you have any comments or
suggestions regarding to this process map?
QG 2 everything according to the sales.
QG 3 provisional acceptance needs to be standardized.
Delivery time is very good.

105
Customer satisfaction
Due to the customer satisfaction, you mentioned that “slow engineering responses to customer”
was one problem which caused the customer dissatisfaction.
14. Have you had a principle or standardization regarding to the response time?
No standardized methods, but we are using “Three days policy”.
Increase the customer focus and awareness
15. What cause the late response? Can it be avoid? How?
16. Any other factors which cause the customer dissatisfaction? Such as: misunderstand the
needs of customers?
More communications can improve the misunderstanding
General comments and suggestions: customer needs and service can be quantified to know
them better. Also, customer surveys can help us know the customer better.
Communication (Back up question)
The survey shows that you have a high frequency of formal and informal communications; yet
you still mentioned the lack of communications is one of the problems.
17. What kind of communications do you think are lacking?
18. Is it the communications which are knowledge sharing through website and paperwork (low
rate in the survey)?


