
Hazardous Waste Data Assessment
Final Report
Department of Sustainability, Environment, Water, Population and Communities
April 2013
Project No. 5012.086

Hazardous Waste Data Assessment Final Report
Prepared for:
Department of Sustainability, Environment, Water, Population and Communities
Prepared by:
KMH Environmental
Level 4
180 Albert Road
South Melbourne VIC 3205
Phone: (03) 8640 6200
Fax: (02) 8008 1600
Document Control Log
Revision No. Amendment Date Prepared By Checked By Approved By
Rev0 Draft Report 21.12.2012 T Bloomfield G Latimer G Latimer
Rev1 Complete Draft 21.01.2013 T Bloomfield G Latimer G Latimer
Rev 2_0 Final Report 07.03.2013 G Latimer D Garner G Latimer
Rev 2_1 Revised Final Report 14.03.2013 G Latimer D Garner G Latimer
Rev 2_2 Revised Final Report after State/
Territory comments 22.04.2013 G Latimer G Latimer G Latimer
© KMH Environmental 2011
The information contained in this document produced by KMH Environmental is solely for the use of the Client identified on the
cover sheet for the purpose for which it has been prepared and KMH Environmental undertakes no duty to or accepts any
responsibility to any third party who may rely upon this document.
All rights reserved. No section or element of this document may be removed from this document, reproduced, electronically
stored or transmitted in any form without the written permission of KMH Environmental.

_____________________________________________________________________________________________________
5012.086—Hazardous Waste Data Assessment page i
TABLE OF CONTENTS
Glossary and Abbreviations ..................................................................................................................v
Executive Summary ........................................................................................................................... viii
1. Introduction ............................................................................................................................... 12
1.1. Purpose of this report 12
1.2. Report structure 13
1.3. Consultation 13
1.4. Background 13
2. Hazardous Waste Data Systems ............................................................................................. 16
2.1. Jurisdictional Data Collection and Reporting Arrangements 16
2.2. International reporting obligations 20
2.3. The Proximity Principle 20
3. Approach to data collection ..................................................................................................... 22
3.1. Official (Tracked) versus Non-tracked Hazardous Waste Streams 22
3.2. Data Collection 23
3.3. Assessment of Hazardous Waste Data Systems 24
4. Hazardous Waste Data Compilation and Assessment .......................................................... 25
4.1. New South Wales 25
4.2. Victoria 30
4.3. Queensland 35
4.4. Western Australia 39
4.5. South Australia 42
4.6. Tasmania 45
4.7. Australian Capital Territory Error! Bookmark not defined.
4.8. Northern Territory 51
4.9. Hazardous contamination of other waste streams 53
4.10. National Data Summary 59
5. Cost of Hazardous Waste Management .................................................................................. 63
5.1. New South Wales 66
5.2. Victoria 70
5.3. Queensland 71
5.4. Tasmania 74
5.5. South Australia 78

_____________________________________________________________________________________________________
5012.086—Hazardous Waste Data Assessment page ii
5.6. Western Australia 79
5.7. Australian Capital Territory 80
5.8. Northern Territory 81
6. Integration of Waste Data Systems ......................................................................................... 84
6.1. National Waste Management Sites Spatial Database 84
7. International Approaches to Hazardous Waste Data Collection and Reporting ................ 85
7.1. Europe 85
7.2. North America 87
7.3. Asia 87
FIGURES
Figure 1—Hazardous waste treatment/ disposal (New South Wales 2010–11) ................................... 26
Figure 2—Waste generated, imported and exported by NEPM category (New South Wales 2010–11)
....................................................................................................................................................... 28
Figure 3—Hazardous waste treatment/disposal (Victoria 2010–11) ..................................................... 31
Figure 4—‘N’ category wastes generated in Victoria ............................................................................ 30
Figure 5—Waste generated, imported and exported by NEPM category (Victoria 2010–11) .............. 34
Figure 6—Hazardous waste treatment/disposal Queensland 2010–11) .............................................. 35
Figure 7—Waste generated, imported and exported by NEPM category (Queensland 2010–11) ....... 38
Figure 8—Waste generated, imported and exported by NEPM category (Western Australia 2010–11)
....................................................................................................................................................... 41
Figure 9—Waste generated, imported and exported by NEPM category (South Australia 2010–11) .. 44
Figure 10—Waste generated, imported and exported by NEPM category (Australian Capital Territory
2010–11) ....................................................................................................................................... 50
Figure 11—New South Wales Household Hazardous Clean-Out waste composition summary (March
2003 to June 2011) ....................................................................................................................... 54
Figure 12—C&I waste composition based on audit of 195 Central Queensland businesses ............... 57
Figure 13—Hazardous waste generation by state and territory in 2010–11 (tracked/reported waste
data) .............................................................................................................................................. 59
Figure 14—Total tracked hazardous waste generation by waste category (national total 2010–11) ... 60
Figure 15—Hazardous waste treatment/disposal (national total 2010–11) .......................................... 60

_____________________________________________________________________________________________________
5012.086—Hazardous Waste Data Assessment page iii
Figure 16—Summary of hazardous waste management cost components across Australian states and
territories ........................................................................................................................................ 63
Figure 17—Hazardous waste generated per capita in Europe in 2008 by country/region (Eurostat
2012) ............................................................................................................................................. 86
TABLES
Table 1—Summary of jurisdictional NEPM implementation frameworks (NEPC 2009) ....................... 15
Table 2—Example of waste classification codes used in Western Australia ........................................ 18
Table 3—Waste tracking data summary NSW (2010–11) .................................................................... 27
Table 4—Prescribed industrial waste hazard categories ...................................................................... 32
Table 5—Waste tracking data summary Victoria (2010–11) ................................................................ 33
Table 6—Waste tracking data summary Queensland (2010–11) ......................................................... 37
Table 7—Waste tracking data summary Western Australia (2010–11) ................................................ 40
Table 8—Waste tracking data summary South Australia (2010–11) .................................................... 43
Table 9—Waste data summary Tasmania (2010–11) .......................................................................... 46
Table 10—Waste tracking data summary Australian Capital Territory Australian Capital Territory
(2010–11) ...................................................................................................................................... 49
Table 11—Waste data summary Northern Territory (2010–11) ............................................................ 52
Table 12—Hazardous wastes estimated in the MSW stream by NEPM waste category for each
jurisdiction ...................................................................................................................................... 55
Table 13—Total hazardous waste within the C&D waste stream by jurisdiction for 2008–09 (Hyder
2011) ............................................................................................................................................. 58
Table 14—Tracked and MSW derived hazardous waste generation (national total 2010–11) ............ 62
Table 15—Comparison of jurisdictional hazardous waste management costs .................................... 64
Table 16—Landfill levy rates in New South Wales ............................................................................... 66
Table 17—Method by which the New South Wales landfill levy is calculated and applied................... 66
Table 18—Extract from Schedule 1, New South Wales Protection of the Environment Operations
(General) Regulation 2009 ............................................................................................................ 68
Table 19—Victorian Prescribed Industrial Waste levies ....................................................................... 70
Table 20—EPA Victoria method for calculating Prescribed Waste Fees.............................................. 71

_____________________________________________________________________________________________________
5012.086—Hazardous Waste Data Assessment page iv
Table 21—Industry Waste Disposal Levies with regard to regulated waste management from
Queensland’s former Waste Reduction and Recycling Strategy 2010–20 ................................... 71
Table 22—Extract from Queensland Department of Environment and Heritage Protection Summary of
annual fees for environmentally relevant activities........................................................................ 73
Table 23—SIA 2008 Estimates of Disposal Costs for Controlled Waste in Tasmania ......................... 75
Table 24—South Australia waste disposal levies ................................................................................. 78
Table 25—Licence fee calculation method for waste transporter businesses in South Australia ........ 79
Table 26—Western Australia landfill levies ........................................................................................... 79
Table 27—Western Australia controlled waste licence/approval application fees ................................ 80
Table 28—Australian Capital Territory Waste Disposal Charges ......................................................... 80
Table 29—Australian Capital Territory Environment Authorisation Fees.............................................. 81
Table 30—Northern Territory Waste Management and Pollution Control Australian Capital Territory
Fees Payable................................................................................................................................. 83
APPENDICES
Appendix A—NEPM Hazardous Waste Categories
Appendix B—Tracked and Non-tracked Wastes by Jurisdiction

_____________________________________________________________________________________________________
5012.086—Hazardous Waste Data Assessment page v
Glossary and Abbreviations
Basel Convention The Basel Convention on the Control of Transboundary Movements
of Hazardous Wastes and their Disposal. The Convention puts an
onus on exporting countries to ensure that hazardous wastes are
managed in an environmentally sound manner in the country of
import.
C&D Construction and Demolition (waste)
C&I Commercial and Industrial (waste)
Companion report This report—the Hazardous Waste Data Summary—as a companion
to the Data Report.
Controlled Waste Waste that falls under the control of the Controlled Waste National
Environment Protection Measure. Generally equivalent to hazardous
waste, although definitional differences of the latter exist across
jurisdictions.
Controlled Waste NEPM National Environment Protection (Movement of Controlled Waste
between States and Territories) Measure
Data report Hazardous Waste Data Assessment
EfW Energy from Waste
Hazardous waste A hazardous waste, as defined in the Australian Government’s
National Waste Policy: Less waste, more resources (2009), is a
substance or object that exhibits hazardous characteristics, is no
longer fit for its intended use and requires disposal.
Hazardous waste means:
(a) waste prescribed by the regulations, where the waste has any of
the characteristics mentioned in Annex III to the Basel Convention; or
(b) wastes covered by paragraph 1(a) of Article 1 of the Basel
Convention; or
(c) household waste; or
(d) residues arising from the incineration of household waste; but
does not include wastes covered by paragraph 4 of Article 1 of the
Basel Convention.
Interstate data Data collected about hazardous waste generated in one jurisdiction
and treated in another, through cross-border transport under the
Controlled Waste NEPM.
Intrastate data Data collected about hazardous waste generated, transported and
treated within the one jurisdiction.
_____________________________________________________________________________________________________
5012.086—Hazardous Waste Data Assessment page vi
Liquid waste Any waste that:
(a) has an angle of repose of less than five degrees above horizontal, or
(b) becomes free-flowing at or below 60 degrees Celsius or when it is transported, or
(c) is generally not capable of being picked up by a spade or shovel.
MSW Municipal Solid Waste
NEPC National Environment Protection Council
NEPM
NOS
National Environment Protection Measure
Not otherwise specified
Non-tracked data Hazardous waste not collected under the arrangements of a formal
tracking system. This may include material with no arrangement for
any kind of tracking or measurement as well as material tracked,
measured, estimated or otherwise covered by parallel or shadow
systems.
Recovery of energy (from solid waste) is the process of recovering the energy that is
embodied in solid wastes. The amount of solid waste recovered by
recovery of energy processes is net of any materials recycled and/or
disposed.
Recycling A series of activities by which solid wastes are collected, sorted,
processed (including composting), and converted into raw materials
to be used in the production of new products.
Resource recovery The sum of materials sent to recycling and energy recovery facilities
minus contaminants/residual wastes sent to disposal. Resource
recovery = recycling + recovery of energy.
Reuse The use of products or materials for the same or a different purpose
without reprocessing or remanufacture. These products or materials
may also be repaired to extend their use.
Solid waste Any waste that:
(a) has an angle of repose of greater than five degrees above
horizontal, or
(b) does not become free-flowing at or below 60 degrees Celsius or
when it is transported, or
(c) is generally capable of being picked up by a spade or shovel.
Solid waste disposal Solid waste that is deposited in a landfill net of recovery of energy.
Tracked data Hazardous waste collected under the arrangements of a tracking
system.
Tracking system Jurisdiction-based hazardous waste tracking systems, which are in
place in New South Wales, Queensland, South Australia, Western
_____________________________________________________________________________________________________
5012.086—Hazardous Waste Data Assessment page vii
Australia and Victoria. These tracking systems can be either online,
paper-based, or a combination of both these mechanisms.
Treatment Treatment of waste is the removal, reduction or immobilisation of a
hazardous characteristic to enable the waste to be reused, recycled,
sent to an EfW facility or disposed.
Waste (For data collation purposes) is materials or products that are
unwanted or have been discarded, rejected or abandoned. Waste
includes materials or products that are recycled, converted to energy,
or disposed. Materials and products that are reused (for their original
or another purpose without reprocessing) are not solid waste
because they remain in use.
Waste Code Three-digit code typically used by jurisdictions to describe NEPM-
listed wastes. These are also referred to as ’NEPM codes’ although it
is noted that the actual codes do not appear in the NEPM itself.
Waste generation Typically, waste generation = resource recovery (recycling + energy
recovery) + disposal. For the purposes of this report however, waste
generation means what has been reported by jurisdictional data
providers as waste generation.
Waste reuse The reuse of a product or material that has entered a waste
management facility (e.g. the sale of goods from a landfill or transfer
station ‘tip shop’) for the same or a different purpose. These products
or materials may also be repaired to extend their use.
_____________________________________________________________________________________________________
5012.086—Hazardous Waste Data Assessment page viii
Executive Summary
To support work under the National Waste Policy, KMH Environmental Pty Ltd (KMH) was engaged by
The Department of Sustainability, Environment, Water, Population and Communities (DSEWPaC) to
produce a compilation of data and information on hazardous waste generation in Australia, including
the hazardous waste that crosses state, territory or national borders and hazardous waste that is
generated and remains within a single jurisdiction.
While data on the movement of hazardous waste between states has been available for many years,
historically little data has been collated and published on intra-state hazardous waste generation. This
report aims to address the current lack of public information on hazardous waste generated in states
and territories by providing a compilation of available data and information on hazardous waste
volumes in Australia. This report addresses the following:
the hazardous waste that is generated, transported, recovered, treated, recycled and disposed of,
by jurisdiction and nationally, for a common base year (2010–11), collected from both interstate
and intrastate hazardous waste tracking systems (tracked data)
an estimate of the hazardous content of mixed waste within the three waste streams used as
general categories in Australian waste data and reporting (MSW, C&I, C&D), referred to as
stream ‘contamination’, and the extent to which hazardous waste volumes are currently reported
within those waste streams
the hazardous waste management fees imposed across Australian jurisdictions.
The processes and systems for collecting waste data vary amongst the jurisdictions, often depending
on the waste type that is being measured. The majority of intrastate data is collected through
jurisdiction-based hazardous waste tracking systems, which are in place in New South Wales,
Queensland, South Australia, Western Australia and Victoria. These tracking systems can be either
online, paper-based, or a combination of both these mechanisms. The Australian Capital Territory, the
Northern Territory and Tasmania do not have tracking systems, although one is reportedly under
development in Tasmania (Hyder Liquid Waste Assessment 2012).
Since 1998–99, interstate data has been captured annually under the National Environment Protection
(Movement of Controlled Waste between States and Territories) Measure as varied 2010 (the
Controlled Waste NEPM) 1 and reported via its annual public report, while international data is
provided at the national level under the Basel Convention and centrally published by the Basel
Convention Secretariat in a similar manner.
This report sources hazardous waste data supplied by jurisdictional agencies from their ‘official’ waste
tracking systems, which are a combination of systems that track movements within jurisdictions (where
they exist) and systems for authorising and tracking interstate transport of hazardous waste. The
companion report—the Hazardous Waste Data Summary—attempts to address the limitations of this
data, by identifying key gaps and inconsistencies and filling these using data from other sources.
The other aspect of data compiled by this section, the identification of hazardous waste that is
generated from MSW, C&I and C&D sources, applies estimation methods based on publicly available
information and literature reports.
Hazardous waste data, compiled across Australia from both inter- and intrastate tracking systems, and
estimated to be contributed from the MSW stream, is detailed in Table E1.
1 Review of the National Environment Protection (Movement of Controlled Waste between States and
Territories) Measure, Discussion Paper, September 2009

_____________________________________________________________________________________________________
5012.086—Hazardous Waste Data Assessment page ix
Table E1—Tracked and MSW derived hazardous waste generation (national total 2010–11)
Hazardous Waste Classification Waste generated (tonnes)
Code Waste description Intrastate tracking systems
Interstate tracking systems
Total tracked
From MSW
Total (all tracked +
MSW)
% MSW of total
A Cyanides 7,917 35 7,952 0 7,952 0%
B Acids 37,165 11,996 49,162 37,073 86,234 43%
C Alkaline wastes 266,759 849 267,608 1,823 269,430 1%
D Inorganic chemicals 295,807 35,361 331,168 1,724 332,892 1%
E Reactive chemicals 1,462 8 1,470 20,820 22,290 93%
F Paints, lacquers, varnish, resins, inks, dyes, pigments, adhesives 44,441 3,917 48,358 166,535 214,893 77%
G Organic solvents, solvent residues 27,985 2,309 30,295 454 30,749 1%
H Pesticides (includes herbicides and insecticides) 2,606 1,294 3,901 5,552 9,453 59%
J Oils, hydrocarbons, emulsions 601,848 12,041 613,889 49,666 663,555 7%
K Putrescible/organic wastes 1,424,792 8,695 1,433,488 0 1,433,488 0%
L Industrial washwaters 88,698 7 88,705 0 88,705 0%
M Organic chemicals 18,553 1,603 20,156 453 20,609 2%
N Solid/sludge wastes requiring special handling 1,062,490 13,359 1,075,849 4,101 1,079,949 0%
R Clinical and pharmaceutical wastes 59,946 909 60,856 2,046 62,902 3%
T Miscellaneous 63,655 536 64,191 11,590 75,781 15%
Total
4,004,126 92,921 4,097,047 301,836 4,398,883 7%

_____________________________________________________________________________________________________
5012.086—Hazardous Waste Data Assessment page 10
A total of 4,398,883 tonnes of hazardous waste was generated in Australia in 2010–11 from:
jurisdictional intrastate tracking systems (4,004,126 tonnes)
jurisdictional interstate tracking systems (92,921 tonnes)
estimates from ‘contamination’ of the MSW stream (301,836 tonnes).
A total of 4,097,047 tonnes of hazardous waste was generated in 2010–11 from both
jurisdictional intrastate and interstate tracking systems, with only 2% of all tracked data coming
from interstate movements under the Controlled Waste NEPM. Figure E1 below shows how
hazardous waste generation was distributed across each state and territory.
Figure E1—Hazardous waste generation by jurisdiction in 2010–11 (tracked/reported waste data)
Given the relative populations2 of New South Wales (7,222,000), Victoria (5,540,000) and
Queensland (4,506,000), the latter jurisdiction’s large contribution appears unexpected relative to
the others. Similarly NSW appears surprisingly low. The Hazardous Waste Data Summary
report investigates this and other issues, fills major data gaps from non-tracked data sources and
re-casts these estimates of hazardous waste.
Figure E2 provides a breakdown of the total tracked hazardous waste generated in 2010–11 by
NEPM waste category.
Figure E2—Total tracked hazardous waste generation by waste category (national total 2010–11)
2 ABS, 2010

_____________________________________________________________________________________________________
5012.086—Hazardous Waste Data Assessment page 11
Data on the hazardous ‘contamination’ component of the commercial and industrial (C&I) waste
stream is limited to a couple of waste audit data sets, which capture a snapshot of waste from a
particular locality or industry sector. This is not considered to be strong enough evidence to
produce a robust estimate of the hazardous waste component of C&I waste that is not already
captured in waste tracking systems.
The hazardous component of construction and demolition (C&D) waste comprises contaminated
soils and asbestos in the main. It is noted that in those jurisdictions that classify these wastes as
hazardous they are captured within their tracking system, should they have one.
KMH’s estimate of hazardous waste in the municipal solid waste (MSW) stream of 301,836
tonnes corresponds to 7% of the combined total of tracked and MSW-contributed hazardous
waste (4,398,883 tonnes).
Figure E3 provides a breakdown of the method of treatment/disposal for the total tracked
hazardous waste generated in 2010–11. Due to the extensive gaps in treatment/disposal data—
for some jurisdictions there is no information available at the destination end—and the potential
for double-counting where wastes undergo primary treatment before secondary
treatment/disposal, it is difficult to draw broader conclusions on the treatment side of hazardous
waste at a national level.
Figure E3—Hazardous waste treatment/disposal (national total 2010–11)
_____________________________________________________________________________________________________
5012.086—Hazardous Waste Data Assessment page 12
1. Introduction
The Australian Government DSEWPaC is the lead Australian Government agency responsible
for the implementation of the National Waste Policy: Less waste, more resources (National
Waste Policy).
To support work under the National Waste Policy, KMH was engaged by DSEWPaC to produce
a compilation of data and information on hazardous waste generation in Australia, including the
hazardous waste that crosses state, territory or national borders and hazardous waste that is
generated and remains within a single jurisdiction.
1.1. Purpose of this report
Materials and products containing hazardous substances are found in all waste streams,
including municipal solid waste (MSW), commercial and industrial (C&I) waste, construction and
demolition (C&D) waste, as well as the ‘formal’ hazardous waste stream itself, which is captured
‘officially’ as part of state-based hazardous waste tracking systems.
There is currently a lack of public information on hazardous waste generated in states and
territories that is not transported across jurisdictional boundaries. Accurate and more
comprehensive data are needed to better quantify the level of hazardous waste generated in the
different waste streams and to inform the choice of appropriate strategies to manage the
hazardous waste.
This report aims to address this knowledge gap by providing a high-quality compilation of
available data and information on hazardous waste volumes in Australia which includes:
the hazardous waste that is generated, transported, recovered, treated, recycled and
disposed of, by jurisdiction and nationally, for a common base year
the materials composition of Australian flows of hazardous waste, including flows within a
jurisdiction, across jurisdictional boundaries and across national borders
the extent to which hazardous wastes are treated and recovered or disposed of close to
their point of generation
the hazardous content of mixed waste within the three waste streams used as general
categories in Australian waste data and reporting (MSW, C&I, C&D) and the extent to which
hazardous waste volumes are currently reported within those waste streams
the hazardous waste management fees imposed across Australian jurisdictions.
This report also provides a review of the hazardous waste data collection (tracking) systems
currently used by Australian jurisdictions to collect and report data on hazardous waste
generation, transport, recovery, treatment, recycling and disposal, and how these hazardous
waste data/systems could potentially be integrated with other data, such as the National Waste
Management Sites Spatial Database (refer to Section 6.1).
Approaches taken in other countries to national collection and disclosure of hazardous waste
data and information are also discussed.

_____________________________________________________________________________________________________
5012.086—Hazardous Waste Data Assessment page 13
1.2. Report structure
The report has been divided into the following sections:
hazardous waste data collection and reporting arrangements (Section 2)
the approach used in obtaining hazardous waste data and assessing the underlying
jurisdictional data systems (Section 3)
compilation and assessment of hazardous waste data (Section 4)
the cost of hazardous waste management (Section 5)
integration of hazardous waste data/ systems with other data (Section 6)
international approaches to hazardous waste data collection and reporting (Section 7).
1.3. Consultation
Consultation with several state and territory departments and agencies was essential in obtaining
the necessary data for this review and in gaining a thorough understanding of the hazardous
waste data systems operated in each jurisdiction. KMH would like to thank the following for their
valuable input and on this project:
Environment Protection Authority (EPA) New South Wales
EPA Victoria
Department of Environment and Heritage Protection (DEHP), Queensland
EPA Tasmania
Department of Environment and Conservation (DEC), Western Australia
EPA South Australia
Department of Land, Planning and Environment (DLPE), Northern Territory
Environment Protection and Water Regulation (EPWR), Australian Capital Territory
1.4. Background
An assessment of the existing jurisdictional waste data systems in Australia was conducted by
Net Balance in 2009. Whilst not directly focussed on hazardous waste, Net Balance reported the
following findings:
there is a general lack of support for national waste reporting
datasets suffer from inconsistent waste classification and terminology
problems exist with data collection
there is a limited understanding of waste’s life cycle impacts
there are problems with the alignment of national waste data reporting3.
Similarly, Hyder Consulting’s report on Waste Classifications in Australia (2011) has provided
background into the inconsistencies in waste classification approaches that currently exist
between jurisdictions. Whilst there is general consistency in the application of the Movement of
Controlled Waste NEPM, jurisdictional approaches can vary significantly, such that:
‘Even where jurisdictions adopt comparable approaches to classifications, different terms may
be applied to comparable wastes. For example, ‘hazardous waste’ is designated as ‘regulated
waste’ in Queensland, ‘listed waste’ in South Australia, ‘controlled waste’ in Tasmania and
Western Australia, and as ‘prescribed industrial waste’ in Victoria.’4
It was also found that jurisdictions varied in their use of classifications such that:
3 Net Balance 2009
4 Hyder 2011, Australian Waste Classifications – Roles in Decision Making

_____________________________________________________________________________________________________
5012.086—Hazardous Waste Data Assessment page 14
‘Victoria’s approach focuses primarily on prescribed industrial waste while Queensland’s
classifications serve primarily to drive wastes toward specific treatment paths.’4
1.4.1. National Environmental Protection Measure
The interstate movement of hazardous waste is regulated by the Controlled Waste NEPM. This
NEPM establishes a national protocol for tracking controlled waste and aims to ensure that
controlled wastes that are to be moved between states and territories are properly identified,
transported, and handled in ways that are consistent with environmentally sound practices.
The National Environment Protection Council (NEPC) produces an annual report on the
Controlled Waste NEPM containing a summary of the quantities of hazardous waste transported
between each of the states and territories. The NEPM categorises hazardous wastes into 75
different waste types which are summarised under 15 broader categories listed below. The 75
individual waste categories are also listed in Appendix A to this report.
By convention, states report on the 15 summary categories for NEPM reporting, however,
international reporting requirements under the Basel Convention requires data on 75 categories.
The 15 NEPM summary categories are as follows:
Plating and heat treatment (wastes from heat/surface treatment of metals and plastics,
including cyanides)
Acids (acidic solutions or acids in solid form)
Alkalis (basic solutions or bases in solid form)
Inorganic chemicals (e.g. waste containing heavy metals such as mercury, arsenic,
lead)
Reactive chemicals (waste containing peroxides other than hydrogen peroxide)
Paints, resins, inks, organic sludges (waste from the production, formulation and use
of inks, dyes, pigments, paints, lacquers and varnish, resins, latex, plasticisers, glues
and adhesives)
Organic solvents (e.g. ethers)
Pesticides (waste from the production, formulation and use of biocides,
phytopharmaceuticals and wood-preserving chemicals, and organic phosphorous
compounds)
Oils (includes waste oil/water, hydrocarbons/water mixtures or emulsions)
Putrescible/organic waste (animal effluent and residues, grease trap waste, sewage
sludge and residues, tannery wastes and wool scouring wastes)
Industrial wash water
Organic chemicals (includes phenols, organo halogen compounds, organic cyanides,
isocyanate compounds, surfactants)
Soil/sludge (includes contaminated soils, containers and drums, fire debris and wash
waters, fly ash, filter cake, asbestos)
Clinical & pharmaceutical (clinical wastes, waste pharmaceuticals)
Miscellaneous (includes waste from production, formulation and use of photographic
chemicals and processing materials, waste tyres and waste of an explosive nature not
subject to other legislation).
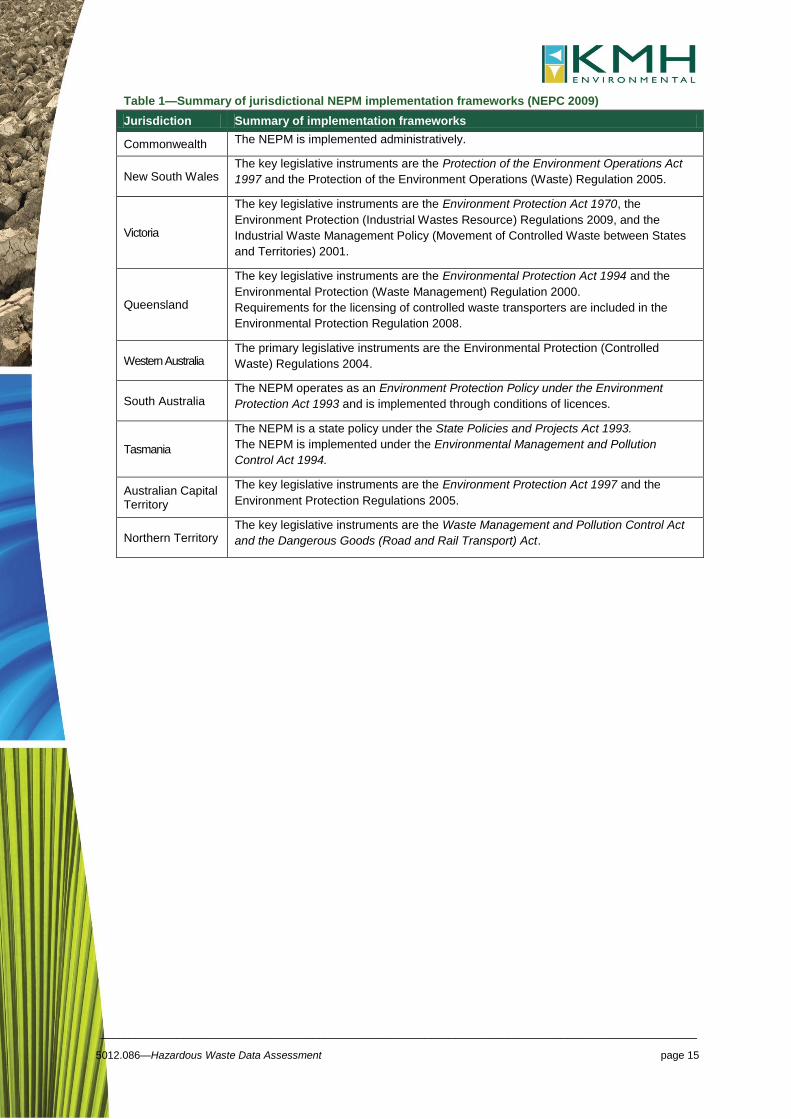
The means of implementation of the NEPM by each jurisdiction are shown in Table 1.
_____________________________________________________________________________________________________
5012.086—Hazardous Waste Data Assessment page 15
Table 1—Summary of jurisdictional NEPM implementation frameworks (NEPC 2009)
Jurisdiction Summary of implementation frameworks
Commonwealth The NEPM is implemented administratively.
New South Wales The key legislative instruments are the Protection of the Environment Operations Act
1997 and the Protection of the Environment Operations (Waste) Regulation 2005.
Victoria
The key legislative instruments are the Environment Protection Act 1970, the
Environment Protection (Industrial Wastes Resource) Regulations 2009, and the
Industrial Waste Management Policy (Movement of Controlled Waste between States
and Territories) 2001.
Queensland
The key legislative instruments are the Environmental Protection Act 1994 and the
Environmental Protection (Waste Management) Regulation 2000.
Requirements for the licensing of controlled waste transporters are included in the
Environmental Protection Regulation 2008.
Western Australia The primary legislative instruments are the Environmental Protection (Controlled
Waste) Regulations 2004.
South Australia The NEPM operates as an Environment Protection Policy under the Environment
Protection Act 1993 and is implemented through conditions of licences.
Tasmania
The NEPM is a state policy under the State Policies and Projects Act 1993.
The NEPM is implemented under the Environmental Management and Pollution
Control Act 1994.
Australian Capital Territory
The key legislative instruments are the Environment Protection Act 1997 and the
Environment Protection Regulations 2005.
Northern Territory The key legislative instruments are the Waste Management and Pollution Control Act
and the Dangerous Goods (Road and Rail Transport) Act.

_____________________________________________________________________________________________________
5012.086—Hazardous Waste Data Assessment page 16
2. Hazardous Waste Data Systems
This chapter of the report examines the current hazardous waste data collection systems used by
each Australian jurisdiction for recording data on the generation, movement (both within a
jurisdiction and across jurisdictional boundaries), treatment and disposal of hazardous wastes.
2.1. Jurisdictional Data Collection and Reporting Arrangements
The majority of intrastate data is collected through jurisdiction-based hazardous waste tracking
systems, which are in place in New South Wales, Queensland, South Australia, Western
Australia and Victoria. These tracking systems can be either online, paper-based, or a
combination of both these mechanisms. The Australian Capital Territory, the Northern Territory
and Tasmania do not have tracking systems, although one is reportedly under development in
Tasmania (Hyder Liquid Waste Assessment 2012).
Since 1998-99, interstate data has been captured annually under the Controlled Waste NEPM
and reported via their annual public report, while international data is provided at the national
level under the Basel Convention and centrally published by the Basel Convention Secretariat in
a similar manner.
The processes and systems for collecting waste data vary between the jurisdictions. The
following section provides a description of the current data collection and reporting arrangements
for each jurisdiction.
2.1.1. New South Wales
Hazardous waste tracking in New South Wales is regulated under the Protection of the
Environment Operations (Waste) Regulation 2005 which came into effect on 1 March 2006. The
New South Wales EPA operates a mandatory online waste tracking system which can be used
for tracking waste transported within New South Wales or into New South Wales from other
states or territories. The tracking system uses the NEPM waste categorisation codes.
In New South Wales, waste is classified as hazardous or non-hazardous taking into account the
hazard characteristics of the waste according to the activity being carried out. Regulated
activities include generation, transport, storage, treatment and disposal of hazardous and liquid
waste.
Responsibilities for tracking of waste movements fall on the waste producer, waste transporter
and the receiving waste treatment or disposal facility. Each waste load must be issued with a
consignment authorisation certificate by the EPA prior to transport. The transport certificate
contains information about the waste, the consignor, transporter and receiving facility and must
accompany the waste load during transport. Waste that is to be transported out of New South
Wales requires a consignment authorisation from the destination jurisdiction.
Tracking of waste movements both within New South Wales and interstate is required for the
majority of the hazardous waste categories. Nine of the waste categories however require
tracking for interstate movements only. These wastes are:
Animal effluent and residues (abattoir effluent, poultry and fish processing wastes) (K100)
Asbestos (N220)
Containers and drums that are contaminated with residues of waste (N100)
Grease trap waste (K110)
Sewage sludge and residues including nightsoil and septic tank sludge (K130)

_____________________________________________________________________________________________________
5012.086—Hazardous Waste Data Assessment page 17
Soils contaminated with a substance or waste referred to in this Table (N120)
Tannery wastes including leather dust, ash, sludges and flours (K140)
Tyres (T140)
Wool scouring wastes (K190).
Reporting
Interstate waste data is compiled and provided to the NEPC for inclusion in their annual public
report. Intrastate waste data including generation, movement and disposal figures for each waste
category is not publically reported. The annual State of the Environment report5 makes limited
mention of hazardous waste but notes that ‘data on the generation of hazardous waste in New
South Wales is not available’.
2.1.2. Victoria
Hazardous waste tracking in Victoria is regulated under the Environment Protection (Industrial
Waste Resource) Regulations 2009. Hazardous, or ‘prescribed’ wastes as they are known in
Victoria, are identified both by their physical state (i.e. liquid = L, sludge = P, solid = S, or a
mixture or assortment = M) and a four character code corresponding to the particular type of
waste. The four character codes used are United Nations (UN) numbers which are internationally
recognised numbers identifying or describing various dangerous goods. They are designated by
the United Nations and are adopted in the Australian Dangerous Goods Code (ADG Code). The
NEPM codes are also used to identify the broader waste type.
The regulations require prescribed waste to be transported using a vehicle with an EPA permit
and with a waste transport certificate accompanying the load. Prescribed wastes can only be
transported to treatment/disposal facilities with EPA approval. Exemption from these
requirements exists for wastes destined for a beneficial reuse opportunity. In this case the waste
does not require a waste transport certificate or EPA-permitted vehicle.
Responsibility for ensuring that a certificate is completed for each consignment of prescribed
industrial waste falls on the waste producer, transporter and receiver. Certificates can either be
obtained via the online lodgement system (WasteCert) or a paper-based system. According to
EPA Victoria approximately 40 per cent of waste movements are currently tracked using the
online system. Infrequent users of the tracking system appear to be reluctant to use the
electronic system as registration to the system is perceived to require greater effort than simply
completing a paper certificate.
The Victorian intrastate tracking system has an extensive list of disposal/ treatment options from
which the waste receiver is required to identify and select the most relevant type of disposal or
treatment on the paper-based waste transport certificates.
Interstate movements of prescribed wastes into Victoria are managed under the Controlled
Waste NEPM. Movement of waste out of Victoria to other jurisdictions is managed under both the
Industrial Waste Management Policy (Movement of Controlled Waste between States and
Territories) and the Environment Protection (Industrial Waste Resource) Regulations 2009.
Reporting
Interstate waste data is compiled and provided to the NEPC for inclusion in their annual public
report. Intrastate waste data including generation, movement and disposal figures for each waste
category is not publically reported, apart from quarterly and annual summaries, plus trend reports
for key wastes such as asbestos and contaminated soil, which are published on EPA’s website.
5 http://www.environment.nsw.gov.au/soe

_____________________________________________________________________________________________________
5012.086—Hazardous Waste Data Assessment page 18
2.1.3. Queensland
Hazardous (or ‘regulated’) waste tracking in Queensland is regulated under the Environmental
Protection (Waste Management) Regulation 2000. Under the regulation waste handlers are
required to submit waste tracking information to the DEHP as part of the system for tracking
wastes. A waste transport certificate (WTC) must be completed for each load of ‘trackable’
waste. Regulated wastes are categorised by the NEPM waste categorisation codes but do not
include acid sulphate soils and contaminated soils.
Several exemptions apply to the waste transport certificate requirements including non-
commercial transportation of less than 250 kg of trackable waste and waste that is transported in
a pipeline.
Interstate transport of regulated waste is subject to the provisions of the NEPM, discussed
previously in section 1.4.1.
Reporting
Interstate waste data is compiled and provided to the NEPC for inclusion in their annual public
report. Intrastate waste data including generation, movement and disposal figures for each waste
category is not publically reported.
2.1.4. Western Australia
Hazardous (or ‘controlled’) waste tracking in Western Australia is regulated under the
Environmental Protection (Controlled Waste) Regulations 2004 (the Regulations).
The Regulations apply to a controlled waste that is produced by, or as a result of:
An industrial or commercial activity
A medical, nursing, dental, veterinary, pharmaceutical or other related activity
Activities carried out on or at a laboratory
or
An apparatus for the treatment of sewage.
Controlled Waste is defined as all liquid waste, and any waste that cannot be disposed as a
Class I, II or III landfill site. Asbestos, clinical or related waste, tyres and waste that has been
immobilised or encapsulated are all classified as controlled wastes.
Controlled wastes are classified by Western Australian Controlled Waste Categories which for
the most part can be matched with the UN codes and broader UNEP categories. There are a
number of differences however, as demonstrated by the example in Table 2.
Table 2—Example of waste classification codes used in Western Australia
Waste description type
(UNEP category)
Western Australia controlled waste category
description
Western Australia controlled waste
category
Waste code (UNEP)
UN number
Cyanide-containing wastes
Inorganic and organic cyanide Wastes resulting from the surface treatment of metals and plastics
12.01, 12.02 & 15.04
A100 1935
The Western Australia DEC have recently undertaken a review and reform of the Regulations
with a view to improving environmental outcomes and streamlining the tracking process. The
revised tracking system will utilise the 75 NEPM categories and UN numbers to better align the
system with other jurisdictions.

_____________________________________________________________________________________________________
5012.086—Hazardous Waste Data Assessment page 19
Reporting
Interstate waste data is compiled and provided to the NEPC for inclusion in their annual public
report. Intrastate waste data including generation, movement and disposal figures for each waste
category is not publically reported.
2.1.5. South Australia
Hazardous (or ‘listed’) waste tracking in South Australia is regulated under the Environmental
Protection Act 1993.
A waste transport certificate (WTC) and waste tracking form (WTF) are required for intrastate
transportation of all hazardous wastes listed under the Act.
For interstate movements of hazardous wastes the NEPM provisions apply.
Reporting
Interstate waste data is compiled and provided to the NEPC for inclusion in their annual public
report. Intrastate waste data including generation, movement and disposal figures for each waste
category is not publically reported.
2.1.6. Tasmania
Hazardous (or ‘controlled’) waste tracking in Tasmania is regulated under the Environmental
Management and Pollution Control (Controlled Waste Tracking) Regulations 2010.
Tasmania’s controlled waste tracking system for intrastate waste movements is currently at
developmental stage and therefore intrastate waste movements are not recorded at present.
Interstate hazardous waste movements are recorded under the NEPM waste categories for
annual reporting to the NEPC. Interstate movements are few in number and are mainly in the
form of metallic wastes received from South Australia and international waste loads received
from Antarctica. Section 4.6 discusses these waste imports in more detail.
Reporting
Interstate waste data is compiled and provided to the NEPC for inclusion in their annual public
report. Intrastate waste data is not currently recorded or reported.
2.1.7. Northern Territory
All hazardous waste generated in the Northern Territory is transported interstate for disposal as
there are no facilities in the Northern Territory that are licensed to treat or dispose of hazardous
materials. There is currently no formal hazardous waste tracking system in the NT, however,
discussions with the Northern Territory EPA indicate that a tracking system has been proposed
and is in the early stages of development. This is likely to involve implementation of the New
South Wales electronic data system rather than development of a new system6.
Reporting
Interstate waste data is compiled and provided to the NEPC for inclusion in their annual public
report.
6 NEPC Annual Report 2010-11

_____________________________________________________________________________________________________
5012.086—Hazardous Waste Data Assessment page 20
2.1.8. Australian Capital Territory
Hazardous waste tracking in the Australian Capital Territory is regulated under the National
Environment Protection Act 1994 which is given effect through the National Environment
Protection Council Act 1994. The Australian Capital Territory does not track intrastate waste
movements however it does report intrastate waste movements annually through the controlled
waste NEPM.
Reporting
Interstate waste data is compiled and provided to the NEPC for inclusion in their annual public
report.
2.2. International reporting obligations
Australia is a party to the Basel Convention on the Control of Trans-boundary Movements of
Hazardous Wastes and their disposal, which regulates the movement of hazardous wastes
across international boundaries. The Hazardous Waste (Regulation of Exports and Imports) Act
1989 implements Australia’s obligations under the Basel Convention by regulating the export,
import and transit of hazardous waste to ensure that exported, imported or transited waste is
managed in an environmentally sound manner. The Australian Government provides an annual
report to the Secretariat of the Basel Convention on the details of the trans-boundary movements
of hazardous wastes from Australia. This information is not publicly available.
2.3. The Proximity Principle
The proximity principle is one of the four key guiding principles of the Basel Convention that
underpin the way hazardous wastes should be managed.
The Basel Convention is a global agreement, ratified by some 178 member countries to address
the problems and challenges posed by hazardous waste. It is used internationally as a guide for
hazardous waste legislation on a national scale and for developing guidelines and codes of
practice.
The four principles of the Basel Convention are:
(i) the polluter pays principle
(ii) the user pays principle
(iii) the proximity principle
(iv) the product stewardship principle.
The proximity principle recommends that treatment and disposal of hazardous waste take place
at the closest possible location to its source in order to minimise the risks involved in its transport.
Whilst this is a logical approach to managing hazardous waste, in practice there are several
factors driving the way hazardous waste is managed that can run the proximity principle. These
are largely legislative drivers, cost of required treatment/ disposal and the location or availability
of treatment/disposal options.
Legislation acts as the main driver in each jurisdiction for what is permitted to be done with a
particular hazardous waste. The Queensland Waste Reduction and Recycling Act 2011 is an
example of recent Australian legislation that has expressly adopted the proximity principle, such
that hazardous wastes should, where possible, be treated and recovered or disposed of close to
their point of generation.
Whilst this is essential in ensuring that the waste is appropriately managed it also has the effect
of reducing the treatment/ disposal options that are available. The impact of this can be that
_____________________________________________________________________________________________________
5012.086—Hazardous Waste Data Assessment page 21
waste generated within a particular jurisdiction or in a particular location can only be treated or
disposed of at a facility in another state or one that requires significant transport distance. This is
particularly relevant for wastes generated in smaller quantities that require a specific form of
treatment whereby the cost implications of providing a treatment facility near to the source of the
waste are prohibitive.
The cost of treatment or disposal of hazardous waste can also have a significant influence over
where wastes are disposed of or treated. Differences in waste management costs vary
considerably between jurisdictions (refer to Section 5) and as a consequence it is in some cases
more cost-effective to transport waste to another jurisdiction where the lower cost of disposal
outweighs the transportation costs. An example of this is non-hazardous waste generated in
northern New South Wales being transported to Queensland (much further than local waste
management options) where it is exempt from New South Wales’s waste landfill levy.
The data sourced for this assessment does not include geographical information regarding the
source and destination of individual movements of hazardous wastes beyond jurisdictional level
information. Whilst this information often exists within waste tracking systems it was not provided
for use in this assessment for confidentiality reasons. At a jurisdictional lever however, data that
could be viewed spatially would assist in measuring the implementation of the proximity principle
with regard to hazardous waste.

_____________________________________________________________________________________________________
5012.086—Hazardous Waste Data Assessment page 22
3. Approach to data collection
This chapter describes the approach taken to data collection and analysis, as well as key
concepts that underpin how that data is presented throughout the report.
3.1. Official (tracked) versus non-tracked hazardous waste streams
Hazardous wastes that are tracked as part of a state or territory’s tracking system are referred to
in this report as the ‘tracked’ or in some cases ‘official’ hazardous waste stream. Conversely,
‘non-tracked’ hazardous wastes are those that are listed in the NEPM waste list but are not
tracked by the formal waste tracking system in a particular jurisdiction. These ‘non-tracked’
wastes may be managed and recorded by separate data systems, although such systems have
not been identified or used in this report. Alternately and more commonly, the arisings,
movements and fates of these wastes may not be tracked by any system.
Hazardous waste materials that are generated in MSW, C&I and C&D waste sources (or
streams), and not captured by formal tracking systems, are hereby referred to as ‘contamination’
of these streams. This is because, for the purposes of management of waste at these sources,
the streams are treated as non-hazardous.
However, because MSW, C&I and C&D refer to the source of waste, while Hazardous (the
‘fourth’ category) refers to the nature of the waste, there is significant overlap. For example most
of the hazardous waste contributed by the C&D sector is likely to be contaminated soil and
asbestos, which is tracked as hazardous in many jurisdictions. Similarly C&I sector companies
make up the majority of generators recorded in hazardous waste tracking systems, while
disposal of hazardous waste from household chemical collection programs is recorded in
jurisdictional waste tracking systems.
The types of contaminating wastes commonly found in the MSW and C&I waste streams include
the following:
paint
batteries
gas cylinders
fluorescent lamps and tubes
pesticides
oils
solvents.
Because the hazardous waste contamination of these streams is not tracked or recorded, this
presents a challenge when it comes to quantifying the amount of hazardous waste generated
and disposed of within these streams.
In order to quantify the hazardous component of these waste streams it has been necessary to
review the existing data and literature relating to waste items and materials that are classified as
hazardous but are disposed of amongst non-hazardous waste. These data sources are sporadic
and typically include both bespoke and program-driven MSW audits, waste studies and material
flow estimations.

_____________________________________________________________________________________________________
5012.086—Hazardous Waste Data Assessment page 23
3.2. Data collection
Data templates were provided to each jurisdiction for the purpose of obtaining data in a
consistent format. Wastes were listed by the 75 NEPM waste descriptions/codes and for each
waste type the jurisdictions were requested to input data under the following column headings:
Waste generated within jurisdiction
Waste imported
Waste exported
Waste treatment/disposal:
o Storage—waste is stored pending treatment or disposal.
o Treatment—waste undergoes some form of treatment to render it non-hazardous or
of reduced hazard level so that it may be re-used, recycled or disposed of, or so that
energy may be recovered from the waste.
o Recycling—waste is recycled following treatment.
o Reuse—waste is reused following treatment to reduce its hazard level.
o Energy recovery—processes or opportunities to recover energy from waste materials,
usually thermal processes.
o Landfill—waste is disposed of in a licensed landfill.
Where jurisdictions operate intrastate hazardous waste tracking systems this ‘tracked’ data has
been sourced from the relevant state or territory organisation. Intrastate data from jurisdictions
that do not have a hazardous waste tracking system has been sourced, where available, from
waste facility data. Data has been presented individually for each state and territory in summary
form due to the extensive number of NEPM categories, and also as a combined national total.
The expanded list of NEPM waste codes are provided in Appendix A.
Due to the variability in data collection processes between the tracked hazardous stream (data
obtained via tracking systems) and the non-tracked (‘contamination’) hazardous streams, data for
each of the waste streams have been collated separately for each state and territory as well as a
combined total.
Interstate waste data for the large part has been available for all jurisdictions due to the
requirements of each state and territory to report annually the interstate hazardous waste
movements under the NEPM arrangements. Where waste generation figures have not been
available the import and export figures have been used to estimate waste generation figures for
each waste category such that:
Waste generated = waste treated or disposed + waste exported – waste imported.
Waste imported Waste generated Waste exported
Waste treated/disposed

_____________________________________________________________________________________________________
5012.086—Hazardous Waste Data Assessment page 24
3.3. Assessment of hazardous waste data systems
Assessment of each jurisdiction’s hazardous waste data system has been conducted using six
common principles of reporting quality for data systems.
Transparency—is the data documented and verifiable?
Comparability—is data produced/sourced using the same methodologies and can it be
compared across jurisdictions?
Accuracy—has uncertainty in data values been minimised?
Completeness—Are all data sources within a jurisdiction identified and accounted for?
Clarity—Is information clear and easily understood?
Timeliness—Does reporting occur on a regular basis to allow for analysis and inform
decision making?
For each principle a rating has been assigned as follows:
High—sound, mature and robust reporting system, scope for error is negligible.
Medium—satisfactory however some potential exists for error and/or loss of data.
Low—data is questionable with limited logical or structured approach to data or record
keeping. High potential for error and/or loss of data. Data may appear to differ from those
initially reported.
_____________________________________________________________________________________________________
5012.086—Hazardous Waste Data Assessment page 25
4. Hazardous waste data compilation and
assessment
This chapter presents the compilation of the available data and information on hazardous waste
quantities in Australia for the financial year 2010–11, both by jurisdiction and as an overall
national comparison.
This chapter, and in turn this report, sources hazardous waste data supplied by jurisdictional
agencies from their ‘official’ waste tracking systems, which are a combination of systems that
track movements within jurisdictions (where they exist) and systems for authorising and tracking
interstate transport of hazardous waste. The limitations of this data and subsequent attempts to
improve its quality by identifying gaps and inconsistencies and supplementing these through
alternative data sources where possible has been tackled in the companion report, the
Hazardous Waste Data Summary.
The other aspect of data compiled by this section, the identification of hazardous waste that is
generated from MSW, C&I and C&D sources, applies estimation methods based on publicly
available information and literature reports.
The data compilation provides information on the following:
the quantity of hazardous waste that is generated, transported, recovered, treated, recycled
and disposed of, by jurisdiction and nationally, for a common base year
the composition of Australian flows of hazardous waste including flows within a jurisdiction,
across jurisdictional boundaries and across national borders
the hazardous content of mixed waste within the three waste streams used as general
categories in Australian waste data and reporting (MSW, C&I, C&D) and the extent to which
this waste is monitored and reported.
4.1. New South Wales
4.1.1. Tracked hazardous waste
The waste tracking data received from EPA New South Wales for 2010–11 is presented in
summary form in Table 3. New South Wales’s hazardous waste tracking system recorded
260,920 tonnes of hazardous waste generated within the state in 2010–11. No waste export data
was provided and 64,079 tonnes of waste was imported from other jurisdictions for treatment
and/ or disposal.
Waste composition
The composition of hazardous waste generated, exported and imported in New South Wales is
shown at Figure 2.
Waste treatment and disposal
Figure 1 below provides a summary of the waste treatment and disposal of hazardous wastes in
New South Wales. A more detailed breakdown of waste treatment and disposal by waste type is
at Table 3.

_____________________________________________________________________________________________________
5012.086—Hazardous Waste Data Assessment page 26
Figure 1—Hazardous waste treatment/disposal (New South Wales 2010–11)
Note: The ’other’ treatment category is a catch-all for waste transport certificates that were filled
out incorrectly and as a result contain errors or omissions in the treatment category.

_____________________________________________________________________________________________________
5012.086—Hazardous Waste Data Assessment page 27
Table 3—Waste tracking data summary New South Wales (2010–11)
Hazardous waste classification Waste
generation (tonnes)
Interstate waste movements (tonnes)
Waste treatment/disposal (tonnes)
Code Waste description Within state Exported Imported Landfill Trade waste
Treated Energy recovery
Recycled Storage Other
A Cyanides 3 - - - - - - - 3 -
B Acids 9,101 - 10,969 - - 19,990 - 22 58 -
C Alkaline wastes 2,071 - 548 10 - 2,200 - 0.0 62 347
D Inorganic chemicals 30,339 - 28,895 2,894 - 6,323 - 49,377 611 30
E Reactive chemicals 4 - 5 - - 5 - 0.02 3 -
F Paints, lacquers, varnish, resins, inks, dyes, pigments, adhesives
6,517 - 1,628 - - 6,194 - 359 1,359 233
G Organic solvents, solvent residues 1,335 - 638 - - 950 - 469 554 1
H Pesticides (includes herbicides and insecticides)
189 - 41 111 - 68 - - 50 -
J Oils, hydrocarbons, emulsions 104,036 - 8,753 4 - 62,652 - 28,044 22,081 8
K Putrescible/organic wastes 237 - 9,024 - - 8,137 - 1,063 4 57
L Industrial washwaters - - - - - - - - - -
M Organic chemicals 8,883 - 1,285 - - 9,474 - 612 82 -
N Solid/sludge wastes requiring special handling
84,499 - 2,000 54,909 - 21,388 - 9,043 1,158 2
R Clinical and pharmaceutical wastes 11,801 - 186 - - 11,882 - 4 100 -
T Miscellaneous 1,904 - 106 0.2 - 147 - 122 1,742 -
Total 260,920 - 64,079 57,928 - 149,411 - 89,115 27,867 678

_____________________________________________________________________________________________________
5012.086—Hazardous Waste Data Assessment page 28
Figure 2—Waste generated, imported and exported by NEPM category (New South Wales 2010–11)

_____________________________________________________________________________________________________
5012.086—Hazardous Waste Data Assessment page 29
4.1.2. Assessment of waste tracking system data
Principles Assessment Score
Transparency—Is the data documented
and verifiable? Data is well documented and verified by data records.
High
Comparability—Is data produced/ sourced
using the same methodologies and can it be compared across jurisdictions?
Use of NEPM codes and descriptions and system of tracking allows comparison with other jurisdictions. However there are significant waste categories that are not tracked (missing) which hinders proper data comparison with other jurisdictions.
Medium
Accuracy—Has uncertainty in data values been minimised?
All waste categories balance.
High
Completeness—Are all data sources within
a jurisdiction identified and accounted for? No waste export figures provided, however NEPM report shows that waste was exported.
Significant waste categories not formally tracked (missing) which impacts completeness.
Low
Clarity—Is information clear and easily
understood? Information provided is clear and easily understood.
High
Timeliness—Does reporting occur on a
regular basis to allow for analysis and inform decision making?
Interstate waste data reported annually to NEPC. Intrastate waste data aggregated in annual report.
High
4.1.3. Non-tracked hazardous waste
The following waste types are tracked for interstate movements only and are not tracked within the
state:
Group K (Putrescible/ Organic) wastes such as sewage sludge (K130), animal effluent wastes
(K100), tannery wastes (K140) and wool scouring wastes (K190)
Prescribed waste residues (N100)
Contaminated soils (N120)
Asbestos (N220)
Tyres (T140).
In addition some wastes are exempt from tracking requirements in New South Wales. The New South
Wales EPA publishes the following exemptions (from waste tracking) in accordance with clause 51 of
the Protection of the Environment Operations (Waste) Regulation 2005:
Number 2006-E-1: Zinc wastes destined for re-use (D230)
Number 2006-E-2: Waste batteries (that are classified as hazardous or industrial waste)
destined for re-use (D220)
Number 2006-E-3: Spent pickle liquor destined for re-use (B100)
Number 2006-E-4: Non-hazardous waste hydrocarbon oil destined for recycling (J100)
Number 2001–E–01: Tracking of clinical and other specified wastes (R100).
These untracked and exempt waste categories are either completely absent from tracked data in New
South Wales or present in low tonnages. The latter is most likely a result of mistaken use of waste
transport certification beyond legal requirements, by players in the waste transport process.
All other NEPM waste categories are included within the intrastate tracking system.

_____________________________________________________________________________________________________
5012.086—Hazardous Waste Data Assessment page 30
The companion Hazardous Waste Data Summary report identifies, discusses and fills these gaps
using data from other sources, such as the Waste and Recycling in Australia 2011, which presents
national and state totals for 2008–097.
4.2. Victoria
4.2.1. Tracked hazardous waste
The waste tracking data received from EPA Victoria for 2010–11 is presented in summary form in
Table 5. Victoria’s hazardous waste tracking system recorded 958,770 tonnes of hazardous waste
generated within the state in 2010–11. Of this, 43,725 tonnes was exported and 35,752 tonnes was
imported from other jurisdictions for treatment and/or disposal.
Waste composition
The composition of hazardous waste generated, exported and imported in Victoria is shown at
Figure 5 .
Approximately 56% (greater than 500,000 tonnes) of hazardous waste generated in Victoria is
Category N ‘Solid/sludge wastes requiring special handling’. This waste category includes the
category A, B and C contaminated soils of which category C contaminated soils account for the vast
majority of this waste. A breakdown of the Category N waste is shown in Figure 3. Definitions of
Category A, B and C wastes are provided in Table 4.
Figure 3—‘N’ category wastes generated in Victoria
Waste treatment and disposal
Figure 1 below provides a summary of the waste treatment and disposal of hazardous wastes in
Victoria. A more detailed breakdown of waste treatment and disposal by waste type is shown in
Table 3.
7 http://www.environment.gov.au/wastepolicy/publications/waste-recycling2011.html

_____________________________________________________________________________________________________
5012.086—Hazardous Waste Data Assessment page 31
Figure 4—Hazardous waste treatment/disposal (Victoria 2010–11)
Notes:
1. The ‘other’ treatment category is a catch-all for waste transport certificates that were filled out
incorrectly and as a result contain errors or omissions in the treatment category.
2. Victoria is the only jurisdiction to report tonnages for re-use as a treatment pathway.
The Victorian intrastate tracking system has an extensive list of disposal/ treatment options from which
the waste receiver is required to identify the most relevant type of disposal or treatment option on the
paper-based waste transport certificates. The options have been grouped here into the broader
disposal/ treatment categories used in this data assessment to provide consistency and allow
comparison between each jurisdiction. For example, options D1 (Landfill disposal of Category C
waste) and D5 (Landfill disposal of Category B and C waste) from the Victorian waste
disposal/treatment codes are listed under ‘landfill‘. The other codes are similarly grouped as follows:
Landfill = D1, D5
Recycling = R3, R4, R5, R6, R14, R15
Recovery = R7, R8
Storage = D4, D12, D15, R13
Incineration = D10, D11
Re-Use = D2, R1, R2, R9, R10, R11
Disposal (Other) = D3, D6, D7
Treatment = D8, D9A, D9B, D9C, D13, D14, R16.
Landfill receives the largest proportion of hazardous waste, as shown in Table 5Error! Reference
ource not found., which can be attributed to the large quantity of Category C (low hazard)
contaminated soil generated.
Victoria has 35 landfills licensed to accept Category C wastes and one Category B landfill at
Lyndhurst. There are currently no landfills in the state licensed to accept Category A wastes due to the
_____________________________________________________________________________________________________
5012.086—Hazardous Waste Data Assessment page 32
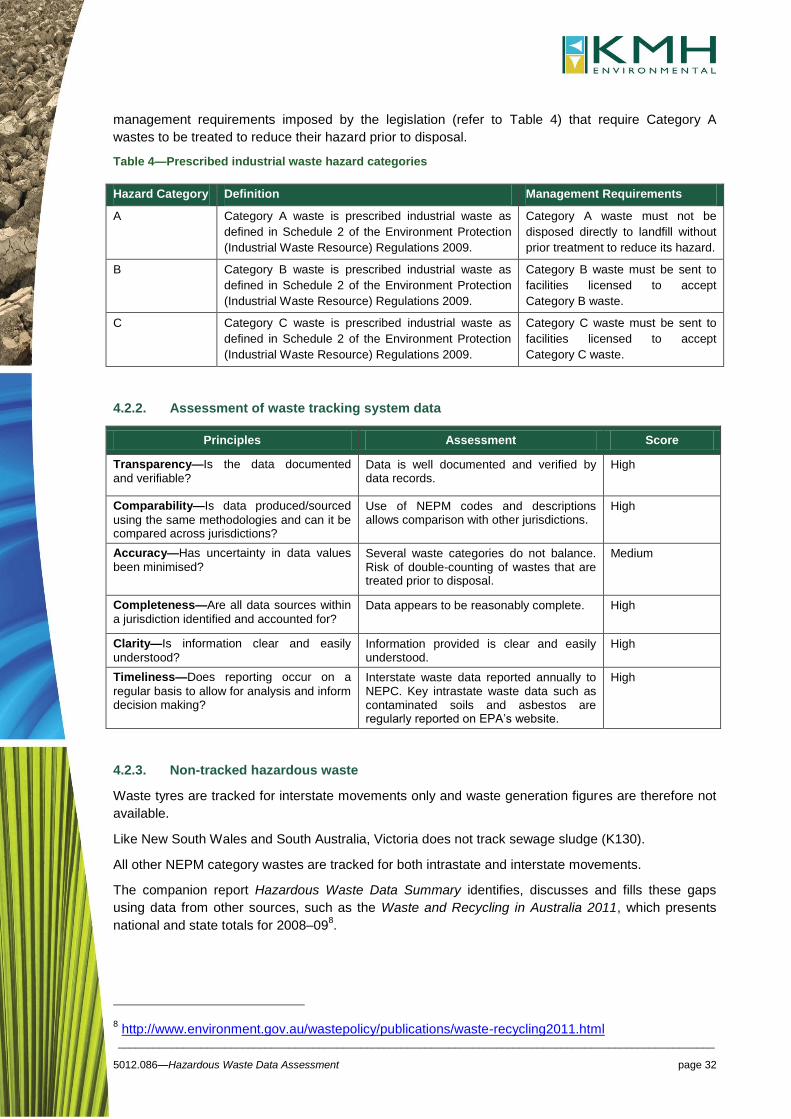
management requirements imposed by the legislation (refer to Table 4) that require Category A
wastes to be treated to reduce their hazard prior to disposal.
Table 4—Prescribed industrial waste hazard categories
Hazard Category Definition Management Requirements
A Category A waste is prescribed industrial waste as
defined in Schedule 2 of the Environment Protection
(Industrial Waste Resource) Regulations 2009.
Category A waste must not be
disposed directly to landfill without
prior treatment to reduce its hazard.
B Category B waste is prescribed industrial waste as
defined in Schedule 2 of the Environment Protection
(Industrial Waste Resource) Regulations 2009.
Category B waste must be sent to
facilities licensed to accept
Category B waste.
C Category C waste is prescribed industrial waste as
defined in Schedule 2 of the Environment Protection
(Industrial Waste Resource) Regulations 2009.
Category C waste must be sent to
facilities licensed to accept
Category C waste.
4.2.2. Assessment of waste tracking system data
Principles Assessment Score
Transparency—Is the data documented
and verifiable? Data is well documented and verified by data records.
High
Comparability—Is data produced/sourced
using the same methodologies and can it be compared across jurisdictions?
Use of NEPM codes and descriptions allows comparison with other jurisdictions.
High
Accuracy—Has uncertainty in data values
been minimised? Several waste categories do not balance. Risk of double-counting of wastes that are treated prior to disposal.
Medium
Completeness—Are all data sources within
a jurisdiction identified and accounted for? Data appears to be reasonably complete. High
Clarity—Is information clear and easily
understood? Information provided is clear and easily understood.
High
Timeliness—Does reporting occur on a
regular basis to allow for analysis and inform decision making?
Interstate waste data reported annually to NEPC. Key intrastate waste data such as contaminated soils and asbestos are regularly reported on EPA’s website.
High
4.2.3. Non-tracked hazardous waste
Waste tyres are tracked for interstate movements only and waste generation figures are therefore not
available.
Like New South Wales and South Australia, Victoria does not track sewage sludge (K130).
All other NEPM category wastes are tracked for both intrastate and interstate movements.
The companion report Hazardous Waste Data Summary identifies, discusses and fills these gaps
using data from other sources, such as the Waste and Recycling in Australia 2011, which presents
national and state totals for 2008–098.
8 http://www.environment.gov.au/wastepolicy/publications/waste-recycling2011.html

_____________________________________________________________________________________________________
5012.086—Hazardous Waste Data Assessment page 33
Table 5—Waste tracking data summary Victoria (2010–11)
Hazardous waste classification
Waste
generation
(tonnes)
Interstate waste
movements (tonnes) Waste treatment/disposal (tonnes)
Code Waste description Within state Exported Imported Disposal
(other) Landfill Re-Use
Energy
recovery Recycling Storage Treatment
Not
recorded
A Cyanides 15 - 8 - - 8 - - 15 - -
B Acids 9,939 11,368 86 - - 1 - - 394 9,538 11,461
C Alkaline wastes 8,614 469 36 - 436 13 - - 130 7,998 542
D Inorganic chemicals 15,166 18,010 20,858 - 4,250 3 69 15,425 765 1,597 31,944
E Reactive chemicals 104 - 2 - - - - - 104 - 2
F Paints, lacquers, varnish,
resins, inks, dyes,
pigments, adhesives
21,071 1,953 2,919 - 28 5,488 - 32 9,040 7,338 4,017
G Organic solvents, solvent
residues
8,388 288 1,766 - - 5,285 - 18 1,995 61 1,563
H Pesticides (includes
herbicides and
insecticides)
366 - 684 - 8 788 - - 128 42 84
J Oils, hydrocarbons,
emulsions
104,795 4,233 5,591 - 9 31,707 5 5,502 38,135 30,393 8,867
K Putrescible/organic wastes 162,782 5,063 2,806 35 3,912 24,171 1 61,676 9,212 55,645 15,952
L Industrial washwaters 55,656 4 120 - - 251 - 4,717 6,495 43,307 1,014
M Organic chemicals 2,041 44 58 - - 122 - 25 1,330 535 131
N Solid/sludge wastes
requiring special handling
510,863 2,084 99 - 461,666 150 - 1,897 10,222 21,085 18,105
R Clinical and
pharmaceutical wastes
11,158 197 704 - - 12 - - 2,937 6,261 2,846
T Miscellaneous 4,087 12 15 - 172 110 - 236 1,233 2,338 123
Total 915,045 43,725 35,752 35 470,481 68,109 75 89,528 82,135 186,138 96,651

_____________________________________________________________________________________________________
5012.086—Hazardous Waste Data Assessment page 34
Figure 5 —Waste generated, imported and exported by NEPM category (Victoria 2010–11)

_____________________________________________________________________________________________________
5012.086—Hazardous Waste Data Assessment page 35
4.3. Queensland
4.3.1. Tracked hazardous waste
The waste tracking data received from DEHP Queensland for 2010–11 is presented in summary
form in Table 6. Queensland’s hazardous waste tracking system recorded 1,455,316.9 tonnes of
hazardous waste generated within the state in 2010–11. Of this, 6,505 tonnes of waste was
exported and 14,186 tonnes was imported from other jurisdictions for treatment and/ or disposal.
Waste composition
The composition of hazardous waste generated, exported and imported in Queensland is shown
in the chart in Figure 6 on page 38.
Waste treatment and disposal
Figure 6 below provides a summary of how hazardous waste was treated and disposed of in
2010–11. A more detailed breakdown of waste treatment and disposal by waste type is shown in
Table 6.
Figure 5—Hazardous waste treatment/disposal (Queensland 2010–11)

_____________________________________________________________________________________________________
5012.086—Hazardous Waste Data Assessment page 36
4.3.2. Assessment of waste tracking system data
Principles Assessment Score
Transparency—Is the data documented
and verifiable? Data is well documented and verified by data records.
High
Comparability—Is data produced/
sourced using the same methodologies and can it be compared across jurisdictions?
Use of NEPM codes and descriptions allows comparison with other jurisdictions.
High
Accuracy—Has uncertainty in data values
been minimised? Several waste categories do not balance.
Medium
Completeness—Are all data sources
within a jurisdiction identified and accounted for?
Data appears to be complete. High
Clarity—Is information clear and easily
understood? Information provided is clear and easily understood.
High
Timeliness—Does reporting occur on a
regular basis to allow for analysis and inform decision making?
Interstate waste data reported annually to NEPC. Not known if intrastate waste data is reported.
Medium
4.3.3. Non-tracked hazardous waste
With the notable exception of contaminated soil (for intrastate movements), all NEPM category
wastes are classed as regulated waste in Queensland and are included within the state
hazardous waste tracking system for interstate and intrastate waste movements as ‘trackable’
wastes. Contaminated soil is covered by specific approval arrangements administered by DEHP.
The companion Hazardous Waste Data Summary report identifies, discusses and fills these gaps
using data from other sources, such as the Waste and Recycling in Australia 2011, which
presents national and state totals for 2008–099.
9 http://www.environment.gov.au/wastepolicy/publications/waste-recycling2011.html

_____________________________________________________________________________________________________
5012.086—Hazardous Waste Data Assessment page 37
Table 6—Waste tracking data summary Queensland (2010–11)
Hazardous waste classification Waste
generation (tonnes)
Interstate waste movements (tonnes)
Waste treatment/disposal (tonnes)
Code Waste description Within state Exported Imported Disposed to
landfill Disposed to trade waste
Treated Energy
recovery Recycled
A Cyanides 5,891 35 14 4,071 - 324 20 764
B Acids 13,701 17 730 1,372 - 1,780 310 9,353
C Alkaline wastes 92,279 27 382 1,610 - 1,671 12,582 13,243
D Inorganic chemicals 49,791 1,444 173 8,398 - 4,868 498 4,364
E Reactive chemicals 1,352 - - 807 - 40 62 283
F Paints, lacquers, varnish, resins, inks, dyes, pigments, adhesives
12,611 1,239 257 776 - 3,403 277 6,430
G Organic solvents, solvent residues 14,012 223 13 565 - 426 85 12,386
H Pesticides (includes herbicides and insecticides)
773 933 50 319 - 134 617 193
J Oils, hydrocarbons, emulsions 238,004 1,904 7,085 15,024 - 86,622 1,023 71,456
K Putrescible/organic wastes 749,657 375 1,823 99,597 - 349,880 10,302 181,765
L Industrial washwaters 153 - - 8 - 33 - 66
M Organic chemicals 4,303 54 706 2,114 - 1,741 147 481
N Solid/sludge wastes requiring special handling
212,198 166 1,313 168,989 - 13,696 1,012 22,539
R Clinical and pharmaceutical wastes 18,809 68 799 7,649 - 10,080 - 5
T Miscellaneous 35,276 20 841 5,252 - 1,523 1 24,118
Total 1,448,812 6,505 14,186 316,551 - 476,220 26,935 347,446

_____________________________________________________________________________________________________
5012.086—Hazardous Waste Data Assessment page 38
Figure 6—Waste generated, imported and exported by NEPM category (Queensland 2010–11)

_____________________________________________________________________________________________________
5012.086—Hazardous Waste Data Assessment page 39
4.4. Western Australia
4.4.1. Tracked hazardous waste
The waste tracking data received from DEC Western Australia for 2010–11 is presented in
summary form in Table 7. Western Australia’s hazardous waste tracking system recorded
947,938 tonnes of hazardous waste generated within the state in 2010–11. Of this, 8,142 tonnes
of waste was exported and 2,100 tonnes was imported from other jurisdictions for treatment and/
or disposal.
Waste composition
The composition of hazardous waste generated, exported and imported in Western Australia is
shown at Figure 7.
Waste treatment and disposal
Waste treatment and disposal data was not available from Western Australia’s waste tracking
system.
4.4.2. Assessment of waste tracking system data
Principles Assessment Score
Transparency—Is the data documented
and verifiable? Data sourced from waste tracking system however not all data has been validated.
Medium
Comparability—Is data produced/
sourced using the same methodologies and can it be compared across jurisdictions?
WA uses its own Controlled Waste Category List and has several additional waste categories, therefore data not as easily comparable with other states that use NEPM codes.
Low
Accuracy—Has uncertainty in data values
been minimised? Risk of double-counting of wastes that are stored prior to disposal. Waste disposal data not accurately recorded therefore not provided.
Medium
Completeness—Are all data sources
within a jurisdiction identified and accounted for?
Waste disposal data not accurately recorded therefore not provided.
Low
Clarity—Is information clear and easily
understood? Information provided is clear and easily understood.
High
Timeliness—Does reporting occur on a
regular basis to allow for analysis and inform decision making?
Interstate waste data reported annually to NEPC. Intrastate waste data not publically reported but may be used internally.
Medium
4.4.3. Non-tracked hazardous waste
Asbestos is not tracked in Western Australia as part of the state hazardous waste tracking
system. The Waste and Recycling in Australia 2011, which presents national and state totals for
2008–0910
, was unable to provide a tonnage for asbestos in Western Australia.
10 http://www.environment.gov.au/wastepolicy/publications/waste-recycling2011.html

_____________________________________________________________________________________________________
5012.086—Hazardous Waste Data Assessment page 40
Table 7—Waste tracking data summary Western Australia (2010–11)
Hazardous waste Classification Waste
generation (tonnes)
Interstate waste movements (tonnes)
Waste treatment/disposal (tonnes)
Code Waste description Within state
Exported Imported Disposed to landfill
Disposed to trade waste
Treated Energy
Recovery Recycled
A Cyanides 1,758 - - - - - - -
B Acids 2,025 63 - - - - - -
C Alkaline wastes 105,741 - - - - - - -
D Inorganic chemicals 89,123 4,702 - - - - - -
E Reactive chemicals 1 - - - - - - -
F Paints, lacquers, varnish, resins, inks, dyes, pigments, adhesives
1,892 444 - - - - - -
G Organic solvents, solvent residues 3,533 1,036 - - - - - -
H Pesticides (includes herbicides and insecticides) 851 322 - - - - - -
J Oils, hydrocarbons, emulsions 147,974 125 400 - - - - -
K Putrescible/organic wastes 512,117 - - - - - - -
L Industrial washwaters 32,889 - - - - - - -
M Organic chemicals 3,181 1,096 600 - - - - -
N Solid/sludge wastes requiring special handling 14,458 354 1,100 - - - - -
R Clinical and pharmaceutical wastes 2,837 - - - - - - -
T Miscellaneous 21,416 - - - - - - -
Total 939,797 8,142 2,100 - - - - -

_____________________________________________________________________________________________________
5012.086—Hazardous Waste Data Assessment page 41
Figure 7—Waste generated, imported and exported by NEPM category (Western Australia 2010–11)

_____________________________________________________________________________________________________
5012.086—Hazardous Waste Data Assessment page 42
4.5. South Australia
4.5.1. Tracked hazardous waste
The waste tracking data received from EPA South Australia for 2010–11 is presented in
summary form in Table 6. South Australia’s hazardous waste tracking system recorded 444,753
tonnes of hazardous waste generated within the state in 2010–11. Of this, 5,200 tonnes of
hazardous waste was exported and 37,991 tonnes was imported from other jurisdictions for
treatment and/ or disposal.
Waste export figures were not able to be sourced from the tracking system as it is not possible to
distinguish between movements within the state and those exported due to the way in which the
certificate numbers are coded. Export data from the 2010–11 NEPM report were sourced for this
report.
Composition
The composition of hazardous waste generated, exported and imported in South Australia is
shown at Figure 8. The major waste types generated in the state are solid/ sludge wastes
requiring special handling and inorganic chemicals.
Waste treatment and disposal
South Australia’s waste tracking system does not record data on the treatment or disposal of
wastes. This information is contained within consignment notes for interstate movements but not
for intrastate movements.
4.5.2. Assessment of waste tracking system data
Principles Assessment Score
Transparency—Is the data documented
and verifiable? Interstate data comparable with NEPM report data.
Medium
Comparability—Is data produced/
sourced using the same methodologies and can it be compared across jurisdictions?
Use of NEPM codes and descriptions allows comparison with other jurisdictions. Lack of disposal data limits comparability.
Low
Accuracy—Has uncertainty in data values
been minimised? Discrepancies between waste data provided and NEPM reporting data suggest inaccuracies.
Low
Completeness—Are all data sources
within a jurisdiction identified and accounted for?
No waste export data available from tracking system.
Low
Clarity—Is information clear and easily
understood? Assumptions made around waste exports. Otherwise clear.
Medium
Timeliness—Does reporting occur on a
regular basis to allow for analysis and inform decision making?
Interstate waste data reported annually to NEPC. Intrastate waste data not publically reported but may be used internally.
Medium
4.5.3. Non-tracked hazardous waste
South Australia’s hazardous waste tracking system is closely aligned with the full list of NEPM
waste codes. However, like New South Wales, South Australia does not track Group K
(Putrescible/ Organic) wastes such as sewage sludge (K130), animal effluent wastes (K100),
tannery wastes (K140) and wool scouring wastes (K190).

_____________________________________________________________________________________________________
5012.086—Hazardous Waste Data Assessment page 43
Table 8—Waste tracking data summary South Australia (2010–11)
Hazardous Waste Classification Waste
generation (tonnes)
Interstate waste movements (tonnes)
Waste treatment/disposal (tonnes)
Code Waste description Within state
Exported
(NEPM data)
Imported Disposed to landfill
Disposed to trade waste
Treated Energy
recovery Recycled
A Cyanides 250 - - - - - - -
B Acids 2,399 58.8 786 - - - - -
C Alkaline wastes 58,054 1.4 122 - - - - -
D Inorganic chemicals 111,387 3,951.6 20,826 - - - - -
E Reactive chemicals 1 - 9 - - - - -
F Paints, lacquers, varnish, resins, inks, dyes, pigments, adhesives
2,350 235.0 1,666 - - - - -
G Organic solvents, solvent residues 718 294.2 3,563 - - - - -
H Pesticides (includes herbicides and insecticides)
427 26.7 0.3 - - - - -
J Oils, hydrocarbons, emulsions 7,039 74.9 4,682 - - - - -
K Putrescible/organic wastes - 4.5 - - - - - -
L Industrial washwaters - 3.0 - - - - - -
M Organic chemicals 145 163.4 23 - - - - -
N Solid/sludge wastes requiring special handling
240,472 54.1 5,905 - - - - -
R Clinical and pharmaceutical wastes 15,341 333.0 133 - - - - -
T Miscellaneous 972 - 277 - - - - -
Total 439,553 5,200.7 37,991 - - - - -

_____________________________________________________________________________________________________
5012.086—Hazardous Waste Data Assessment page 44
Figure 8—Waste generated, imported and exported by NEPM category (South Australia 2010–11)

_____________________________________________________________________________________________________
5012.086—Hazardous Waste Data Assessment page 45
4.6. Tasmania
4.6.1. Tracked hazardous waste
Tasmania does not have a formal hazardous waste tracking system and therefore no waste data
was provided for this study. Instead, data was sourced from the NEPC Annual Report 2010/11
which contains data on jurisdictional interstate waste movements provided under the Controlled
Waste NEPM. The interstate waste data obtained for Tasmania for 2010–11 is presented in
summary form in Table 9. Tasmania exported 16,029 tonnes of waste and imported 133 tonnes
of waste from other jurisdictions in 2010–11.
Waste composition
The composition of hazardous waste exported and imported in Tasmania is also shown in
Table 9.
Waste treatment and disposal
Waste treatment and disposal data is not recorded in Tasmania.
4.6.2. Assessment of waste tracking system data
Principles Assessment Score
Transparency—Is the data documented
and verifiable? Tasmania has no formal waste tracking system. Data therefore not available.
Low
Comparability—Is data produced/
sourced using the same methodologies and can it be compared across jurisdictions?
No tracking system. Cannot be compared to other jurisdictions.
Low
Accuracy—Has uncertainty in data values
been minimised? Not applicable Low
Completeness—Are all data sources
within a jurisdiction identified and accounted for?
No Low
Clarity—Is information clear and easily
understood? Not applicable Low
Timeliness—Does reporting occur on a
regular basis to allow for analysis and inform decision making?
Interstate waste movements reported annually to NEPC. Intrastate data not recorded.
Medium
4.6.3. Non-tracked hazardous waste
All hazardous waste generated within Tasmania is considered to be non-tracked hazardous
waste due to the absence of a formal waste tracking system.
The companion report Hazardous Waste Data Summary identifies, discusses and fills key gaps
using data from other sources, such as the Waste and Recycling in Australia 2011, which
presents national and state totals for 2008–0911
.
11 http://www.environment.gov.au/wastepolicy/publications/waste-recycling2011.html
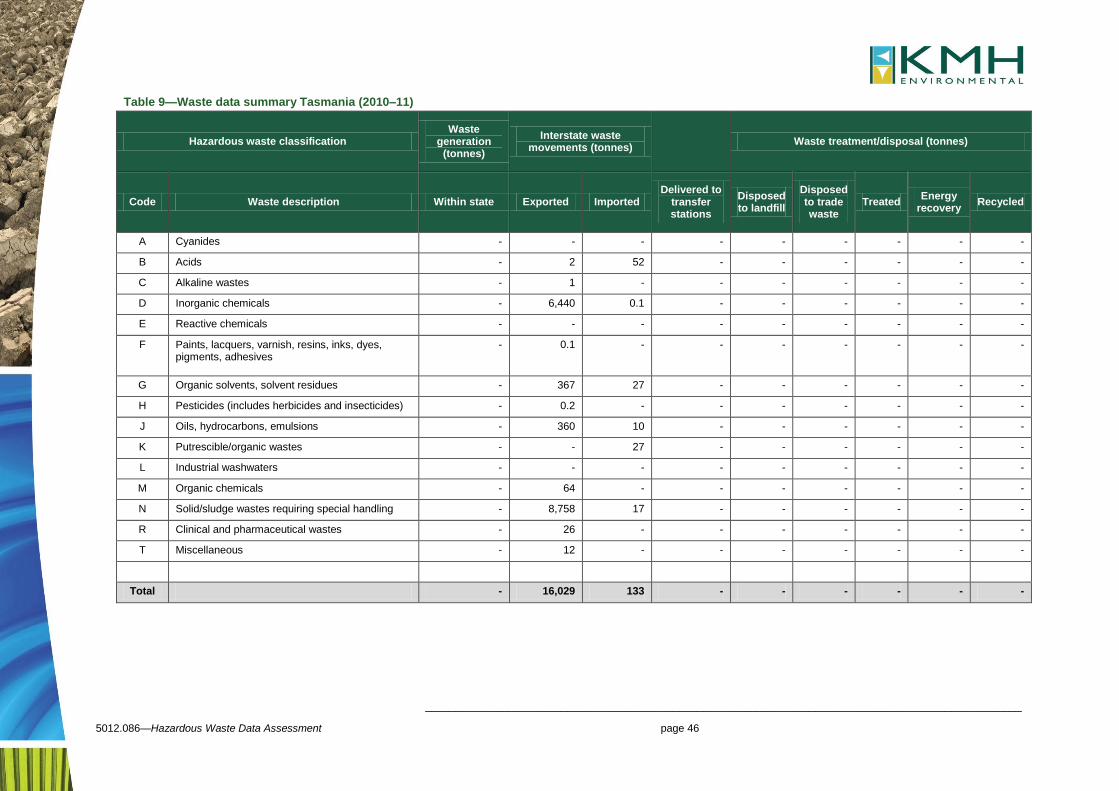
_____________________________________________________________________________________________________
5012.086—Hazardous Waste Data Assessment page 46
Table 9—Waste data summary Tasmania (2010–11)
Hazardous waste classification Waste
generation (tonnes)
Interstate waste movements (tonnes)
Waste treatment/disposal (tonnes)
Code Waste description Within state Exported Imported Delivered to
transfer stations
Disposed to landfill
Disposed to trade waste
Treated Energy
recovery Recycled
A Cyanides - - - - - - - - -
B Acids - 2 52 - - - - - -
C Alkaline wastes - 1 - - - - - - -
D Inorganic chemicals - 6,440 0.1 - - - - - -
E Reactive chemicals - - - - - - - - -
F Paints, lacquers, varnish, resins, inks, dyes, pigments, adhesives
- 0.1 - - - - - - -
G Organic solvents, solvent residues - 367 27 - - - - - -
H Pesticides (includes herbicides and insecticides) - 0.2 - - - - - - -
J Oils, hydrocarbons, emulsions - 360 10 - - - - - -
K Putrescible/organic wastes - - 27 - - - - - -
L Industrial washwaters - - - - - - - - -
M Organic chemicals - 64 - - - - - - -
N Solid/sludge wastes requiring special handling - 8,758 17 - - - - - -
R Clinical and pharmaceutical wastes - 26 - - - - - - -
T Miscellaneous - 12 - - - - - - -
Total - 16,029 133 - - - - - -

_____________________________________________________________________________________________________
5012.086—Hazardous Waste Data Assessment page 47
4.7. Australian Capital Territory
4.7.1. Tracked hazardous waste
The Australian Capital Territory has no formal hazardous waste tracking system. Waste data
provided by the Australian Capital Territory Department of Environment Protection and Water
Regulation for this study was only for interstate movements, submitted to the NEPC under the
hazardous waste NEPM reporting requirements. The Australian Capital Territory recorded 7,325
tonnes of hazardous waste generated within the state in 2010–11, for subsequent treatment/
disposal interstate. 7,325 tonnes of waste was exported and 924.9 tonnes of waste was imported
from other jurisdictions. The data is presented in summary form in Table 10. It is assumed that
the waste generation figures have been estimated using the waste export figures due to the
tonnes of waste generated being exactly equal to the tonnes of waste exported for each waste
category.
Waste composition
The composition of hazardous waste generated, exported and imported in Australian Capital
Territory is shown in the chart in Figure 9. The largest waste types by generation figures are type
‘K’ (putrescible/ organic wastes), type ‘N’ (solid/ sludge wastes requiring special handling) and
type ‘J’ (oils, hydrocarbons and emulsions).
Waste treatment and disposal
Waste treatment and disposal figures for Australian Capital Territory are shown in Table 10.
These figures relate to the ultimate treatment or disposal route of each waste type following
exportation to other jurisdictions. The Australian Capital Territory has no licensed facility for
hazardous waste treatment or disposal therefore most hazardous wastes generated within the
Australian Capital Territory are exported to New South Wales for disposal/ treatment.
Interstate waste movements
All hazardous wastes generated within the Australian Capital Territory are exported for treatment,
mainly to New South Wales. Imported wastes are organic chemicals and clinical and
pharmaceutical wastes from New South Wales and Victoria.
4.7.2. Assessment of waste tracking system data
Principles Assessment Score
Transparency—Is the data documented
and verifiable? The Australian Capital Territory has no formal waste tracking system. Data therefore not available.
Low
Comparability—Is data produced/
sourced using the same methodologies and can it be compared across jurisdictions?
No tracking system. Cannot be compared to other jurisdictions.
Low
Accuracy—Has uncertainty in data values
been minimised? Not applicable Low
Completeness—Are all data sources
within a jurisdiction identified and accounted for?
No Low
Clarity—Is information clear and easily understood?
Not applicable Low
Timeliness—Does reporting occur on a
regular basis to allow for analysis and inform decision making?
Interstate waste movements reported annually to NEPC. Intrastate data not recorded.
Medium

_____________________________________________________________________________________________________
5012.086—Hazardous Waste Data Assessment page 48
4.7.3. Non-tracked hazardous waste
All hazardous waste generated within the Australian Capital Territory is considered to be non-
tracked hazardous waste due to the absence of a formal waste tracking system.
The companion report Hazardous Waste Data Summary identifies, discusses and fills key gaps
using data from other sources, such as the Waste and Recycling in Australia 2011, which
presents national and state totals for 2008–0912
.
12 http://www.environment.gov.au/wastepolicy/publications/waste-recycling2011.html

_____________________________________________________________________________________________________
5012.086—Hazardous Waste Data Assessment page 49
Table 10—Waste tracking data summary Australian Capital Territory (2010–11)
Hazardous waste classification Waste generation
(tonnes) Interstate waste
movements (tonnes) Waste treatment/disposal (tonnes)
Code Waste description Within the
Australian Capital Territory
Exported Imported Delivered to
transfer stations
Disposed to landfill
Disposed to trade waste
Treated Energy
recovery Recycled
A Cyanides - - - - - - - - -
B Acids 471.5 471.5 - 0.1 - - - - -
C Alkaline wastes 1.1 1.1 - 0.1 - - - - -
D Inorganic chemicals 30.8 30.8 - 1.7 - - - - 30.7
E Reactive chemicals - - - - - - - - -
F Paints, lacquers, varnish, resins, inks, dyes, pigments, adhesives
34.6 34.6 - 27.0 - - - - -
G Organic solvents, solvent residues 16.9 16.9 - 9.5 - - - - -
H Pesticides (includes herbicides and insecticides)
0.3 0.3 - - - - - - -
J Oils, hydrocarbons, emulsions 1,604.0 1,604.0 - 0.9 - - - - 1,604.0
K Putrescible/organic wastes 3,104.0 3,104.0 - - - - - - 3,104.0
L Industrial washwaters - - - - - - - - -
M Organic chemicals 172.4 172.4 657.0 - - - - - 829.0
N Solid/sludge wastes requiring special handling 1,655.9 1,655.9 - 1.0 1,655.0 - - - 0.9
R Clinical and pharmaceutical wastes 143.7 143.7 267.9 - 267.9 - - - -
T Miscellaneous 90.1 90.1 - 7.5 - - - - -
Total 7,325.4 7,325.4 924.9 47.7 1,922.9 - - - 5,568.6
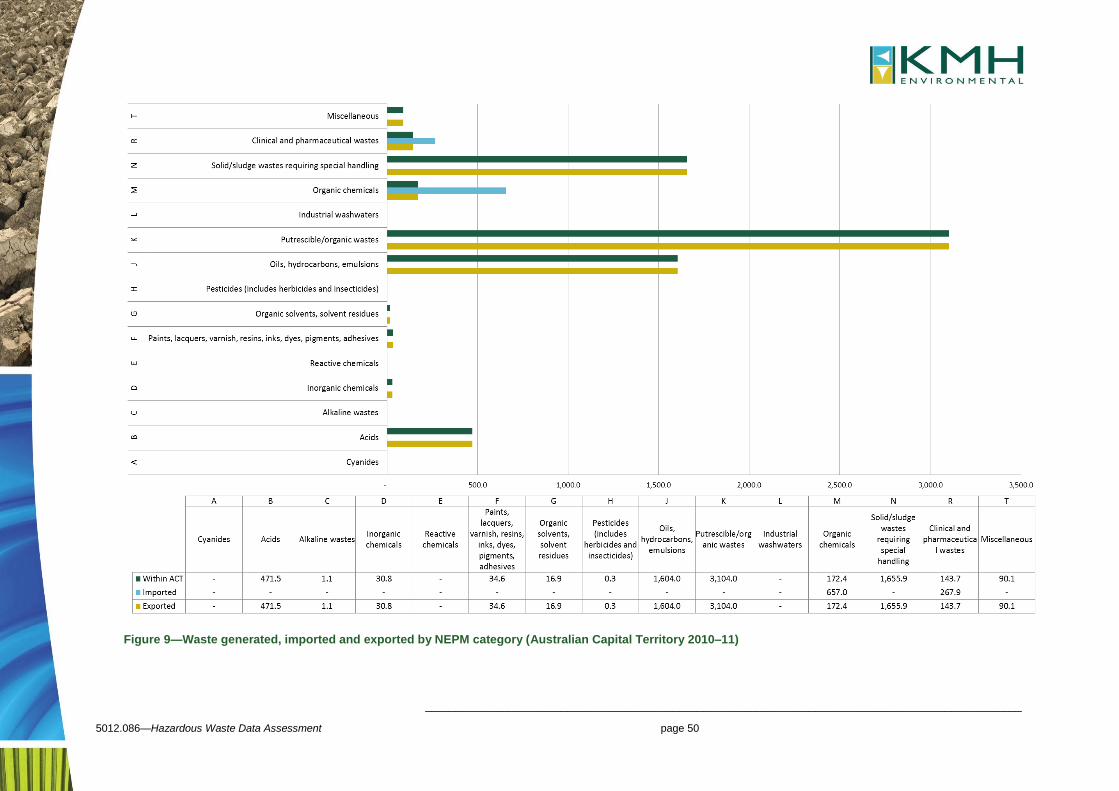
_____________________________________________________________________________________________________
5012.086—Hazardous Waste Data Assessment page 50
Figure 9—Waste generated, imported and exported by NEPM category (Australian Capital Territory 2010–11)

_____________________________________________________________________________________________________
5012.086—Hazardous Waste Data Assessment page 51
4.8. Northern Territory
4.8.1. Tracked hazardous waste
The Northern Territory does not have a formal hazardous waste tracking system and therefore no
waste data was provided for this study. Instead, data was sourced from the NEPC Annual Report
2010/11 which contains data on interstate waste movements provided by jurisdictions under the
Controlled Waste NEPM. The interstate waste data obtained for the Northern Territory for 2010–
11 is presented in summary form in Table 11. The Northern Territory exported 5,994 tonnes of
hazardous waste in 2010–11.
Waste treatment and disposal
No waste treatment or disposal data has been sourced for the NT. This is due to all hazardous
wastes generated in the Northern Territory being either stored or exported for treatment in other
jurisdictions.
4.8.2. Assessment of waste tracking system data
Principles Assessment Score
Transparency—Is the data documented
and verifiable? The Northern Territory has no hazardous waste tracking system. Data therefore not available.
Low
Comparability—Is data produced/
sourced using the same methodologies and can it be compared across jurisdictions?
No tracking system. Cannot be compared to other jurisdictions.
Low
Accuracy—Has uncertainty in data values
been minimised? Not applicable Low
Completeness—Are all data sources
within a jurisdiction identified and accounted for?
No Low
Clarity—Is information clear and easily
understood? Not applicable Low
Timeliness—Does reporting occur on a
regular basis to allow for analysis and inform decision making?
No reporting occurs. Low
4.8.3. Non-tracked hazardous waste
All hazardous waste generated within the Northern Territory is considered to be non-tracked
hazardous waste due to the absence of a formal waste tracking system.
The companion report Hazardous Waste Data Summary identifies, discusses and fills key gaps
using data from other sources, such as the Waste and Recycling in Australia 2011, which
presents national and state totals for 2008–0913
.
13 http://www.environment.gov.au/wastepolicy/publications/waste-recycling2011.html

_____________________________________________________________________________________________________
5012.086—Hazardous Waste Data Assessment page 52
Table 11—Waste data summary Northern Territory (2010–11)
Hazardous waste classification Waste
generation (tonnes)
Interstate waste movements (tonnes)
Waste treatment/disposal (tonnes)
Code Waste description Within state Exported Imported
Delivered to
transfer stations
Disposed to landfill
Disposed to trade waste
Treated Energy
recovery Recycled
A Cyanides - - - - - - - - -
B Acids - 16 - - - - - - -
C Alkaline wastes - 349 - - - - - - -
D Inorganic chemicals - 783 - - - - - - -
E Reactive chemicals - 8 - - - - - - -
F Paints, lacquers, varnish, resins, inks, dyes, pigments, adhesives
- 12 - - - - - - -
G Organic solvents, solvent residues - 85 - - - - - - -
H Pesticides (includes herbicides and insecticides) - 12 - - - - - - -
J Oils, hydrocarbons, emulsions - 3,741 - - - - - - -
K Putrescible/organic wastes - 149 - - - - - - -
L Industrial washwaters - - - - - - - - -
M Organic chemicals - 9 - - - - - - -
N Solid/sludge wastes requiring special handling - 286 - - - - - - -
R Clinical and pharmaceutical wastes - 142 - - - - - - -
T Miscellaneous - 403 - - - - - - -
Total - 5,994 - - - - - - -

_____________________________________________________________________________________________________
5012.086—Hazardous Waste Data Assessment page 53
4.9. Hazardous ‘contamination’ of other waste streams
In addition to the known quantities of hazardous waste determined from formal waste tracking, a
poorly monitored source of hazardous waste is that disposed of within the MSW, C&I and C&D
waste streams. The following section provides a summary of the available information and data
surrounding these wastes.
Despite these wastes accounting for a minor proportion of the total hazardous waste generated
in Australia it was considered important to account for hazardous waste in these streams as far
as practically possible in order to gain a complete picture.
4.9.1. Municipal Solid Waste
According to waste audit data obtained from New South Wales Government audits in 2007/08 of
domestic waste bins, approximately 1.9% of MSW is hazardous content. If we apply this figure to
the total MSW generated in Australia annually (12.7 million tonnes per annum in 2010/11) it
equates to a total of 241,000 tonnes of hazardous waste per annum generated from Australian
households. Consequently, none of this material is accounted for in state and territory tracking
system data. It is also noted that this volume does not account for the amount that is disposed to
sewer.
Types of hazardous waste commonly found within municipal solid waste include the following:
acids
aerosols (CFC-based, paints, lacquers, pesticides etc.)
alkalis
batteries (lead acid and dry cell)
compact fluorescent lamps and fluorescent tubes
cyanides
engine coolants and glycols
fire extinguishers
flammable liquids (e.g. hydrocarbons and fuels)
flammable solids
flares
gas cylinders
general household chemicals (e.g. cleaning products)
heavy metal compounds
inorganic oxidising agents (e.g. pool chlorine)
low level radioactive substances (e.g. smoke detectors)
mercury (e.g. thermometers)
organic peroxides
paint
PCB materials
pesticides
solvents.
In recognition of this problem, several jurisdictions have implemented hazardous waste drop-off
programs whereby designated hazardous waste drop-off points have been provided for the public
to dispose of hazardous waste materials that are generated domestically. The Detox Your Home
scheme in Victoria and the Household Hazardous Clean-Out program in New South Wales are
examples of such programs. Both initiatives have been operating for several years and have
acquired a significant amount of data on the quantity and composition of hazardous waste
generated within the home.
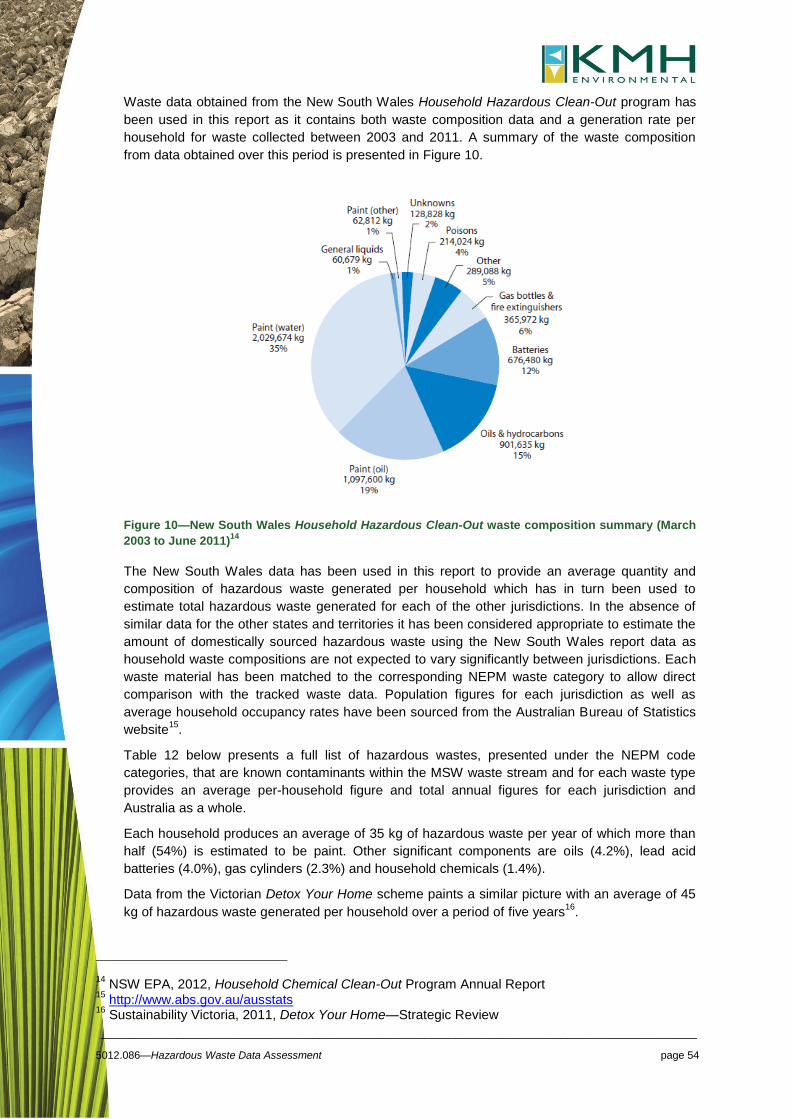
_____________________________________________________________________________________________________
5012.086—Hazardous Waste Data Assessment page 54
Waste data obtained from the New South Wales Household Hazardous Clean-Out program has
been used in this report as it contains both waste composition data and a generation rate per
household for waste collected between 2003 and 2011. A summary of the waste composition
from data obtained over this period is presented in Figure 10.
Figure 10—New South Wales Household Hazardous Clean-Out waste composition summary (March
2003 to June 2011)14
The New South Wales data has been used in this report to provide an average quantity and
composition of hazardous waste generated per household which has in turn been used to
estimate total hazardous waste generated for each of the other jurisdictions. In the absence of
similar data for the other states and territories it has been considered appropriate to estimate the
amount of domestically sourced hazardous waste using the New South Wales report data as
household waste compositions are not expected to vary significantly between jurisdictions. Each
waste material has been matched to the corresponding NEPM waste category to allow direct
comparison with the tracked waste data. Population figures for each jurisdiction as well as
average household occupancy rates have been sourced from the Australian Bureau of Statistics
website15
.
Table 12 below presents a full list of hazardous wastes, presented under the NEPM code
categories, that are known contaminants within the MSW waste stream and for each waste type
provides an average per-household figure and total annual figures for each jurisdiction and
Australia as a whole.
Each household produces an average of 35 kg of hazardous waste per year of which more than
half (54%) is estimated to be paint. Other significant components are oils (4.2%), lead acid
batteries (4.0%), gas cylinders (2.3%) and household chemicals (1.4%).
Data from the Victorian Detox Your Home scheme paints a similar picture with an average of 45
kg of hazardous waste generated per household over a period of five years16
.
14 NSW EPA, 2012, Household Chemical Clean-Out Program Annual Report
15 http://www.abs.gov.au/ausstats
16 Sustainability Victoria, 2011, Detox Your Home—Strategic Review

_____________________________________________________________________________________________________
5012.086—Hazardous Waste Data Assessment page 55
Table 12—Hazardous wastes estimated in the MSW stream by NEPM waste category for each jurisdiction
NEPM category
Waste items within category
Waste per household (kg/annum)
State/territory totals (tonnes/annum) National total
(tonnes/annum New South Wales
Victoria Queensland South
Australia Western Australia
Tasmania Northern Territory
Australian Capital Territory
B100 Acids 0.3 829.8 636.6 517.8 188.9 263.2 58.3 26.3 41.3 2,562.10
B100/ D220
Lead acid batteries 4 11,177.50 8,574.20 6,973.90 2,544.40 3,545.80 784.7 354.4 555.6 34,510.50
C100 Alkalis 0.2 590.3 452.8 368.3 134.4 187.3 41.4 18.7 29.3 1,822.60
D120 Fluorescent tubes 0 129.8 99.5 81 29.5 41.2 9.1 4.1 6.5 400.7
D130 Arsenic-based products 0 41.1 31.5 25.6 9.3 13 2.9 1.3 2 126.8
D150/ D210
Nickel cadmium batteries 0 51.5 39.5 32.1 11.7 16.3 3.6 1.6 2.6 159.1
D210 Nickel hydride batteries 0 13.5 10.4 8.4 3.1 4.3 0.9 0.4 0.7 41.8
D261 Photographic chemicals 0.1 297.4 228.1 185.6 67.7 94.3 20.9 9.4 14.8 918.3
D390 Heavy metals 0 25 19.2 15.6 5.7 7.9 1.8 0.8 1.2 77.3
E100 Oxidising agents 0.1 264.9 203.2 165.3 60.3 84 18.6 8.4 13.2 817.8
E120 Gas cylinders (inc. propane), aerosols, flares, ammunition
2.3 6,453.50 4,950.50 4,026.50 1,469.10 2,047.20 453 204.6 320.8 19,925.20
E130 Reactives 0 24.8 19 15.5 5.6 7.9 1.7 0.8 1.2 76.5
F100 Water-based paints 12.4 34,317.90 26,325.30 21,411.80 7,812.00 10,886.50 2,409.20 1,088.20 1,705.90 105,956.80
F100/ F120
Paints (other) 0.4 1,062.00 814.7 662.6 241.8 336.9 74.6 33.7 52.8 3,279.00
F120 Oil-based paints 6.7 18,558.30 14,236.10 11,579.00 4,224.60 5,887.20 1,302.80 588.5 922.5 57,299.00
G150 Halogenated solvents 0 138.2 106 86.2 31.5 43.8 9.7 4.4 6.9 426.7
G160 Organo peroxides 0 8.9 6.8 5.5 2 2.8 0.6 0.3 0.4 27.5
H160 Pesticides (liquid and solid forms)
0.6 1,798.30 1,379.50 1,122.00 409.4 570.5 126.2 57 89.4 5,552.20
J100 Oils 4.2 11,539.90 8,852.20 7,200.00 2,626.90 3,660.70 810.1 365.9 573.6 35,629.40
J110 Hydrocarbons and fuels 1.3 3,705.00 2,842.10 2,311.70 843.4 1,175.30 260.1 117.5 184.2 11,439.30
J170 Automotive products 0.3 841.3 645.3 524.9 191.5 266.9 59.1 26.7 41.8 2,597.40
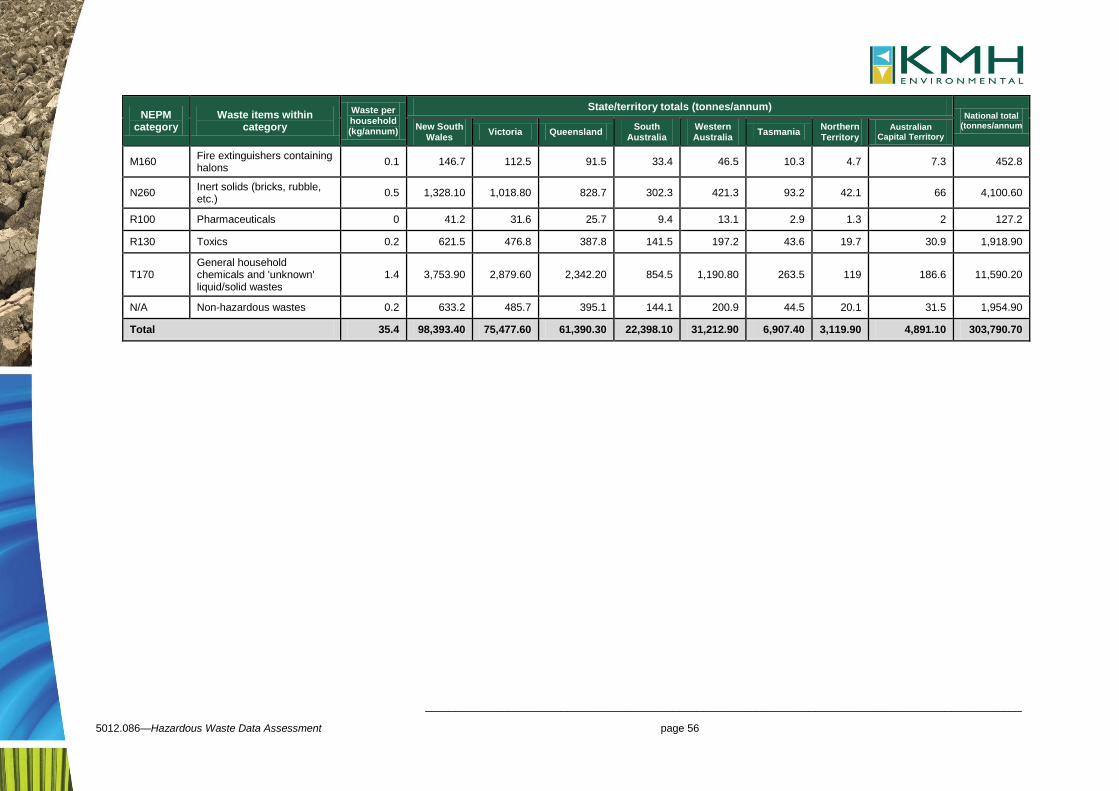
_____________________________________________________________________________________________________
5012.086—Hazardous Waste Data Assessment page 56
NEPM category
Waste items within category
Waste per household (kg/annum)
State/territory totals (tonnes/annum) National total
(tonnes/annum New South Wales
Victoria Queensland South
Australia Western Australia
Tasmania Northern Territory
Australian Capital Territory
M160 Fire extinguishers containing halons
0.1 146.7 112.5 91.5 33.4 46.5 10.3 4.7 7.3 452.8
N260 Inert solids (bricks, rubble, etc.)
0.5 1,328.10 1,018.80 828.7 302.3 421.3 93.2 42.1 66 4,100.60
R100 Pharmaceuticals 0 41.2 31.6 25.7 9.4 13.1 2.9 1.3 2 127.2
R130 Toxics 0.2 621.5 476.8 387.8 141.5 197.2 43.6 19.7 30.9 1,918.90
T170 General household chemicals and 'unknown' liquid/solid wastes
1.4 3,753.90 2,879.60 2,342.20 854.5 1,190.80 263.5 119 186.6 11,590.20
N/A Non-hazardous wastes 0.2 633.2 485.7 395.1 144.1 200.9 44.5 20.1 31.5 1,954.90
Total 35.4 98,393.40 75,477.60 61,390.30 22,398.10 31,212.90 6,907.40 3,119.90 4,891.10 303,790.70

_____________________________________________________________________________________________________
5012.086—Hazardous Waste Data Assessment page 57
4.9.2. Commercial and Industrial Waste
Due to the highly variable nature of wastes arising from the commercial and industrial (C&I) sector it is
difficult to quantify the hazardous ‘contamination’ component of the C&I waste stream.
Data on this waste stream is limited to a number of C&I waste audit data sets which capture a
snapshot of waste from a particular locality or industry sector. This is not considered to be strong
enough evidence to produce a robust estimate of the hazardous waste component of C&I waste that is
not already captured in waste tracking systems.
An audit conducted by A Prince Consulting in 2007 of C&I waste in Central Queensland found that
approximately 0.3% of the C&I waste audited from 195 businesses was classed as hazardous or
special waste17
. The audit included businesses from a range of industries including the educational,
agricultural, accommodation, manufacturing and retail sectors. The overall composition of waste from
all businesses audited is shown at Figure 11 below. The composition of the hazardous waste fraction
was not recorded in the audit.
Figure 11—C&I waste composition based on audit of 195 Central Queensland businesses
Landfill-based audits of the C&I and C&D waste streams conducted in 2007 for the Western Australian
Department of Environment and Conservation found that approximately 1% of these combined waste
streams received at the audited sites was classed as hazardous material18
.
17 A Prince Consulting, 2007, Commercial and Industrial Waste Audit for the Central Queensland
Government 18
Golder Associates, 2007, Disposal based audits of the C&I and C&D waste streams

_____________________________________________________________________________________________________
5012.086—Hazardous Waste Data Assessment page 58
4.9.3. Construction and Demolition Waste
The hazardous component of construction and demolition waste comprises of contaminated soils and
asbestos. It is noted that in those jurisdictions that classify these wastes as hazardous they are
captured within their tracking system, should they have one.
Table 13 presents a data summary of the C&D Waste Status Report conducted by Hyder Consulting
for materials recovered and disposed in each Australian jurisdiction for the 2008–09 financial year.
Table 13—Total hazardous waste within the C&D waste stream by jurisdiction for 2008–09 (Hyder 2011)
Waste type New South
Wales Queensland Victoria Western Australia
South Australia Tasmania
Northern Territory
Australian Capital
Territory
Contaminated soils 313,269 370,576 291,665 7,022 55,068 9,803 unknown 8,394
Asbestos 221,046 261,485 205,803 - 27,679 6,917 unknown 5,547
Total hazardous waste 534,315 632,061 497,468 7,022 82,747 16,720 unknown 13,941
Total C&D waste 6,717,051 3,448,494 3,624,168 2,895,767 1,833,551 68,073 195,339 215,117
% hazardous 8% 18% 14% 0% 5% 25% - 6%
4.9.4. Reporting of hazardous waste within the MSW, C&I and C&D waste streams
The extent to which hazardous waste volumes are currently reported within the MSW, C&D and C&I
waste streams has to date been minimal due to the lack of data available. The National Waste Report
2010 did not include hazardous waste for this reason. Reporting of hazardous waste within the MSW,
C&I and C&D waste streams instead of separately as a ‘hazardous waste’ stream would require
separating the hazardous waste stream into its constituent parts based on the likely source of each
waste category (i.e. the C&I, MSW or C&D sector). This would increase the total waste generation
figures for each of these streams with the greatest impact being on the C&I and C&D waste streams.

_____________________________________________________________________________________________________
5012.086—Hazardous Waste Data Assessment page 59
4.10. National Data Summary
Sections 4.10.1 to 4.1.3 collate jurisdictional data into a national summary of the hazardous waste
generated and disposed/ treated in Australia for 2010–11, as sourced from interstate and intrastate
tracking systems. Section 4.10.4 combines this tracked data with the stream contamination data
estimated in Section 4.9, to allow a comparative analysis.
The table in Appendix B provides a summary of the waste categories that are tracked by each
jurisdiction and the form of tracking implemented for each category. Waste categories that are tracked
under a jurisdiction’s formal waste tracking system are labelled as ‘tracked’. Wastes that are not
tracked under any form of system are either labelled as ‘not tracked’ or where they are only tracked
when transported interstate as ‘interstate only’. Certain waste categories may not be relevant to a
particular jurisdiction and these are labelled ‘not applicable’ (N/A).
4.10.1. Hazardous waste generation (tracked)
According to the data obtained from each of the eight jurisdictions, the total tracked hazardous waste
generated across Australia during 2010–11 is estimated to be 4,097,047 tonnes, of which only 92,921
tonnes (2%) was recorded in interstate (NEPM) tracking systems. The chart in Figure 12 below shows
how hazardous waste generation was distributed across each state and territory.
Figure 12—Hazardous waste generation by state and territory in 2010–11 (tracked/reported waste data)
Given the relative populations19
of New South Wales (7,222,000), Victoria (5,540,000) and
Queensland (4,506,000), the latter jurisdiction’s large contribution appears unexpected relative to the
others. Similarly, New South Wales appears surprisingly low. Observation, analysis and interpretation
of possible data anomalies such as these are provided in the companion document, the Hazardous
Waste Data Summary.
19 ABS, 2010

_____________________________________________________________________________________________________
5012.086—Hazardous Waste Data Assessment page 60
Figure 13 provides a breakdown of the total tracked hazardous waste generated in 2010–11 by NEPM
waste category.
Figure 13—Total tracked hazardous waste generation by waste category (national total 2010–11)
4.10.2. Hazardous waste treatment and disposal
Figure 14 provides a breakdown of the method of treatment/ disposal for the total tracked hazardous
waste generated in 2010–11. Due to the extensive gaps in treatment/disposal data—for some
jurisdictions there is no information available at the destination end—and the potential for double-
counting where wastes undergo primary treatment before secondary treatment/disposal, it is difficult to
draw broader conclusions on the treatment side of hazardous waste at a national level.
Figure 14—Hazardous waste treatment/ disposal (national total 2010–11)
4.10.3. Interstate waste movements
The interstate waste data provided by jurisdictions for this report was limited to total tonnages of waste
imported and exported for each jurisdiction. Geographical information including the destination of
waste loads has not been provided and therefore it has not been possible to determine the ultimate

_____________________________________________________________________________________________________
5012.086—Hazardous Waste Data Assessment page 61
destinations of waste loads exported from each state and territory using the data. Instead, the NEPM
report data has been used to understand the major waste types that are transported interstate and the
origin and destination of these wastes.
4.10.4. Comparison of hazardous waste—tracked versus MSW stream
Hazardous waste data, compiled across Australia from both inter- and intrastate tracking systems, and
estimated to be contributed from the MSW stream, is detailed in Table 14.
A total of 4,398,883 tonnes of hazardous waste was generated in Australia in 2010–11 from:
jurisdictional intrastate tracking systems (4,033,475 tonnes)
jurisdictional interstate tracking systems (63,572 tonnes)
estimates from ‘contamination’ of the MSW stream (301,836 tonnes).
A total of 4,097,047 tonnes of hazardous waste was generated in 2010–11 from both jurisdictional
intrastate and interstate tracking systems, with only 2% of all tracked data coming from interstate
movements under the Controlled Waste NEPM.
KMH’s estimate of hazardous waste in the MSW of 301,836 tonnes corresponds to 7% of the
combined total of tracked and MSW-contributed hazardous waste (4,398,883 tonnes).
While a figure of 7% is not insignificant for MSW, the following wastes are estimated to contribute a
significant amount to their own national totals compared with tracked contributions of the same waste:
B Acids (43%), made up predominantly of lead acid batteries
E Reactive chemicals (93%), made up predominantly of gas cylinders
F Paints (77%)
H Pesticides (includes herbicides and insecticides) (59%).
The companion Hazardous Waste Data Summary takes the data presented in this section, fills key
gaps in tracking data using data from other sources (such as the Waste and Recycling in Australia
2011) and recasts these national and state totals for 2010–11.

_____________________________________________________________________________________________________
5012.086—Hazardous Waste Data Assessment page 62
Table 14—Tracked and MSW derived hazardous waste generation (national total 2010–11)
Hazardous Waste Classification Waste generated (tonnes)
Code Waste description Intrastate tracking systems
Interstate tracking systems
Total tracked
From MSW
Total (all tracked +
MSW)
% MSW of total
A Cyanides 7,917 35 7,952 0 7,952 0%
B Acids 37,165 11,996 49,162 37,073 86,234 43%
C Alkaline wastes 266,759 849 267,608 1,823 269,430 1%
D Inorganic chemicals 295,807 35,361 331,168 1,724 332,892 1%
E Reactive chemicals 1,462 8 1,470 20,820 22,290 93%
F Paints, lacquers, varnish, resins, inks, dyes, pigments, adhesives 44,441 3,917 48,358 166,535 214,893 77%
G Organic solvents, solvent residues 27,985 2,309 30,295 454 30,749 1%
H Pesticides (includes herbicides and insecticides) 2,606 1,294 3,901 5,552 9,453 59%
J Oils, hydrocarbons, emulsions 601,848 12,041 613,889 49,666 663,555 7%
K Putrescible/organic wastes 1,424,792 8,695 1,433,488 0 1,433,488 0%
L Industrial washwaters 88,698 7 88,705 0 88,705 0%
M Organic chemicals 18,553 1,603 20,156 453 20,609 2%
N Solid/sludge wastes requiring special handling 1,062,490 13,359 1,075,849 4,101 1,079,949 0%
R Clinical and pharmaceutical wastes 59,946 909 60,856 2,046 62,902 3%
T Miscellaneous 63,655 536 64,191 11,590 75,781 15%
Total
4,004,126 92,921 4,097,047 301,836 4,398,883 7%

_____________________________________________________________________________________________________
5012.086—Hazardous Waste Data Assessment page 63
5. Cost of hazardous waste management
The following section provides a summary of the costs associated with hazardous waste management
in Australia presented on a state-by-state basis.
Hazardous waste management costs in Australia for the waste generator can include:
a landfill levy component
special fees for the treatment of waste before disposal
special fees for the transport of waste before disposal.
Hazardous waste management costs in Australia for waste facilities accepting hazardous wastes
can include:
licence application and annual fees
additional licence fees based on the ‘load’ of pollutants in the hazardous material
special fees for the treatment of waste before disposal
special fees for the transport of waste before disposal.
This information has been summarised in Figure 15 below.
Figure 15—Summary of hazardous waste management cost components across Australian states and
territories
Fees for hazardous waste management differ in value across the states and territories, but also differ
in the types of waste streams to which the hazardous waste management fees are applied. Table
presents a comparison of the hazardous waste management costs for each jurisdiction.
Table 5 demonstrates landfill levies apply for hazardous waste disposed in:
New South Wales
Victoria
South Australia
Western Australia.
Hazardous waste
management costs for waste
generators
•Landfill levies
•Special fees for waste treatment before disposal
•Special fees for waste transport for disposal
Hazardous waste
management costs for waste
facilities accepting
hazardous wastes
•Licence applications and annual fees
•Additional licence fees based on pollutant load
•Special fees for waste treatment for disposal
•Special fees for waste transport for disposal

_____________________________________________________________________________________________________
5012.086—Hazardous Waste Data Assessment page 64
However, all states and territories have licensing and some other special fees for organisations that
store, transport, treat, process, recycle and dispose of hazardous waste. The following analysis of
hazardous waste management costs, however, does not take into account the costs for the states’ and
territories’ EPAs and the economic, social and environmental externalities created through the
management of hazardous waste as was analysed in the EPA Victoria March 2009 Draft Environment
Protection (Industrial Waste Resource) Regulations Regulatory Impact Statement (RIS)20
. In this RIS,
the costs for the Environment Protection Agencies included staff incomes and overhead costs and the
economic, social and environmental externalities included the costs of:
inappropriate disposal
reuse/recycling
prescribed industrial waste used as an energy source
prescribed industrial waste disposed at Lyndhurst landfill21
prescribed industrial waste disposed at a municipal or public landfill.
Table 15—Comparison of jurisdictional hazardous waste management costs
State/territory Landfill levy charges/hazardous waste management costs
New South Wales
Levy category Levy rates 2011–12 ($/tonne)
Sydney metropolitan area (solid and other wastes) 82.20
Extended regulated area (solid and other wastes) 78.60
Regional regulated area (solid and other wastes) 31.10
Trackable liquid waste 64.50
Victoria
Prescribed industrial waste disposed to landfill Amount as at 1 July 2011
($/tonne)
Category A Prohibited from disposal to landfill —
levy does not apply
Category B—includes waste from manufacturing industries and contaminated soils
250
Category C—includes wastes which pose a low hazard from manufacturing industries and contaminated soils
70
Packaged waste asbestos—levy remains as previously scheduled to encourage safe handling and disposal of asbestos
30
Queensland
Type of waste Amount ($/tonne) until 30 June
2012
Leviable waste delivered to a site
Regulated waste—other 35
Regulated waste—low hazard 50
Regulated waste—high hazard 150
Waste delivered from resource recovery areas
Regulated waste—low hazard 50
Regulated waste—high hazard 150
Stockpiled waste disposed of as landfill
Regulated waste—low hazard 50
Regulated waste—high hazard 150
20 PricewaterhouseCoopers for EPA Victoria. (2009), Draft Environment Protection (Industrial Waste Resource) Regulations
Regulatory Impact Statement, Publication 1275, March 2009. 21
SITA’s Taylors Road Landfill (sometimes referred to as TRL or Lyndhurst Landfill) is the only facility in Victoria license to receive a broad range of solid prescribed industrial waste classified as Category B in accordance to EPA Victoria’s Industrial Waste Resource Guidelines. As detailed at: www.sita.com.au/facilities/landfills/taylors-road-landfill/

_____________________________________________________________________________________________________
5012.086—Hazardous Waste Data Assessment page 65
Tasmania No state waste levies
South Australia
Type of waste Amount as of 2011–12 ($/tonne)
Solid waste—for a non-metropolitan depot disposing of non-metropolitan waste (non-metro rate)
17.50
Solid waste—for a metropolitan depot disposing of non-metropolitan waste brought to the depot by or on behalf of a wholly non-metropolitan council (non-metro rate)
17.50
Solid waste— metro rate 35.00
Liquid waste 11.25
Western Australia
(only applied to metropolitan waste loads)
Facility type Amount as of 01/01/2010
Inert landfills—Category 63 $12/cubic metre
Putrescible landfills—Category 64 (putrescible) and Category 65 (hazardous)
$28/tonne
Australian Capital
Territory
(no territory waste levies)
Landfill fees for special waste Amount as of 01/07/2011
Asbestos or products containing asbestos (by arrangement) from commercial sources—less than 0.25 tonnes
$34.20
Asbestos or products containing asbestos (by arrangement)— 0.25 tonne or more; or arriving at the landfill in a package larger than 80 cm x 80 cm
$ 136.80/ tonne
Burials requiring special arrangements less than 0.5 tonnes (e.g. product destruction, supervised or immediate burial including meat, fish or other animal processing wastes, low level radioactive waste, sewage ash or grit, asbestos, hydrocarbons)
$76.60
Burials requiring special arrangements 0.5 tonnes or more (e.g. product destruction, supervised or immediate burial including meat, fish or other animal processing wastes, low level radioactive waste, sewage ash or grit, asbestos, hydrocarbons)
$153.20/ tonne
Northern Territory
(no territory waste levies)
Weighbridge fees and charges at Shoal Bay Waste Disposal Site - commercial
Amount as of 2011-12
Special waste $135/tonne

_____________________________________________________________________________________________________
5012.086—Hazardous Waste Data Assessment page 66
5.1. New South Wales
In New South Wales, the same landfill levy rate applies for all types of wastes, except trackable liquid
wastes and coal wash reject, which is charged at a different rate, as shown in Table 16—6. The landfill
levy rate applied depends on the geographical area of the source and reception point for the waste as
indicated in Table 157.
Table 16—Landfill levy rates in New South Wales22
NSW landfill levy category Levy rates 2012–13
(per tonne)
Sydney Metropolitan Area (SMA)
$ 95.20
Extended Regulated Area (ERA)
$ 93.00
Regional Regulated Area (RRA)
$ 42.40
Trackable liquid waste $ 66.60
Coal washery reject $ 16.20
Table 157—Method by which the New South Wales landfill levy is calculated and applied23
Waste source Waste received in Applicable levy rate
SMA SMA SMA
SMA ERA SMA
SMA RRA SMA
SMA Rest of New South Wales SMA
ERA SMA SMA
ERA ERA ERA
ERA RRA ERA
ERA Rest of New South Wales ERA
RRA SMA SMA
RRA ERA ERA
RRA RRA RRA
RRA Rest of New South Wales RRA
Rest of New South Wales SMA SMA
Rest of New South Wales ERA ERA
Rest of New South Wales RRA RRA
Other costs involved in the management of hazardous wastes are licensing fees that need to be paid
based on the type of waste generated, transport, stored, treated or disposed. Apart from annual
administrative fees on these licenses, some licenses will also require payment of annual load-based
fees. The administrative fee is calculated according to the nature, size and/or capacity of the activity
22 New South Wales EPA. (2012), ‘Waste and environment levy’, New South Wales EPA Website, available:
www.environment.nsw.gov.au/wr/index.htm [19.10.2012] 23
New South Wales EPA. (2009), Waste and Environment Levy – Operational Guidance Notes, Version 2.1, December 2009, available: www.environment.nsw.gov.au/resources/waste/09813wastelevyguide.pdf [19.10.2012]

_____________________________________________________________________________________________________
5012.086—Hazardous Waste Data Assessment page 67
undertaken. Further load-based fees only apply to those activities that have assessable pollutants.
Determining the load-based fee involves understanding the:
amount of assessable pollutants
types of pollutants an activity releases into the environment
conditions in the receiving environment24
.
Load-based licensing fees are calculated according to
Equation 1 below25
.
Equation 1—Load fee calculation formula
Or where the assessable load is greater than the free rate threshold:
(( ) )
Each component of these equations is explained in more detail on the NSW EPA Website26
.
Schedule 1 of the New South Wales Protection of the Environment Operations (General) Regulation
2009 lists all the licensed activities and the associated administrated and load-based licensing fees.
The fees related to hazardous waste management are detailed in Table 168 below. The cost per fee
unit is $113, as of 1 July 201227
and KMH has calculated the total administrative fee for each selected
activity shown in the table.
24 New South Wales EPA. (2012), ‘Licence fees’, New South Wales EPA Website, available:
www.environment.nsw.gov.au/licensing/licencefees.htm [19.10.2012] 25
New South Wales EPA. (2012), ‘Load fee calculation formula’, New South Wales EPA Website, available: www.environment.nsw.gov.au/licensing/lbl/feeformula.htm [19.10.2012] 26
New South Wales EPA. (2012), ‘Load fee calculation formula’, New South Wales EPA Website, available: www.environment.nsw.gov.au/licensing/lbl/loadfeecalc.htm [19.10.2012] 27
New South Wales EPA. (2012), Guide to Licensing – Under the Protection of the Environment Operations Australian Capital Territory 1997 – Part A, available: www.environment.nsw.gov.au/resources/licensing/09719licenceguideA.pdf [19.10.2012]

_____________________________________________________________________________________________________
5012.086—Hazardous Waste Data Assessment page 68
Table 168—Extract from Schedule 1, New South Wales Protection of the Environment Operations (General) Regulation 2009
Activity Units of measure
Administrative fee Load-based fee
Annual capacity/ Type of material
recovered
Administrative fee units
Administrative fee cost
Air pollutants Threshold factor Water
pollutants Threshold
factor
Energy recovery from hazardous and
other waste
Tonnes Any capacity 65 $7,345.00
Arsenic 0.00005
Nil N/A
Benzene 0.0000011
Benzo(a)pyrene 0.00002
Fine particulates 0.7
Lead 0.035
Mercury 0.003
Nitrogen oxides and nitrogen oxides (summer)
2.5
Sulfur oxides 0.07
Recovery of hazardous and
other waste N/A
Hazardous and other
waste 32 $3,616.00
There are no assessable pollutants and therefore no load-based fee in relation to this activity.
Recovery of waste oil
Tonnes
Not more than 1,000 tonnes
recovered 25 $2,825.00 Lead 0.2
Oil and grease
4.8 More than 1,000 tonnes recovered
65 $7,345.00 VOCs and VOCs (summer) 0.05
Recovery of waste tyres
N/A Waste tyres 12 $1,356.00 There are no assessable pollutants and therefore no load-based fee in relation to
this activity.
Thermal treatment of
hazardous and other waste
N/A Any capacity 65 $7,345.00
Arsenic 0.00005
Nil N/A Benzene 0.0000011
Benzo(a)pyrene 0.00002
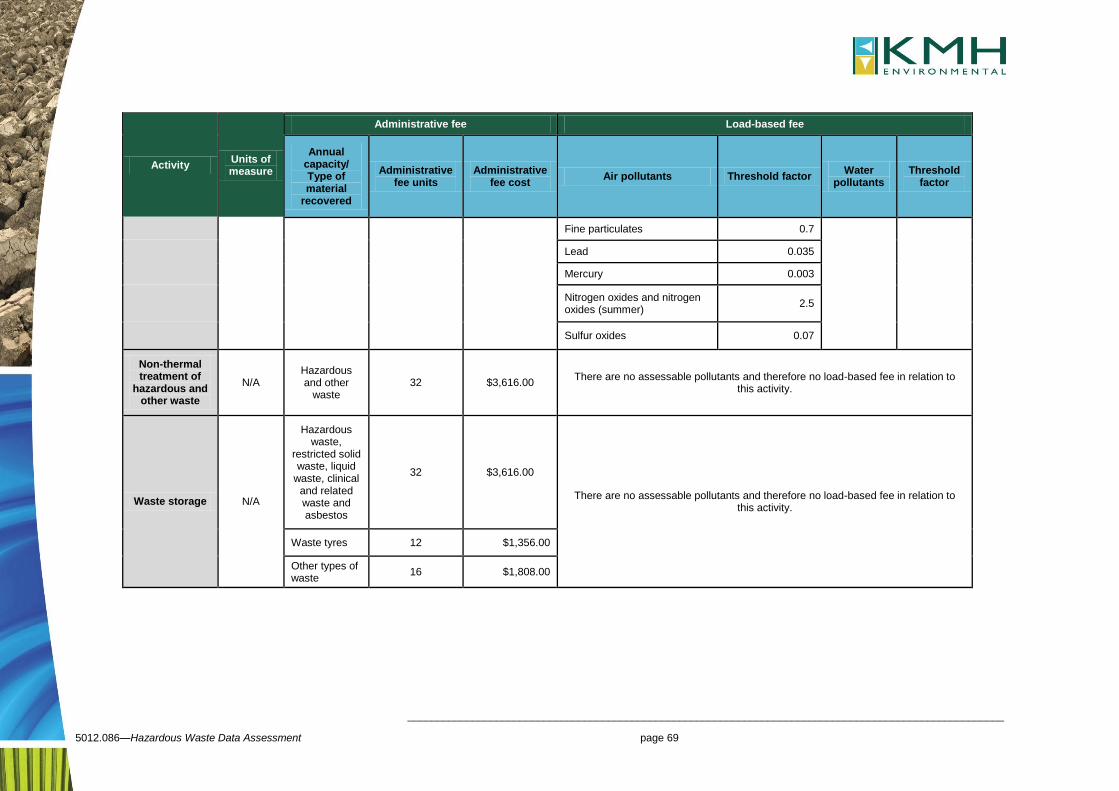
_____________________________________________________________________________________________________
5012.086—Hazardous Waste Data Assessment page 69
Activity Units of measure
Administrative fee Load-based fee
Annual capacity/ Type of material
recovered
Administrative fee units
Administrative fee cost
Air pollutants Threshold factor Water
pollutants Threshold
factor
Fine particulates 0.7
Lead 0.035
Mercury 0.003
Nitrogen oxides and nitrogen oxides (summer)
2.5
Sulfur oxides 0.07
Non-thermal treatment of
hazardous and other waste
N/A Hazardous and other
waste 32 $3,616.00
There are no assessable pollutants and therefore no load-based fee in relation to this activity.
Waste storage N/A
Hazardous waste,
restricted solid waste, liquid
waste, clinical and related waste and asbestos
32 $3,616.00
There are no assessable pollutants and therefore no load-based fee in relation to this activity.
Waste tyres 12 $1,356.00
Other types of waste
16 $1,808.00

_____________________________________________________________________________________________________
5012.086—Hazardous Waste Data Assessment page 70
5.2. Victoria
The Victorian Government’s Environment Protection (Amendment) Act 2006 introduced differential
levies for the disposal of prescribed industrial waste (PIW) to landfill, to reflect the hazard level of the
different waste categories. Levy revenues are being reinvested in EPA programs to encourage
industry to find safe reuse alternatives to disposal. The differential PIW levies are detailed in Table
19—19 below.
Table 19—Victorian Prescribed Industrial Waste levies28
Prescribed industrial waste disposed to landfill
Amount as at 1 July 2011 (per tonne)
Category A Prohibited from disposal to landfill—levy does not apply
Category B—includes waste from
manufacturing industries and contaminated soils
$ 250
Category C—includes wastes which
pose a low hazard from manufacturing industries and contaminated soils
$ 70
Packaged waste asbestos—levy
remains as previously scheduled to encourage safe handling and disposal of asbestos
$ 30
In addition, facilities that accept prescribed industrial waste need to pay an annual licence fee for
prescribed waste received specifically. Annual licence fees for discharges to the atmosphere, water
and land are calculated and charged separately. Table 170 below details the method used to calculate
these prescribed waste fees for waste facilities.
28 EPA Victoria. (2012), ‘Landfill and prescribed waste levies’, EPA Victoria Website, available: www.epa.vic.gov.au/your-
environment/waste/landfills/landfill-and-prescribed-waste-levies [19.10.2012]

_____________________________________________________________________________________________________
5012.086—Hazardous Waste Data Assessment page 71
Table 17—EPA Victoria method for calculating Prescribed Waste Fees29
Step Component Units Ref. Calculation Ref.
1.1 Weight of prescribed industrial waste received in the previous financial year
tonnes Wp $
(Wp x 0.103 x 12.22) Wp1
1.2
Weight of prescribed industrial waste processed for re-use in the previous financial year
If prescribed industrial waste was not processed for reuse or Wp1 is less than $818.10 go to 1.4.
tonnes WR $
(WR x 0.103 x 12.22) WR1
1.3
Reduced fee due to reuse
Is WR1 greater than 50% of Wp1?
Yes = greater than 50% of Wp1 or $818.10
No = greater of Wp1-WR1 or $818.10
$ RF
1.4 Total assessed fee = Wp1 or RF for re-use
rounded to the nearest 10 cents $ F
1.5 Environment Protection Levy = 0.03 x F
rounded to the nearest 10 cents $ L
1.6 Estimated amount payable = F + L $
5.3. Queensland
The former Queensland State Government had proposed an industry waste disposal levy in
Queensland’s Waste Reduction and Recycling Strategy 2010–2030
. As a part of this Strategy, the
levies detailed in Table 181 below were due to be charged for various hazardous waste streams. In
Queensland, regulated waste classified as lower-hazard for levy collection purposes would have
included household and business organic wastes. Higher-hazard regulated waste would include
asbestos or chemical residues from industrial processes31
.
Table 18—Industry waste disposal levies with regard to regulated waste management from Queensland’s
former Waste Reduction and Recycling Strategy 2010–20
Waste stream Levy $/tonne disposed
Contaminated and acid sulphate soils $35
Lower hazard regulated waste $50
Higher hazard regulated waste $150
The current Queensland State Government repealed this industry waste disposal levy on 30 June
2012. However, license fees for facilities that carry out Environmentally Relevant Activities” of
recycling, processing, storing, transporting, treatment and/or disposal of regulated waste still apply.
These annual licence fees are detailed in
29 EPA Victoria. (2001), ‘Prescribed Waste Fee Calculation Form’, pursuant to regulation 11 of the Environment Protection
(Fees) Regulations 2001, available: www.epa.vic.gov.au/en/business-and-industry/forms/~/media/Files/forms/Docs/prescribedwastefeecalculation.pdf [19.10.2012] 30 Queensland Department of Environment and Resource Management. (2010), Queensland’s Waste Reduction and Recycling Strategy 2010-2020, December 2010, available:
www.ehp.Queensland.gov.au/waste/pdf/waste-strategy.pdf [19.10.2012]
31 Ibid.

_____________________________________________________________________________________________________
5012.086—Hazardous Waste Data Assessment page 72
Table 2 below.

_____________________________________________________________________________________________________
5012.086—Hazardous Waste Data Assessment page 73
Table 22—Extract from Queensland Department of Environment and Heritage Protection summary of
annual fees for Environmentally Relevant Activities32
Activity Annual Fee
Regulated waste recycling or reprocessing
(1) Operating a facility for receiving, and recycling or reprocessing less than 10 tonnes of regulated waste per day with no ‘environmental’ release
$1,987.20
(2) Operating a facility for receiving and recycling or reprocessing regulated waste other than threshold (1) (above)
$18,768.00
Regulated waste storage
(1) Receiving and storing 5 tonnes or more or 500 or more equivalent passenger units (EPU) of tyres of parts of tyres (9.5kg is equivalent to 1 EPU)
$1,987.20
(2) Receiving and storing regulated waste (other than tyres) $4,636.80
Regulated waste transport
(1) Regulated waste transport—transporting tyres $551.00
(2a) Regulated waste transport (other than tyres) in 1–5 vehicles $1,545.60
(2b) Regulated waste transport (other than tyres) in 6-–35 vehicles $4,636.80
(2c) Regulated waste transport (other than tyres) in 36 or more vehicles $9,273.60
Regulated waste treatment
Operating a facility for receiving and treating regulated waste $19,872.00
Tyre recycling
Operating a commercial facility for receiving, and recycling or reprocessing 1000 or more equivalent passenger units—or tyres or parts of tyres in a year (9.5kg of tyre parts per EPU)
$551.00
Waste disposal
(1a) Waste disposal facility (any combination of regulated waste, general waste and limited regulated waste—and <5 tonnes untreated clinical wastes if in a scheduled area): <50,000 tonnes/year
$11,040.00
(1b) Waste disposal facility (any combination of regulated waste, general waste and limited regulated waste—and <5 tonnes untreated clinical waste if in a scheduled area): 50,000–100,000 tonnes/year
$18,105.60
(1c) Waste disposal facility (any combination of regulated waste, general waste and limited regulated waste—and <5 tonnes untreated clinical wastes if in a scheduled area): >100,000–200,000 tonnes/year
$22,080.00
(1d) Waste disposal facility (any combination of regulated waste, general waste and limited regulated waste—and <5 tonnes untreated clinical wastes if in a scheduled area): >200,000 tonnes/year
$24,288.00
(2a) Waste disposal facility (any combination of general waste and no more than 10% limited regulated waste): 50–2,000 tonnes/year
$2,870.40
(2b) Waste disposal facility (any combination of general waste and no more than 10% limited regulated waste): >2,000–5,000 tonnes/year
$4,416.00
(2d) Waste disposal facility (any combination of general waste and no more than 10% limited regulated waste): >10,000–20,000 tonnes/year
$9,052.80
(2e) Waste disposal facility (any combination of general waste and no more than 10% limited regulated waste): >20,000–50,000 tonnes/year
$11,702.40
(2f) Waste disposal facility (any combination of general waste and no more than 10% limited regulated waste): >50,000–100,000 tonnes/year
$12,806.40
(2g) Waste disposal facility (any combination of general waste and no more than 10% limited regulated waste): >100,000–200,000 tonnes/year
$16,118.40
32 Queensland Department of Environment and Heritage Protection. ‘Summary of annual fees for environmentally relevant
activities (ERAs)’, Information Sheet—Environmentally relevant activities, available: www.ehp.Queensland.gov.au/licences-permits/business-industry/pdf/is-bi-summary-of-fees-eras-em389.pdf [19.10.2012]

_____________________________________________________________________________________________________
5012.086—Hazardous Waste Data Assessment page 74
Activity Annual Fee
(2h) Waste disposal facility (any combination of general waste and no more than 10% limited regulated waste): >200,000 tonnes/year
$21,196.80
Waste incineration and thermal treatment
(3b) Incinerating or thermally treating regulated waste $9,052.80
5.4. Tasmania
Tasmania currently has no state-based landfill levies. However, certain groups of Councils in the state
may apply a waste levy on all waste disposed to landfill. One such regional waste levy is implemented
by the Northern Tasmanian Waste Management Group. This group of Councils applies a $5/tonne
(excluding GST) waste levy for all types of waste33
.
In January 2008, the Tasmanian Government commissioned Sustainable Infrastructure Australia (now
KMH Environmental) to assess the current status and commercial viability of controlled (hazardous)
waste management facilities and practices in Tasmania, as part of a state-wide controlled waste
management strategy. Apart from environmental protection licensing fees, this study contains the only
comprehensive list of costs related to controlled waste management in Tasmania. Table 193 provides
the costs detailed in this study, as per waste type.
33 Northern Tasmanian Waste Management. ‘About Us’, Northern Tasmanian Waste Management Website, available:
www.northtaswaste.com.au/?page=about_us [19.10.2012]

_____________________________________________________________________________________________________
5012.086—Hazardous Waste Data Assessment page 75
Table 19SIA 2008 Estimates of disposal costs for controlled waste in Tasmania34
Waste type Estimated cost per kilogram (CN) +/-% Explanation
A100 $20/kg 30% By hypochlorite treatment.
Waste resulting from surface treatment of metals and plastics
A110 $20/kg 30%
By thermal destruction of waste containing 5% cyanide. Waste from heat treatment and tempering operations containing cyanides
A130 $5/kg 30%
By thermal destruction of waste containing 2% cyanide. Cyanides (inorganic)
B100, C100, T100, T120 $6-$9/kg -
Includes transport and handling to mainland.
Acids, bases, laboratory/photography chemicals
D100-D350 $6-$9/kg -
Includes transport and handling to mainland. Inorganic chemicals
E100, E120 $6-9/kg -
Includes transport and handling to mainland.
Reactive chemicals
F100, F110, H100, H110, H170
$2-$9/kg - Includes transport and handling to mainland. Paints, lacquers, varnish, resins, inks, dyes, pigments, adhesives;
Pesticides
G100, G110, G150, G160 $3 - $4/L -
Includes transport and handling to mainland. Organic solvents/solvent residues ($3300 - $4450/t)
J100, J120, J160, J200 $0 - $0.31/L - Includes transport locally.
Oils, hydrocarbons, emulsions and tars (up to $350/t)
34 Sustainable Infrastructure Australia. (2008), Draft Report- Current and Future Controlled Waste Practices in Tasmania, January 2008, prepared for the Tasmanian State Government, available:
epa.tas.gov.au/Documents/Controlled_Waste_Management_Strategy_Draft_Report_January_2008.pdf [19.10.2012]

_____________________________________________________________________________________________________
5012.086—Hazardous Waste Data Assessment page 76
Waste type Estimated cost per kilogram (CN) +/-% Explanation
K100 $30 - $100/m
3 - -
Animal effluent and residues
K10
- - - Grease trap waste
K130 - - -
Sewage sludge and residues including nightsoil and septic tank sludge
M100
$15–$25/ kg small loads e.g. capacitors -
Includes transport and handling to mainland. Chemical, biological or thermal destruction, or re-use in management of other wastes.
PCB (scheduled) waste
Category M
$650/t drummed waste -
Includes transport and handling to mainland (Weight for charging includes containers).
Non-scheduled waste (organic) chemicals
Category N $30–$350/t -
Chemical fixation and secure disposal. Solid/sludge waste requiring special handling
N220 $50–$120/t -
Delivered double bagged and buried securely at landfill. Asbestos
R100, R120, R140 $50–$65/m3
- - Clinical and pharmaceutical wastes At 120 kg/m3= $420–$550/t
At 90 kg/m3 = $560–$720/t
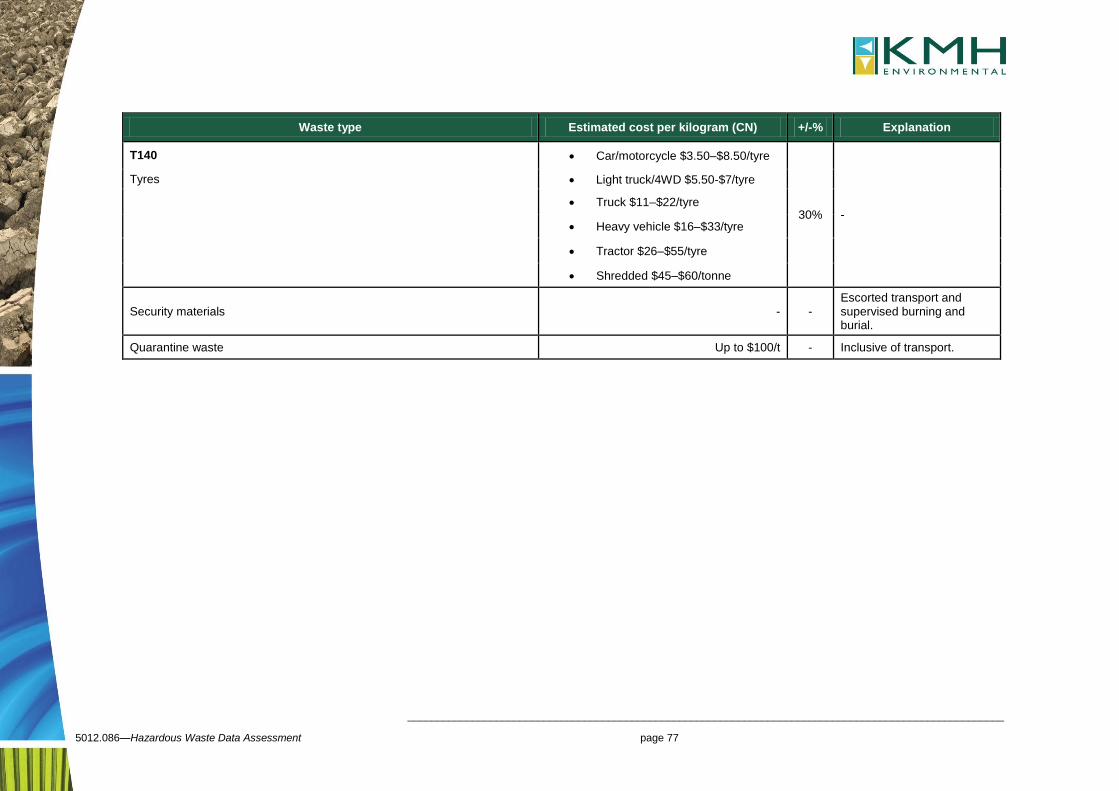
_____________________________________________________________________________________________________
5012.086—Hazardous Waste Data Assessment page 77
Waste type Estimated cost per kilogram (CN) +/-% Explanation
T140 Car/motorcycle $3.50–$8.50/tyre
30% -
Tyres Light truck/4WD $5.50-$7/tyre
Truck $11–$22/tyre
Heavy vehicle $16–$33/tyre
Tractor $26–$55/tyre
Shredded $45–$60/tonne
Security materials - - Escorted transport and supervised burning and burial.
Quarantine waste Up to $100/t - Inclusive of transport.

_____________________________________________________________________________________________________
5012.086—Hazardous Waste Data Assessment page 78
5.5. South Australia
In South Australia, levies are payable by the licence-holder of a waste depot for all waste received that
is to be disposed of at that depot. The levies for the financial year 2012–13 are as shown in Table 204
below.
Table 204—South Australia waste disposal levies35
Type of waste Levies for 2012–2013 (per tonne)
Solid waste—for a non-metropolitan depot disposing of non-metropolitan waste (non-metro rate)
$ 21
Solid waste—for a metropolitan depot disposing of non-metropolitan waste brought to the depot by or on behalf of a wholly non-metropolitan council (non-metro rate)
$ 21
Solid waste - metro rate $ 42
Type of waste Levy for 2012–13
(per kilolitre)
Liquid waste $ 11.64
These levies are subject to increases each financial year, based on the Consumer Price Index (CPI).
A search for addition costs in regards to listed waste only brought up costs for licence fees for waste
transporter businesses. The calculation method used to determine licence fees for waste transporter
businesses that transport listed wastes in South Australia is detailed in Table 215 below. In relation to
these fees:
Category A refers to listed waste and liquid waste in Part B of Schedule 1 of the South
Australia Environment Protection Act 1993, for example, asbestos
Category B refers to domestic waste, industrial or commercial waste (other than building or
demolition waste), septic tank effluent or contaminated soil.
35EPA South Australia. (2012), ‘Waste levy regulations’, Waste Guidelines, June 2012, available:
www.epa.sa.gov.au/xstd_files/Waste/Guideline/guide_levy.pdf [19.10.2012]
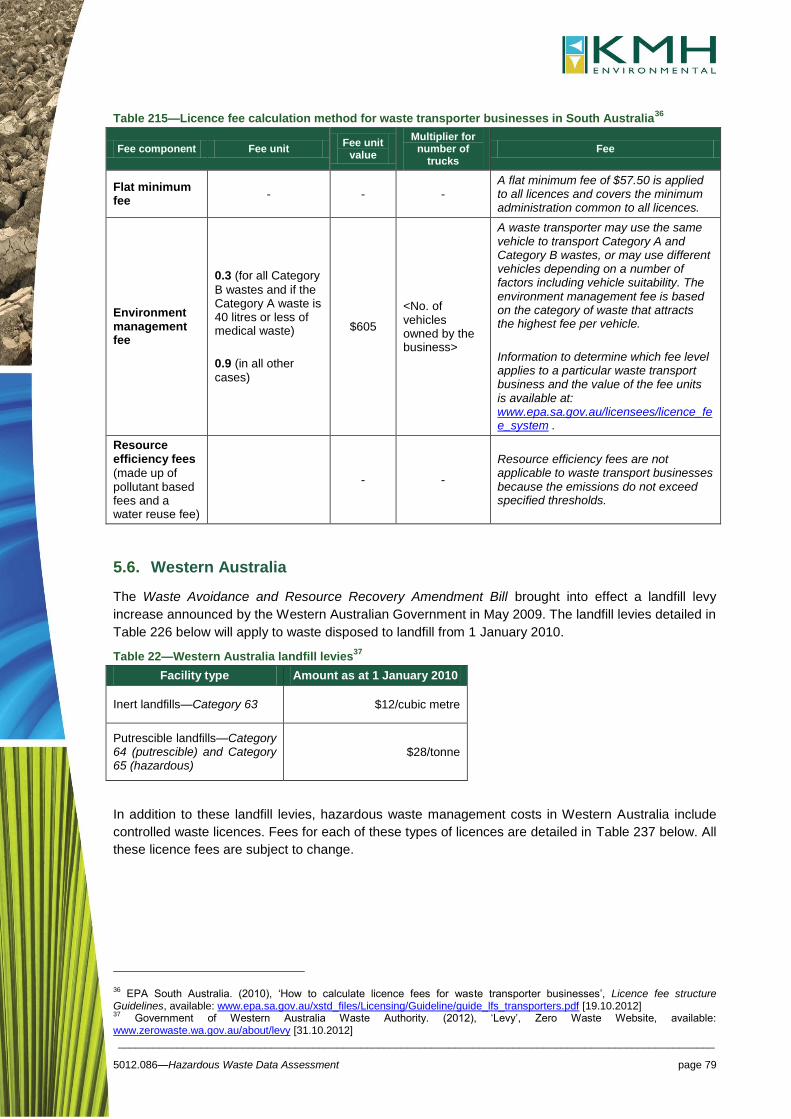
_____________________________________________________________________________________________________
5012.086—Hazardous Waste Data Assessment page 79
Table 215—Licence fee calculation method for waste transporter businesses in South Australia36
Fee component Fee unit Fee unit
value
Multiplier for number of
trucks Fee
Flat minimum fee
- - - A flat minimum fee of $57.50 is applied to all licences and covers the minimum administration common to all licences.
Environment management fee
0.3 (for all Category
B wastes and if the Category A waste is 40 litres or less of medical waste)
0.9 (in all other cases)
$605
<No. of vehicles owned by the business>
A waste transporter may use the same vehicle to transport Category A and Category B wastes, or may use different vehicles depending on a number of factors including vehicle suitability. The environment management fee is based on the category of waste that attracts the highest fee per vehicle.
Information to determine which fee level applies to a particular waste transport business and the value of the fee units is available at: www.epa.sa.gov.au/licensees/licence_fee_system .
Resource efficiency fees
(made up of pollutant based fees and a water reuse fee)
- -
Resource efficiency fees are not applicable to waste transport businesses because the emissions do not exceed specified thresholds.
5.6. Western Australia
The Waste Avoidance and Resource Recovery Amendment Bill brought into effect a landfill levy
increase announced by the Western Australian Government in May 2009. The landfill levies detailed in
Table 226 below will apply to waste disposed to landfill from 1 January 2010.
Table 22—Western Australia landfill levies37
Facility type Amount as at 1 January 2010
Inert landfills—Category 63 $12/cubic metre
Putrescible landfills—Category 64 (putrescible) and Category 65 (hazardous)
$28/tonne
In addition to these landfill levies, hazardous waste management costs in Western Australia include
controlled waste licences. Fees for each of these types of licences are detailed in Table 237 below. All
these licence fees are subject to change.
36 EPA South Australia. (2010), ‘How to calculate licence fees for waste transporter businesses’, Licence fee structure
Guidelines, available: www.epa.sa.gov.au/xstd_files/Licensing/Guideline/guide_lfs_transporters.pdf [19.10.2012] 37
Government of Western Australia Waste Authority. (2012), ‘Levy’, Zero Waste Website, available: www.zerowaste.wa.gov.au/about/levy [31.10.2012]
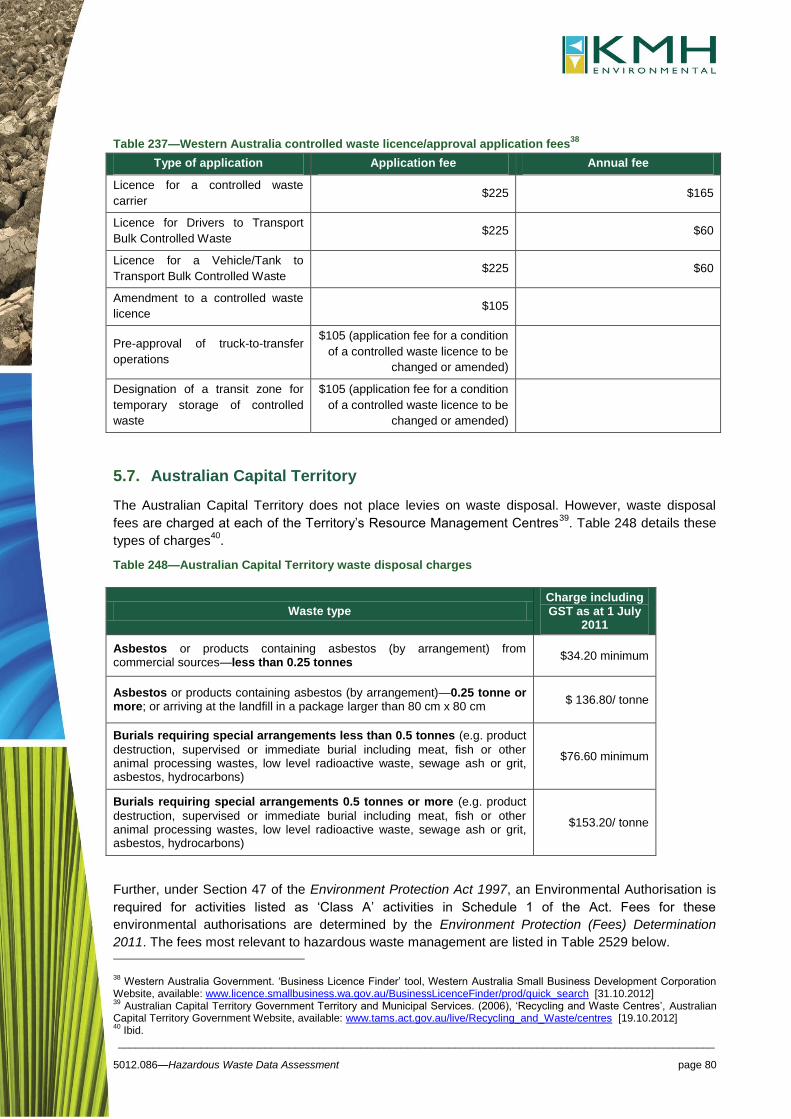
_____________________________________________________________________________________________________
5012.086—Hazardous Waste Data Assessment page 80
Table 237—Western Australia controlled waste licence/approval application fees38
Type of application Application fee Annual fee
Licence for a controlled waste
carrier $225 $165
Licence for Drivers to Transport
Bulk Controlled Waste $225 $60
Licence for a Vehicle/Tank to
Transport Bulk Controlled Waste $225 $60
Amendment to a controlled waste
licence $105
Pre-approval of truck-to-transfer
operations
$105 (application fee for a condition
of a controlled waste licence to be
changed or amended)
Designation of a transit zone for
temporary storage of controlled
waste
$105 (application fee for a condition
of a controlled waste licence to be
changed or amended)
5.7. Australian Capital Territory
The Australian Capital Territory does not place levies on waste disposal. However, waste disposal
fees are charged at each of the Territory’s Resource Management Centres39
. Table 248 details these
types of charges40
.
Table 248—Australian Capital Territory waste disposal charges
Waste type Charge including GST as at 1 July
2011
Asbestos or products containing asbestos (by arrangement) from commercial sources—less than 0.25 tonnes
$34.20 minimum
Asbestos or products containing asbestos (by arrangement)—0.25 tonne or more; or arriving at the landfill in a package larger than 80 cm x 80 cm
$ 136.80/ tonne
Burials requiring special arrangements less than 0.5 tonnes (e.g. product
destruction, supervised or immediate burial including meat, fish or other animal processing wastes, low level radioactive waste, sewage ash or grit, asbestos, hydrocarbons)
$76.60 minimum
Burials requiring special arrangements 0.5 tonnes or more (e.g. product
destruction, supervised or immediate burial including meat, fish or other animal processing wastes, low level radioactive waste, sewage ash or grit, asbestos, hydrocarbons)
$153.20/ tonne
Further, under Section 47 of the Environment Protection Act 1997, an Environmental Authorisation is
required for activities listed as ‘Class A’ activities in Schedule 1 of the Act. Fees for these
environmental authorisations are determined by the Environment Protection (Fees) Determination
2011. The fees most relevant to hazardous waste management are listed in Table 2529 below.
38 Western Australia Government. ‘Business Licence Finder’ tool, Western Australia Small Business Development Corporation
Website, available: www.licence.smallbusiness.wa.gov.au/BusinessLicenceFinder/prod/quick_search [31.10.2012] 39
Australian Capital Territory Government Territory and Municipal Services. (2006), ‘Recycling and Waste Centres’, Australian Capital Territory Government Website, available: www.tams.act.gov.au/live/Recycling_and_Waste/centres [19.10.2012] 40
Ibid.

_____________________________________________________________________________________________________
5012.086—Hazardous Waste Data Assessment page 81
Table 25—Australian Capital Territory Environment Authorisation Fees41
Description of activity for which fees is payable Application fees
payable Annual
authorisation fees
Commercial incineration
$2,203.49
N/A
Commercial incineration of cytotoxic, clinical or quarantine waste where the amount incinerated is 0 to 1,000 tonnes per year
$ 3,324.95
Commercial incineration of cytotoxic, clinical or quarantine waste where the amount incinerated is >1,000 tonnes per year
$8,645.09
Sterilisation of clinical waste $2,118.02 $4,162.35
Operation of a commercial landfill where the amount of waste received is >5,000 to 20,000 tonnes per year
$2,203.49
$3,723.82
Operation of a commercial landfill where the amount of waste received is >20,000 to 100,000 tonnes per year
$4,787.94
Operation of a commercial landfill where the amount of waste received is >100,000 tonnes per year
$5,852.07
Transport of controlled waste
$439.33
N/A
Transport of controlled waste where the number of vehicles authorised to transport waste is 0 to 3
$531.92
Transport of controlled waste where the number of vehicles authorised to transport waste is >3 to 7
$1,063.89
Transport of controlled waste where the number of vehicles authorised to transport waste is >7 to 11
$1,595.87
Transport of controlled waste where the number of vehicles authorised to transport waste is >11
$2,128.54
Transportation from 1 place in the Australian Capital Territory to another place in the Australian Capital Territory, of 200 kg or more of regulated waste or 2 tonnes or more of used, rejected, or unwanted tyres
$439.33 $2,128.54
Waste oil recovery where the amount processed is 20 to 1,000 tonnes per year
$439.33 $3,324.95
Waste oil recovery where the amount processed is >1,000 tonnes per year
$1,468.43 $8,645.09
Commercial collection of waste from commercial premises
$219.61 $219.61
5.8. Northern Territory
Currently, there are no landfill levies in the Northern Territory, though landfills in major cities do charge
landfill fees for the disposal of wastes such as tyres, chemicals and e-waste42
. However, the Northern
Territory Waste Management Pollution Control Act requires businesses that collect, transport, store,
recycle, treat or dispose of ‘listed waste’ on a commercial or a fee for service basis must not operate
without a licence43
. Further, an approval is required for the construction, installation or carrying out of
41 Australian Capital Territory. (2011), Environment Protection (Fees) Determination 2011 (No 1), available:
www.legislation.act.gov.au/di/2011-148/20110701-48248/pdf/2011-148.pdf [19.10.2012] 42
Alice Springs Town Council. ‘Fees and Charges’, Alice Springs Town Council Website, available: www.alicesprings.nt.gov.au/fee/list/id/5 [19.10.2012]. City of Darwin. ‘Shoal Bay Waste Management Facility’, City of Darwin Website, available: www.darwin.nt.gov.au/live/your-home/recycling-and-waste-management/shoal-bay-waste-disposal-site/weighbridge-fees-and-charges [19.10.2012] 43
Northern Territory Government. (2012), ‘Licences for Listed Waste Handlers’, Northern Territory Government Website, available: www.nretas.nt.gov.au/environment-protection/waste/register/handlers#.UIR-nsWkpFs [19.10.2012]

_____________________________________________________________________________________________________
5012.086—Hazardous Waste Data Assessment page 82
works in relation to premises, other than sewerage treatment plants, for the storage, recycling,
treatment or disposal of listed waste on a commercial or fee for service basis44
.
Businesses are charged application fees (depending on the type of waste handled and the type of
waste management activity) for licenses and approvals, as well as recurring annual fees. Table 30
below outlines these costs. According to the Revenue Units Act 2009, 1 revenue unit = $1.02
(effective 1 July 2011 to 30 June 2012).
44Northern Territory Government. (2012), ‘Licences and Approvals Information’, Northern Territory Government Website,
available: www.nretas.nt.gov.au/environment-protection/licences/licences#.UISGjMWkpFs [19.10.2012]

_____________________________________________________________________________________________________
5012.086—Hazardous Waste Data Assessment page 83
Table 260—Northern Territory Waste Management and Pollution Control Act Fees Payable45
Description Revenue
units Per unit
Amount payable
Application for Environment Protection Licence
This fee is payable for:
Each activity and
Each premises that each activity is conducted 345 $1.02 $351.90
Application for Environment Protection Approval
Non-Hydrocarbons 345 $1.02 $351.90
Application for Environment Protection Approval
Hydrocarbons
345 $1.02
$351.90 + Hydrocarbons N/A
$0.00575 per tonne of
hydrocarbons proposed to be handled in the
first year
Application to Amend or Revoke Condition of Licence or Approval
115 $1.02 $117.30
Application to Transfer Licence or Approval No fee payable
Application for Renewal of a Licence 345 $1.02 $351.90
Application to be placed on the register for Environment Auditors
1495 $1.02 $1524.90
Annual Fee for Environment Protection Licence
Landfill
345 $1.02 $351.90 + Fee serviced
(invoice sent to Licensee by
NTG Agency)
N/A
$0.0575 per person of
population to be serviced
Annual Fee for Environment Protection Licence
Listed Waste
This fee is payable for:
Each activity and
Each premises that each activity is conducted
345 $1.02 $351.90 + Listed Waste
Handled (invoice sent to
Licensee by NTG Agency)
N/A
$0.0575 per tonne/kilolitre
that was handled
Annual Fee for Environment Protection Licence
Hydrocarbons N/A
$0.00575 per tonne of
hydrocarbons handled in 12
months
Hydrocarbons handled
calculation
(invoice sent to Licensee by
NTG Agency)
45 Northern Territory Government Department of Natural Resources, Environment, the Arts and Sport. Waste Management and
Pollution Control Act Fees Payable’, available: www.nretas.nt.gov.au/__data/assets/pdf_file/0013/14035/fees_payable.pdf [19.10.2012]

_____________________________________________________________________________________________________
5012.086—Hazardous Waste Data Assessment page 84
6. Integration of waste data systems
6.1. National Waste Management Sites Spatial Database
The National Waste Management Database presents the spatial locations of Australia's known
landfills, waste transfer stations and a large number of waste reprocessing facilities. The data are a
compilation of Australian, jurisdictional government, council and industry databases. The database is
hosted by Geoscience Australia.
The National Waste Management Sites Spatial Database could possibly be incorporated with
jurisdictional tracking data; however it would involve the integration and processing of large amounts
of information. Further investigation would be required to understand the data model used so that
format, fineness and rules are understood.
Assuming such integration was possible; this would allow conclusions to be drawn about the distances
between hazardous waste sources and its eventual disposal at landfill.
While integration of this data could involve significant cost to existing jurisdictional waste tracking
systems, the benefits could be significant and include:
assist compliance and enforcement
rapidly find data entry mistakes, such as incorrect treatment sites
identify areas to reduce transport and therefore overall waste management costs
identify traffic management issues
identify inefficiencies in the waste transport system
spatial layer could provide practical assistance to potential diversion projects
applying the proximity principle during planning for new waste treatment/disposal sites.
Public information demonstrating incorporation of the database outside of the Geoscience Australia
site has not been found. However, a recent KMH project undertook for a regional waste management
group identified and mapped the commercial asbestos receiving points in and near to the region of
interest. Another KMH project used geographic information system data to inform a business case for
appropriate siting of a recycling facility. These are perfect examples of how landfill spatial data can be
used in a waste management/planning context, such as applying the proximity principle.

_____________________________________________________________________________________________________
5012.086—Hazardous Waste Data Assessment page 85
7. International approaches to hazardous
waste data collection and reporting
The following section describes some of the approaches taken in other countries with regard to
national collection and disclosure of hazardous waste data and information.
7.1. Europe
7.1.1. The Hazardous Waste List
The creation of the European Waste Catalogue (EWC) in 1993 and the subsequent Hazardous Waste
List (HWL) in 1994 were the first attempts towards establishing a harmonised system of waste
production and management and a common waste classification system for both hazardous and non-
hazardous wastes in Europe. The HWL contains a subset of the EWC waste categories that are
classified as hazardous wastes. Both lists have undergone several revisions since their introduction.
7.1.2. European Topic Centre on Resource and Waste Management
As part of the European Environment Agency work program the European Topic Centre on Resource
and Waste Management (ETC/RWM) published a report in 2002 reviewing existing data on hazardous
waste in Europe and assessing its comparability. In the first stage of the project conducted in 2000,
hazardous waste data from the 15 ETC/RWM member countries was obtained in order to establish a
comparable hazardous waste dataset and a common waste classification system. The classification
system formed the revised HWL. The second stage involved a hazardous waste survey of all the EEA
member countries seeking information on the quantity of hazardous waste generated, classified
according to the HWL.
7.1.3. Eurostat
The European Commission’s Eurostat website database contains data on the hazardous waste
generation for each of the participating European member states for 2004, 2006 and 2008. Data is
collected every two years with 2010 figures to be released in 2012. Data includes total hazardous
waste generated and per capita hazardous waste generation for each country. Figure 16 shows the
per capita hazardous waste generation figures for each country and region based on 2008 data.

_____________________________________________________________________________________________________
5012.086—Hazardous Waste Data Assessment page 86
Figure 16—Hazardous waste generated per capita in Europe in 2008 by country/region (Eurostat 2012)
Hazardous waste generation publication (2007) is available from the European Environment Agency. It
is compiled from the following data sources:
Waste Statistics Regulation: http://www.eea.europa.eu/data-and-maps/figures/hazardous-waste-
generation
EEA, ETC/RWM, 2006b. European Topic Centre on Resource and Waste Management's
electronic waste database: http://waste.eionet.europa.eu/wastebase
European Commission, 2006. Environmental Impact of Products (EIPRO), Analysis of the life
cycle environmental impacts related to the final consumption of the EU-25. Main report.
IPTS/ESTO
Basel Convention, 2006. Website of the Basel Convention, national reporting.
http://www.basel.int/natreporting/index.html UN (United Nations), 2006. 'Survey of waste
generation in the EECCA and SEE countries 2006', United Nations Statistical Department (not
published yet)
SOE (State of the Environment), the Russian Federation, 2004. State of the Environment in
Russia, 2004. Ministry of Natural resources of the Russian Federation. http://www.mnr.gov.ru/.

_____________________________________________________________________________________________________
5012.086—Hazardous Waste Data Assessment page 87
Specific hazardous waste statistics for Europe are also available from the European Commission
Eurostat website
http://epp.eurostat.ec.europa.eu/statistics_explained/index.php/Waste_statistics#Hazardous_waste_g
eneration
7.1.4. United Kingdom
Hazardous waste in the United Kingdom is managed under the Waste (England and Wales)
Regulations 2011. Under the Regulations any entity responsible for moving or receiving of hazardous
waste is required to maintain a register of waste records. This includes removal from a premises,
transport, intermediate storage and disposal or recovery of the hazardous waste material.
Consignment details are recorded either electronically or as paper-based records and are submitted to
the United Kingdom Environment Agency.
As a party to the Basel Convention the United Kingdom reports its hazardous waste generation figures
to the Basel Secretariat annually.
7.2. North America
7.2.1. United States of America
In the United States of America, hazardous waste is regulated under the Resource Conservation and
Recovery Act (RCRA) Subtitle C. In regulatory terms, a RCRA hazardous waste is a waste that
appears on one of the four hazardous wastes lists (F-list, K-list, P-list, or U-list), or exhibits at least one
of four characteristics—ignitability, corrosiveness, reactivity, or toxicity46
.
The Hazardous Waste Manifest System is a set of forms, reports, and procedures designed to
seamlessly track hazardous waste from the time it leaves the generator facility where it was produced,
until it reaches the off-site waste management facility that will store, treat, or dispose of the hazardous
waste. Hazardous waste generators, transporters, treaters, storers and disposers of hazardous waste
are required to provide information on their activities to state environmental agencies. These agencies
then provide the information to regional and national United States of America EPA offices through the
RCRA Information (RCRAInfo) System46
. Information on cleaning up after accidents or other activities
that result in a release of hazardous materials to the water, air or land must also be reported through
RCRAInfo.
As a party to the Basel Convention, the United States of America reports its hazardous waste
generation figures to the Basel Secretariat annually.
7.3. Asia
7.3.1. Japan
The Japanese Ministry of the Environment (MOE) publishes annual hazardous waste import and
export figures on its website.
46 United States of America EPA 2012

Appendix A
NEPM Hazardous Waste Categories
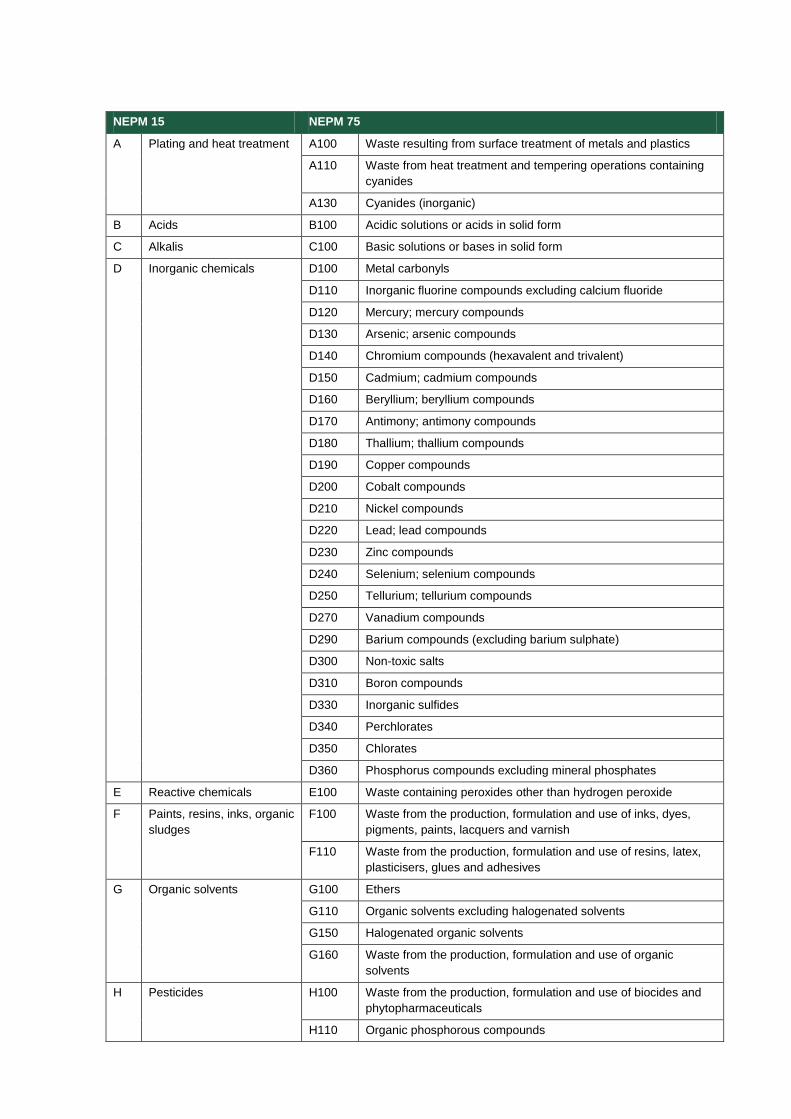
NEPM 15 NEPM 75
A Plating and heat treatment A100 Waste resulting from surface treatment of metals and plastics
A110 Waste from heat treatment and tempering operations containing
cyanides
A130 Cyanides (inorganic)
B Acids B100 Acidic solutions or acids in solid form
C Alkalis C100 Basic solutions or bases in solid form
D Inorganic chemicals D100 Metal carbonyls
D110 Inorganic fluorine compounds excluding calcium fluoride
D120 Mercury; mercury compounds
D130 Arsenic; arsenic compounds
D140 Chromium compounds (hexavalent and trivalent)
D150 Cadmium; cadmium compounds
D160 Beryllium; beryllium compounds
D170 Antimony; antimony compounds
D180 Thallium; thallium compounds
D190 Copper compounds
D200 Cobalt compounds
D210 Nickel compounds
D220 Lead; lead compounds
D230 Zinc compounds
D240 Selenium; selenium compounds
D250 Tellurium; tellurium compounds
D270 Vanadium compounds
D290 Barium compounds (excluding barium sulphate)
D300 Non-toxic salts
D310 Boron compounds
D330 Inorganic sulfides
D340 Perchlorates
D350 Chlorates
D360 Phosphorus compounds excluding mineral phosphates
E Reactive chemicals E100 Waste containing peroxides other than hydrogen peroxide
F Paints, resins, inks, organic
sludges
F100 Waste from the production, formulation and use of inks, dyes,
pigments, paints, lacquers and varnish
F110 Waste from the production, formulation and use of resins, latex,
plasticisers, glues and adhesives
G Organic solvents G100 Ethers
G110 Organic solvents excluding halogenated solvents
G150 Halogenated organic solvents
G160 Waste from the production, formulation and use of organic
solvents
H Pesticides H100 Waste from the production, formulation and use of biocides and
phytopharmaceuticals
H110 Organic phosphorous compounds

H170 Waste from manufacture, formulation and use of wood-preserving
chemicals
J Oils J100 Waste mineral oils unfit for their original intended use
J120 Waste oil/water, hydrocarbons/water mixtures or emulsions
J160 Waste tarry residues arising from refining, distillation, and any
pyrolytic treatment
K Putrescible/ organic waste K100 Animal effluent and residues (abattoir effluent, poultry and fish
processing wastes)
K110 Grease trap waste
K130 Sewage sludge and residues including nightsoil and septic tank
sludge
K140 Tannery wastes including leather dust, ash, sludges and flours
K190 Wool scouring wastes
L Industrial washwater - -
M Organic chemicals M100 Waste substances and articles containing or contaminated with
polychlorinated biphenyls, polychlorinated napthalenes,
polychlorinated terphenyls and/or polybrominated biphenyls
M150 Phenols, phenol compounds including chlorophenols
M160 Organo halogen compounds—other than substances referred to
in this Table or Table 2
M170 Polychlorinated dibenzo-furan (any congener)
M180 Polychlorinated dibenzo-p-dioxin (any congener)
M210 Cyanides (organic)
M220 Isocyanate compounds
M230 Triethylamine catalysts for setting foundry sands
M250 Surface active agents (surfactants), containing principally organic
constituents and which may contain metals and inorganic
materials
M260 Highly odorous organic chemicals (including mercaptans and
acrylates)
N Soil/ sludge N100 Containers and drums that are contaminated with residues of
waste referred to in this Table
N100 Containers and drums that are contaminated with residues of
substances referred to in this list
N120 Soils contaminated with a substance or waste referred to in this
Table
N120 Soils contaminated with a substance or waste referred to in this
Table
N140 Fire debris and fire wash waters
N150 Fly ash
N160 Encapsulated, chemically-fixed, solidified or polymerised wastes
N190 Filter cake
N205 Residues from industrial waste treatment/disposal operations
N220 Asbestos
N230 Ceramic-based fibres with physico-chemical characteristics
similar to those of asbestos

R Clinical and
pharmaceutical
R100 Clinical and related wastes
R120 Waste pharmaceuticals, drugs and medicines
R140 Waste from the production and preparation of pharmaceutical
products
T Miscellaneous T100 Waste chemical substances arising from research and
development or teaching activities, including those which are not
identified and/or are new and whose effects on human health
and/or the environment are not known
T120 Waste from the production, formulation and use of photographic
chemicals and processing materials
T140 Tyres
T200 Waste of an explosive nature not subject to other legislation

Appendix B
Tracked and non-tracked wastes by jurisdiction

Hazardous waste classification Waste tracking status/jurisdiction
NEPM
Code
NEPM
Code
(Detailed)
Waste description
Australian
Capital
Territory
New South
Wales
Northern
Territory Queensland
South
Australia Tasmania Victoria
Western
Australia
A Cyanides
A100 Cyanide-containing wastes Interstate only Tracked Interstate
only
Tracked Tracked Interstate
only
Tracked Tracked
A110 Waste from heat treatment and tempering
operations containing cyanides
Interstate only Tracked Interstate
only
N/A Tracked Interstate
only
N/A Tracked
A130 Cyanides (inorganic) Interstate only Tracked Interstate
only
Tracked Tracked Interstate
only
N/A Tracked
B Acids
B100 Acids in a solid form or acidic solution with pH
value of 4 or less
Interstate only Tracked Interstate
only
Tracked Tracked Interstate
only
Tracked Tracked
C Alkaline wastes
C100 Alkaline solids or alkaline solutions with pH value
of 9 or more (includes, but is not limited to: caustic
soda, alkaline cleaners and waste lime)
Interstate only Tracked Interstate
only
Tracked Tracked Interstate
only
Tracked Tracked
D Inorganic chemicals
D100 Metal carbonyls Interstate only Tracked Interstate
only
Tracked Tracked Interstate
only
Tracked Tracked
D110 Inorganic fluorine compounds (excluding calcium
fluoride)
Interstate only Tracked Interstate
only
Tracked Tracked Interstate
only
Tracked Tracked
D120 Mercury and mercury compounds Interstate only Tracked Interstate
only
Tracked Tracked Interstate
only
Tracked Tracked
D121 Equipment and articles containing mercury Interstate only Tracked Interstate
only
N/A N/A Interstate
only
Tracked Tracked
D130 Arsenic and arsenic compounds Interstate only Tracked Interstate
only
Tracked Tracked Interstate
only
Tracked Tracked
D140 Chromium compounds (hexavalent and trivalent) Interstate only Tracked Interstate
only
Tracked Tracked Interstate
only
Tracked Tracked
D141 Tannery wastes containing chromium Interstate only Tracked Interstate
only
N/A N/A Interstate
only
Tracked Tracked
D150 Cadmium and cadmium compounds Interstate only Tracked Interstate Tracked Tracked Interstate Tracked Tracked

Hazardous waste classification Waste tracking status/jurisdiction
NEPM
Code
NEPM
Code
(Detailed)
Waste description
Australian
Capital
Territory
New South
Wales
Northern
Territory Queensland
South
Australia Tasmania Victoria
Western
Australia
only only
D160 Beryllium and beryllium compounds Interstate only Tracked Interstate
only
Tracked Tracked Interstate
only
Tracked Tracked
D170 Antimony and antimony compounds Interstate only Tracked Interstate
only
N/A Tracked Interstate
only
Tracked Tracked
D180 Thallium; thallium compounds Interstate only N/A Interstate
only
N/A Tracked Interstate
only
N/A Tracked
D190 Copper compounds Interstate only Tracked Interstate
only
Tracked Tracked Interstate
only
Tracked Tracked
D200 Cobalt and cobalt compounds Interstate only Tracked Interstate
only
N/A Tracked Interstate
only
Tracked Tracked
D210 Nickel compounds Interstate only Tracked Interstate
only
Tracked Tracked Interstate
only
Tracked Tracked
D220 Lead and lead compounds Interstate only Tracked Interstate
only
Tracked Tracked Interstate
only
Tracked Tracked
D230 Zinc compounds Interstate only Tracked Interstate
only
Tracked Tracked Interstate
only
Tracked Tracked
D240 Selenium and selenium compounds Interstate only Tracked Interstate
only
N/A Tracked Interstate
only
Tracked Tracked
D250 Tellurium; tellurium compounds Interstate only N/A Interstate
only
N/A Tracked Interstate
only
N/A Tracked
D261 Waste from the production, formulation and use of
photographic chemicals and processing materials
(containing silver)
Interstate only Tracked Interstate
only
Tracked N/A Interstate
only
Tracked Tracked
D270 Vanadium compounds Interstate only N/A Interstate
only
N/A Tracked Interstate
only
N/A Tracked
D290 Barium compounds Interstate only Tracked Interstate
only
N/A Tracked Interstate
only
Tracked Tracked
D300 Non-toxic salts (e.g. sodium chloride, calcium
chloride)
Interstate only Tracked Interstate
only
Tracked Tracked Interstate
only
Tracked Tracked

Hazardous waste classification Waste tracking status/jurisdiction
NEPM
Code
NEPM
Code
(Detailed)
Waste description
Australian
Capital
Territory
New South
Wales
Northern
Territory Queensland
South
Australia Tasmania Victoria
Western
Australia
D310 Boron compounds Interstate only Tracked Interstate
only
Tracked Tracked Interstate
only
Tracked Tracked
D330 Inorganic sulfur-containing compounds Interstate only Tracked Interstate
only
Tracked Tracked Interstate
only
Tracked Tracked
D340 Perchlorates Interstate only N/A Interstate
only
Tracked Tracked Interstate
only
N/A Tracked
D350 Chlorates Interstate only N/A Interstate
only
Tracked Tracked Interstate
only
N/A Tracked
D360 Phosphorus compounds, excluding mineral
phosphates
Interstate only Tracked Interstate
only
Tracked Tracked Interstate
only
Tracked Tracked
D390 Inorganic chemicals, NOS Interstate only Tracked Interstate
only
N/A N/A Interstate
only
Tracked Tracked
D400 Smelter waste containing prescribed waste Interstate only Tracked Interstate
only
N/A N/A Interstate
only
Tracked Tracked
E Reactive chemicals
E100 Oxidising agents, including peroxides, NOS Interstate only Tracked Interstate
only
Tracked Tracked Interstate
only
Tracked Tracked
E120 Waste of an explosive nature not subject to other
legislation, including azides
Interstate only Tracked Interstate
only
Tracked Tracked Interstate
only
Tracked Tracked
F Paints, lacquers, varnish, resins, inks, dFT,
pigments, adhesives
F100 Aqueous-based wastes from the production,
formulation and use of inks, dFT, pigments,
paints, lacquers and varnish
Interstate only Tracked Interstate
only
Tracked Tracked Interstate
only
Tracked Tracked
F110 Aqueous-based wastes from the production,
formulation and use of resins, latex, plasticisers,
glues and adhesives
Interstate only Tracked Interstate
only
Tracked Tracked Interstate
only
Tracked Tracked
F120 Solvent-based wastes from the production,
formulation and use of inks, dFT, pigments,
paints, lacquers and varnish
Interstate only Tracked Interstate
only
N/A N/A Interstate
only
Tracked Tracked
F130 Solvent-based wastes from the production, Interstate only Tracked Interstate N/A N/A Interstate Tracked Tracked

Hazardous waste classification Waste tracking status/jurisdiction
NEPM
Code
NEPM
Code
(Detailed)
Waste description
Australian
Capital
Territory
New South
Wales
Northern
Territory Queensland
South
Australia Tasmania Victoria
Western
Australia
formulation and use of resins, latex, plasticisers,
glues and adhesives
only only
F160 Solvent based waste (FP<61C combustible) from
the production, formulation and use of paints,
lacquer
Interstate only N/A Interstate
only
Tracked N/A Interstate
only
N/A N/A
G Organic solvents, solvent residues
G100 Ethers and highly flammable hydrocarbons, such
as petrol and jet fuel
Interstate only Tracked Interstate
only
Tracked Tracked Interstate
only
Tracked Tracked
G110 Non-halogenated organic solvents Interstate only Tracked Interstate
only
Tracked Tracked Interstate
only
Tracked Tracked
G120 Non-halogenated organic solvents FP<61C, NOS
(flammable)
Interstate only N/A Interstate
only
Tracked N/A Interstate
only
N/A N/A
G130 Dry-cleaning wastes containing organic solvents,
such as perchloroethylene
Interstate only N/A Interstate
only
Tracked N/A Interstate
only
Tracked Tracked
G150 Halogenated organic solvents Interstate only Tracked Interstate
only
Tracked Tracked Interstate
only
Tracked Tracked
G160 Wastes from the production, formulation and use
of organic solvents, NOS
Interstate only Tracked Interstate
only
Tracked Tracked Interstate
only
Tracked Tracked
G180 Organic solvents, sovlent residues NOS Interstate only N/A Interstate
only
Tracked N/A Interstate
only
N/A N/A
H Pesticides (includes herbicides and
insecticides)
H100 Waste from the production, formulation and use
of biocides and phytopharmaceuticals, NOS
Interstate only Tracked Interstate
only
Tracked Tracked Interstate
only
Tracked Tracked
H110 Organophosphorus pesticides Interstate only Tracked Interstate
only
Tracked Tracked Interstate
only
Tracked Tracked
H120 Nitrogen-containing pesticides (liquid) Interstate only N/A Interstate
only
Tracked N/A Interstate
only
N/A N/A
H160 Mixed pesticide residue Interstate only Tracked Interstate
only
Tracked N/A Interstate
only
Tracked Tracked

Hazardous waste classification Waste tracking status/jurisdiction
NEPM
Code
NEPM
Code
(Detailed)
Waste description
Australian
Capital
Territory
New South
Wales
Northern
Territory Queensland
South
Australia Tasmania Victoria
Western
Australia
H170 Copper-chrome-arsenic (CCA) Interstate only Tracked Interstate
only
Tracked Tracked Interstate
only
Tracked Tracked
H190 Organic wood preserving compounds Interstate only N/A Interstate
only
Tracked N/A Interstate
only
N/A N/A
J Oils, hydrocarbons, emulsions
J100 Waste oils unfit for their original intended use
(lubricating, hydraulic)
Interstate only Tracked Interstate
only
Tracked Tracked Interstate
only
Tracked Tracked
J110 Waste hydrocarbons Interstate only Tracked Interstate
only
Tracked N/A Interstate
only
Tracked Tracked
J120 Waste oils and water mixtures or emulsions, and
hydrocarbon and water mixtures or emulsions
Interstate only Tracked Interstate
only
Tracked Tracked Interstate
only
Tracked Tracked
J160 Tarry residues arising from refining, distillation
and any pyrolytic treatment
Interstate only Tracked Interstate
only
Tracked Tracked Interstate
only
Tracked Tracked
J170 Used oil filters (Note: this waste must be reused
or recycled and is prohibited from disposal to
landfill)
Interstate only Tracked Interstate
only
Not Tracked Not
Tracked
Interstate
only
Tracked Tracked
K Putrescible/organic wastes
K100 Animal effluent and residues (eg abattoir wastes,
poultry wastes, fish and shellfish wastes)
Interstate only Interstate
only
Interstate
only
Tracked Tracked Interstate
only
Tracked Tracked
K110/120 Grease trap waste Interstate only Interstate
only
Interstate
only
Tracked Tracked Interstate
only
Tracked Tracked
K130 Sewage sludge and residues including nightsoil
and septic tank sludge
Interstate only N/A Interstate
only
Tracked N/A Interstate
only
N/A Tracked
K140 Tannery wastes (not containing chromium) and
wool scouring wastes
Interstate only Interstate
only
Interstate
only
Tracked Tracked Interstate
only
Tracked Tracked
K170 Animal oils and derivatives (eg tallow) Interstate only N/A Interstate
only
Tracked N/A Interstate
only
N/A N/A
K190 Wool scouring wastes Interstate only N/A Interstate
only
Tracked Tracked Interstate
only
N/A N/A
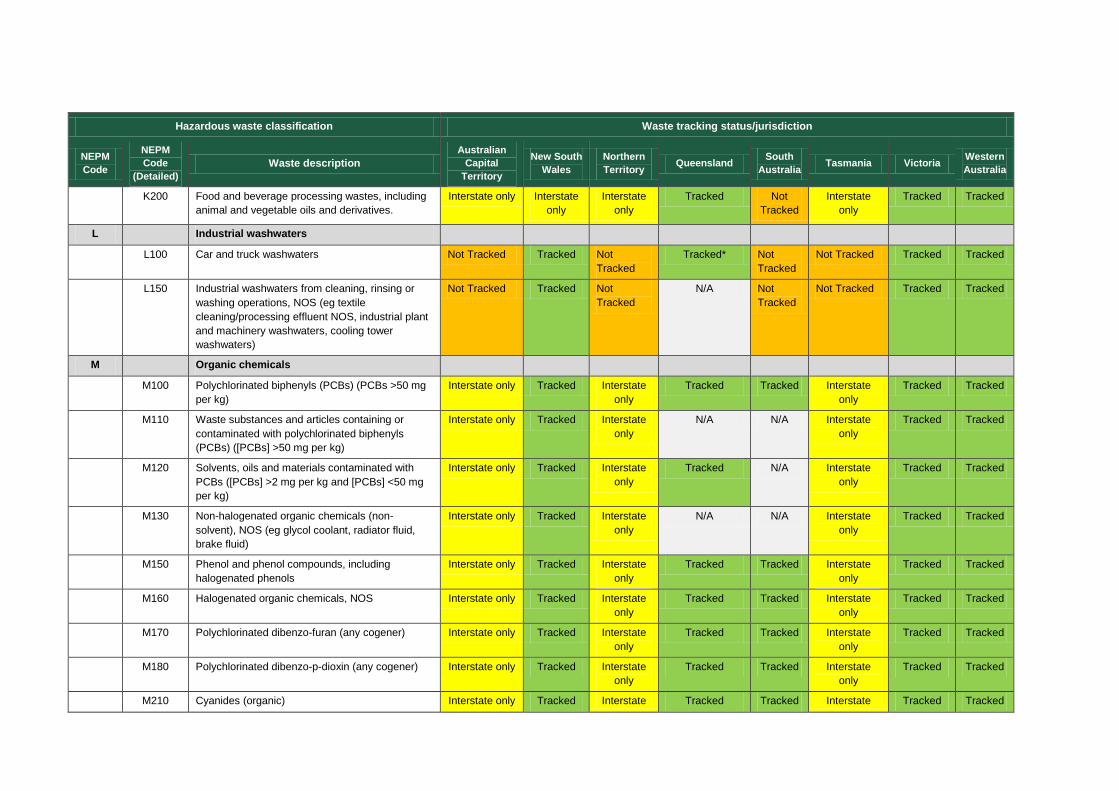
Hazardous waste classification Waste tracking status/jurisdiction
NEPM
Code
NEPM
Code
(Detailed)
Waste description
Australian
Capital
Territory
New South
Wales
Northern
Territory Queensland
South
Australia Tasmania Victoria
Western
Australia
K200 Food and beverage processing wastes, including
animal and vegetable oils and derivatives.
Interstate only Interstate
only
Interstate
only
Tracked Not
Tracked
Interstate
only
Tracked Tracked
L Industrial washwaters
L100 Car and truck washwaters Not Tracked Tracked Not
Tracked Tracked* Not
Tracked Not Tracked Tracked Tracked
L150 Industrial washwaters from cleaning, rinsing or
washing operations, NOS (eg textile
cleaning/processing effluent NOS, industrial plant
and machinery washwaters, cooling tower
washwaters)
Not Tracked Tracked Not
Tracked N/A Not
Tracked Not Tracked Tracked Tracked
M Organic chemicals
M100 Polychlorinated biphenyls (PCBs) (PCBs >50 mg
per kg)
Interstate only Tracked Interstate
only
Tracked Tracked Interstate
only
Tracked Tracked
M110 Waste substances and articles containing or
contaminated with polychlorinated biphenyls
(PCBs) ([PCBs] >50 mg per kg)
Interstate only Tracked Interstate
only
N/A N/A Interstate
only
Tracked Tracked
M120 Solvents, oils and materials contaminated with
PCBs ([PCBs] >2 mg per kg and [PCBs] <50 mg
per kg)
Interstate only Tracked Interstate
only
Tracked N/A Interstate
only
Tracked Tracked
M130 Non-halogenated organic chemicals (non-
solvent), NOS (eg glycol coolant, radiator fluid,
brake fluid)
Interstate only Tracked Interstate
only
N/A N/A Interstate
only
Tracked Tracked
M150 Phenol and phenol compounds, including
halogenated phenols
Interstate only Tracked Interstate
only
Tracked Tracked Interstate
only
Tracked Tracked
M160 Halogenated organic chemicals, NOS Interstate only Tracked Interstate
only
Tracked Tracked Interstate
only
Tracked Tracked
M170 Polychlorinated dibenzo-furan (any cogener) Interstate only Tracked Interstate
only
Tracked Tracked Interstate
only
Tracked Tracked
M180 Polychlorinated dibenzo-p-dioxin (any cogener) Interstate only Tracked Interstate
only
Tracked Tracked Interstate
only
Tracked Tracked
M210 Cyanides (organic) Interstate only Tracked Interstate Tracked Tracked Interstate Tracked Tracked
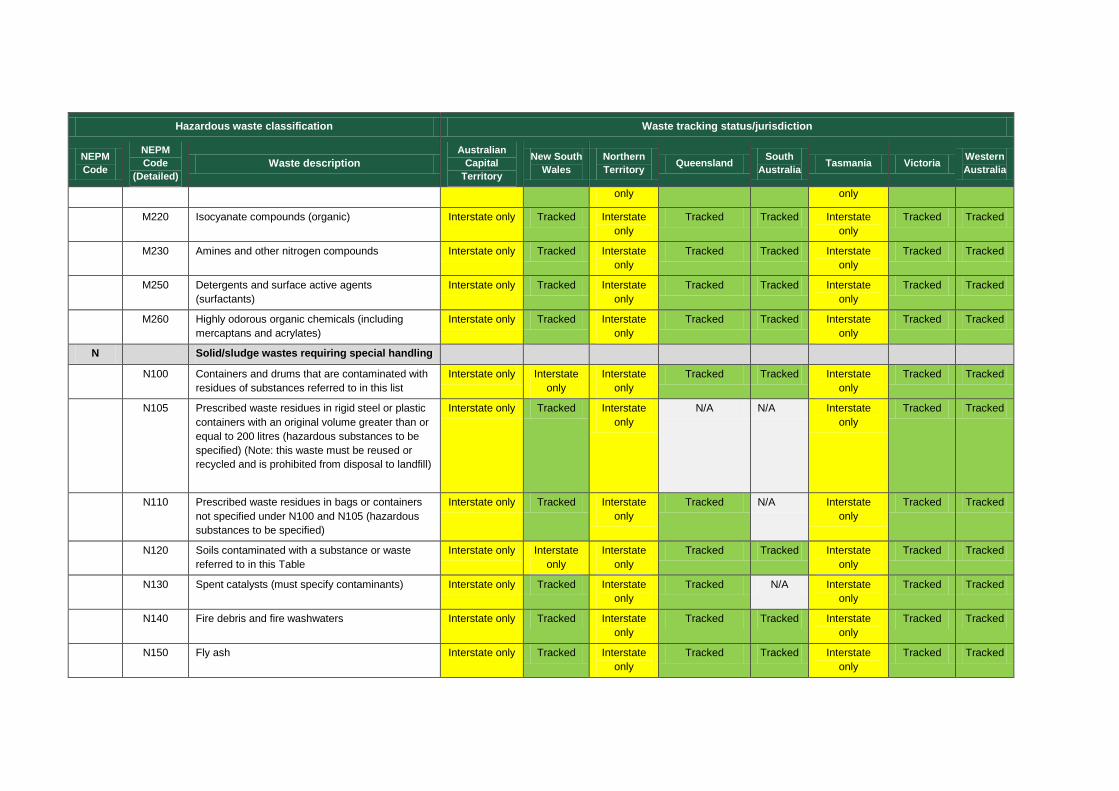
Hazardous waste classification Waste tracking status/jurisdiction
NEPM
Code
NEPM
Code
(Detailed)
Waste description
Australian
Capital
Territory
New South
Wales
Northern
Territory Queensland
South
Australia Tasmania Victoria
Western
Australia
only only
M220 Isocyanate compounds (organic) Interstate only Tracked Interstate
only
Tracked Tracked Interstate
only
Tracked Tracked
M230 Amines and other nitrogen compounds Interstate only Tracked Interstate
only
Tracked Tracked Interstate
only
Tracked Tracked
M250 Detergents and surface active agents
(surfactants)
Interstate only Tracked Interstate
only
Tracked Tracked Interstate
only
Tracked Tracked
M260 Highly odorous organic chemicals (including
mercaptans and acrylates)
Interstate only Tracked Interstate
only
Tracked Tracked Interstate
only
Tracked Tracked
N Solid/sludge wastes requiring special handling
N100 Containers and drums that are contaminated with
residues of substances referred to in this list
Interstate only Interstate
only
Interstate
only
Tracked Tracked Interstate
only
Tracked Tracked
N105 Prescribed waste residues in rigid steel or plastic
containers with an original volume greater than or
equal to 200 litres (hazardous substances to be
specified) (Note: this waste must be reused or
recycled and is prohibited from disposal to landfill)
Interstate only Tracked Interstate
only
N/A N/A Interstate
only
Tracked Tracked
N110 Prescribed waste residues in bags or containers
not specified under N100 and N105 (hazardous
substances to be specified)
Interstate only Tracked Interstate
only
Tracked N/A Interstate
only
Tracked Tracked
N120 Soils contaminated with a substance or waste
referred to in this Table
Interstate only Interstate
only
Interstate
only
Tracked Tracked Interstate
only
Tracked Tracked
N130 Spent catalysts (must specify contaminants) Interstate only Tracked Interstate
only
Tracked N/A Interstate
only
Tracked Tracked
N140 Fire debris and fire washwaters Interstate only Tracked Interstate
only
Tracked Tracked Interstate
only
Tracked Tracked
N150 Fly ash Interstate only Tracked Interstate
only
Tracked Tracked Interstate
only
Tracked Tracked

Hazardous waste classification Waste tracking status/jurisdiction
NEPM
Code
NEPM
Code
(Detailed)
Waste description
Australian
Capital
Territory
New South
Wales
Northern
Territory Queensland
South
Australia Tasmania Victoria
Western
Australia
N160 Encapsulated, chemically fixed, solidified or
polymerised wastes
Interstate only Tracked Interstate
only
Tracked Tracked Interstate
only
Tracked Tracked
N170 Prescribed industrial wastes that are chemically
fixed and/or encapsulated
Interstate only Tracked Interstate
only
Tracked N/A Interstate
only
Tracked Tracked
N180 Prescribed industrial wastes that are solidified or
polymerised
Interstate only Tracked Interstate
only
Tracked N/A Interstate
only
Tracked Tracked
N190 Filter cake Interstate only Tracked Interstate
only
Tracked Tracked Interstate
only
Tracked Tracked
N200 Ion-exchange column residues Interstate only Tracked Interstate
only
Tracked N/A Interstate
only
Tracked Tracked
N205 Residues from industrial waste treatment/disposal
operations
Interstate only Tracked Interstate
only
Tracked Tracked Interstate
only
N210 Residues from pollution control operations, NOS.
Examples: activated carbon, baghouse dust,
residues from industrial waste disposal operations
Interstate only Tracked Interstate
only
N/A N/A Interstate
only
Tracked Tracked
N220 Asbestos Interstate only Interstate
only
Interstate
only
Tracked Tracked Interstate
only
Tracked Interstat
e only
N230 Ceramic-based fibres with physicochemical
characteristics similar to those of asbestos
Interstate only Tracked Interstate
only
N/A Tracked Interstate
only
Tracked Interstat
e only
N250 Absorbents contaminated with prescribed waste
residues, such as rags contaminated with oils,
hydrocarbons and organic solvents (must specify
contaminants)
Interstate only Tracked Interstate
only
N/A N/A Interstate
only
Tracked Tracked
N260 Solid wastes contaminated with prescribed waste
residues, NOS (must specify contaminants).
Examples: contaminated bricks and concrete,
contaminated steel, shredder floc
Interstate only Tracked Interstate
only
N/A N/A Interstate
only
Tracked Tracked
R Clinical and pharmaceutical wastes
R100 Clinical and related wastes, NOS (biomedical
waste)
Interstate only Tracked Interstate
only
Tracked Tracked Interstate
only
Tracked Tracked

Hazardous waste classification Waste tracking status/jurisdiction
NEPM
Code
NEPM
Code
(Detailed)
Waste description
Australian
Capital
Territory
New South
Wales
Northern
Territory Queensland
South
Australia Tasmania Victoria
Western
Australia
R110 Pathogenic substances and quarantine wastes Interstate only Tracked Interstate
only
N/A N/A Interstate
only
Tracked Tracked
R120 Waste from the use of pharmaceutical products,
NOS
Interstate only Tracked Interstate
only
Tracked Tracked Interstate
only
Tracked Tracked
R130 Cytotoxic substances Interstate only Tracked Interstate
only
N/A N/A Interstate
only
Tracked Tracked
R140 Waste from the production of pharmaceutical
products and cosmetics, NOS
Interstate only Tracked Interstate
only
Tracked Tracked Interstate
only
Tracked Tracked
T Miscellaneous
T100 Waste chemical substances arising from
laboratories, research and development, or
teaching activities
Interstate only Tracked Interstate
only
Tracked Tracked Interstate
only
Tracked Tracked
T120 Waste from the production, formulation and use of
photographic chemicals and processing materials
(which do not contain silver)
Interstate only Tracked Interstate
only
Tracked Tracked Interstate
only
Tracked Tracked
T130 Inert sludges or slurries, such as clay or ceramic
suspensions, drilling mud, and pit water with
negligible hydrocarbon contamination
Interstate only Tracked Interstate
only
Tracked N/A Interstate
only
Tracked Tracked
T140 Tyres Interstate only Interstate
only
Interstate
only
Tracked Tracked Interstate
only
Not
tracked
Tracked
T160 Foundry sands Interstate only Tracked Interstate
only
N/A N/A Interstate
only
Tracked Tracked
T170 Waste chemicals in small quantities, NOS, such
as collected household chemicals
Interstate only Tracked Interstate
only
N/A N/A Interstate
only
Tracked Tracked


