Abt Associates | pg 1
Timothy Michalowski, GIS Director
GPS Data Collection for Regional Travel Surveys
Abt SRBI, 275 Seventh Ave, New York, NY 10001

Abt Associates | pg 2
Introduction
Timothy Michalowski, GIS Director, Abt SRBI 10+ years GIS experience, focus on GIS for Social Research Previously worked at NYC DOT, Puget Sound Regional Council Master of Urban Planning/GIS from University of Illinois (Chicago)
Abt SRBI National Leading survey research firm, founded in 1981
17th largest Research firm in USA (Honomichl List)
Headquarters in NYC, Offices in DC, Chicago, Boston, Arizona, North Carolina, Florida, Ohio
Expertise in 16 practice groups, including Transportation, Social Policy, Market Research, Health, Energy, Elections, GIS, etc.

Abt Associates | pg 3
Clients Include: – Amtrak
– Girl Scouts of America
– NYC Economic Development Corporation
– Port Authority of New York and New Jersey
– USAID
– Yum! Brands
– National Oceanic and Atmospheric Administration (NOAA)
– U.S. Department of Housing & Urban Development (HUD)
About Abt SRBI GIS
Abt Associates | pg 4
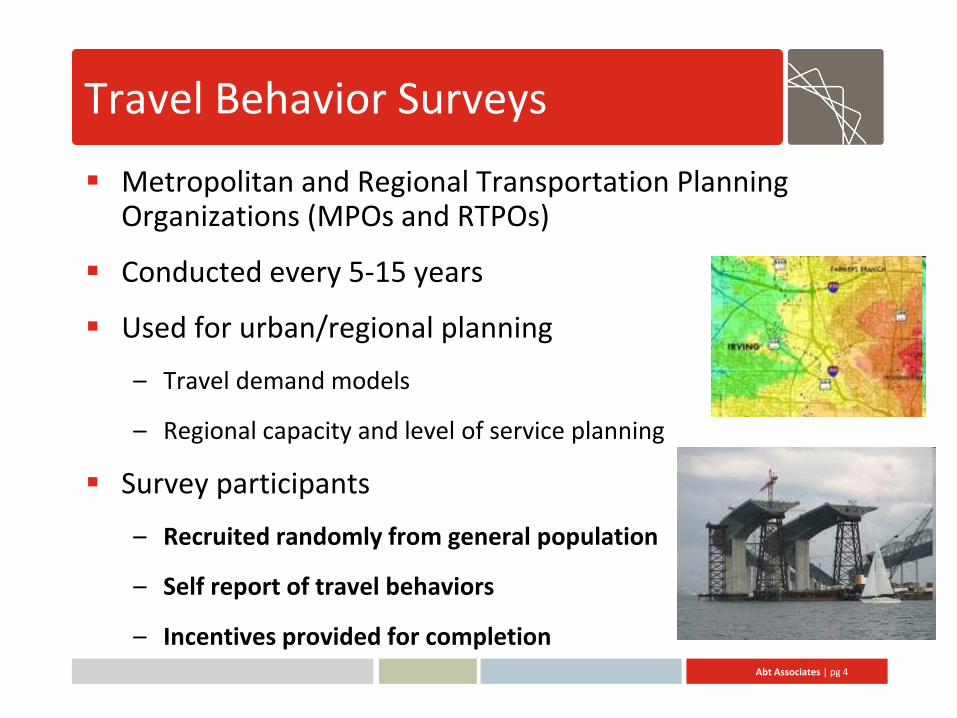
Travel Behavior Surveys
Metropolitan and Regional Transportation Planning Organizations (MPOs and RTPOs)
Conducted every 5-15 years
Used for urban/regional planning
– Travel demand models
– Regional capacity and level of service planning
Survey participants
– Recruited randomly from general population
– Self report of travel behaviors
– Incentives provided for completion

Abt Associates | pg 5
Objectives for Travel Surveys
What are the origins/destinations of individual trips?
What are the trip segments?
What are the trip distances/times/speeds?
What are the travel modes?
Ensuring high precision of data

Abt Associates | pg 6
Traditional Survey Methods v. GPS
Travel Diary Example GPS Data Example
Advantages of GPS: Route information, lower respondent burden, no data entry, increased data quality and data volume
Abt Associates | pg 7
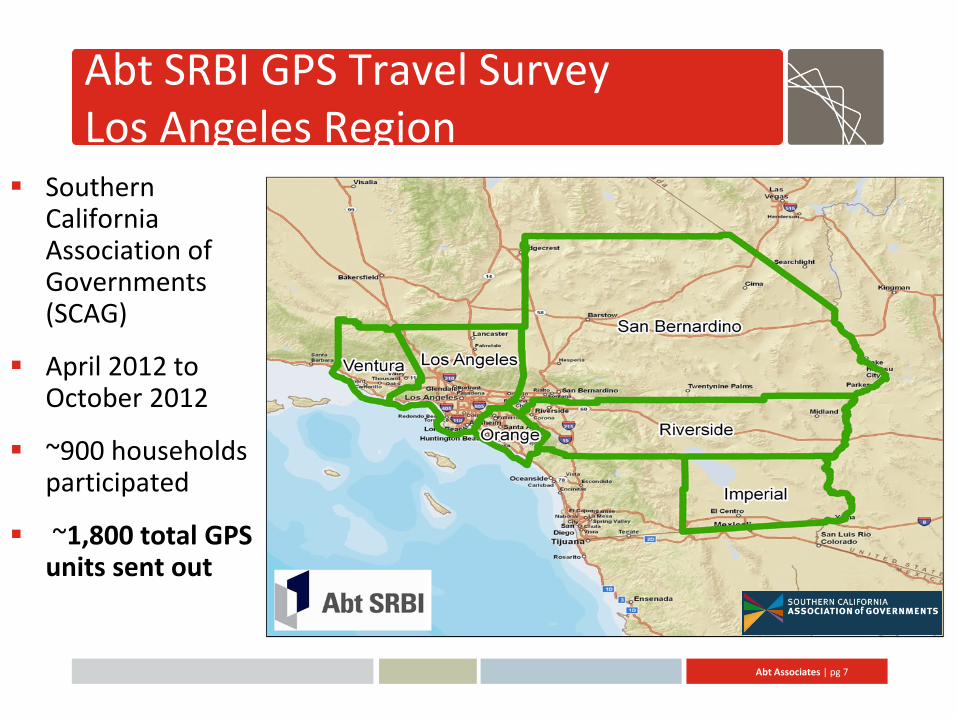
Abt SRBI GPS Travel Survey Los Angeles Region
Southern California Association of Governments (SCAG)
April 2012 to October 2012
~900 households participated
~1,800 total GPS units sent out
Abt Associates | pg 8
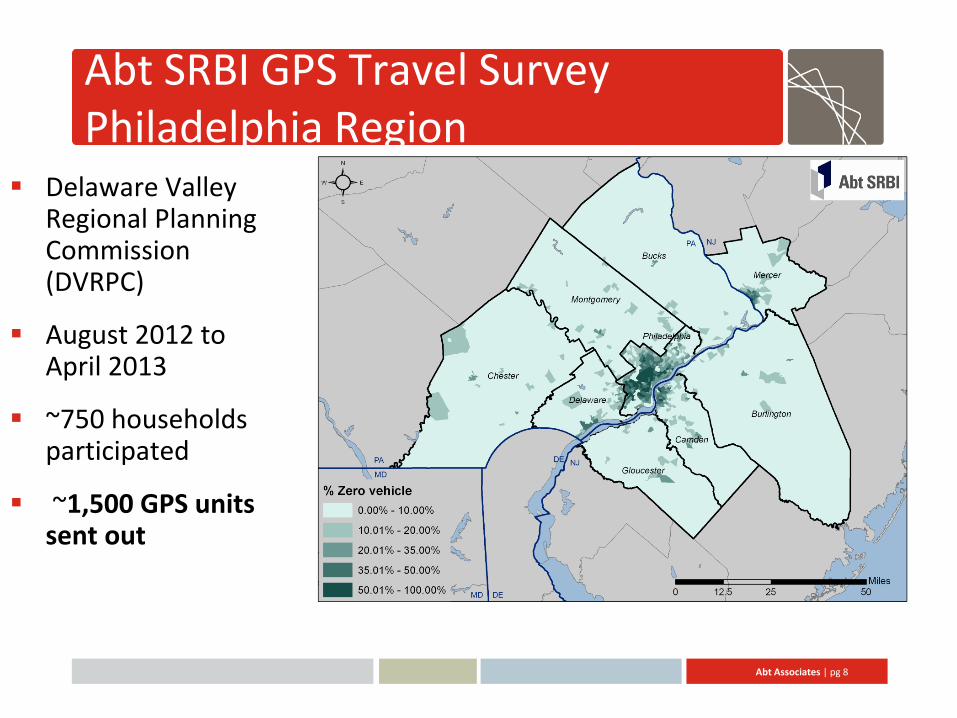
Abt SRBI GPS Travel Survey Philadelphia Region
Delaware Valley Regional Planning Commission (DVRPC)
August 2012 to April 2013
~750 households participated
~1,500 GPS units sent out
Abt Associates | pg 9
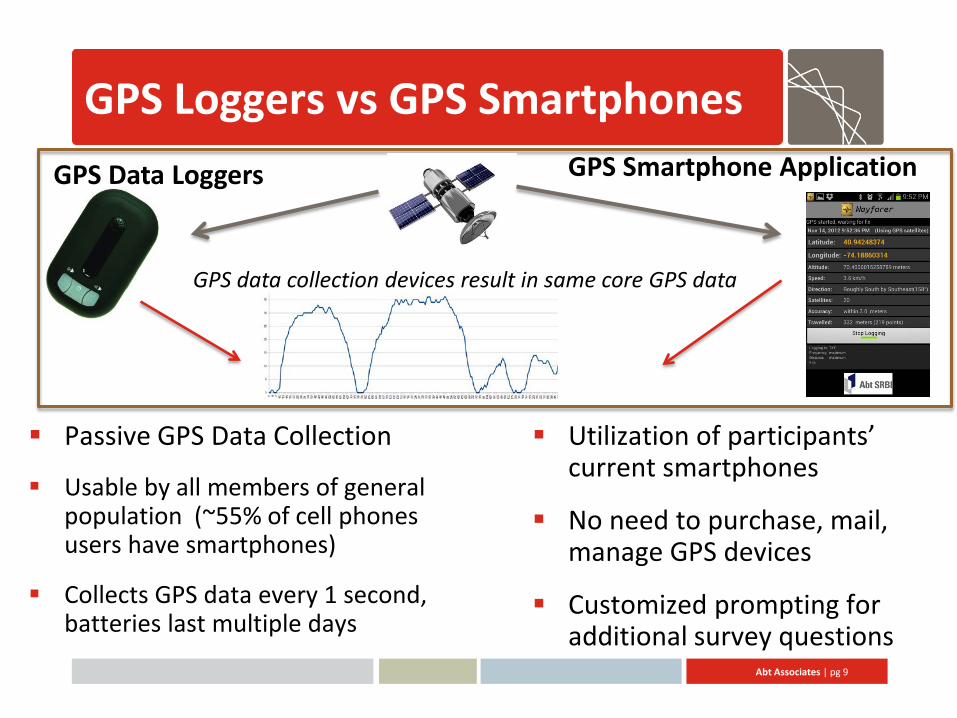
GPS Loggers vs GPS Smartphones GPS Data Loggers
GPS Smartphone Application
GPS data collection devices result in same core GPS data
Passive GPS Data Collection
Usable by all members of general population (~55% of cell phones users have smartphones)
Collects GPS data every 1 second, batteries last multiple days
Utilization of participants’ current smartphones
No need to purchase, mail, manage GPS devices
Customized prompting for additional survey questions
Abt Associates | pg 10
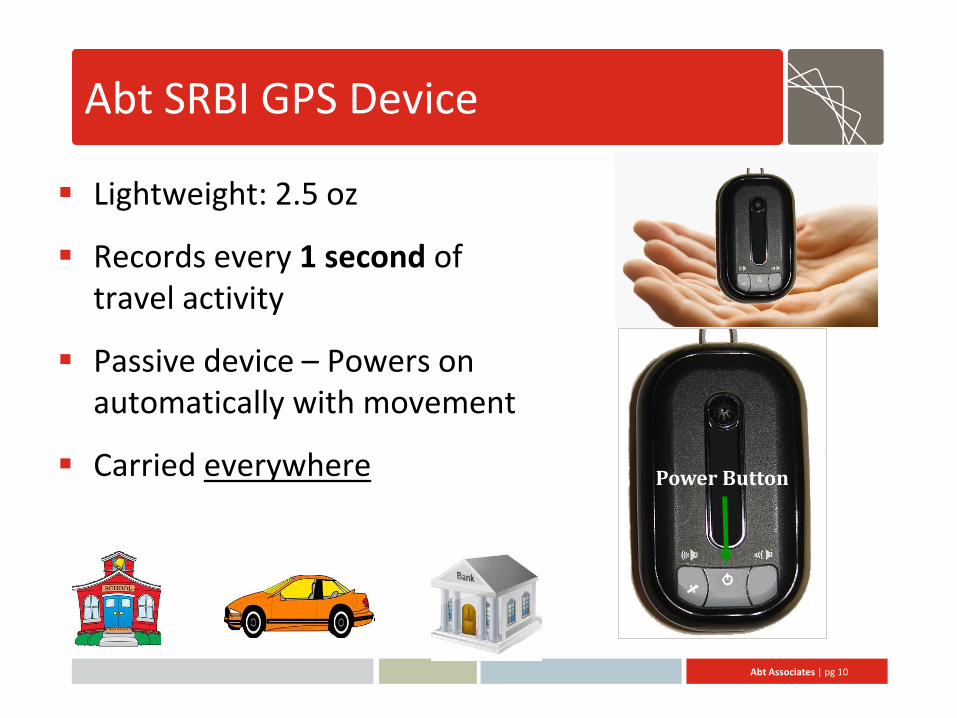
Abt SRBI GPS Device
Lightweight: 2.5 oz
Records every 1 second of travel activity
Passive device – Powers on automatically with movement
Carried everywhere Power Button
Abt Associates | pg 11
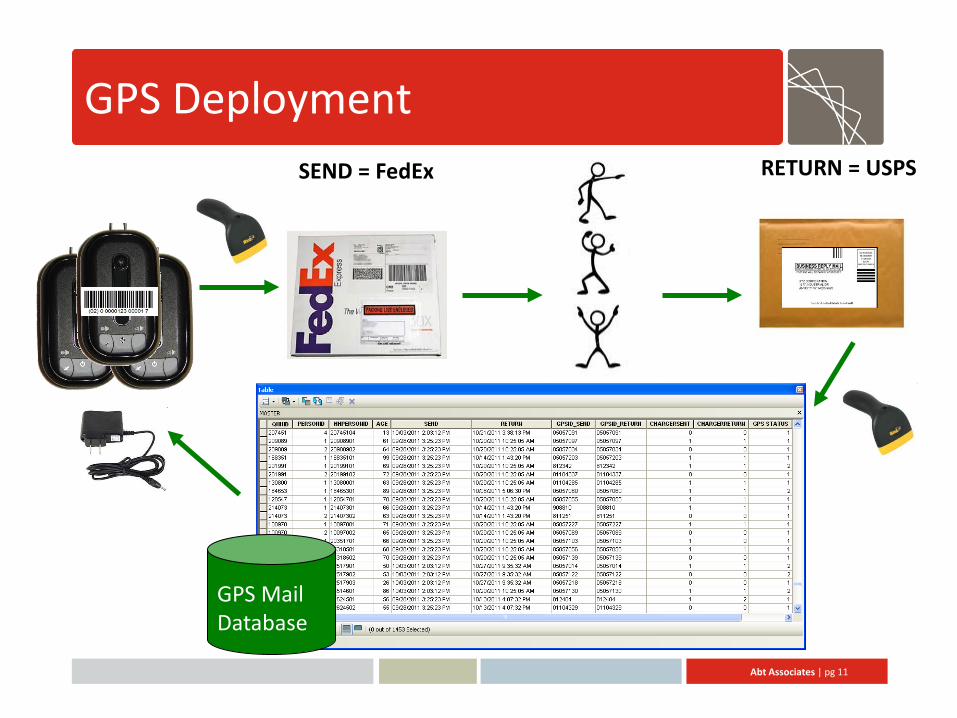
GPS Deployment
GPS Mail Database
SEND = FedEx RETURN = USPS
Abt Associates | pg 12
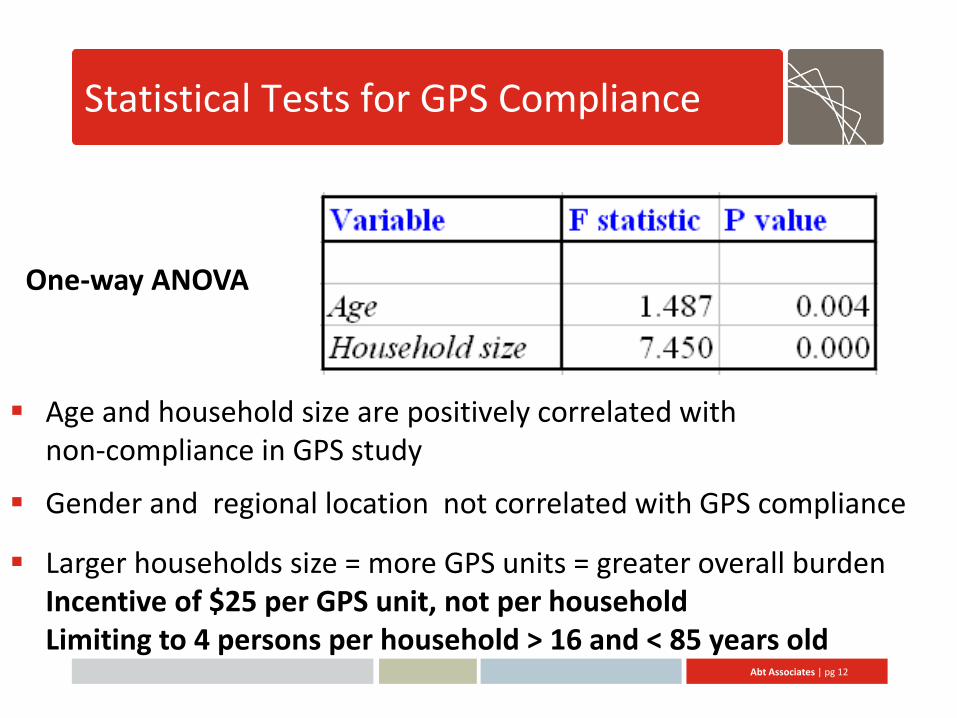
Statistical Tests for GPS Compliance
Age and household size are positively correlated with non-compliance in GPS study
One-way ANOVA
Gender and regional location not correlated with GPS compliance
Larger households size = more GPS units = greater overall burden Incentive of $25 per GPS unit, not per household Limiting to 4 persons per household > 16 and < 85 years old
Abt Associates | pg 13
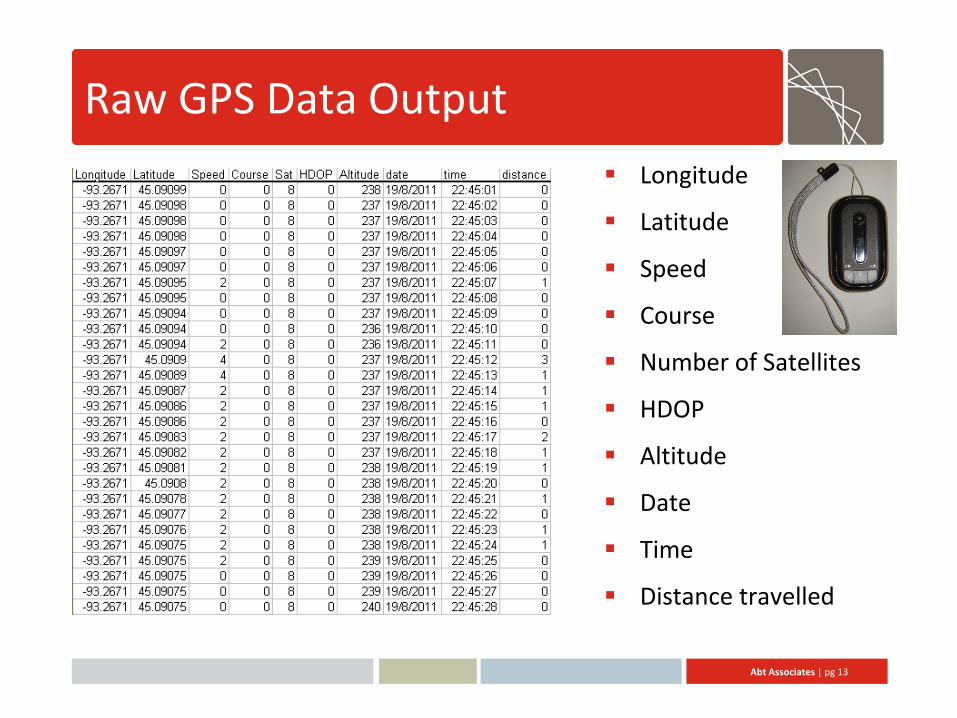
Raw GPS Data Output Longitude
Latitude
Speed
Course
Number of Satellites
HDOP
Altitude
Date
Time
Distance travelled

Abt Associates | pg 14
GPS Data Before Processing
Participant carries GPS
units indoors
Distorted waypoints resulting
from indoor use
Extraneous stationary
data

Abt Associates | pg 15
Determining Trips from GPS Data
150,000,000+ GPS Points 70,000+ Trips

Abt Associates | pg 16
Abt SRBI GPS Processing Model
Iteration through raw GPS files
Import to geodatabase used
for processing
Add fields to a processing table
Python scripts finding trip starts
and ends Output: cleaned feature
class of GPS trips per participant
Step 1:
Automated Determination of Travel Segments

Abt Associates | pg 17
Python Scripting for Trip Segments
Algorithm calculates a single start point and end point for each trip/trip segment
Based on accelerating and decelerating speeds in the raw data
Identifies clouds of “starts” and “ends” in the data and selects a final start and final end point and time

Abt Associates | pg 18
Trip Segment Intervals
Travel Speed (mph)
Travel Time (seconds)
< 120 second gaps = Same trip segment (stop light) > 120 second gap = New trip segment
1 Trip Segment
Abt Associates | pg 19
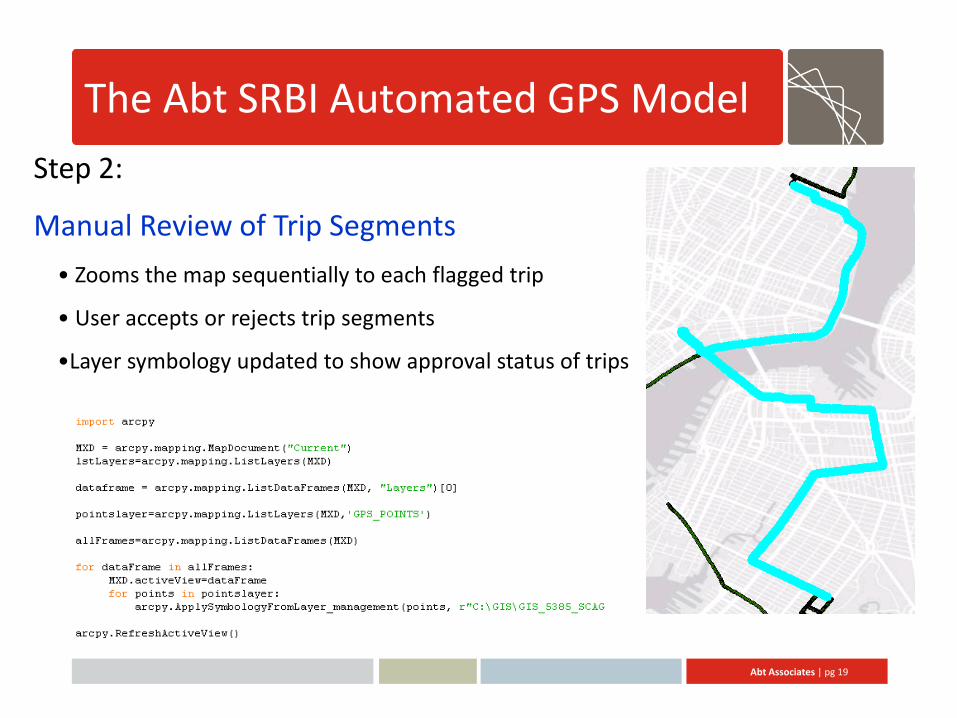
The Abt SRBI Automated GPS Model Step 2:
Manual Review of Trip Segments • Zooms the map sequentially to each flagged trip
• User accepts or rejects trip segments
•Layer symbology updated to show approval status of trips

Abt Associates | pg 20
The Abt SRBI Automated GPS Model Step 3:
Trip Speed Calculations & Final Products
•Uses the datetime module in python to calculate total trip time
•Calculates length of trip line to determine trip distance
•Divides distance by time to generate trip speed
Abt Associates | pg 21
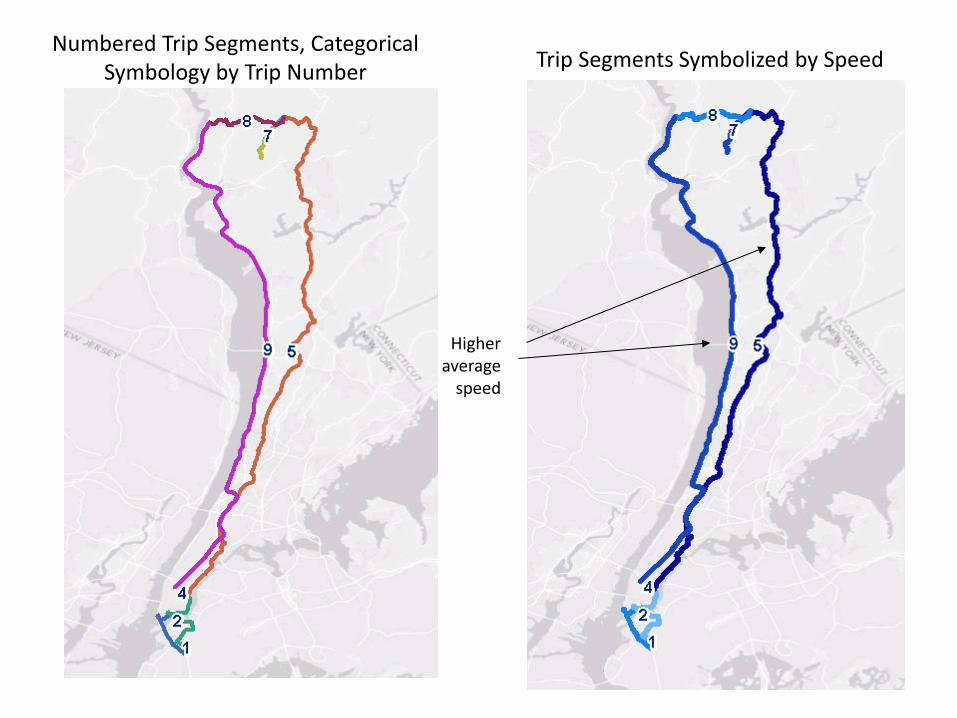
Numbered Trip Segments, Categorical Symbology by Trip Number Trip Segments Symbolized by Speed
Higher average
speed
Abt Associates | pg 22
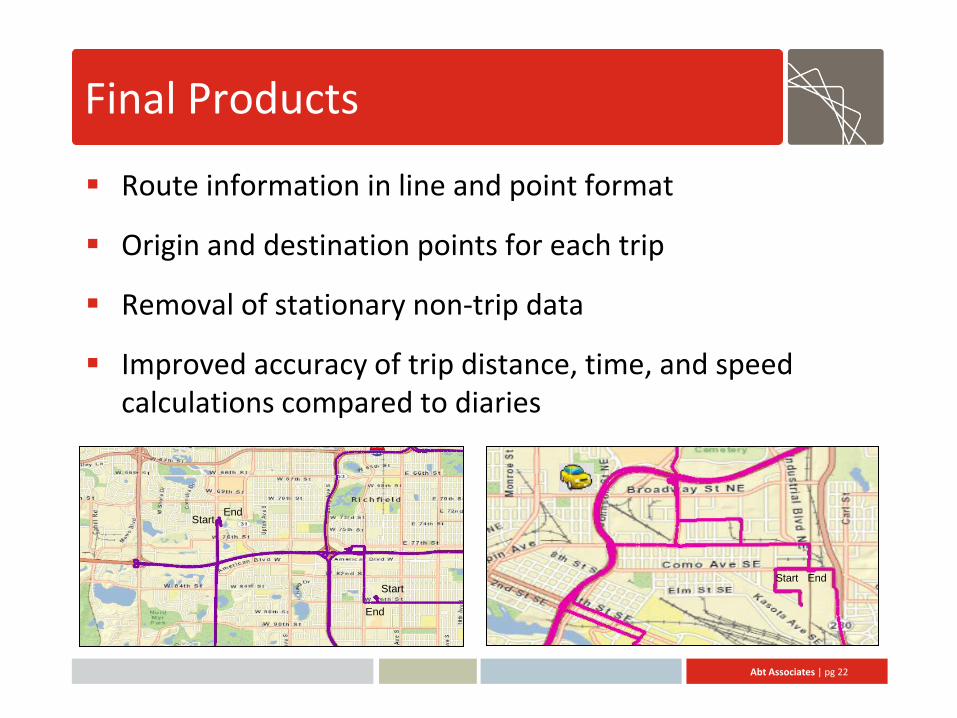
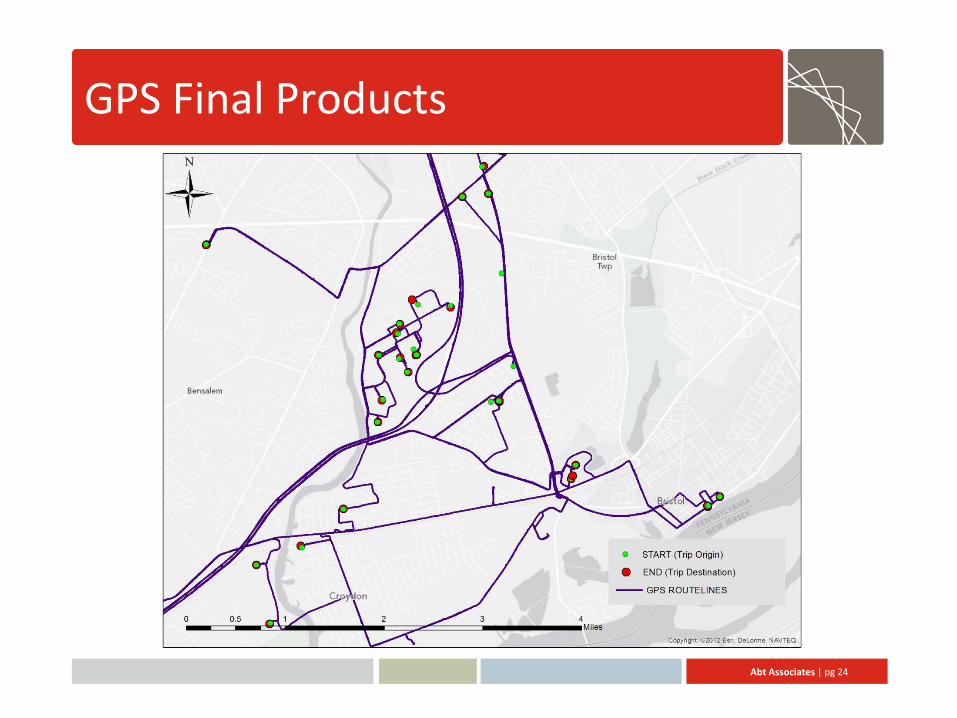
Final Products
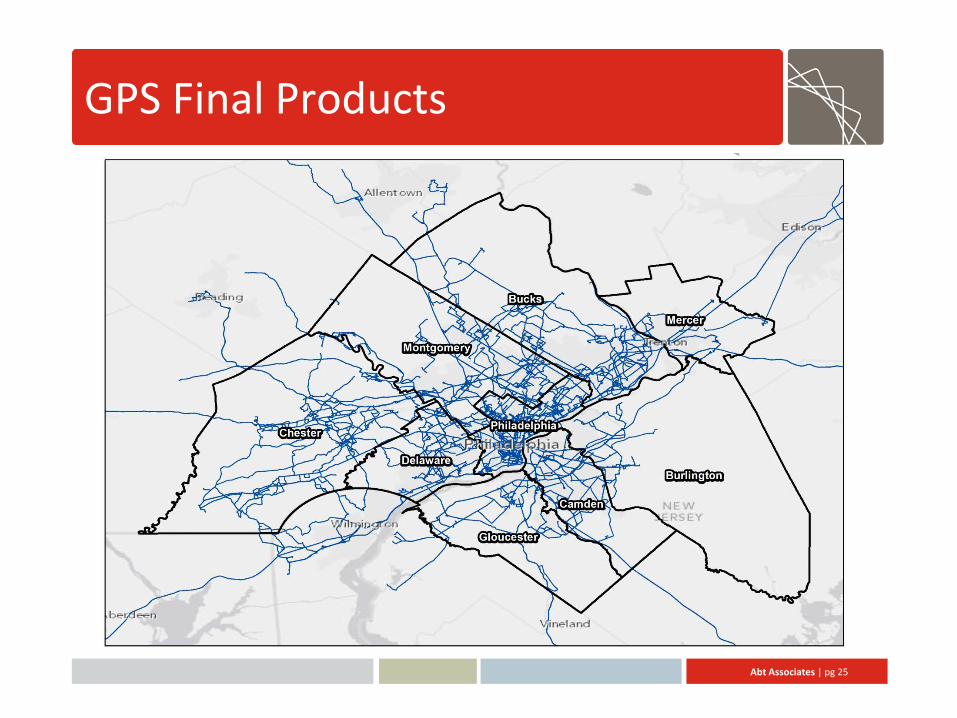
Route information in line and point format
Origin and destination points for each trip
Removal of stationary non-trip data
Improved accuracy of trip distance, time, and speed calculations compared to diaries
Start
End
Start End
Start End

Abt Associates | pg 23
GPS Final Products
Raw GPS Data Cleaned Points Output Trip Lines
Abt Associates | pg 24
GPS Final Products
Abt Associates | pg 25
GPS Final Products
Abt Associates | pg 26
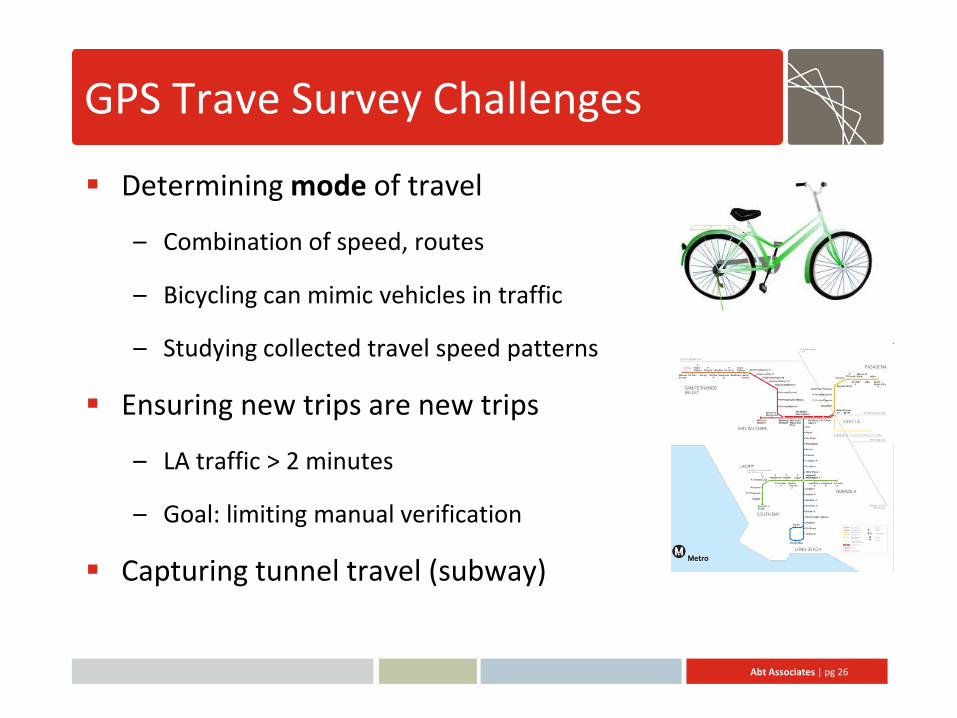
GPS Trave Survey Challenges
Determining mode of travel
– Combination of speed, routes
– Bicycling can mimic vehicles in traffic
– Studying collected travel speed patterns
Ensuring new trips are new trips
– LA traffic > 2 minutes
– Goal: limiting manual verification
Capturing tunnel travel (subway)

Abt Associates | pg 27
GPS Trave Survey Challenges
Capturing tunnel travel (subway)
A. LINE DATASET B. FINAL POINT DELIVERABLES

Abt Associates | pg 28
GPS Travel Survey Conclusions Successful data collection method
– 200+ million GPS points collected
– 30,000+ days of travel information collected
Lowers respondent burden
– Higher response rates with GPS compared to travel diaries
– No filling out of lengthy forms
GPS Loggers work for now, smartphones are next step
– GPS loggers and Smartphones used in collaboration to reach all populations
More robust, accurate data for planning
– Route information
– Eliminates data entry errors
– Output integrates with travel demand models
ESRI products provide the necessary tools
– SQL Server 64 bit for all data storage
– ModelBuilder, Python
– ArcMap for Review (developing a mapping API)

Abt Associates | pg 29
Contact Information
Timothy Michalowski Abt SRBI GIS Director 275 7th Ave, Suite 2700 New York, NY 10001 646-486-8404
Thank you


