Download - Gordon Guyatt McMaster University - MICEapps

Gordon Guyatt
McMaster University

Does publication bias exist?
What are the varieties of selective reporting?
What are the causes of selective reporting?
Can there also be problems in dissemination?
Are there any possible solutions?

Selective reporting of results Systematically related to effect
Publication bias “Negative” studies remain unpublished
“Unpublished” ambiguous▪ Peer-reviewed journal
▪ Non-peer-reviewed
▪ Book
▪ Book/journal edition of conference abstracts
▪ Doctoral thesis
How could you design a study to look at extent of publication bias?

Easterbrook Lancet 1991

2008


Articles published in NEJM and other top journals more trustworthy/important?
Articles published in obscure journals less trustworthy/important?
Obscure publication
Dissemination bias
Delay in publication
Time lag bias
Selective reporting of outcomes

Authors decide study is uninteresting Don’t bother writing up
Delay in writing up and submitting
Submission to low impact or foreign language journal
Editors decide uninteresting Paper rejected and authors give up
Authors persist, but publication delayed, low impact journal

Salmeterol Multicentre Research Trial (SMART) 26,000 person RCT in asthmatic patients
Usual care or uc + salmeterol
28 weeks follow-up
Primary outcome respiratory-related death, life-threatening
September 2002, Glaxo stopped study Near significant increase in primary outcome salmeterol
50 outcomes salmeterol, 36 control (RR 1.39, 95% CI 0.9 – 2.13)
Submitted report to FDA including deaths 6 mos after study period FDA rejected analysis


Positive
Poldermans (NEJM, n=112)
▪ RRR 80%
Negative
DIPOM (BMJ, n = 921),
▪ RRI: 3%
POBBLE (J Vasc Surgery, n = 103)
▪ RRI = 6%
MAVS (Am Heart J, n = 496),
▪ RRR = 15%
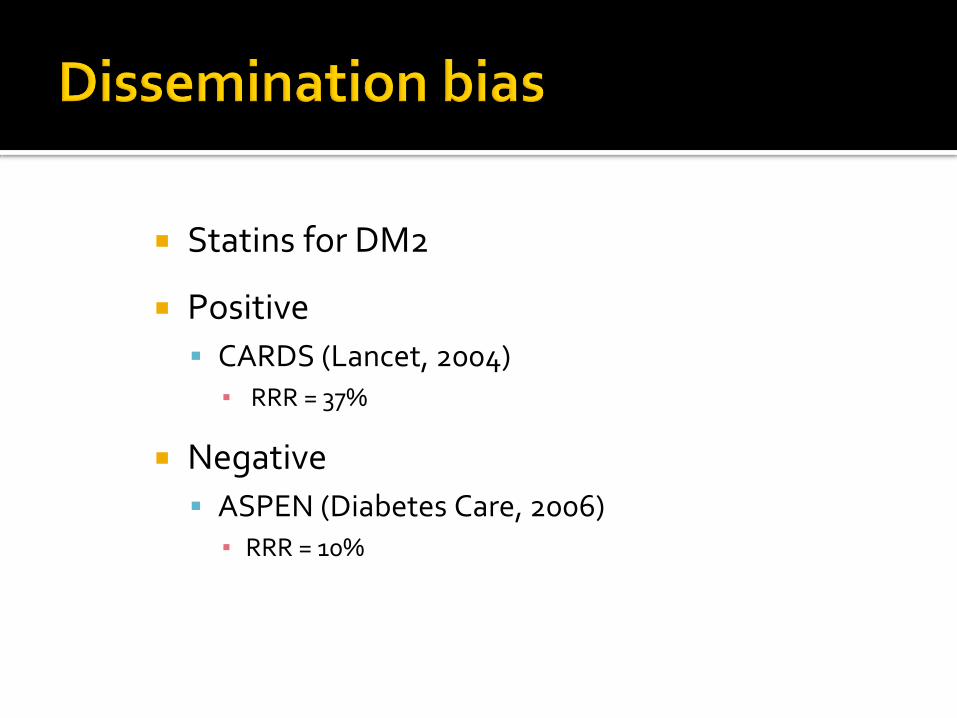
Statins for DM2
Positive
CARDS (Lancet, 2004)▪ RRR = 37%
Negative
ASPEN (Diabetes Care, 2006)▪ RRR = 10%

Lay press Negative, no coverage; positive +++
Indexing in Medline, Embase Negative, not in indexed journal
New reports Omit mention of negative trial
Multiple reports Positive study frequent; negative study never
Solution: systematic review

Do smaller studies show bigger effects?
Funnel plots, visually assessed
Funnel plots, statistical analysis
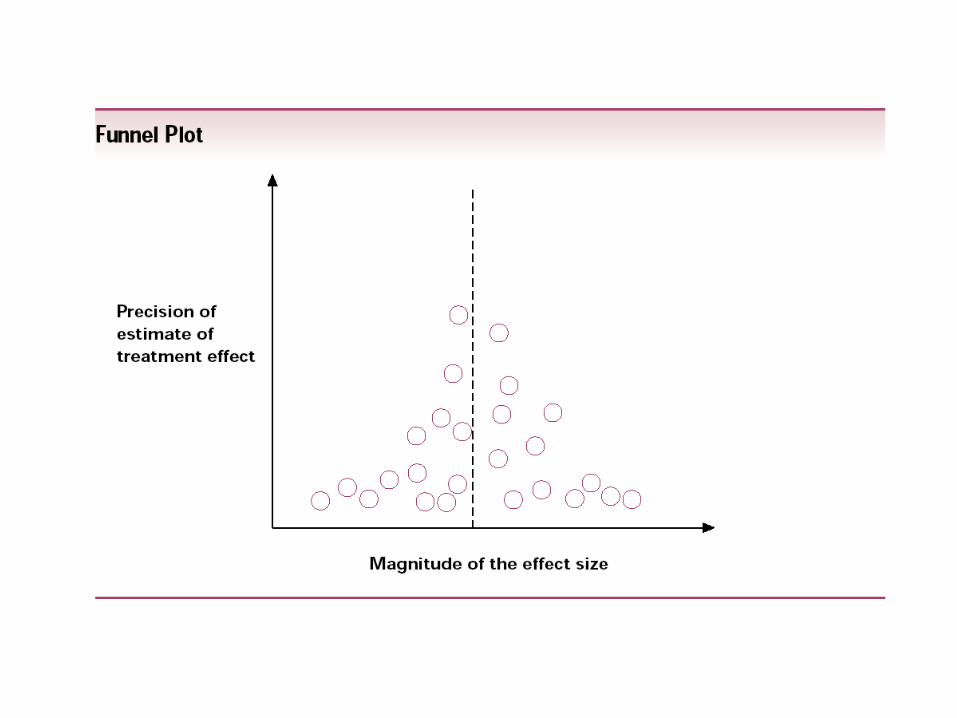


Need 10+ studies
Visual inspection unreliable
Statistical test for larger effects in small trials
If positive, possible explanations? Publication bias Chance Poor design of small studies (exaggerated effects) True effect larger
More responsive population, more carefully intervention

Do smaller studies show bigger effects?
Funnel plots, visually assessed
Funnel plots, statistical analysis
Reconstruct evidence by restoring picture after accounting for postulated publication bias
Trim and fill
Fail-safe N

How would you detect selective reporting?
All RCTs published December 2000
Level of reporting
Full (sufficient for meta-analysis)
Partial (more than p-value)
Qualitative (p-value or NS)
Not reported
Survey of investigators Checked protocols

519 trials 69% responded
▪ Lower rate in strictly industry funded
Median 11 efficacy outcomes 75% of trials some incomplete reporting
▪ Median 42% not fully reported
33% of trials outcome not reported at all▪ In 90 trials denied by authors
Stat significant higher odds full reporting OR 2.0 (95% CI 1.6 – 2.7) Full or partial vs qual or not reported 3.2 (2.4 – 4.2)

Scientific and Ethical Committee, Denmark
protocols and amendments 1994-5
102 randomized trials, at least 1 journal article

49/102 responded 86% initially denied unreported outcomes
71% at least 1 unreported benefit outcome In protocol or methods, not in results
92% at least 1 underreported
Median of 4 outcomes unreported
7/23 said “lack of stat sig” reason
17/63 (27%) underreported primary outcome
OR of full report if stat sig 2.4 (1.4 – 4.0) full or partial vs qual or not 3.1 (1.7 -5.9)
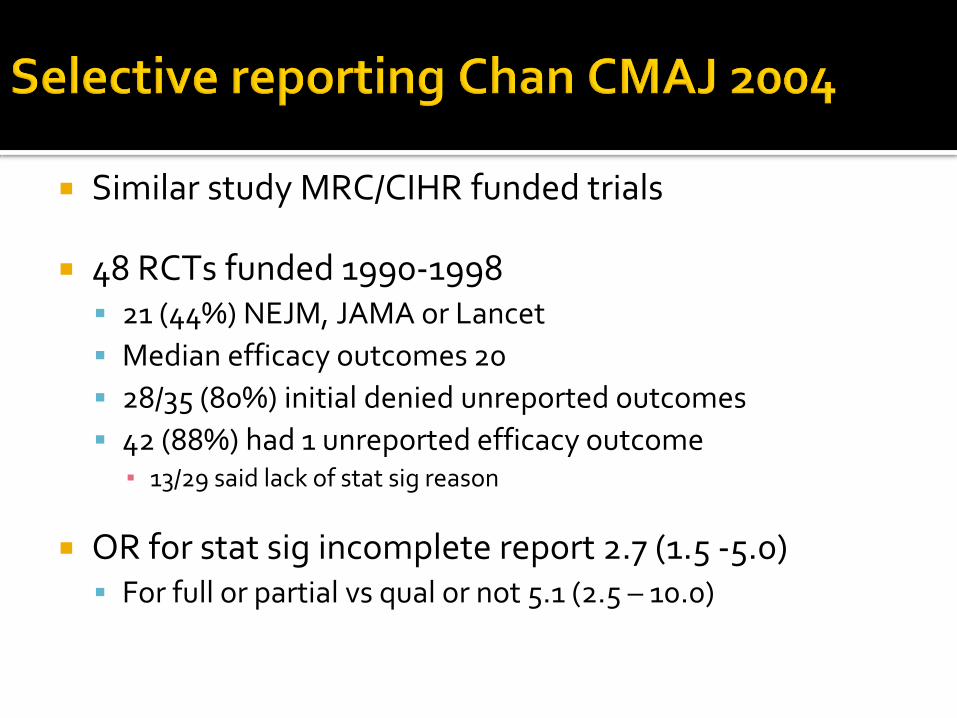
Similar study MRC/CIHR funded trials
48 RCTs funded 1990-1998 21 (44%) NEJM, JAMA or Lancet
Median efficacy outcomes 20
28/35 (80%) initial denied unreported outcomes
42 (88%) had 1 unreported efficacy outcome▪ 13/29 said lack of stat sig reason
OR for stat sig incomplete report 2.7 (1.5 -5.0) For full or partial vs qual or not 5.1 (2.5 – 10.0)

To what extent do Cochrane meta-analyses include only a proportion of identified studies for patient-important outcomes?
Is there an association between the proportion of RCTs included in a meta-analysis and its pooled effect size?

% RCTscontributing
OR (95%CI)
0-20% 2.67 (1.81 to 3.94)
20-40% 2.38 (1.72 to 3.28)
40-60% 2.22 (1.64 to 3.01)
60-80% 1.61 (1.36 to 1.90)
80-100% 1.87 (1.52 to 2.31)
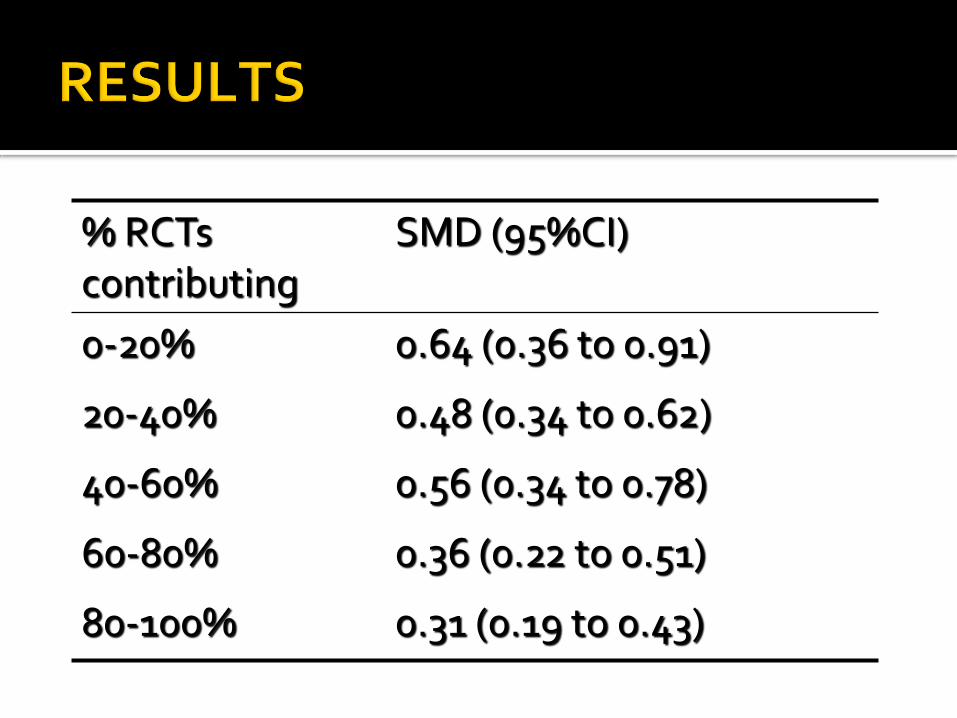
% RCTscontributing
SMD (95%CI)
0-20% 0.64 (0.36 to 0.91)
20-40% 0.48 (0.34 to 0.62)
40-60% 0.56 (0.34 to 0.78)
60-80% 0.36 (0.22 to 0.51)
80-100% 0.31 (0.19 to 0.43)


Publication, Dissemination bias
Systematic review
Advanced registration of trials
Advanced registration of protocols
Some progress
Top journals accepting only if advanced registration

Emphasis on systematic reviews Major help with dissemination bias Some help with publication bias if search
Special alertness for publication bias RCTs small, industry sponsored Observational studies
Special alertness for selective reporting Primary studies
▪ Odd primary, odd composite▪ Lack of specification of a priori in protocol
Systematic review▪ Many/most studies don’t report outcome

@EBCPMcMasterFollow us on Twitter


