
FUNDING AND DELIVERING DEVELOPMENT AND RENEWALMaking Total Capital Work
24th November 2010

Gerry HughesExecutive Director
Planning, Development and Regeneration
Introduction

Agenda
08:45-09:45
Peter Bishop, LDA Group Director of Design, Development and Environment and Deputy Chief Executive
09:45-10:30Q&A
Rick Lawrence, Director, Property Partnerships, TelerealTrillium
Brian Reynolds, LGID, CLG Capital and Asset Pathfinders Programme lead (former Deputy Chief Executive of LB Barnet)
08:30-08:45Gerry Hughes, Chair’s opening statement
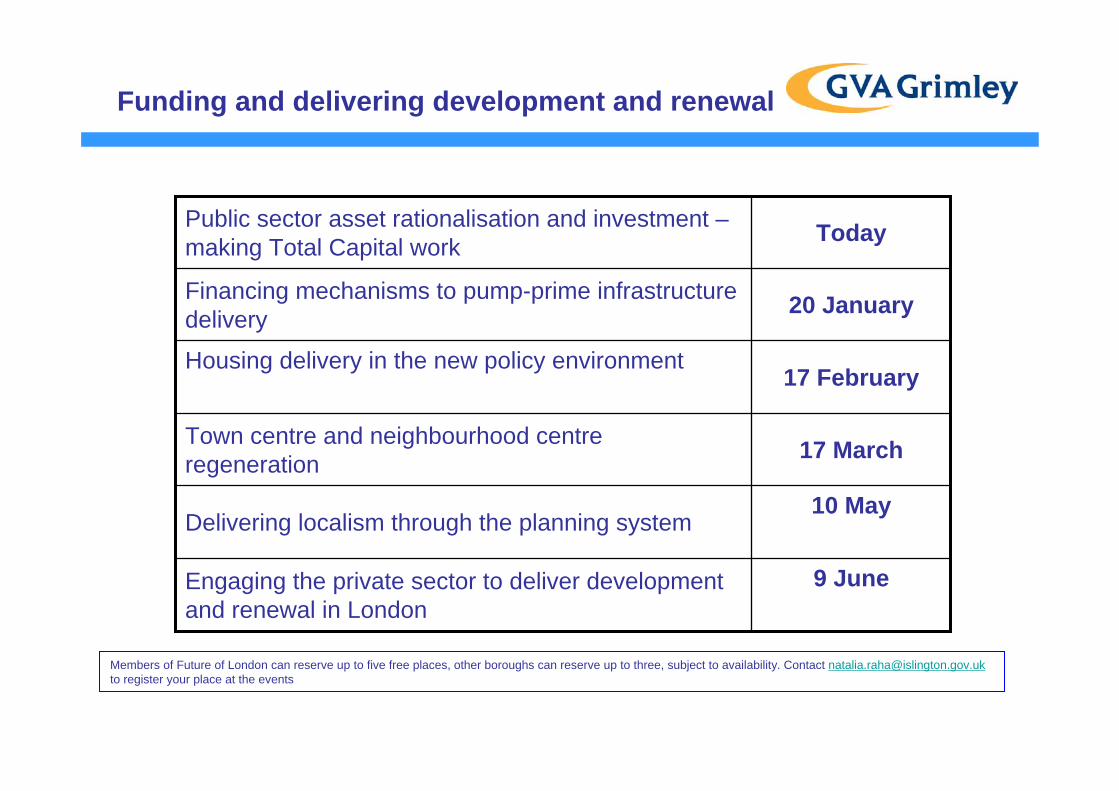
Funding and delivering development and renewal
TodayPublic sector asset rationalisation and investment –making Total Capital work
9 JuneEngaging the private sector to deliver development and renewal in London
10 MayDelivering localism through the planning system
17 MarchTown centre and neighbourhood centre regeneration
17 FebruaryHousing delivery in the new policy environment
20 JanuaryFinancing mechanisms to pump-prime infrastructure delivery
Members of Future of London can reserve up to five free places, other boroughs can reserve up to three, subject to availability. Contact [email protected] register your place at the events

Public sector asset rationalisation and investment:
Making Total Capital work

Context: Local Government funding
• Government CSR proposals:– Revenue funding cut by 26%– Capital funding cut by 45%
• Implications:– Review of working practices– Use space more efficiently– Reduce rent paid and increase capital receipts– But weak occupier and investment property market particularly for
secondary/tertiary property in areas with highest public sector employment
Context: Housing
• Government proposals– Up to 150,000 new affordable homes up to 2014-15– Reform of housing finance so local authorities will have more
control over their own finances and keep sale receipts– Localism and New Homes Bonus to increase house building
• Implications:– Housing budget more than halved, and housing market remains
weak– Two thirds of social housing tenants receive welfare payments, so
welfare cuts will hit hard– New tenancy rents at 80% of market levels will improve
development viability– Will New Homes Bonus (six years council tax) be enough to
encourage more planning approvals and more house building?

Context: Development Market…
• Stalled schemes
• Stagnant Market
• Reduced market capacity– Reduction in number of
developers– Reduction in size of
developers
• Banking debt finance hard to source
• No one willing to take risk on up front costs and infrastructure
• Been reliant on re-phased schemes– Affordable homes– Government backed
…but these will dry up soon
• Traditional model of cross-subsidisation has failed – Profitable elements squeezed– Little or no grant– Financial viability has fallen– Developer return fallen/planning
gain lower– Debt availability fallen

Context: Government bodies in London*
33 Boroughs
274 other government bodies (at least!)
And then civil society…
* Source: London Communications Agency with the NLA

Context: London Central Government estate*
* Source: Government Office for London

The challenge facing London authorities
• Number of organisations involved – governance and decision making
• Multiple funding streams and ability to align investment
• Effective structures for joint investment and sharing of benefits
• Future delivery structures and service demands
• Competing priorities and targets between public sector bodies
• Information – only one in five finance directors believe they have the information they need to manage their estate properly
• Conflict between the desire to retain freehold ownership with the need and efficiency of a flexible estate
The opportunity for London authorities
• Act as lead for the public estate in the locality:– Local authority taking the lead landlord role– Local authority taking the lead role in developing out surplus estate
• Use the opportunities from surplus estate to support regeneration
• Engage with the Private Sector to assist – use assets as incentives

The private sector is interested…
Private Sector Shortlists
Croydon Council• Amec• Amey / Telereal• British Land• John Laing• Kier Property• Land Securities
Trillium• Lend Lease• Mapeley, Terrace
Hill and Fairview.
Network Rail• British Land• Capital & Counties• Explore• Kier • Lendlease• Muse• St Modwen
Newcastle Council• Barratt Artisan• Countryside• Compendium* • Gleeson• Grainger • Persimmon• St Modwen• Taylor Wimpey• Urban Splash*Lovells/Riverside RSL

Making Total Capital work
• How can local authorities lead the way in taking a public sectorwide approach to strategic asset planning?
• Once surplus assets are identified, what can the public sector do with this part of their estate in the current market?
• What are the best structures for maximising value for money in the management of the combined operational estate?

Our speakers
• Peter Bishop, LDA Group Director of Design, Development and Environment and Deputy Chief Executive
• Brian Reynolds, LGID, CLG Capital and Asset Pathfinders Programme lead (former Deputy Chief Executive LB Barnet)
• Rick Lawrence, Director, Property Partnerships, Telereal Trillium

Future of London Conference Capital Assets
24 November 2010
Peter BishopDeputy Chief Executive London Development Agency

We are now entering a completely different operating environment

If we do not have money what can London Government offer?

Spatial Co-ordination

COVERS OF OUTPUTS
London’s population will grow – but where?
The Growth of a City – Shifting East
KCAP Allies & Morrison EDAW

Reviewing spatial priorities

Public transport investment


Big Strategies

London Development Agency
London: New Urban Agenda

Places and Spaces: London’s Olympic Legacy
Eleanor Fawcett, Design for London 30 October 2008
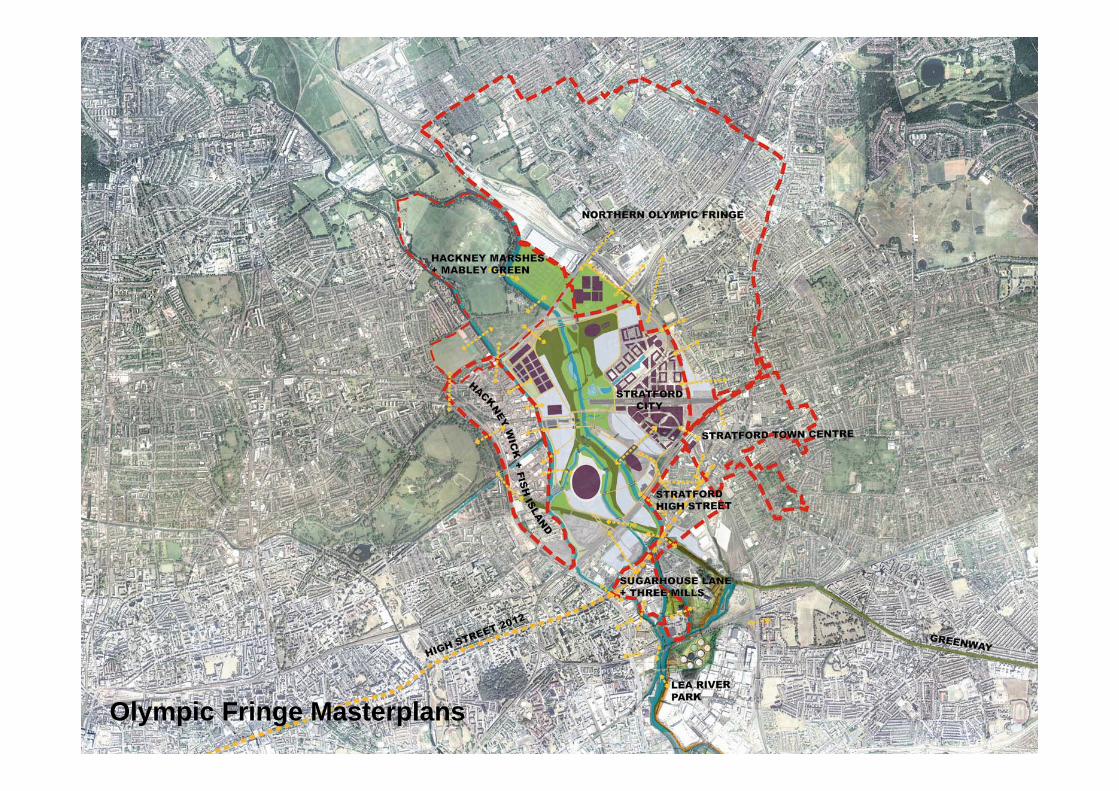
Olympic Fringe Masterplans
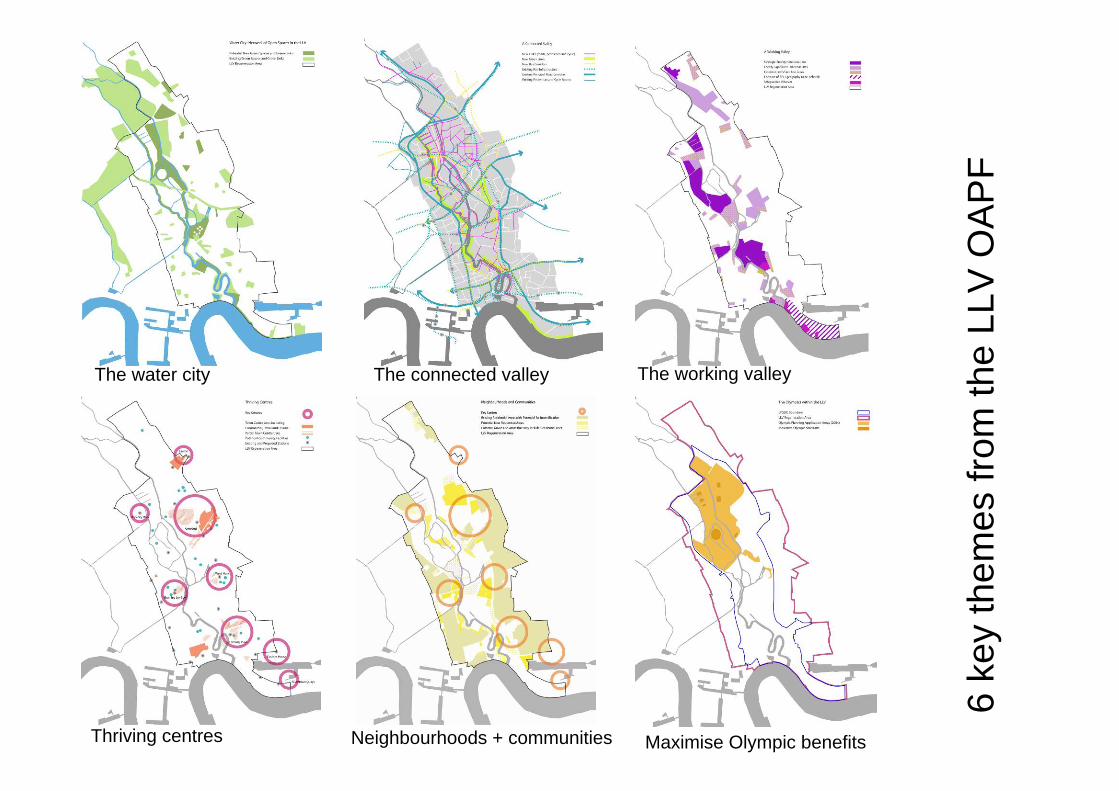
The water city
Thriving centres Neighbourhoods + communities Maximise Olympic benefits
The connected valley The working valley
6 ke
y th
emes
from
the
LLV
OA
PF

650,000 new people+

Housing & LDA land
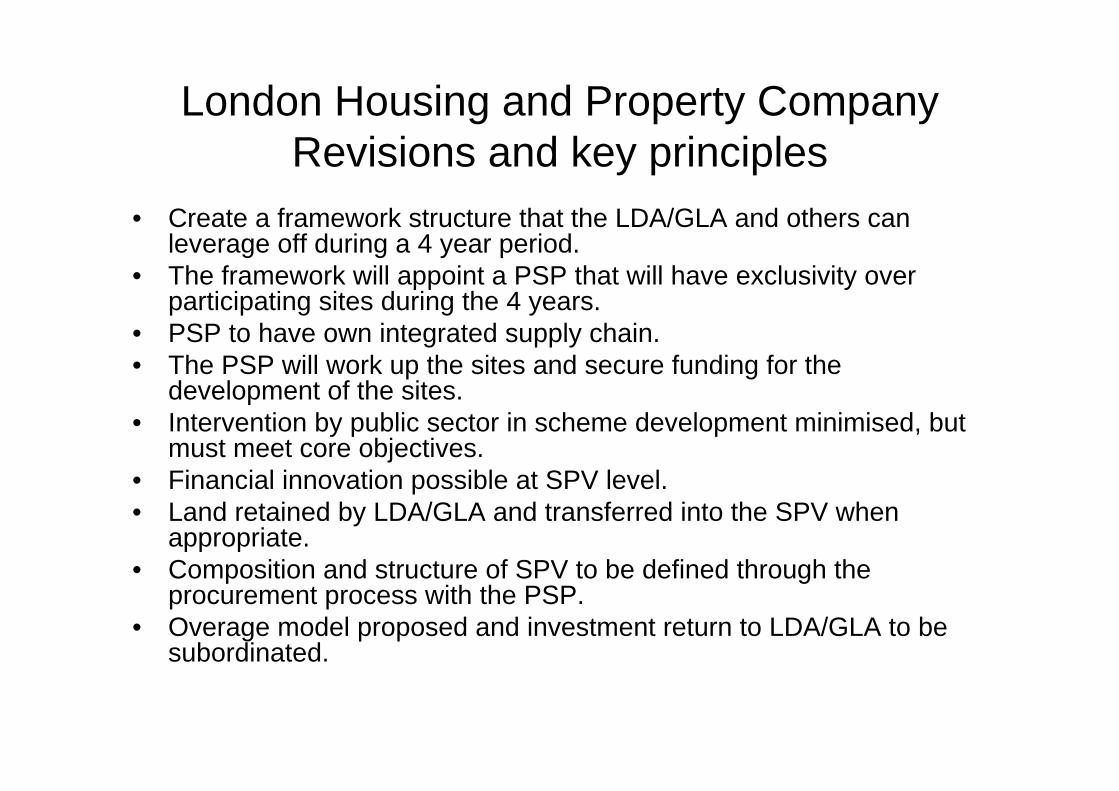
London Housing and Property CompanyRevisions and key principles
• Create a framework structure that the LDA/GLA and others can leverage off during a 4 year period.
• The framework will appoint a PSP that will have exclusivity overparticipating sites during the 4 years.
• PSP to have own integrated supply chain.• The PSP will work up the sites and secure funding for the
development of the sites.• Intervention by public sector in scheme development minimised, but
must meet core objectives.• Financial innovation possible at SPV level.• Land retained by LDA/GLA and transferred into the SPV when
appropriate.• Composition and structure of SPV to be defined through the
procurement process with the PSP.• Overage model proposed and investment return to LDA/GLA to be
subordinated.
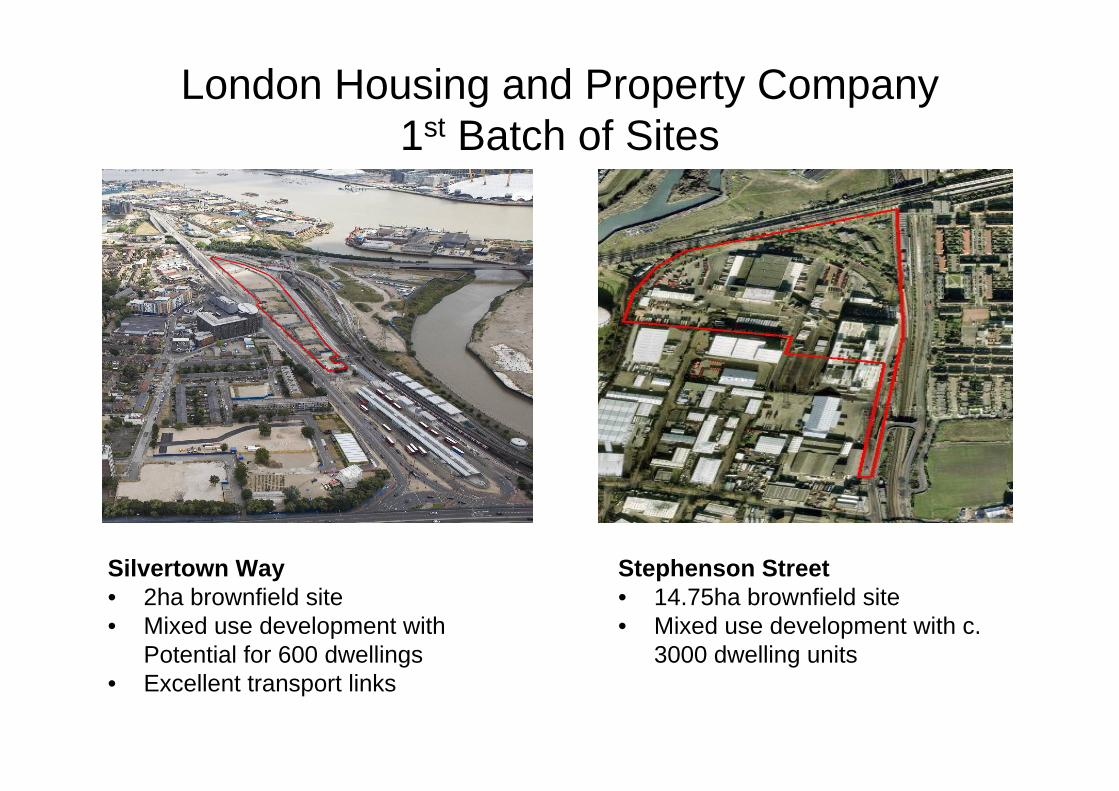
London Housing and Property Company1st Batch of Sites
Silvertown Way• 2ha brownfield site• Mixed use development with
Potential for 600 dwellings• Excellent transport links
Stephenson Street• 14.75ha brownfield site• Mixed use development with c.
3000 dwelling units

London Housing and Property Company
1st batch of sites (cont.)Other sites?
- Considering Silvertown Quays
- Considering potential for other GLA family land (TfL, Met) to be included.

Use Land
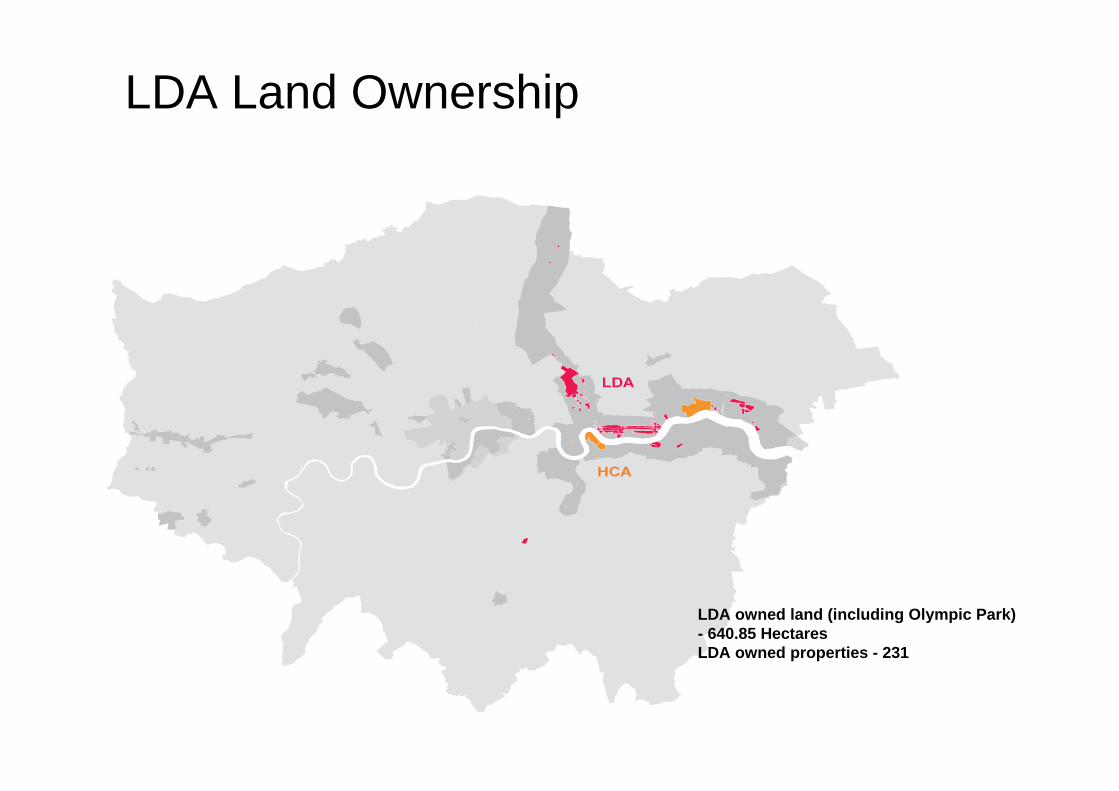
LDA Land Ownership
LDA owned land (including Olympic Park)- 640.85 HectaresLDA owned properties - 231

St Andrews

Dock spaces and river edges
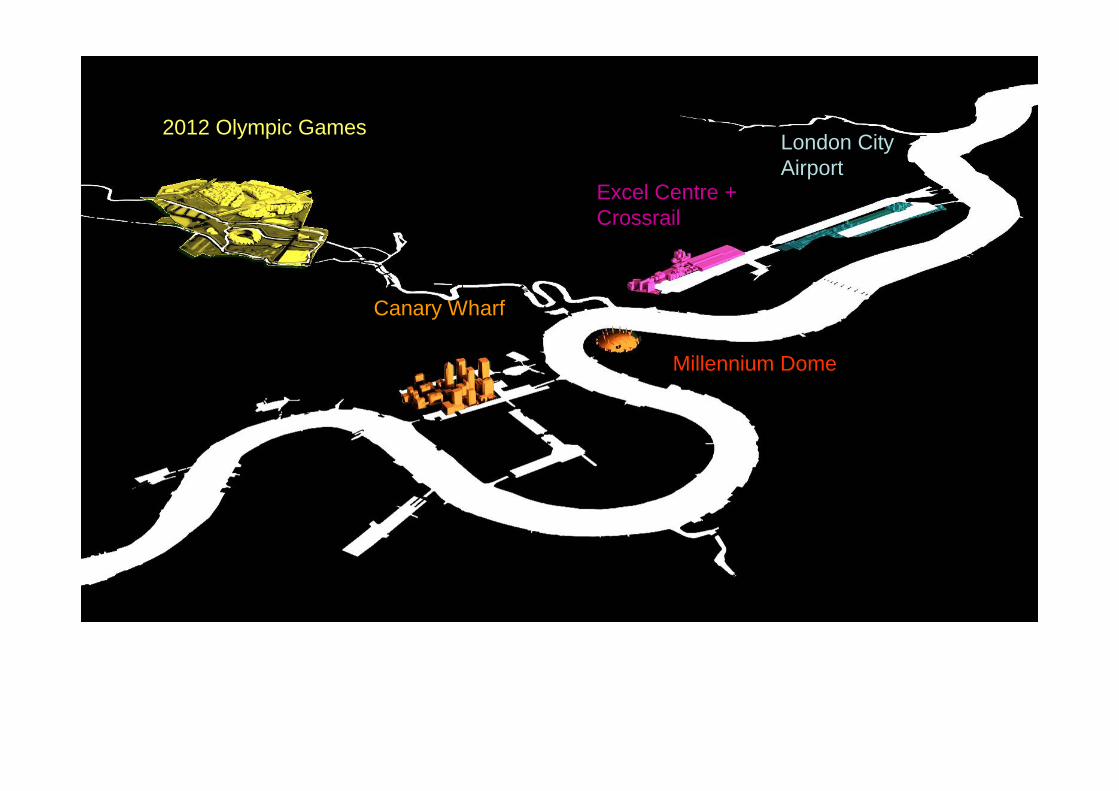
Five brave developments have escalated the momentum for growth
Canary Wharf
2012 Olympic Games
Millennium Dome
Excel Centre + Crossrail
London City Airport
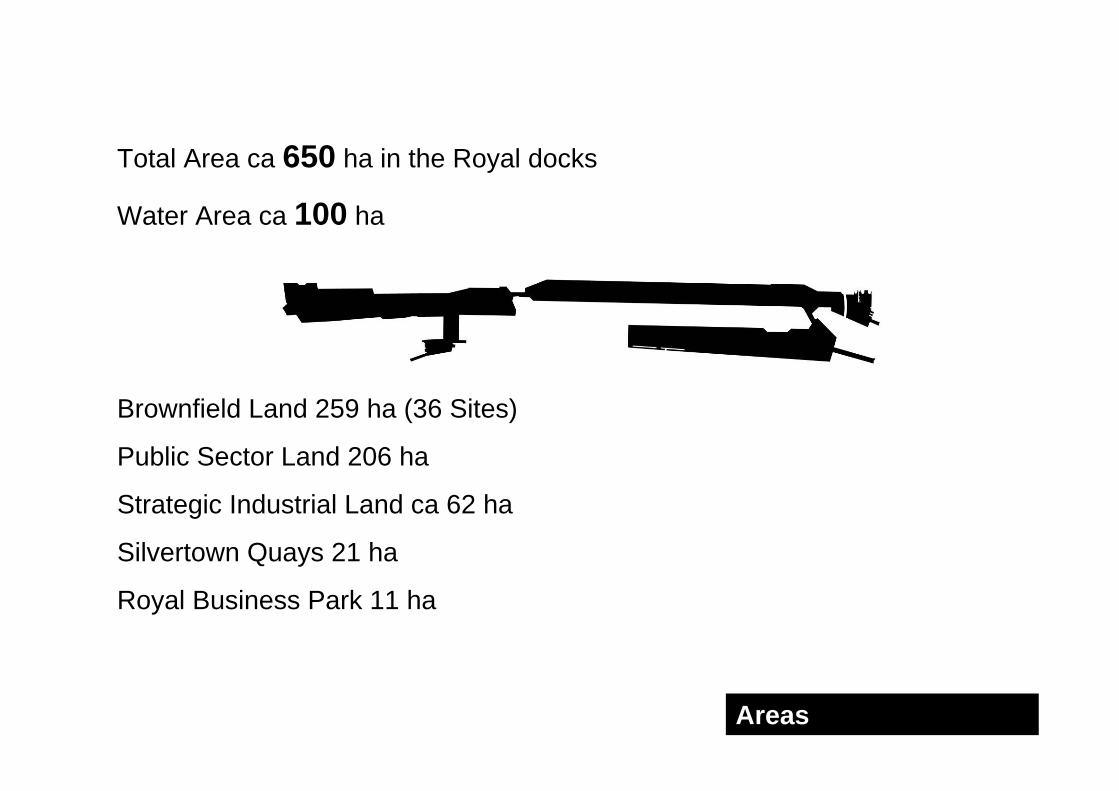
Areas
Total Area ca 650 ha in the Royal docks
Water Area ca 100 ha
Brownfield Land 259 ha (36 Sites)
Public Sector Land 206 ha
Strategic Industrial Land ca 62 ha
Silvertown Quays 21 ha
Royal Business Park 11 ha

LDA Land and Expenditure
+LBN PlanningPowers

Agree a common vision

Talk to all key landowners and development partners and identify priorities
Build an alliance of landowners

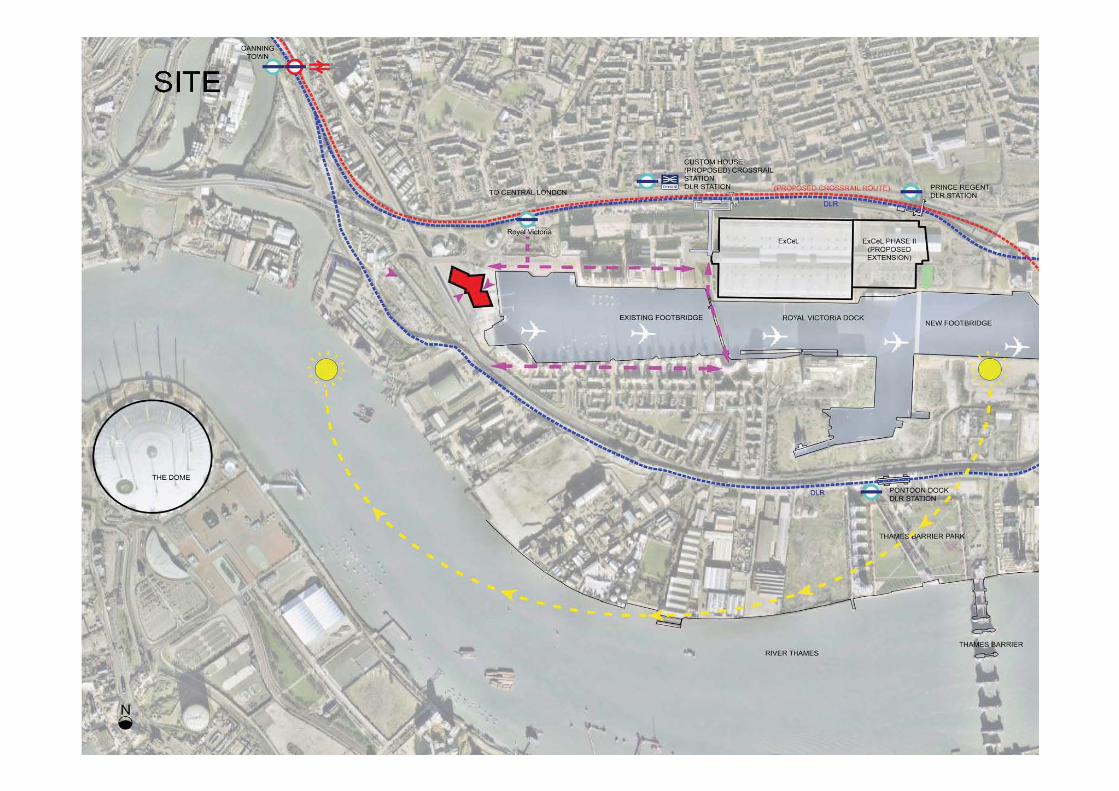
Albert Basin
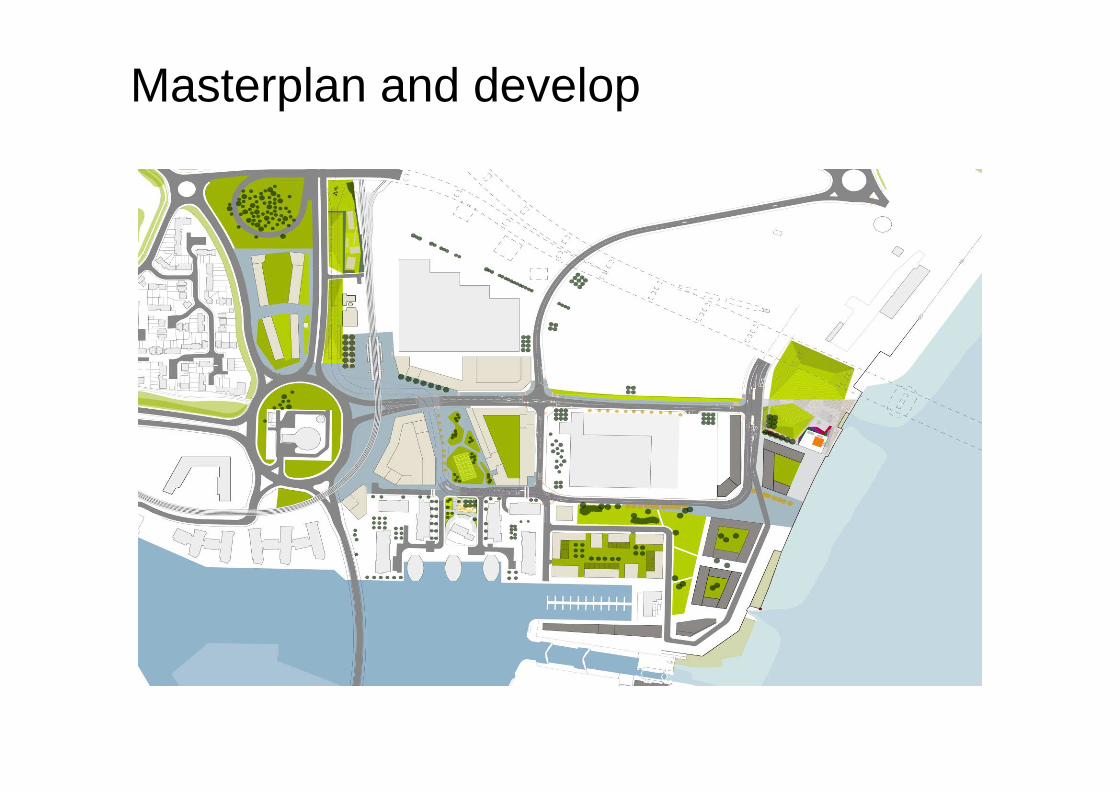
Masterplan and develop


Localism on the ground

Informal community engagement

Mapping the potential


Projects to be taken forward

First results

So,in Conclusion

• Think conceptually• Construct narratives• Build alliances• Hold the ring• Implement incrementally• Be the conscience


A number of councils and partners have looked at opportunities for more efficient capital investment and management of assets across the public estate.
• Last year one of the Total Place Pilots looked at capital investment whilst others looked at local asset management.
• Initial figures showed that £30bn pa of central government funds are spent on buildings and that there is at least £370bn worth of public sector assets around the country, 1/3 of them being nationally owned (1/3 locally owned, 1/3 housing)
• Existing assets and new capital investment are generally treated separately
• Capital investment is top-down, siloed and fragmented
• Assets are similarly treated in silos of ownership making a local area-wide approach difficult
• This work identified scope for increasing productivity through a new commissioningapproach which we propose to develop through real-time learning with eleven pathfinder areas.
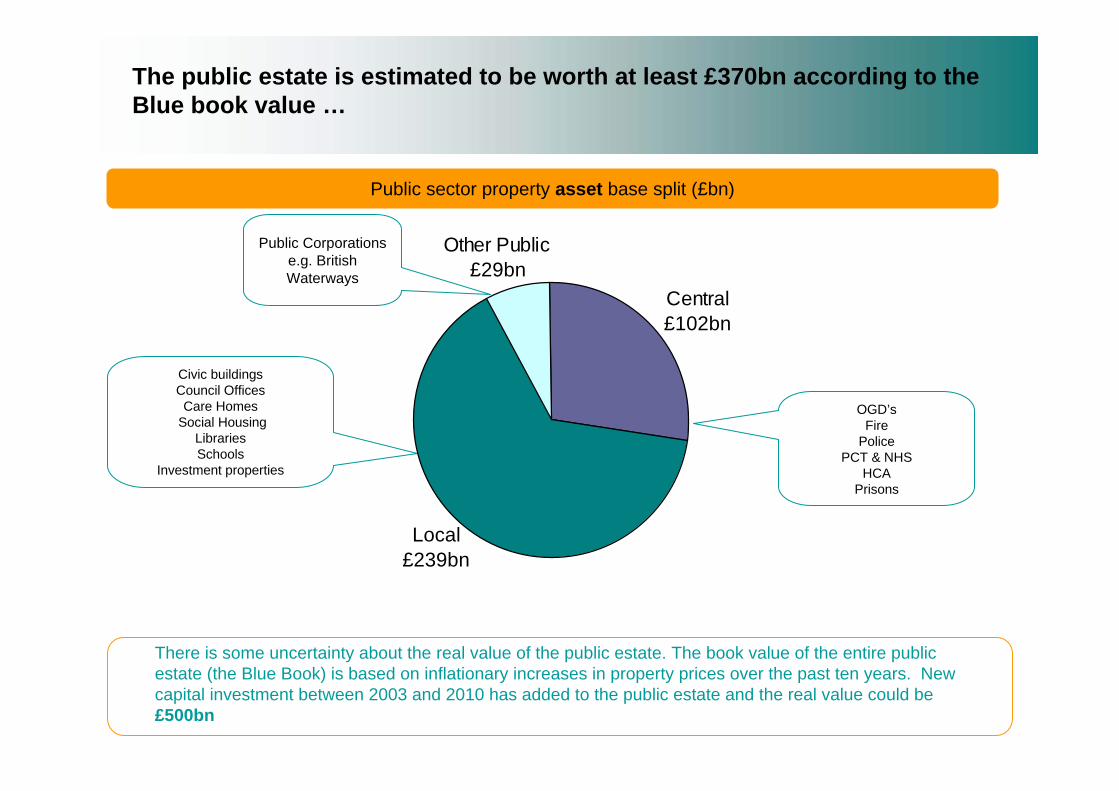
Public sector property asset base split (£bn)
The public estate is estimated to be worth at least £370bn according to the Blue book value …
Civic buildings Council OfficesCare Homes
Social HousingLibrariesSchools
Investment properties
Public Corporations e.g. British Waterways
OGD’sFire
PolicePCT & NHS
HCAPrisons
Local£239bn
Central £102bn
Other Public £29bn
There is some uncertainty about the real value of the public estate. The book value of the entire public estate (the Blue Book) is based on inflationary increases in property prices over the past ten years. New capital investment between 2003 and 2010 has added to the public estate and the real value could be £500bn
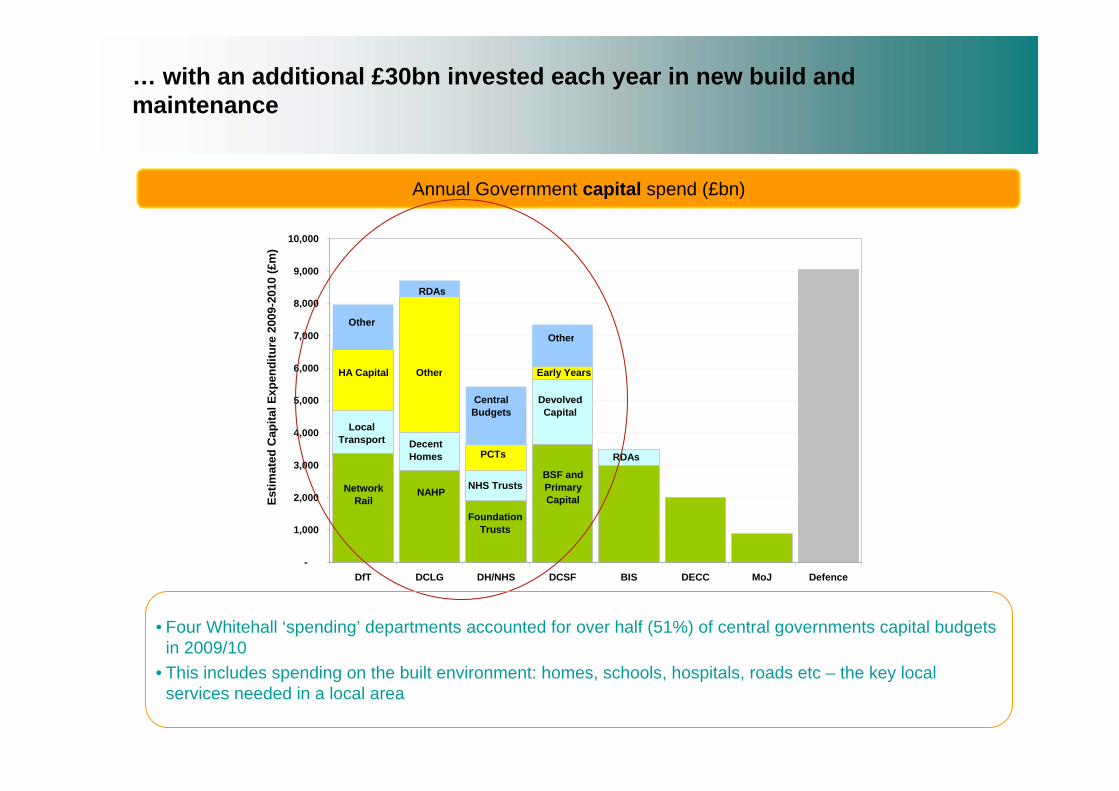
… with an additional £30bn invested each year in new build and maintenance
Annual Government capital spend (£bn)
-
1,000
2,000
3,000
4,000
5,000
6,000
7,000
8,000
9,000
10,000
DfT DCLG DH/NHS DCSF BIS DECC MoJ Defence
Estim
ated
Cap
ital E
xpen
ditu
re 2
009-
2010
(£m
)
NetworkRail
LocalTransport
HA Capital
Other
NAHP
RDAs
DecentHomes
Other
FoundationTrusts
NHS Trusts
PCTs
CentralBudgets
BSF and Primary Capital
Devolved Capital
Other
Early Years
RDAs
• Four Whitehall ‘spending’ departments accounted for over half (51%) of central governments capital budgets in 2009/10
• This includes spending on the built environment: homes, schools, hospitals, roads etc – the key local services needed in a local area

The existing asset stock is owned by local authorities and many different local agencies of central government
There were over 15 number of new buildings constructed in Leeds over the last 5 years. These were constructed for different agencies, planned in isolation and largely on the basis of a national view of what was needed.
Map of publicly funded new buildings in Leeds over the past 5 years

More information and transactional services are
being delivered via avirtual space: eg online
services through websites reducing the need for
office space
More health and adult care services are being delivered in the home or your space: egTelecare reducing usage of the public
estate
There is a separation of service delivery arrangements from asset management and capital investment which inhibits opportunities to make services more productive and responsive to the needs of local people
Public buildings provide the physical space to typically access a single service this
makes it difficult for local people to access the range of
advice they need e.g. someone who has lost
employment may need to visit 4 different buildings
Employment advice and benefits
Occupational therapy
RetrainingHousing benefits
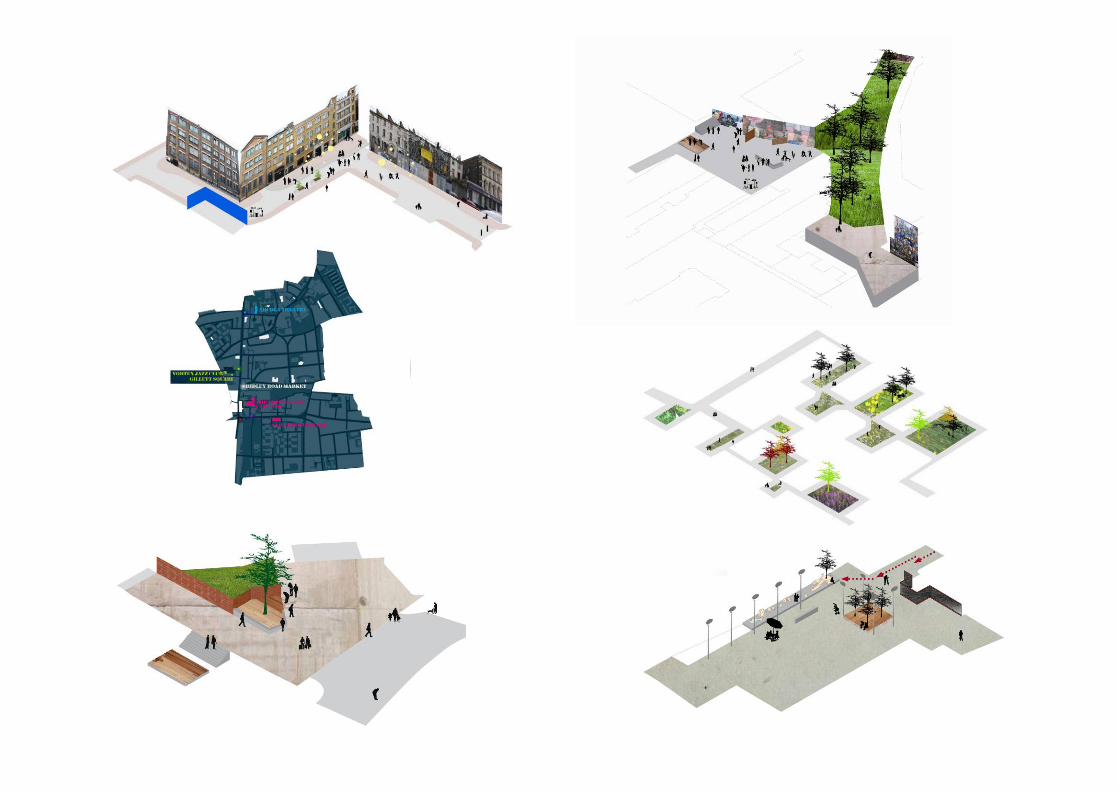
Some areas are rationalising physical
space into one-stop shops which can make it easier for
people to access all the services they need facilitating a multi-agency response and development of multi-agency
teams
Marsh Lane police station in Seftonhouses all services for victims of domestic violence – 5 in one building and 4 services have now merged
Services are largely provided from single-service based locations but joining-up services can reduce demand
on buildings and improve services
Innovations in service delivery such as IT and personalisation can drive down the demand for
building space
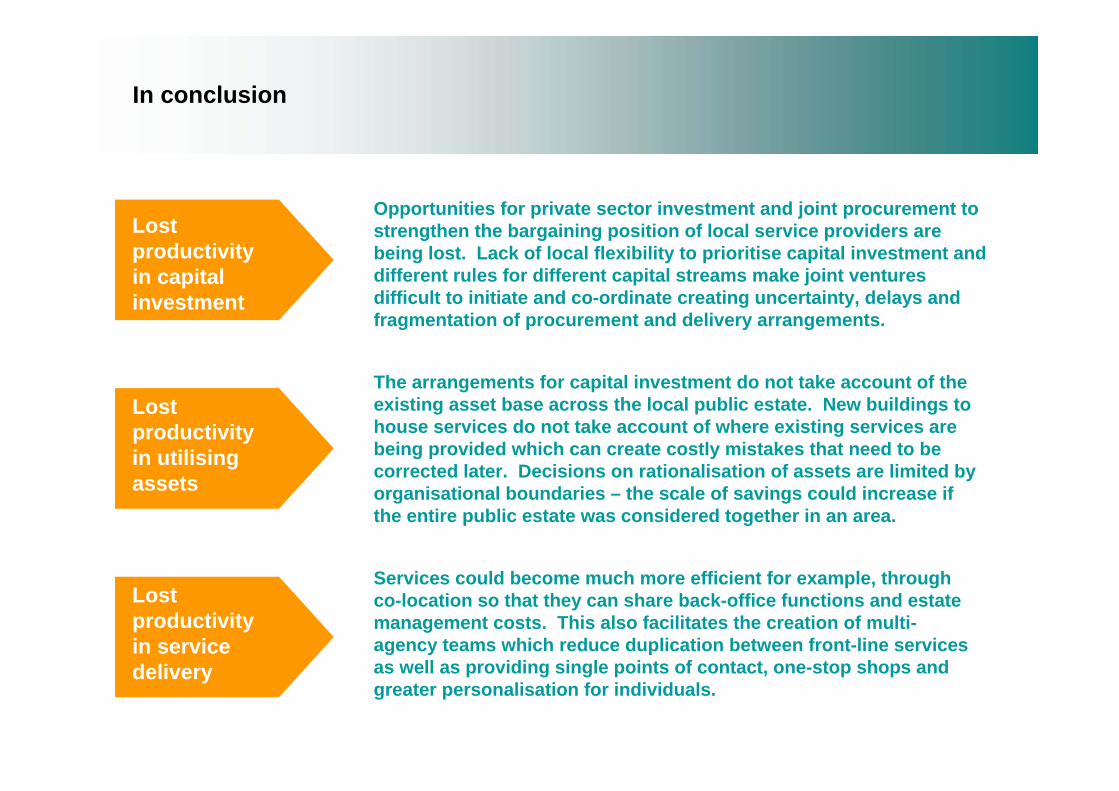
In conclusion
Lost productivity in capital investment
Lost productivity in utilising assets
Lost productivity in service delivery
The arrangements for capital investment do not take account of the existing asset base across the local public estate. New buildings to house services do not take account of where existing services are being provided which can create costly mistakes that need to be corrected later. Decisions on rationalisation of assets are limited by organisational boundaries – the scale of savings could increase if the entire public estate was considered together in an area.
Services could become much more efficient for example, through co-location so that they can share back-office functions and estate management costs. This also facilitates the creation of multi-agency teams which reduce duplication between front-line services as well as providing single points of contact, one-stop shops and greater personalisation for individuals.
Opportunities for private sector investment and joint procurement to strengthen the bargaining position of local service providers are being lost. Lack of local flexibility to prioritise capital investment and different rules for different capital streams make joint ventures difficult to initiate and co-ordinate creating uncertainty, delays and fragmentation of procurement and delivery arrangements.
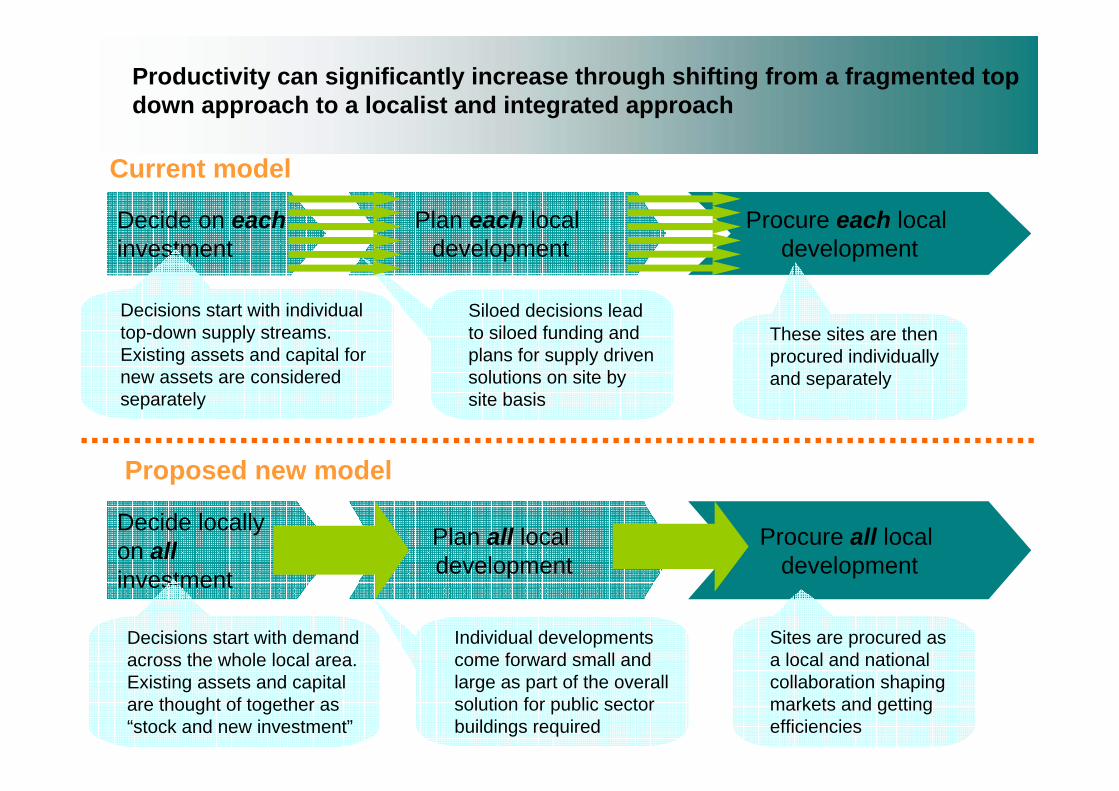
Productivity can significantly increase through shifting from a fragmented top down approach to a localist and integrated approach
Decide on eachinvestment
Current model
Proposed new model
Plan each local development
Procure each local development
Decisions start with individual top-down supply streams.Existing assets and capital for new assets are considered separately
Decide locally on allinvestment
Plan all local development
Procure all local development
Siloed decisions lead to siloed funding and plans for supply driven solutions on site by site basis
These sites are then procured individually and separately
Decisions start with demand across the whole local area.Existing assets and capital are thought of together as “stock and new investment”
Individual developments come forward small and large as part of the overall solution for public sector buildings required
Sites are procured as a local and national collaboration shaping markets and getting efficiencies

Progress with the Pathfinders
1ST draft Business Cases have been received from Swindon, Worcestershire, Hampshire, Cambridgeshire, Wigan and Solihull
- 8 service reconfigurations
- 2 Housing developments
- 3 Town centre regeneration schemes
Business Case Options:
- what can be done now
- what could be done if central government removed barriers to local collaboration
Deadline for final submissions: 8 December

Values Table from Pathfinders’ Business Case
A Baseline
B Option 1 Currently possible project
C Option 2 If barriers removed
A. Total operational footprint (sqm) B. Current/predicted operating costs (define)
C. Operating costs per sqm D. Operating costs per employee E. Capital receipts from disposal (years 1-5) F. Implementation costs (capital) (years 1-5) G. 25 year NPV (costs minus benefits over 25 years discounted at 3.5%)
H. 10 year NPV I. 5 year NPV

Emerging Barriers
Of over two dozen barriers so far identified, few seem insurmountable by local agencies
Many OGD capital receipts accrue to HMT
The uncertain future of PCTs post 2013
LIFT procurement route is mutually exclusive (eg cannot be combined with an education LEP)
Treatment of VAT and SDLT
Is this it?

Final Thoughts
Sovereignty
Partnership is hard and complex
Leadership
Link to clear view of customer demand
Freehold v leasehold argument
Role of DCLG – facilitation v guidance

Property Vehicles – the future?
Rick Lawrence
24 November 2010

73
About us
• Telereal Trillium invests in and manages complex property investment and service opportunities, creating long-term value for all stakeholders
• We are the market leader in property outsourcing and investment• Our clients include private companies, local authorities and
government departments

74
Headline figures
• 8,300 properties with a combined floor area of 8m sq m• £5bn of property assets• Over 300,000 customers occupy our buildings, 1% of the UK workforce• 1,000 people and a further 12,000 service partner staff • £250m spend on facilities management and capital projects per year• Our customer service centre handles 750,000 customer contacts per
year

75
Customers
• We manage and provide services to properties nationwide for private companies, local authorities and central government departments

Public Sector Estate
76
Capital Value£370bn
£370bn
£130bnCentral Government
£240bnLocal Authority
£18bn - Defence
£18bn - Northern Ireland/Scotland/Wales
£19bn - Investment Portfolio
£121bn -SchoolsTown HallsLibrariesSocial Services FacilitiesOther
£100bn - Council Dwellings
£35bn - Health
£5bn - Prisons
£2.5bn - Offices
£2.4bn - Museums
£1.6bn - Courts£1.2bn – Royal Mail
£45.5bn – Other*
£1bn – Foreign Offices & Residential
* Other – Farms/forests/laboratories/British Waterways/research centres/training centres/motorway services/testing centres/residential
Annual Running Costs£25bn
£21.5 bn paMainly health, defence and local authority
£3.5 bn paMandated Estate*
£25 bn pa
*Mandated estate breakdown
Transport £0.13m
Defence £0.15m
DEFRA £0.16m
Health £0.19m
Home Office £0.25m
BIS £0.31m
HMRC £0.49m
MOJ £0.66m
DWP £0.73m
£3.5 bn
Rest £0.43m
77
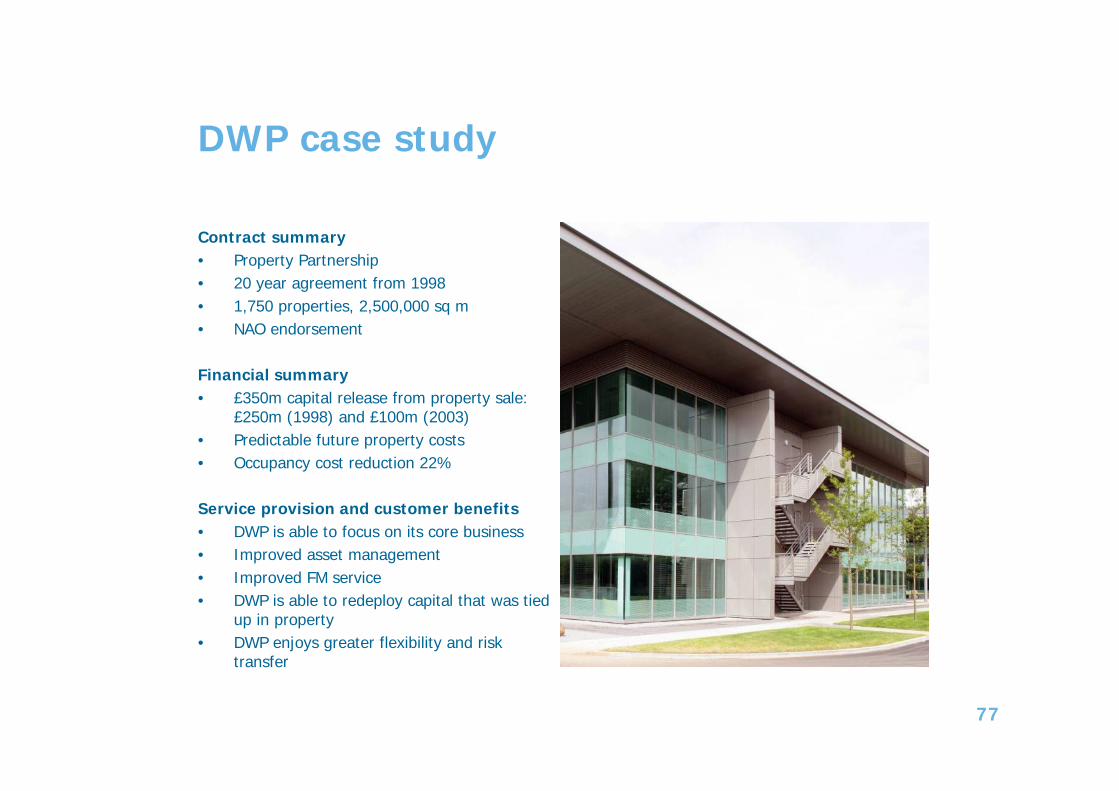
DWP case study
Contract summary• Property Partnership• 20 year agreement from 1998• 1,750 properties, 2,500,000 sq m • NAO endorsement
Financial summary• £350m capital release from property sale:
£250m (1998) and £100m (2003)• Predictable future property costs• Occupancy cost reduction 22%
Service provision and customer benefits• DWP is able to focus on its core business• Improved asset management • Improved FM service • DWP is able to redeploy capital that was tied
up in property • DWP enjoys greater flexibility and risk
transfer

Property outsourcing model
78
Upfront payment
Integrated property services including rationalisation / upgrade of estate
Property transferred(Assets and liabilities)
Unitary charge
Investment in portfolio
Cost savings
Profit sharesPublic sector
Private sector
People and knowledge
Delivery platform
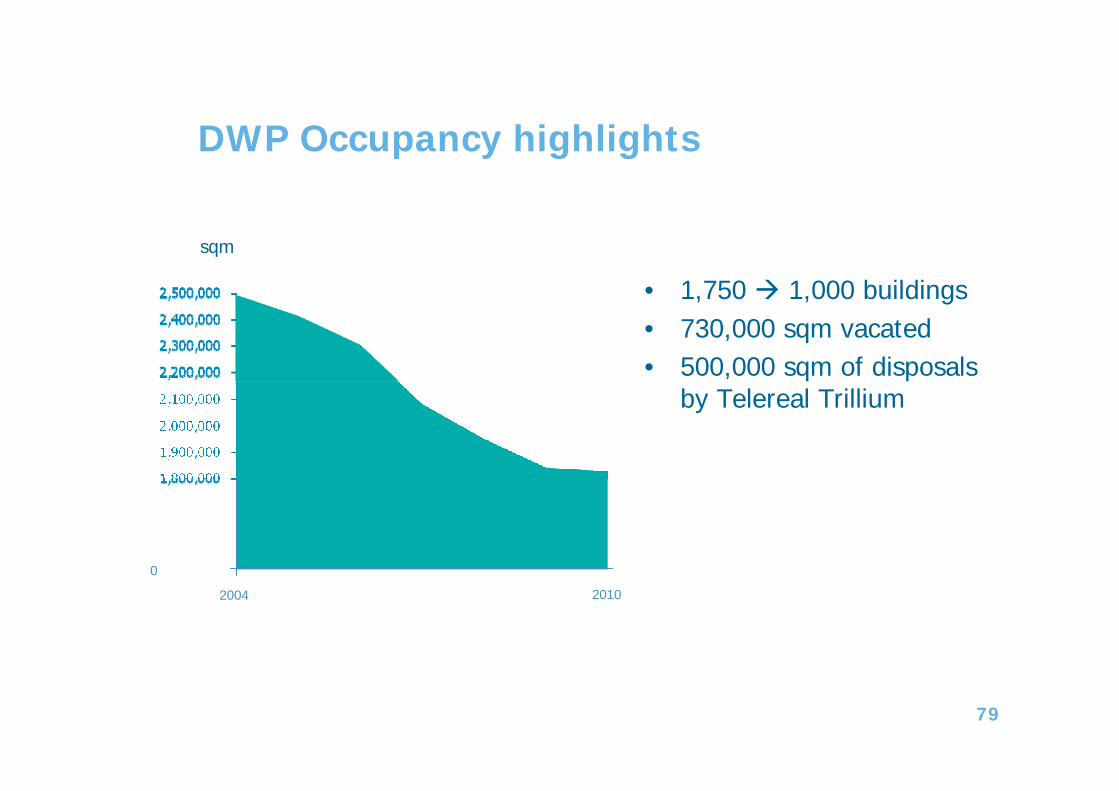
DWP Occupancy highlights
• 1,750 1,000 buildings• 730,000 sqm vacated• 500,000 sqm of disposals
by Telereal Trillium
79
sqm
0
2004 2010
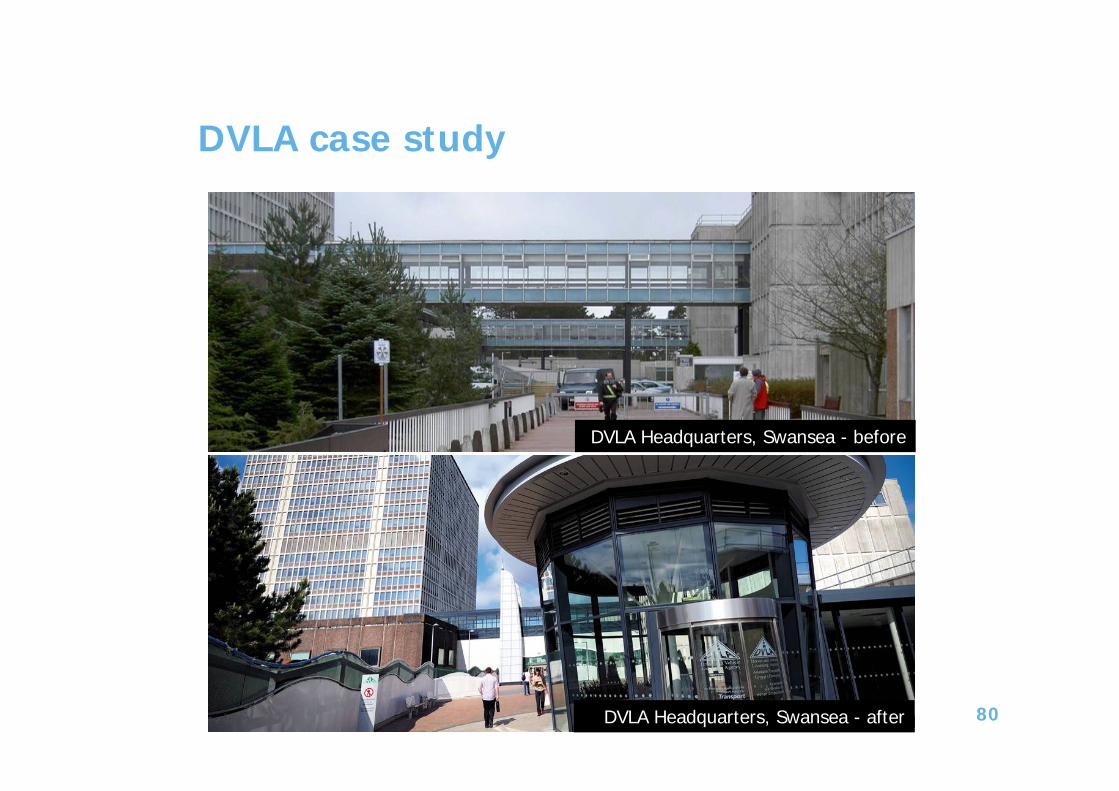
DVLA case study
80
DVLA Headquarters, Swansea - before
DVLA Headquarters, Swansea - after

PPP/PFI model
81
Construction/refurbishment
Service delivery
Unitary charge
Funding
Public sector
Private sector

JV Property Vehicle of the future?
82
Public/Private strategic asset managementPublic sector demand management
Innovation SkillsRapid delivery
Private sector funding in
Savings and capital released
Joint VentureProperty Vehicle
82
Smaller, fit for purpose estate
Public sector property in
• major refurbishments• property reconfigurations• new facilities / extensions
• Core retained assets• Efficient service delivery
• Disposals• Release land for housing/regeneration• Commercial development opportunity• Shared savings
Private sector capability in
Enabling projects
Can also offer this serviceto others public bodies inthe area or adjoining theoriginal area

Closing thoughts
• Property Vehicles – public/public or public/private• Ownership of assets• Procurement• Alternatives• New private sector market• Joined up thinking – DCLG pathfinders/Government Property Unit pilots
83

For information about the Future of London programme please visit our website:
www.futureoflondon.org.uk


