1
Functional Genomics Subject Notes
Introduction
Structural vs functional genomics
Structural genomics studies the physical nature of whole genomes, including the
chromosome number, genome size, number of ORFs, linkage maps, etc
Functional genomics studies the patterns of gene transcription and interaction as they relate
to expression of the proteome
Central dogma of genomics: genome -> transcriptome -> proteome -> phenotype
The functional genomics of an organism depend upon the time of development, the region
and type of tissue examined, and the physiological or pathological state of the organism
Microarrays
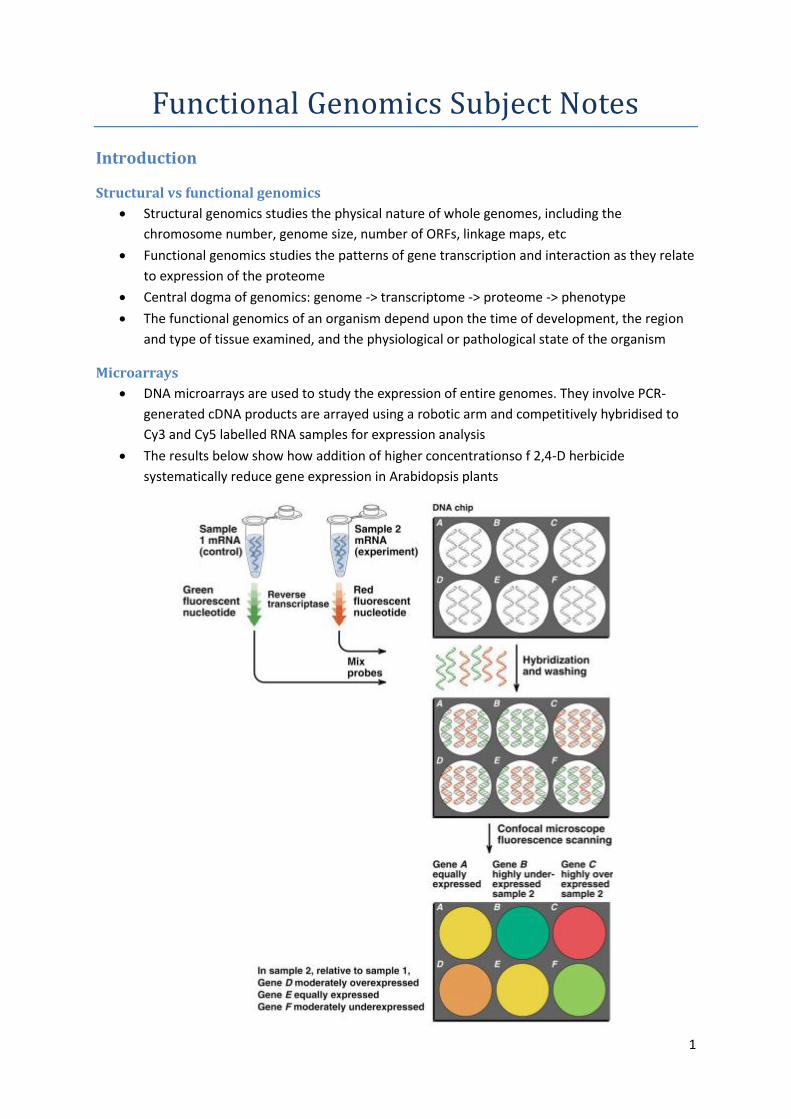
DNA microarrays are used to study the expression of entire genomes. They involve PCR-
generated cDNA products are arrayed using a robotic arm and competitively hybridised to
Cy3 and Cy5 labelled RNA samples for expression analysis
The results below show how addition of higher concentrationso f 2,4-D herbicide
systematically reduce gene expression in Arabidopsis plants
2
Serial analysis of gene expression
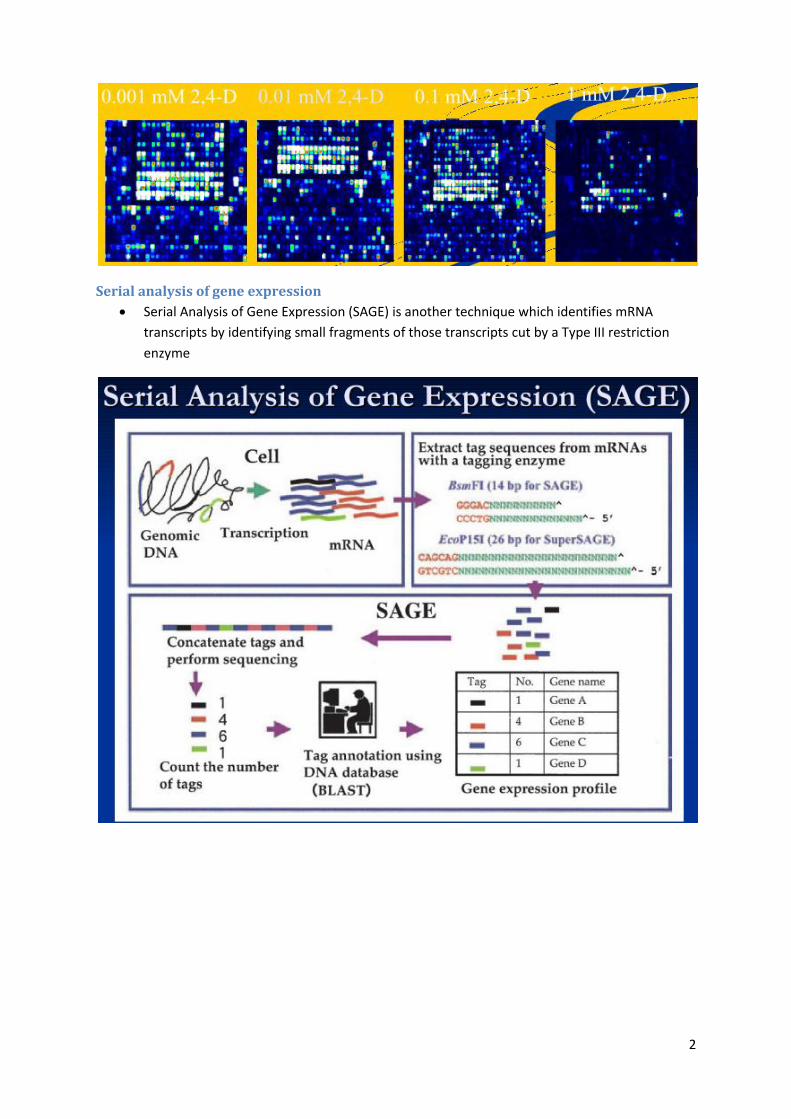
Serial Analysis of Gene Expression (SAGE) is another technique which identifies mRNA
transcripts by identifying small fragments of those transcripts cut by a Type III restriction
enzyme
3
Forward and reverse genetics
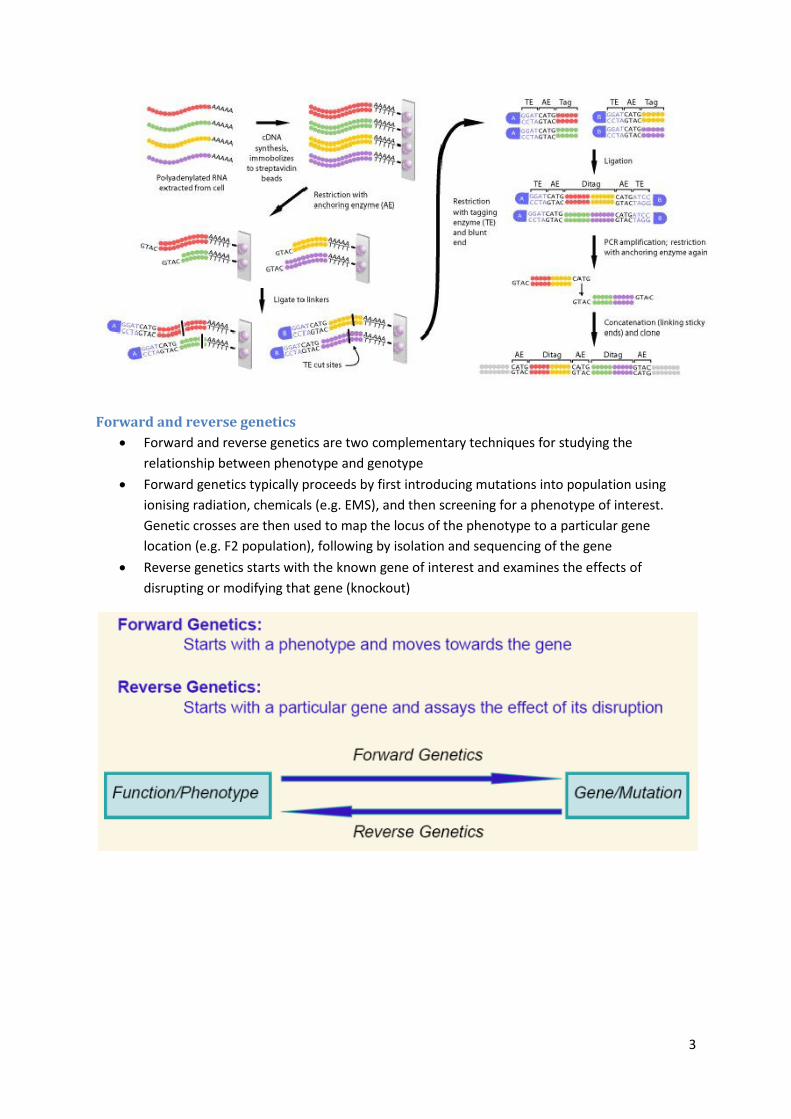
Forward and reverse genetics are two complementary techniques for studying the
relationship between phenotype and genotype
Forward genetics typically proceeds by first introducing mutations into population using
ionising radiation, chemicals (e.g. EMS), and then screening for a phenotype of interest.
Genetic crosses are then used to map the locus of the phenotype to a particular gene
location (e.g. F2 population), following by isolation and sequencing of the gene
Reverse genetics starts with the known gene of interest and examines the effects of
disrupting or modifying that gene (knockout)
4
Targeted Induced Local Lesions IN Genomes (TILLING) is a reverse genetics technique for
knocking out specific genes of interest. The method combines a standard and efficient
technique of mutagenesis using a chemical mutagen such as Ethyl methanesulfonate (EMS)
with a sensitive DNA screening-technique that identifies single base mutations
RNA interference is another method that can be used to silence the expression of particular
genes
Plant Disease Resistance
Overview
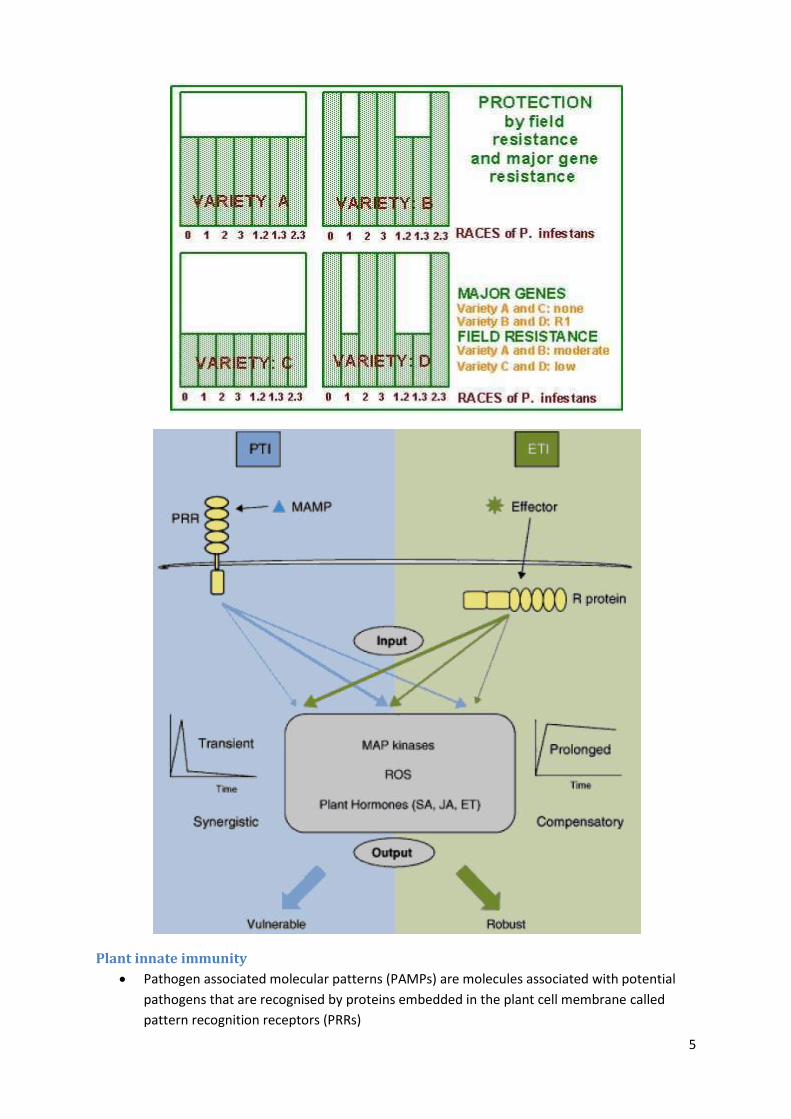
Vertical resistance is race/pathotype specific, while horizontal resistance is effective against
all pathotypes (general resistance)
The gene-for-gene hypothesis holds that “each resistance gene in the host plant is matched
by a corresponding virulence gene in the pathogen”
This can be described as a series of resistance gene ‘locks’ and pathogenicity ‘keys’
5
Plant innate immunity
Pathogen associated molecular patterns (PAMPs) are molecules associated with potential
pathogens that are recognised by proteins embedded in the plant cell membrane called
pattern recognition receptors (PRRs)
6
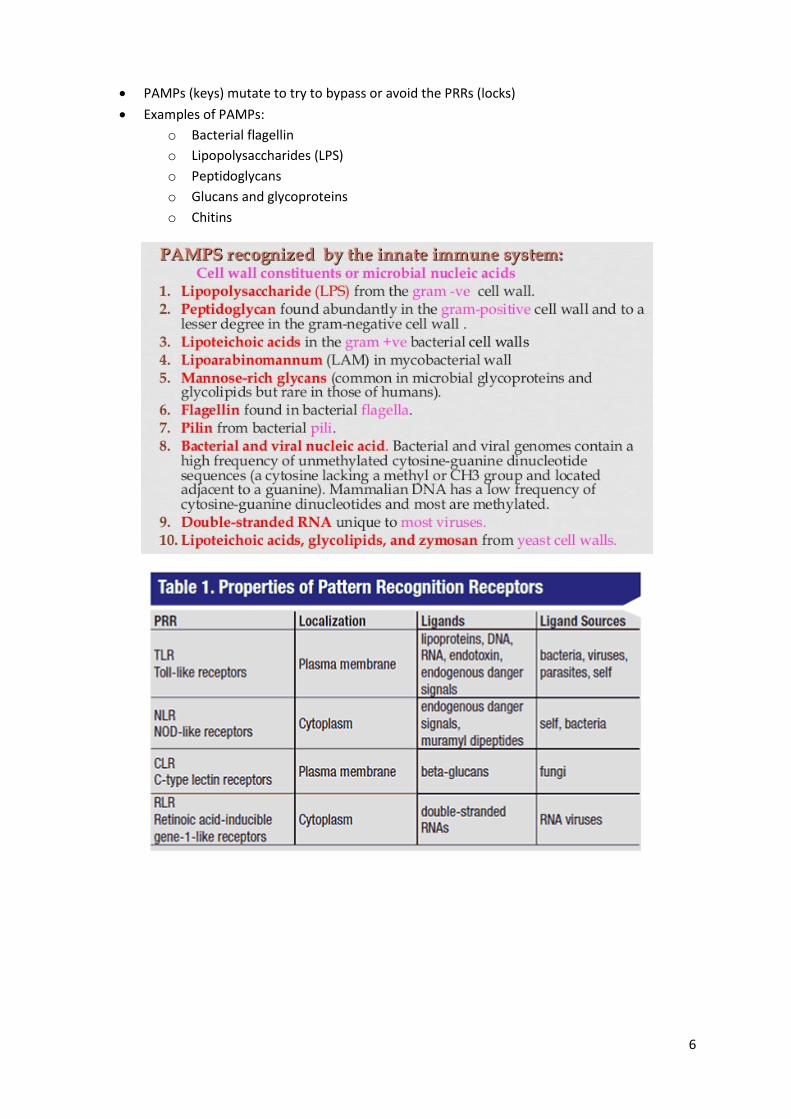
PAMPs (keys) mutate to try to bypass or avoid the PRRs (locks)
Examples of PAMPs:
o Bacterial flagellin
o Lipopolysaccharides (LPS)
o Peptidoglycans
o Glucans and glycoproteins
o Chitins
7
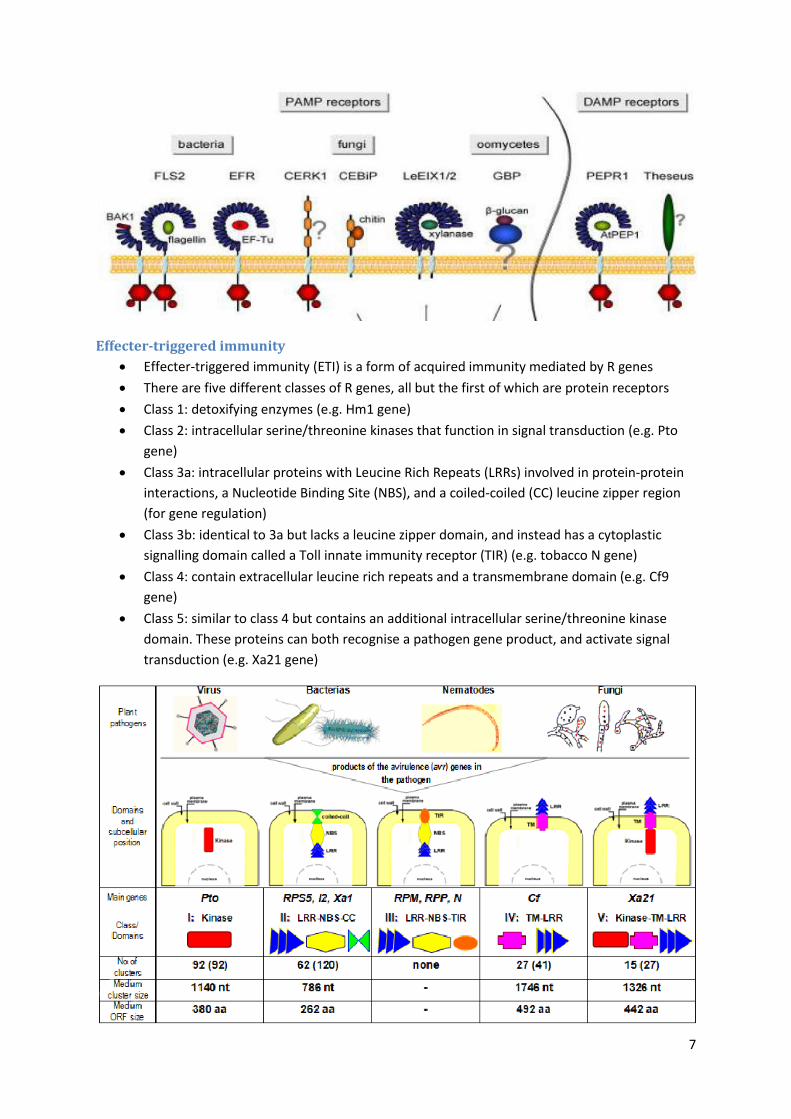
Effecter-triggered immunity
Effecter-triggered immunity (ETI) is a form of acquired immunity mediated by R genes
There are five different classes of R genes, all but the first of which are protein receptors
Class 1: detoxifying enzymes (e.g. Hm1 gene)
Class 2: intracellular serine/threonine kinases that function in signal transduction (e.g. Pto
gene)
Class 3a: intracellular proteins with Leucine Rich Repeats (LRRs) involved in protein-protein
interactions, a Nucleotide Binding Site (NBS), and a coiled-coiled (CC) leucine zipper region
(for gene regulation)
Class 3b: identical to 3a but lacks a leucine zipper domain, and instead has a cytoplastic
signalling domain called a Toll innate immunity receptor (TIR) (e.g. tobacco N gene)
Class 4: contain extracellular leucine rich repeats and a transmembrane domain (e.g. Cf9
gene)
Class 5: similar to class 4 but contains an additional intracellular serine/threonine kinase
domain. These proteins can both recognise a pathogen gene product, and activate signal
transduction (e.g. Xa21 gene)

8
The zig-zag model
In this scheme, the ultimate amplitude of disease resistance or susceptibility is proportional
to [PTI – ETS + ETI]
In phase 1, plants detect microbial/pathogen-associated molecular patterns
(MAMPs/PAMPs, red diamonds) via PRRs to trigger PAMP-triggered immunity (PTI)
In phase 2, successful pathogens deliver effectors that interfere with PTI, or otherwise
enable pathogen nutrition and dispersal, resulting in effector-triggered susceptibility (ETS)
In phase 3, one effector (indicated in red) is recognized by an NB-LRR protein, activating
effector-triggered immunity (ETI), an amplified version of PTI that often passes a threshold
for induction of hypersensitive cell death (HR)
In phase 4, pathogen isolates are selected that have lost the red effector, and perhaps
gained new effectors through horizontal gene flow (in blue)—these can help pathogens to
suppress ETI. Selection favours new plant NB-LRR alleles that can recognize one of the newly
acquired effectors, resulting again in ETI
9
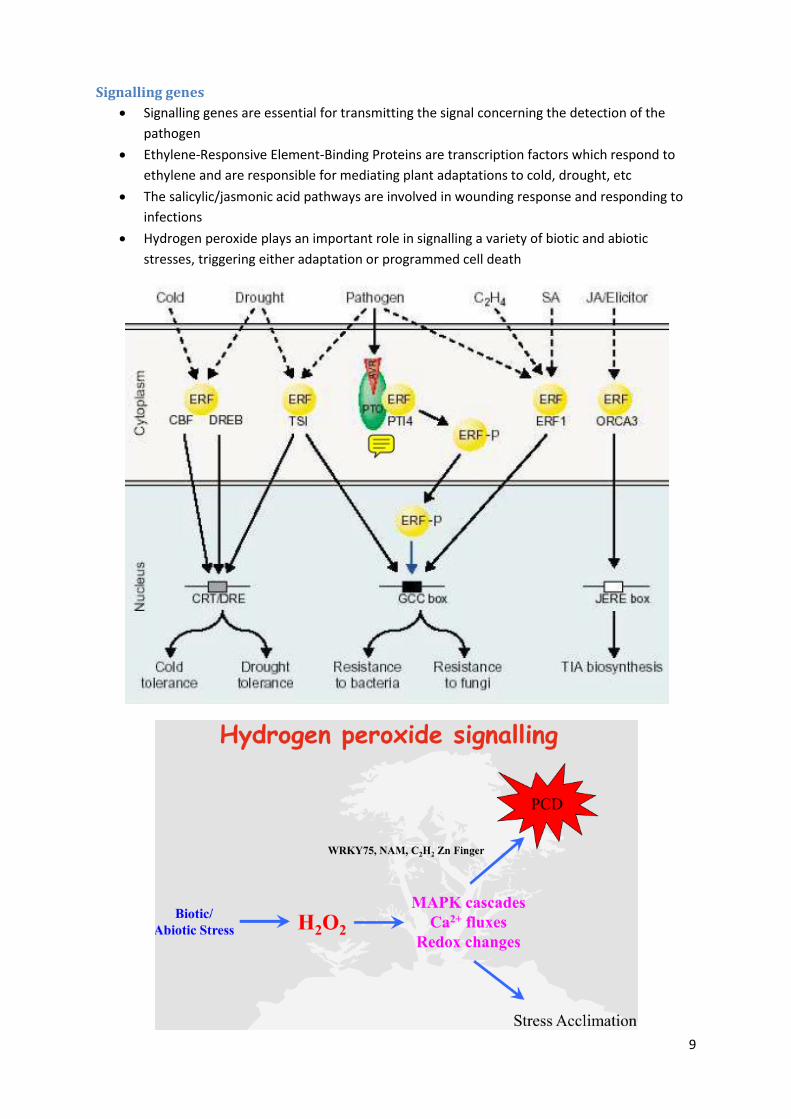
Signalling genes
Signalling genes are essential for transmitting the signal concerning the detection of the
pathogen
Ethylene-Responsive Element-Binding Proteins are transcription factors which respond to
ethylene and are responsible for mediating plant adaptations to cold, drought, etc
The salicylic/jasmonic acid pathways are involved in wounding response and responding to
infections
Hydrogen peroxide plays an important role in signalling a variety of biotic and abiotic
stresses, triggering either adaptation or programmed cell death
10
Defensive responses
Some types of defences attack the pathogen directly, for example by inhibiting spore
germination or degrading the cell walls
o Chitinase to attack cell wall
o Protesase inhibitors
o Phytoalexin production pathway
o Pathogenesis-Related (PR) Proteins (antifungal, antimicrobial)
Other responses attempt to contain the pathogen, for example by lignin deposition
A third type of response focuses on minimising the potential damage to cells by toxins and
enzymes
Chickpea case study
Ascochyta Blight is a fungal pathogen affecting Australian chickpea crops
The “Pulse Chip” is a microarray developed for chickpeas with the aim of looking for genes
associated with disease resistance
Gene expression studies were performed in ascochyta-blight resistant vs susceptible
chickpea varieties
Different genes show differing response patterns over time in susceptible and resistant
varieties
Ecotoxicogenomics
Overview and terminology
Ecotoxicology is the branch of toxicology concerned with the study of toxic effects caused by
natural or synthetic pollutants, to the constituents of ecosystems, animal (including human),
vegetable and microbial
Lowest-observed-adverse-effect level (LOAEL): the lowest concentration of a substance
found by experimentation which causes an adverse alteration of morphology, function,
capacity, growth, development or life span of a target organism distinguished from normal
organisms of the same species under defined conditions of exposure
When the highest level of a substance is used and there is no observable effect, then: NOAEL
No Observed Transcriptional Effect Level (NOTEL): the highest dose of chemical (environ.
pollutant) which results in no significant changes in gene expression

11
Features of ecotoxicology
Often impossible to study multiple species in an ecosystem, so one or several Indicator
Species (Bioindicators) are employed
Common indicator species include:
o Daphnia magna (water fleas)
o Danio rerio (Zebrafish)
o Melanotaenia fluviatilis (Murray River rainbowfish)
Indicator species may vary from ecosystem to ecosystem, and may include plants
Common pollutants
Heavy metal: mercury, cadmium, copper
Pesticides: Chlorpyrifos, Diazinon
Endocrine Disrupters: Oestrogen mimics
Nanomaterials
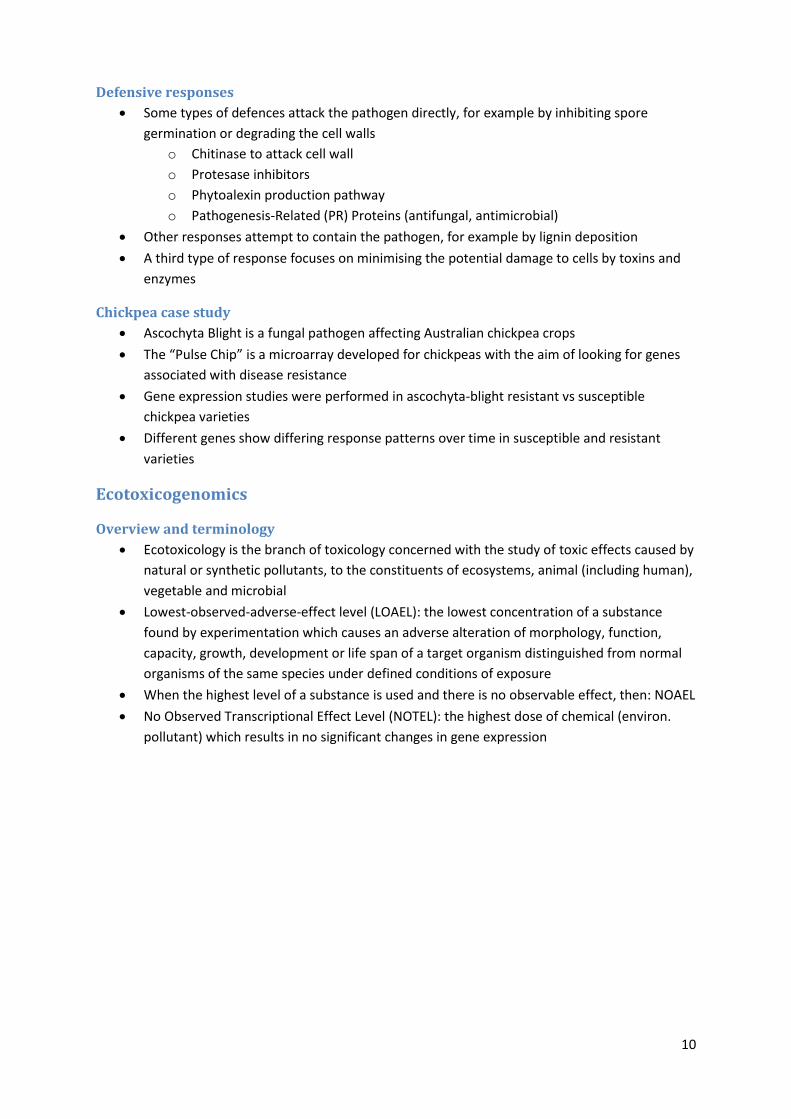
Environmental pollutants may induce gene-expression changes in indicator species
(traditional focus is on morphology)
These genomic changes may be indicative of the phase of the stress response that the
species is undergoing
Each phase of the stress response may be typified by characteristic patterns of gene
expression
12
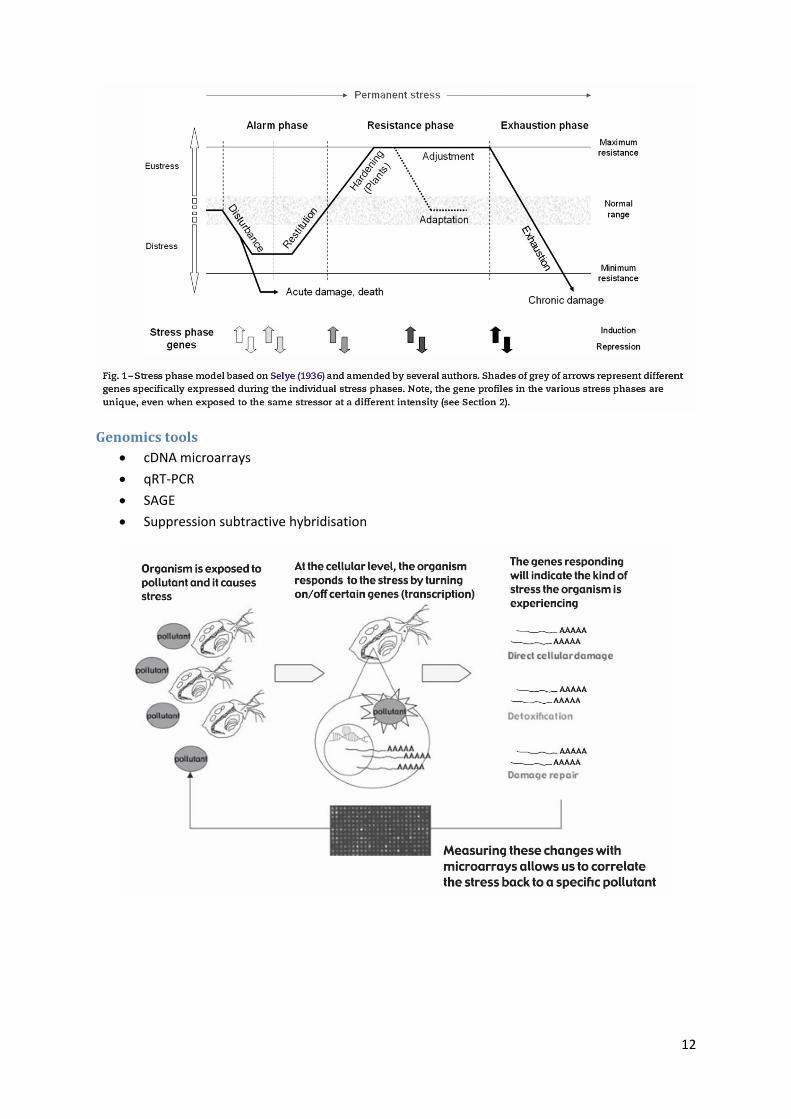
Genomics tools
cDNA microarrays
qRT-PCR
SAGE
Suppression subtractive hybridisation
13
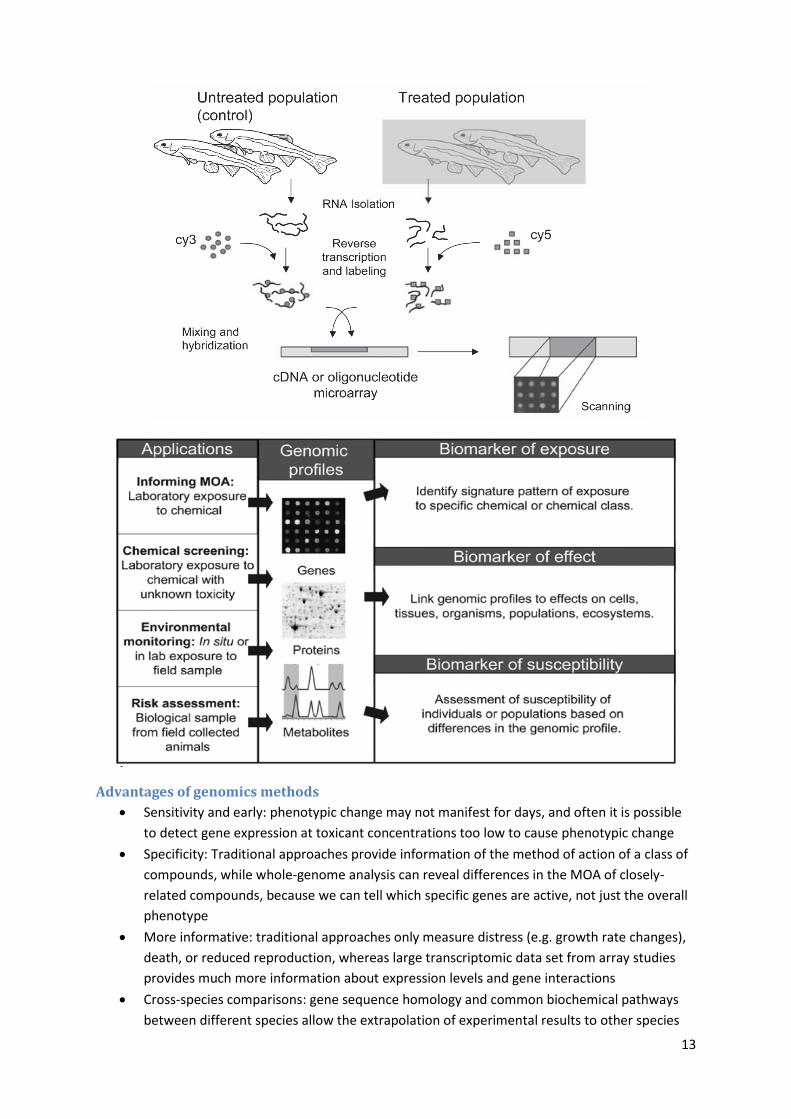
Advantages of genomics methods
Sensitivity and early: phenotypic change may not manifest for days, and often it is possible
to detect gene expression at toxicant concentrations too low to cause phenotypic change
Specificity: Traditional approaches provide information of the method of action of a class of
compounds, while whole-genome analysis can reveal differences in the MOA of closely-
related compounds, because we can tell which specific genes are active, not just the overall
phenotype
More informative: traditional approaches only measure distress (e.g. growth rate changes),
death, or reduced reproduction, whereas large transcriptomic data set from array studies
provides much more information about expression levels and gene interactions
Cross-species comparisons: gene sequence homology and common biochemical pathways
between different species allow the extrapolation of experimental results to other species
14
Pharmacogenomics
Overview
Pharmacogenetics is the study of allelic variation in human populations that affect drug
metabolism
The field has traditionally studied single-gene traits with high penetrance (degree of
connection between genotype and associated phenotype), e.g. genes encoding drug
metabolising enzymes, drug transporters, and disease-modifying genes
It has been defined as the use of genomics to get “the right dose of the right drug to the
right patient at the right time”
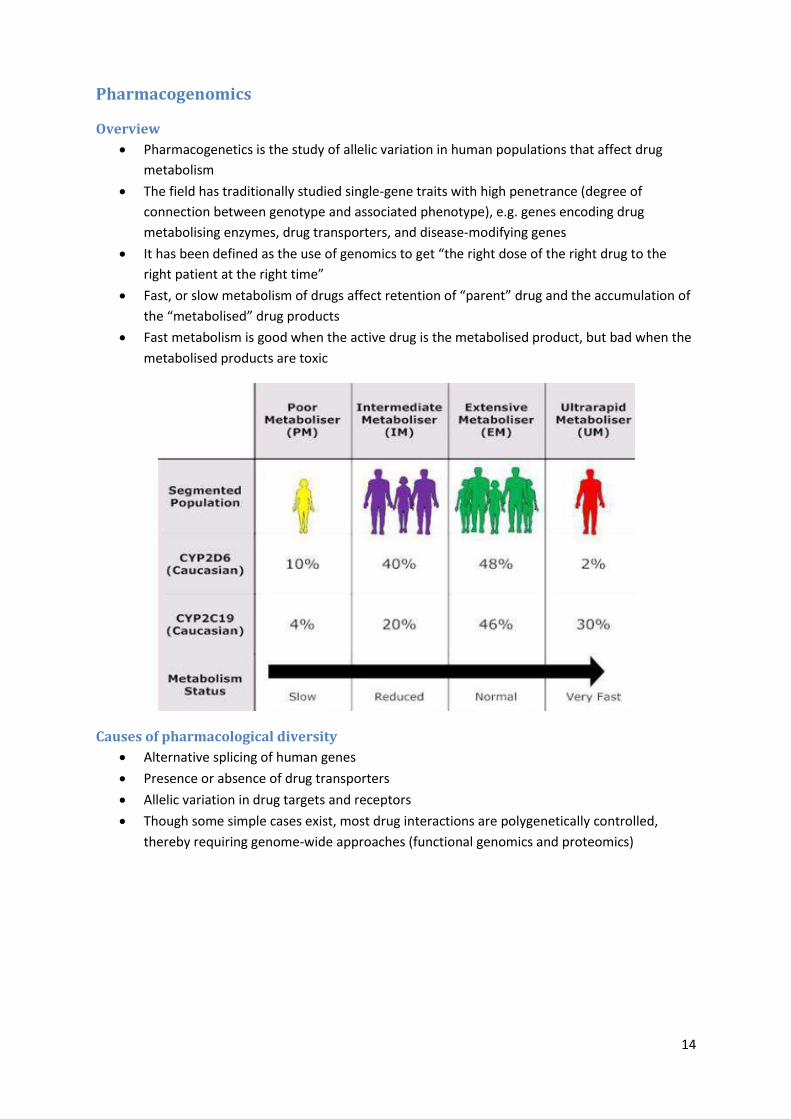
Fast, or slow metabolism of drugs affect retention of “parent” drug and the accumulation of
the “metabolised” drug products
Fast metabolism is good when the active drug is the metabolised product, but bad when the
metabolised products are toxic
Causes of pharmacological diversity
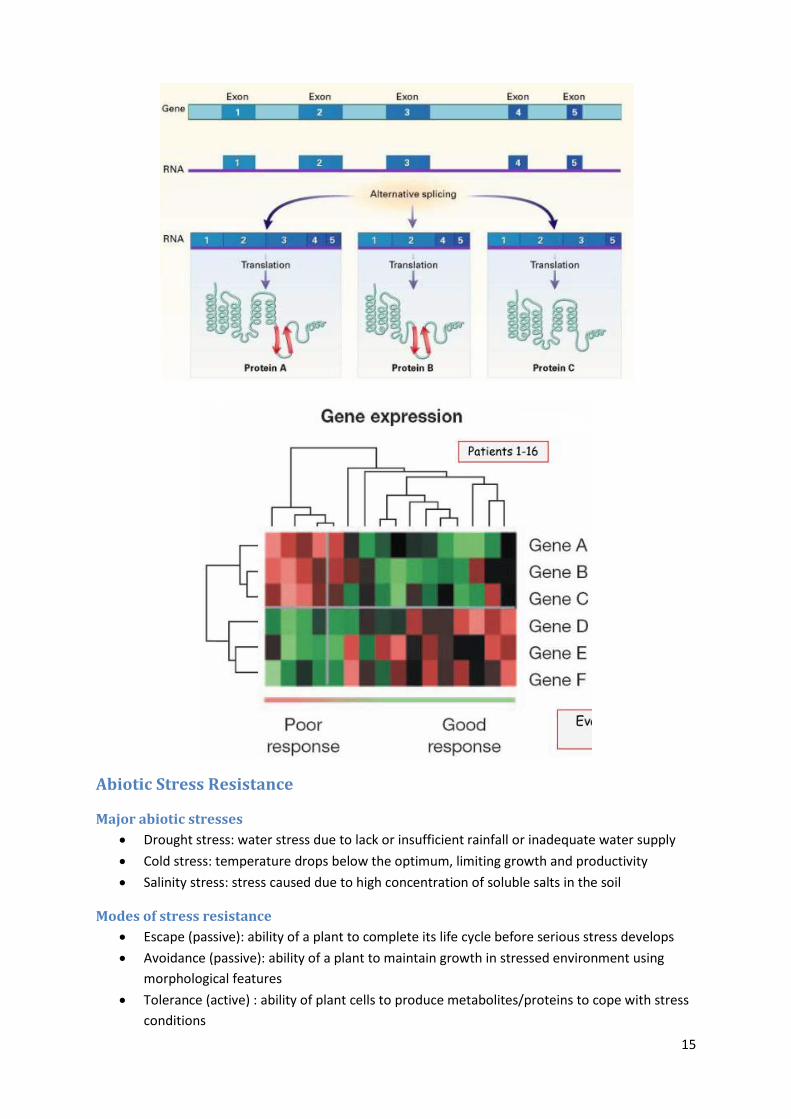
Alternative splicing of human genes
Presence or absence of drug transporters
Allelic variation in drug targets and receptors
Though some simple cases exist, most drug interactions are polygenetically controlled,
thereby requiring genome-wide approaches (functional genomics and proteomics)
15
Abiotic Stress Resistance
Major abiotic stresses
Drought stress: water stress due to lack or insufficient rainfall or inadequate water supply
Cold stress: temperature drops below the optimum, limiting growth and productivity
Salinity stress: stress caused due to high concentration of soluble salts in the soil
Modes of stress resistance
Escape (passive): ability of a plant to complete its life cycle before serious stress develops
Avoidance (passive): ability of a plant to maintain growth in stressed environment using
morphological features
Tolerance (active) : ability of plant cells to produce metabolites/proteins to cope with stress
conditions
16
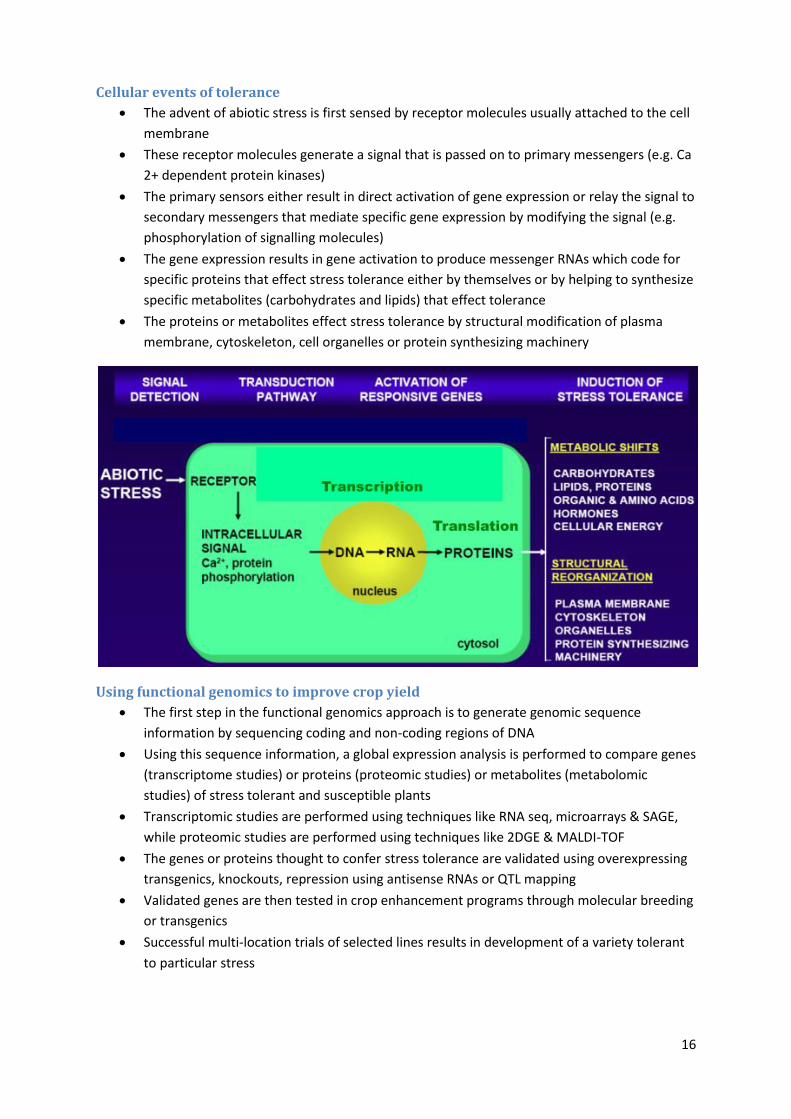
Cellular events of tolerance
The advent of abiotic stress is first sensed by receptor molecules usually attached to the cell
membrane
These receptor molecules generate a signal that is passed on to primary messengers (e.g. Ca
2+ dependent protein kinases)
The primary sensors either result in direct activation of gene expression or relay the signal to
secondary messengers that mediate specific gene expression by modifying the signal (e.g.
phosphorylation of signalling molecules)
The gene expression results in gene activation to produce messenger RNAs which code for
specific proteins that effect stress tolerance either by themselves or by helping to synthesize
specific metabolites (carbohydrates and lipids) that effect tolerance
The proteins or metabolites effect stress tolerance by structural modification of plasma
membrane, cytoskeleton, cell organelles or protein synthesizing machinery
Using functional genomics to improve crop yield
The first step in the functional genomics approach is to generate genomic sequence
information by sequencing coding and non-coding regions of DNA
Using this sequence information, a global expression analysis is performed to compare genes
(transcriptome studies) or proteins (proteomic studies) or metabolites (metabolomic
studies) of stress tolerant and susceptible plants
Transcriptomic studies are performed using techniques like RNA seq, microarrays & SAGE,
while proteomic studies are performed using techniques like 2DGE & MALDI-TOF
The genes or proteins thought to confer stress tolerance are validated using overexpressing
transgenics, knockouts, repression using antisense RNAs or QTL mapping
Validated genes are then tested in crop enhancement programs through molecular breeding
or transgenics
Successful multi-location trials of selected lines results in development of a variety tolerant
to particular stress
17
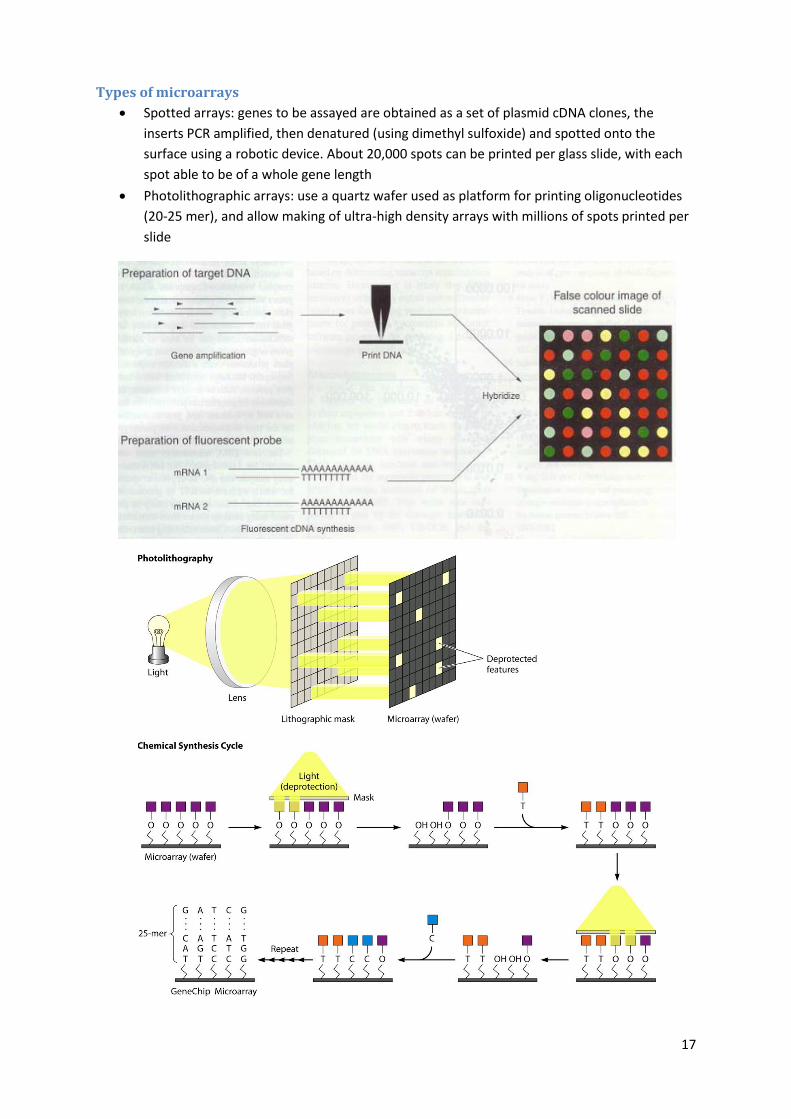
Types of microarrays
Spotted arrays: genes to be assayed are obtained as a set of plasmid cDNA clones, the
inserts PCR amplified, then denatured (using dimethyl sulfoxide) and spotted onto the
surface using a robotic device. About 20,000 spots can be printed per glass slide, with each
spot able to be of a whole gene length
Photolithographic arrays: use a quartz wafer used as platform for printing oligonucleotides
(20-25 mer), and allow making of ultra-high density arrays with millions of spots printed per
slide
18
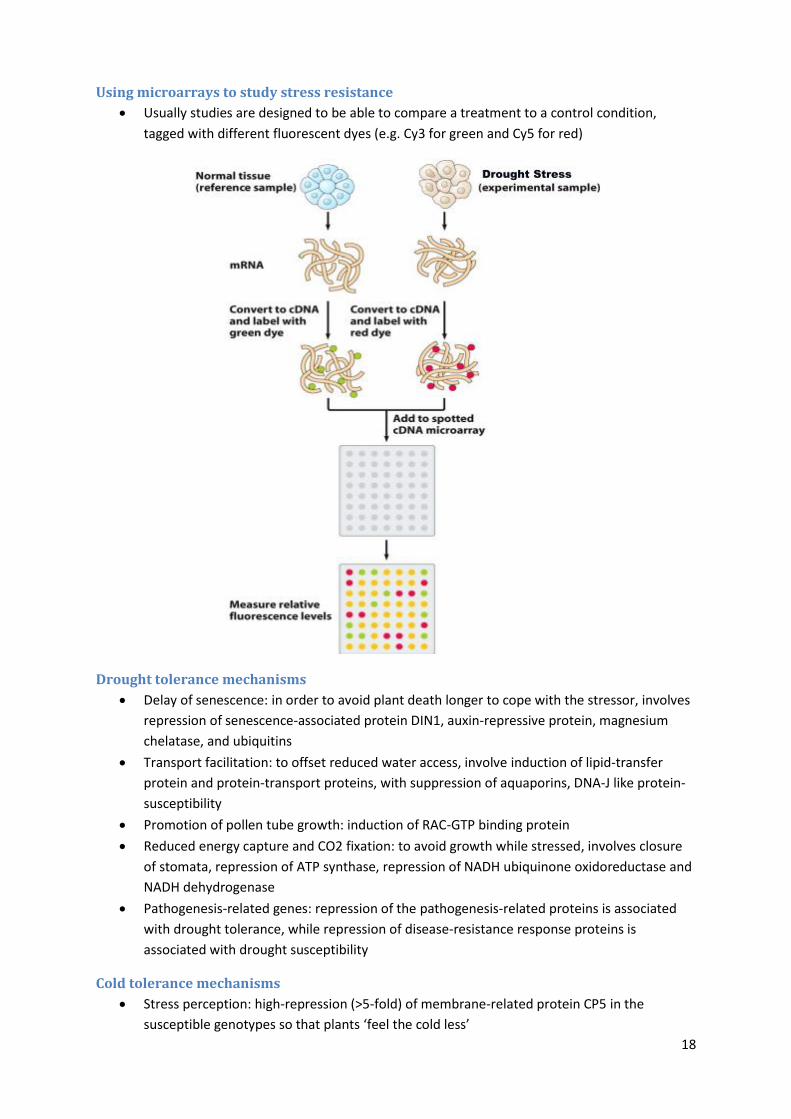
Using microarrays to study stress resistance
Usually studies are designed to be able to compare a treatment to a control condition,
tagged with different fluorescent dyes (e.g. Cy3 for green and Cy5 for red)
Drought tolerance mechanisms
Delay of senescence: in order to avoid plant death longer to cope with the stressor, involves
repression of senescence-associated protein DIN1, auxin-repressive protein, magnesium
chelatase, and ubiquitins
Transport facilitation: to offset reduced water access, involve induction of lipid-transfer
protein and protein-transport proteins, with suppression of aquaporins, DNA-J like protein-
susceptibility
Promotion of pollen tube growth: induction of RAC-GTP binding protein
Reduced energy capture and CO2 fixation: to avoid growth while stressed, involves closure
of stomata, repression of ATP synthase, repression of NADH ubiquinone oxidoreductase and
NADH dehydrogenase
Pathogenesis-related genes: repression of the pathogenesis-related proteins is associated
with drought tolerance, while repression of disease-resistance response proteins is
associated with drought susceptibility
Cold tolerance mechanisms
Stress perception: high-repression (>5-fold) of membrane-related protein CP5 in the
susceptible genotypes so that plants ‘feel the cold less’
19
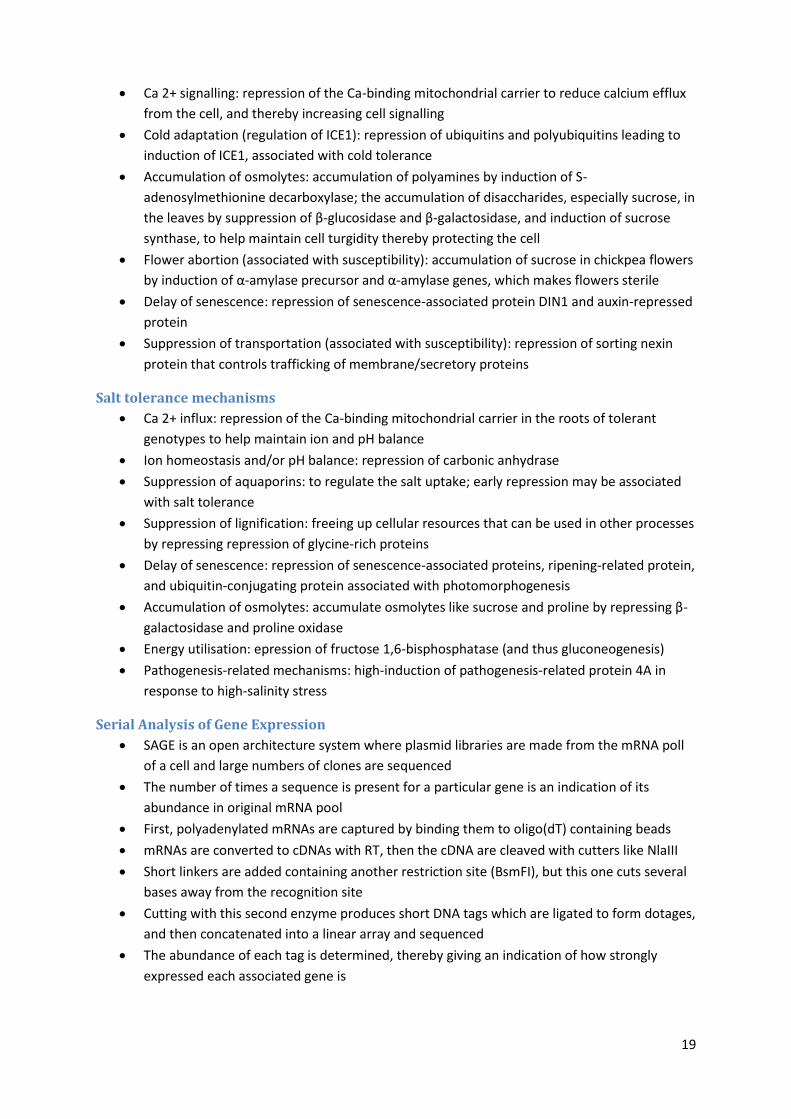
Ca 2+ signalling: repression of the Ca-binding mitochondrial carrier to reduce calcium efflux
from the cell, and thereby increasing cell signalling
Cold adaptation (regulation of ICE1): repression of ubiquitins and polyubiquitins leading to
induction of ICE1, associated with cold tolerance
Accumulation of osmolytes: accumulation of polyamines by induction of S-
adenosylmethionine decarboxylase; the accumulation of disaccharides, especially sucrose, in
the leaves by suppression of β-glucosidase and β-galactosidase, and induction of sucrose
synthase, to help maintain cell turgidity thereby protecting the cell
Flower abortion (associated with susceptibility): accumulation of sucrose in chickpea flowers
by induction of α-amylase precursor and α-amylase genes, which makes flowers sterile
Delay of senescence: repression of senescence-associated protein DIN1 and auxin-repressed
protein
Suppression of transportation (associated with susceptibility): repression of sorting nexin
protein that controls trafficking of membrane/secretory proteins
Salt tolerance mechanisms
Ca 2+ influx: repression of the Ca-binding mitochondrial carrier in the roots of tolerant
genotypes to help maintain ion and pH balance
Ion homeostasis and/or pH balance: repression of carbonic anhydrase
Suppression of aquaporins: to regulate the salt uptake; early repression may be associated
with salt tolerance
Suppression of lignification: freeing up cellular resources that can be used in other processes
by repressing repression of glycine-rich proteins
Delay of senescence: repression of senescence-associated proteins, ripening-related protein,
and ubiquitin-conjugating protein associated with photomorphogenesis
Accumulation of osmolytes: accumulate osmolytes like sucrose and proline by repressing β-
galactosidase and proline oxidase
Energy utilisation: epression of fructose 1,6-bisphosphatase (and thus gluconeogenesis)
Pathogenesis-related mechanisms: high-induction of pathogenesis-related protein 4A in
response to high-salinity stress
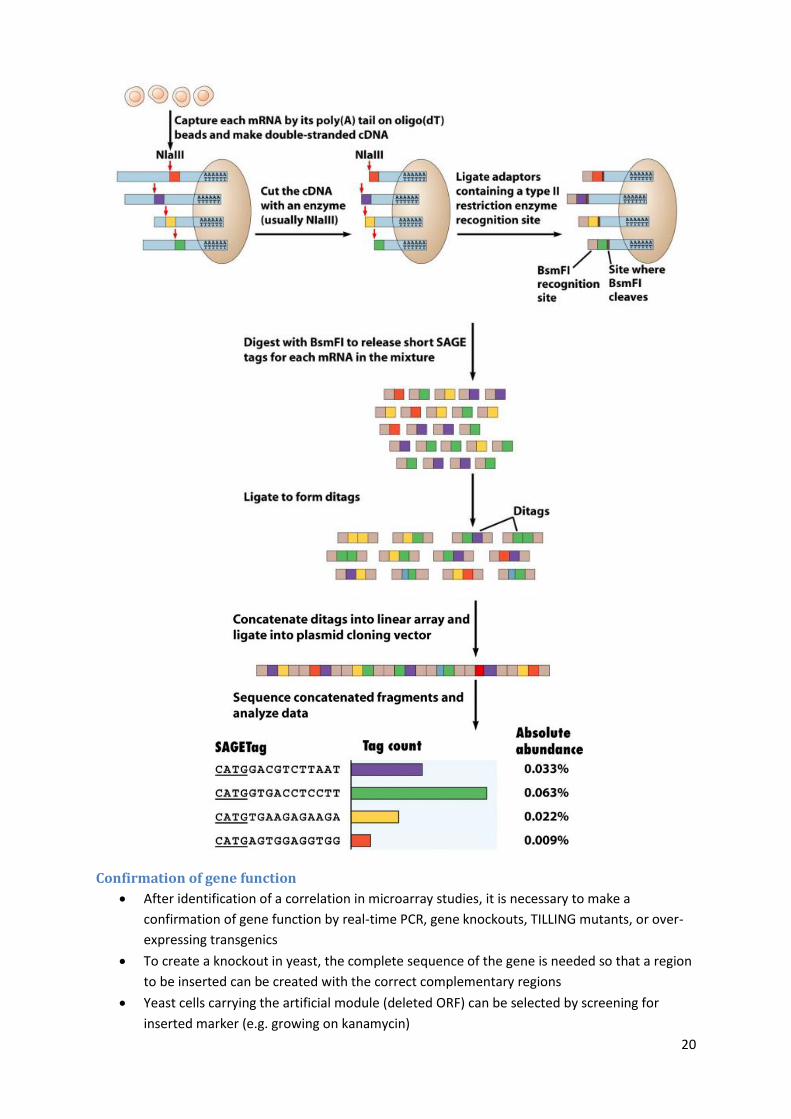
Serial Analysis of Gene Expression
SAGE is an open architecture system where plasmid libraries are made from the mRNA poll
of a cell and large numbers of clones are sequenced
The number of times a sequence is present for a particular gene is an indication of its
abundance in original mRNA pool
First, polyadenylated mRNAs are captured by binding them to oligo(dT) containing beads
mRNAs are converted to cDNAs with RT, then the cDNA are cleaved with cutters like NlaIII
Short linkers are added containing another restriction site (BsmFI), but this one cuts several
bases away from the recognition site
Cutting with this second enzyme produces short DNA tags which are ligated to form dotages,
and then concatenated into a linear array and sequenced
The abundance of each tag is determined, thereby giving an indication of how strongly
expressed each associated gene is
20
Confirmation of gene function
After identification of a correlation in microarray studies, it is necessary to make a
confirmation of gene function by real-time PCR, gene knockouts, TILLING mutants, or over-
expressing transgenics
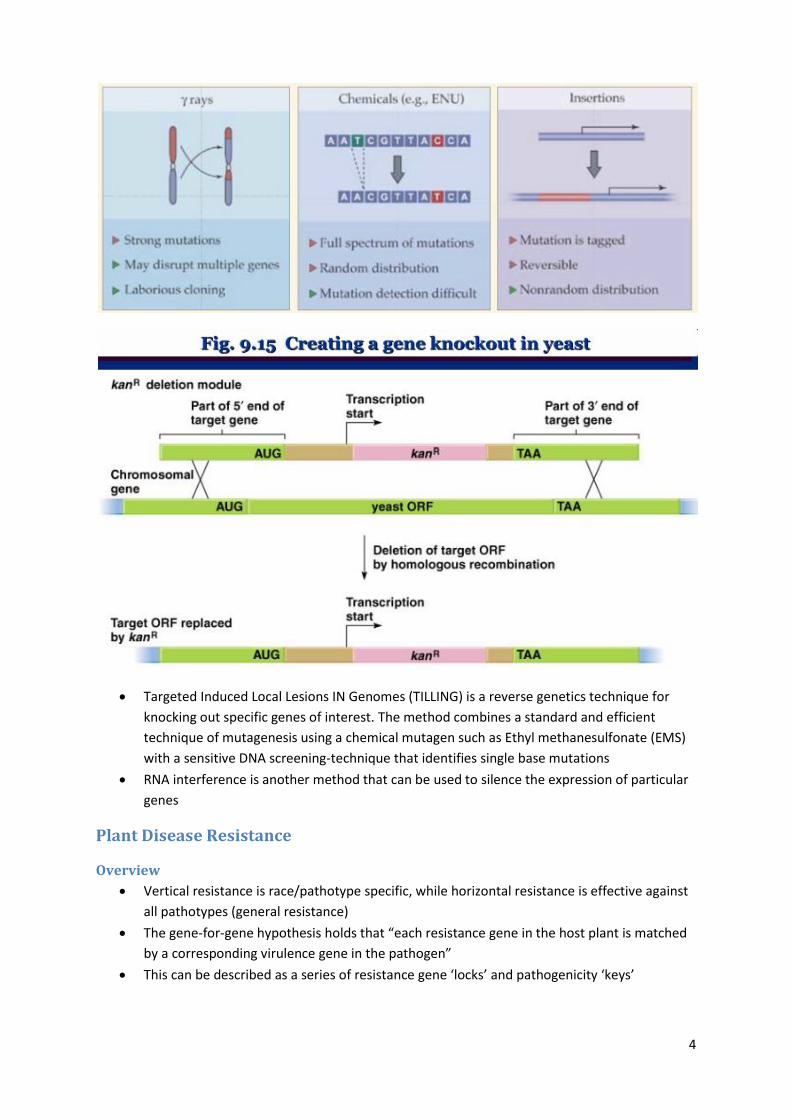
To create a knockout in yeast, the complete sequence of the gene is needed so that a region
to be inserted can be created with the correct complementary regions
Yeast cells carrying the artificial module (deleted ORF) can be selected by screening for
inserted marker (e.g. growing on kanamycin)

21
Creating transgenic plants
‘Gene-of-interest’ (GOI) is ligated into bacterial T-DNA (tumor-inducing DNA) under the
control of a specific promoter
The promoter used can be constitutive (expressed normally) or stress-induced (activates
under stress)
T-DNA vector containing the gene of interest is transformed into plant cells via
Agrobacterium tumefaciens
Transformed plant cells are grown to full plants (transgenics) using micro-propagation
techniques, and then screened for gene expression and stress tolerance
Transgenic chickpea example
They transformed chickpea with two different genes
First transgenic was transformed with a functional gene P5CSF129A, under control of a
constitutive promoter. This gene codes for proline, an osmolyte that protects plants under
drought stress
Second transgenic was transformed with a regulatory gene DREB1A,under control of a
stress-inducible promoter from the rd29A gene. This gene is a transcription factor known to
activate downstream drought tolerance genes
Physiological parameters were studied in transgenic generations (T2 to T4)
The transgenics with both the constructs showed a decline in the transpiration rate in drier
soils, thus increasing water use efficiency under stress
Overexpression of P5CSF129A gene produced more proline that helped these plants
maintain cell turgor and physiological processes under drought stress. This resulted in
postponement of dehydration as water deficit developed under drought stress.
Hence it was concluded that although both constructs conferred drought tolerance, the use
of transcription factors driven by stress-responsive promoters is a more promising approach
to develop drought tolerant transgenics
22
Sequencing Methods
Overview
DNA sequencing is the process of determining the precise order of nucleotides within a DNA
molecule
A genome includes the entire complement of genetic information, including genes,
regulatory sequences, and noncoding DNA
Sanger sequenced the first genome, which was the Phi X 174 (a bacteriophage)
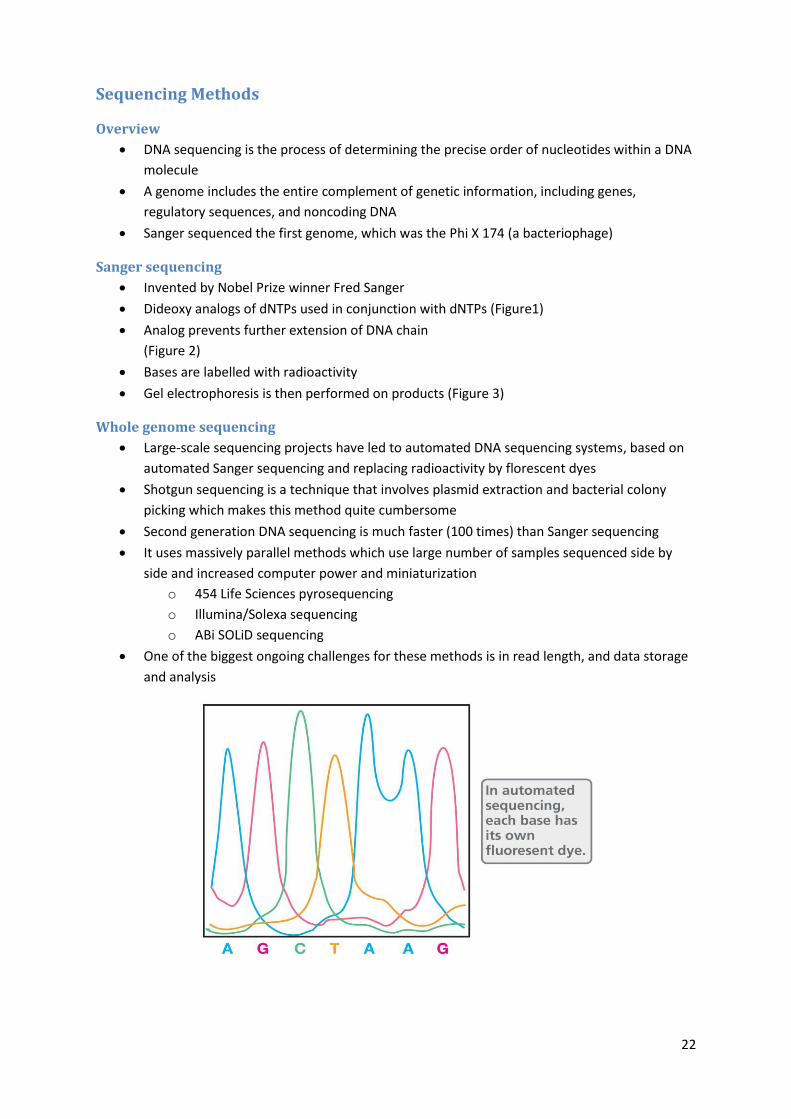
Sanger sequencing
Invented by Nobel Prize winner Fred Sanger
Dideoxy analogs of dNTPs used in conjunction with dNTPs (Figure1)
Analog prevents further extension of DNA chain
(Figure 2)
Bases are labelled with radioactivity
Gel electrophoresis is then performed on products (Figure 3)
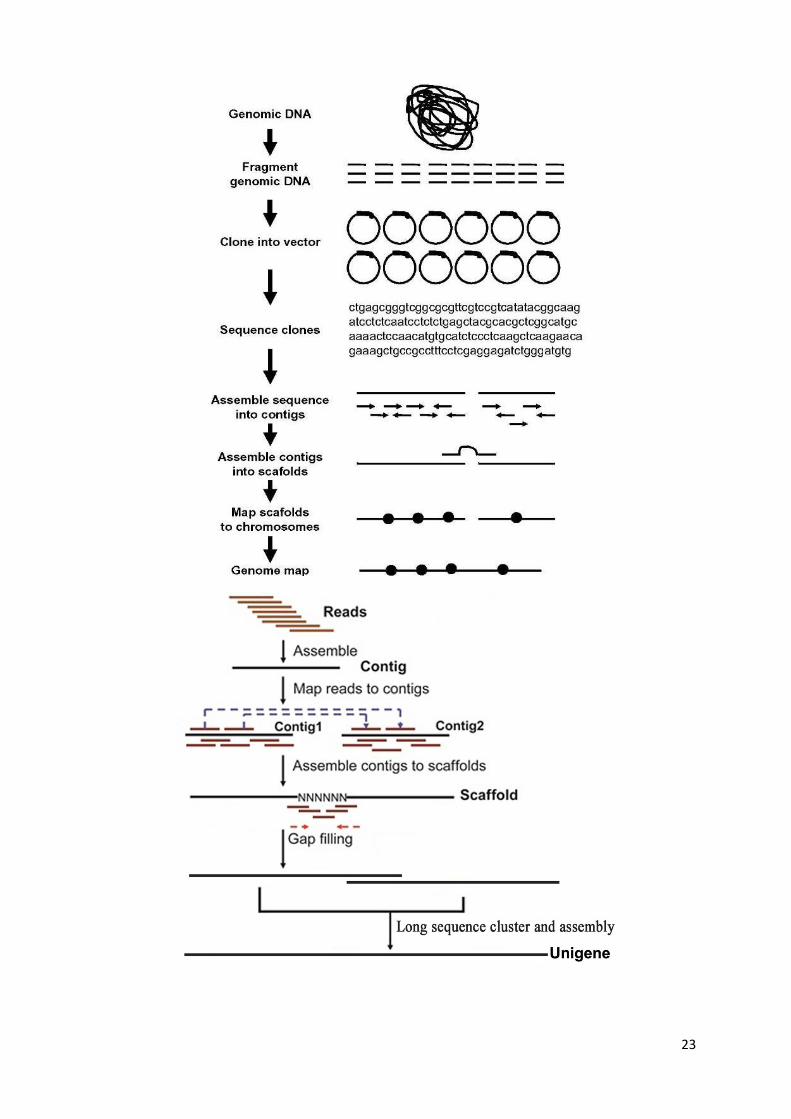
Whole genome sequencing
Large-scale sequencing projects have led to automated DNA sequencing systems, based on
automated Sanger sequencing and replacing radioactivity by florescent dyes
Shotgun sequencing is a technique that involves plasmid extraction and bacterial colony
picking which makes this method quite cumbersome
Second generation DNA sequencing is much faster (100 times) than Sanger sequencing
It uses massively parallel methods which use large number of samples sequenced side by
side and increased computer power and miniaturization
o 454 Life Sciences pyrosequencing
o Illumina/Solexa sequencing
o ABi SOLiD sequencing
One of the biggest ongoing challenges for these methods is in read length, and data storage
and analysis
23
24
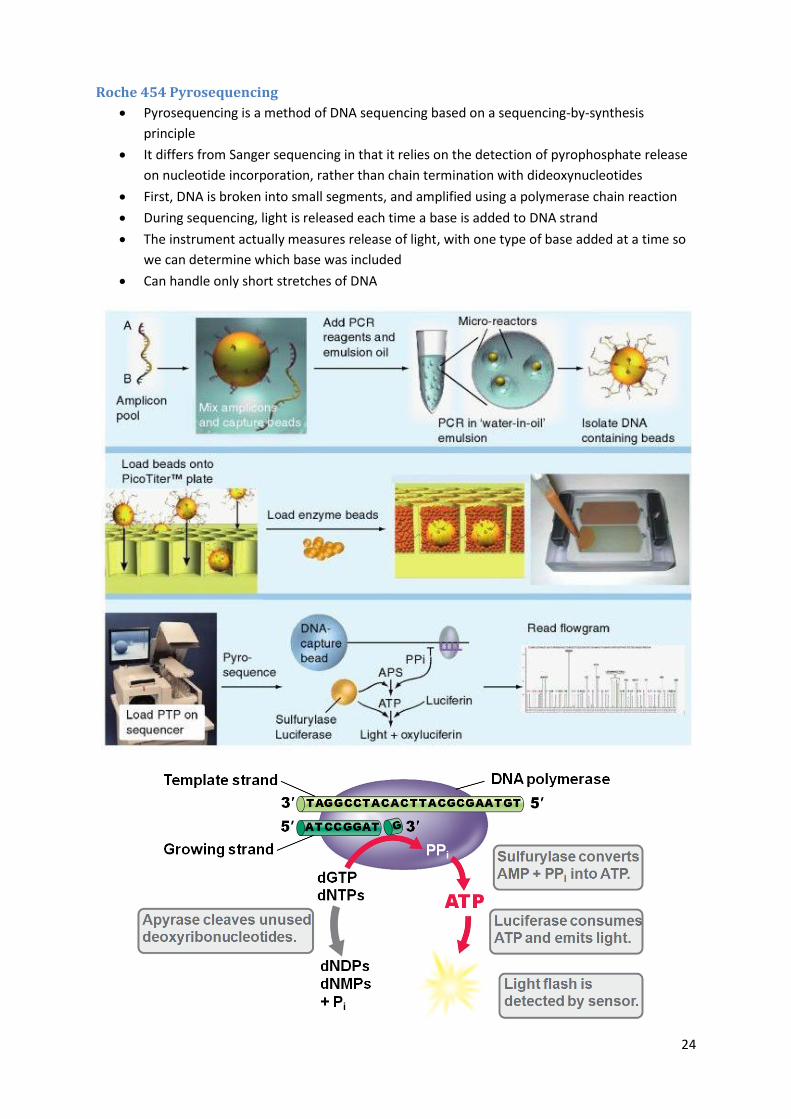
Roche 454 Pyrosequencing
Pyrosequencing is a method of DNA sequencing based on a sequencing-by-synthesis
principle
It differs from Sanger sequencing in that it relies on the detection of pyrophosphate release
on nucleotide incorporation, rather than chain termination with dideoxynucleotides
First, DNA is broken into small segments, and amplified using a polymerase chain reaction
During sequencing, light is released each time a base is added to DNA strand
The instrument actually measures release of light, with one type of base added at a time so
we can determine which base was included
Can handle only short stretches of DNA
25
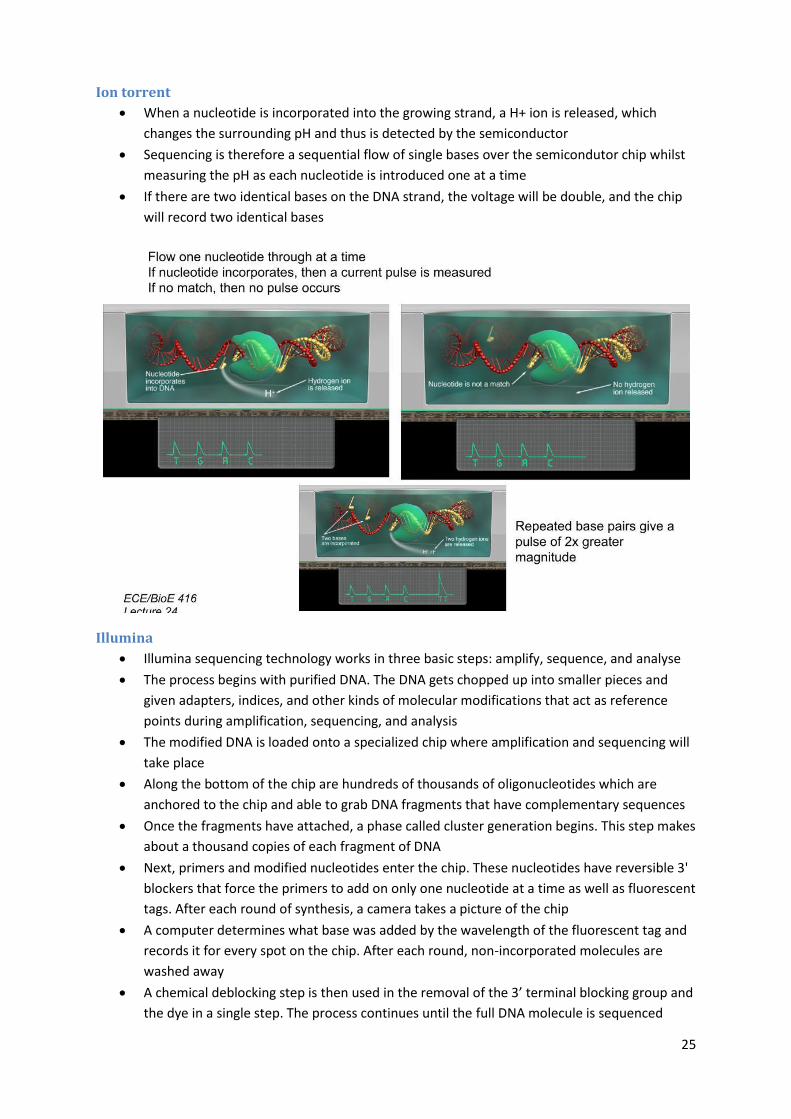
Ion torrent
When a nucleotide is incorporated into the growing strand, a H+ ion is released, which
changes the surrounding pH and thus is detected by the semiconductor
Sequencing is therefore a sequential flow of single bases over the semicondutor chip whilst
measuring the pH as each nucleotide is introduced one at a time
If there are two identical bases on the DNA strand, the voltage will be double, and the chip
will record two identical bases
Illumina
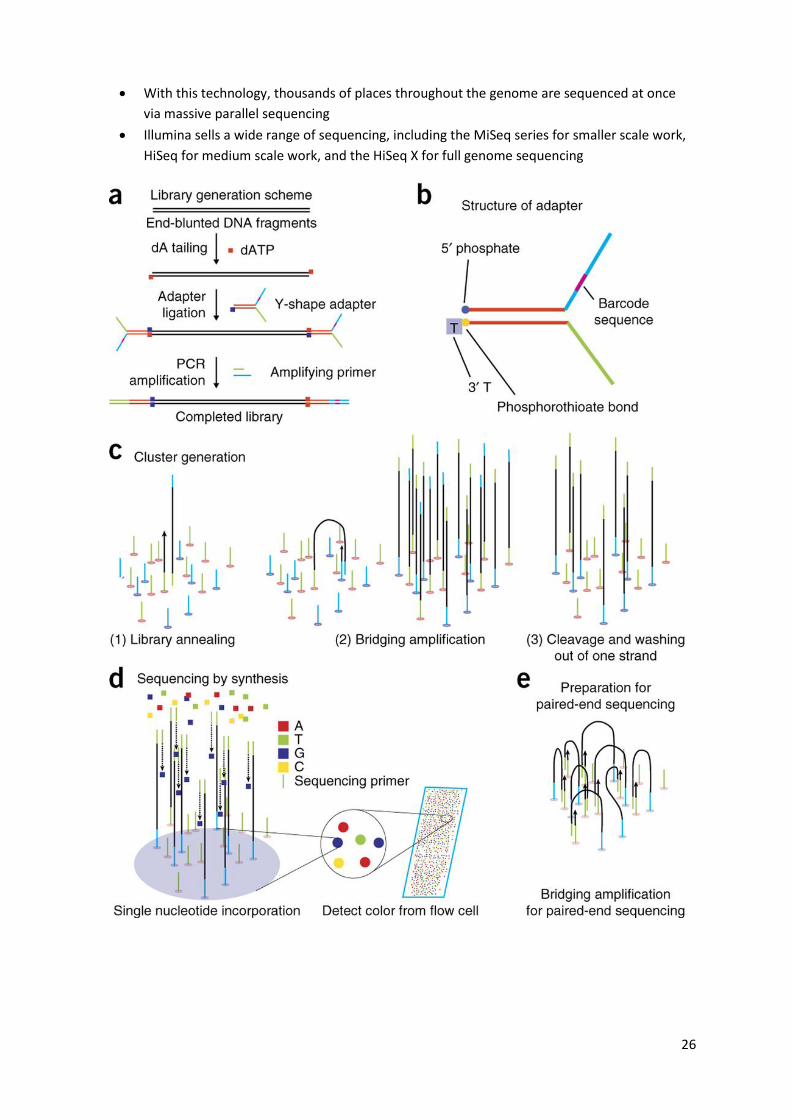
Illumina sequencing technology works in three basic steps: amplify, sequence, and analyse
The process begins with purified DNA. The DNA gets chopped up into smaller pieces and
given adapters, indices, and other kinds of molecular modifications that act as reference
points during amplification, sequencing, and analysis
The modified DNA is loaded onto a specialized chip where amplification and sequencing will
take place
Along the bottom of the chip are hundreds of thousands of oligonucleotides which are
anchored to the chip and able to grab DNA fragments that have complementary sequences
Once the fragments have attached, a phase called cluster generation begins. This step makes
about a thousand copies of each fragment of DNA
Next, primers and modified nucleotides enter the chip. These nucleotides have reversible 3'
blockers that force the primers to add on only one nucleotide at a time as well as fluorescent
tags. After each round of synthesis, a camera takes a picture of the chip
A computer determines what base was added by the wavelength of the fluorescent tag and
records it for every spot on the chip. After each round, non-incorporated molecules are
washed away
A chemical deblocking step is then used in the removal of the 3’ terminal blocking group and
the dye in a single step. The process continues until the full DNA molecule is sequenced
26
With this technology, thousands of places throughout the genome are sequenced at once
via massive parallel sequencing
Illumina sells a wide range of sequencing, including the MiSeq series for smaller scale work,
HiSeq for medium scale work, and the HiSeq X for full genome sequencing

27
Pacific biosciences
Single Molecule Real Time sequencing involves reactions carried out in nanocontainers - 20zl
sequencing reactions, with single-stranded DNA fragments attached
Single molecule real time sequencing (SMRT) is a parallelized single molecule DNA
sequencing method
Single molecule real time sequencing utilizes a zero-mode waveguide (ZMW), which is a
structure that creates an illuminated observation volume that is small enough to observe
only a single nucleotide of DNA being incorporated by DNA polymerase
A single DNA polymerase enzyme is affixed at the bottom of a ZMW with a single molecule
of DNA as a template
Each of the four DNA bases is attached to one of four different fluorescent dyes. When a
nucleotide is incorporated by the DNA polymerase, the fluorescent tag is cleaved off and
diffuses out of the observation area of the ZMW where its fluorescence is no longer
observable
A detector detects the fluorescent signal of the nucleotide incorporation, and the base call is
made according to the corresponding fluorescence of the dye

28
BioNano optical mapping
Optical mapping is a technique for constructing ordered, genome-wide, high-resolution
restriction maps from single, stained molecules of DNA, called "optical maps"
By mapping the location of restriction enzyme sites along the unknown DNA of an organism,
the spectrum of resulting DNA fragments collectively serves as a unique "fingerprint" or
"barcode" for that sequence
This method has since been integral to the assembly process of many large-scale sequencing
projects for both microbial and eukaryotic genomes
Genomic DNA is obtained from lysed cells, and randomly sheared to produce a "library" of
large genomic molecules for optical mapping
A single molecule of DNA is stretched (or elongated) and held in place on a slide under a
fluorescent microscope due to charge interactions
The DNA molecule is digested by restriction enzymes, and the resulting molecule fragments
remain attached to the surface
The fragment ends at the cleavage sites are drawn back (due to elasticity of linearized DNA),
leaving gaps which are identifiable under the microscope
DNA fragments stained with intercalating dye are visualized by fluorescence microscopy and
are sized by measuring the integrated fluorescence intensity. This produces an optical map
of single molecules
Individual optical maps are combined to produce a consensus, genomic optical map

29
Multiplexing
Multiplexing refers to any method of attaching a bar code before the sequencing
Large adapted primers are used to barcode the sample
The first five bases in an illumina run will be used for identification of the clusters, assumes
random base order – must be considered when designing adaptors
DNA sequence assembly
Genome assembly consists of connecting the DNA fragments in the correct order
De Brujin graphs are used for assembling genomic sequences. An n-dimensional De Bruijn
graph of m symbols is a directed graph representing overlaps between sequences of symbols
The Burrows–Wheeler transform rearranges a character string into runs of similar
characters. This is useful for compression, since it tends to be easy to compress a string that
has runs of repeated characters. The transformation is reversible, so it is a "free" method of
improving the efficiency of text compression algorithms, costing only some computation
Short sequence mapping tools such as Bow Tie, BWA, and Novoalign are designed for short
read assembly. They use Burrows-Wheeler indexing purpose-built for a small computational
footprint for DNA sequence alignment

30
Annotating the genome
Annotating the genome refers to the process of converting raw sequence data into a list of
genes present in the genome
Annotation is the major bottleneck in genomics
Computer algorithms are used to search for open reading frames by looking for start/stop
codons and Shine–Dalgarno sequences (ribosomal binding sites)
Hypothetical proteins are uncharacterized ORFs; proteins that likely exist but whose function
is currently unknown

31
Genome size and content
Archaea typically devote a higher percentage of their genomes to energy and coenzyme
production than do Bacteria
Archaea also contain fewer genes for carbohydrate metabolism or cytoplasmic membrane
functions than do Bacteria
Some mitochondria and some protozoa use variation of genetic code
Quantitative PCR
Reaction methods
A real-time polymerase chain reaction is a technique based on the polymerase chain
reaction
It monitors the amplification of a targeted DNA molecule during the PCR, i.e. in real-time,
and not at its end, as in conventional PCR
Two common methods for the detection of PCR products in real-time PCR are: (1) non-
specific fluorescent dyes that intercalate with any double-stranded DNA, and (2) sequence-
specific DNA probes consisting of oligonucleotides that are labelled with a fluorescent
reporter which permits detection only after hybridization of the probe
The PCR reaction amplifies according to the equation:
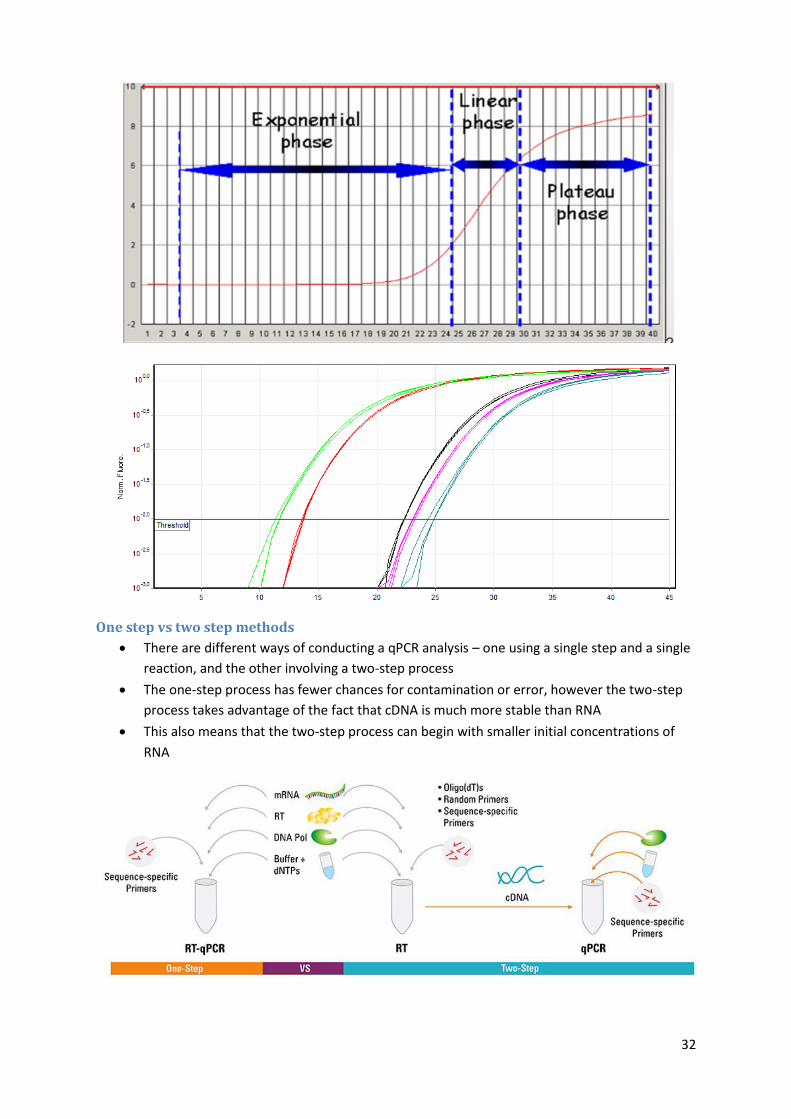
qPCR works by identifying the number of cycles (Ct value) required to reach a pre-defined
threshold of Relative Fluorescent Units
The lower is the Ct value, the more DNA was originally present in the sample
32
One step vs two step methods
There are different ways of conducting a qPCR analysis – one using a single step and a single
reaction, and the other involving a two-step process
The one-step process has fewer chances for contamination or error, however the two-step
process takes advantage of the fact that cDNA is much more stable than RNA
This also means that the two-step process can begin with smaller initial concentrations of
RNA
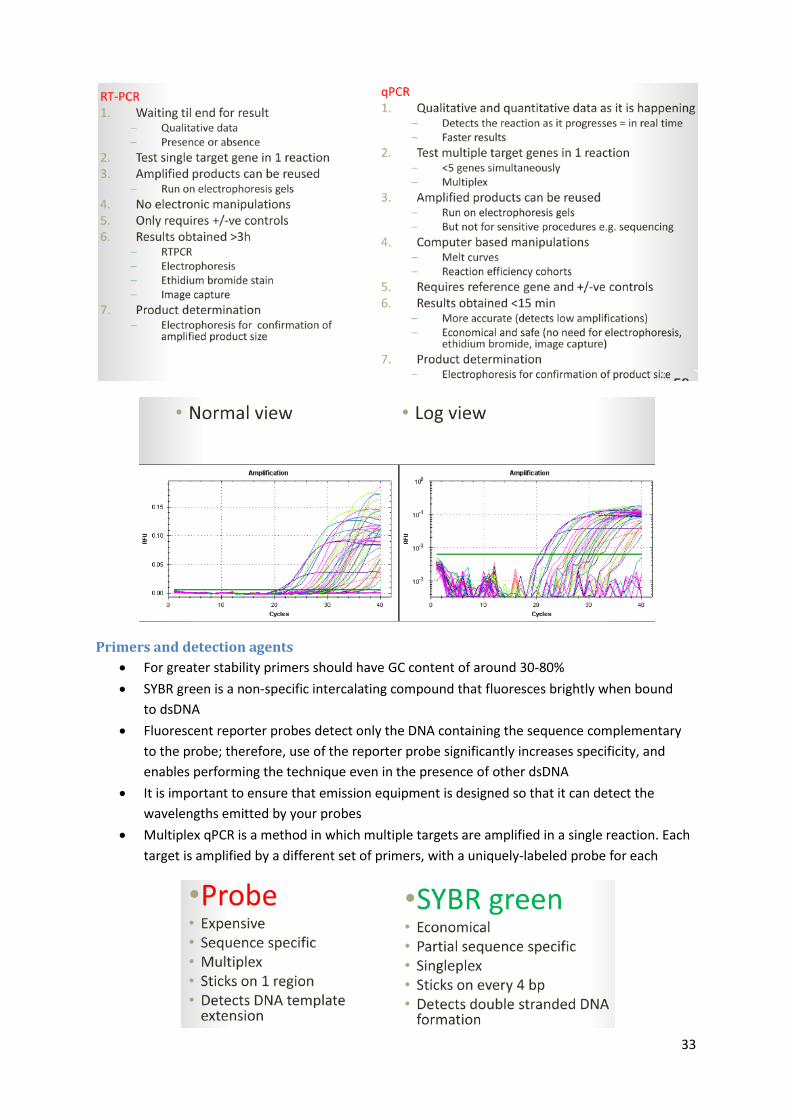
33
Primers and detection agents
For greater stability primers should have GC content of around 30‐80%
SYBR green is a non-specific intercalating compound that fluoresces brightly when bound
to dsDNA
Fluorescent reporter probes detect only the DNA containing the sequence complementary
to the probe; therefore, use of the reporter probe significantly increases specificity, and
enables performing the technique even in the presence of other dsDNA
It is important to ensure that emission equipment is designed so that it can detect the
wavelengths emitted by your probes
Multiplex qPCR is a method in which multiple targets are amplified in a single reaction. Each
target is amplified by a different set of primers, with a uniquely-labeled probe for each

34
Types of analyses
Absolute analysis: In absolute quantification using the standard curve method, you
quantitate unknowns based on a known quantity. First you create a standard curve; then
you compare unknowns to the standard curve and extrapolate a value.
Relative analysis: In relative quantification, you analyze changes in gene expression in a
given sample relative to another reference sample (such as an untreated control sample).
Comparative analysis: combines both methods
35
Calculating efficiency
With perfect efficiency, there will be 100% amplification per cycle
Actual efficiency will always be less than this
The actual efficiency can be calculated using the Pfaffl equation
The following equations give the absolute difference in amount between treated and
untreated conditions
Perfect efficiency:
Real efficiency:
Amplification efficiency can be improved by improving pipetting skills, optimising primer
concentration, and optimising the temperature changes over the course of the cycle
On a Ct/Log(Co) graph, a slope of -3.3 or -3.4 indicates close to 100% efficiency
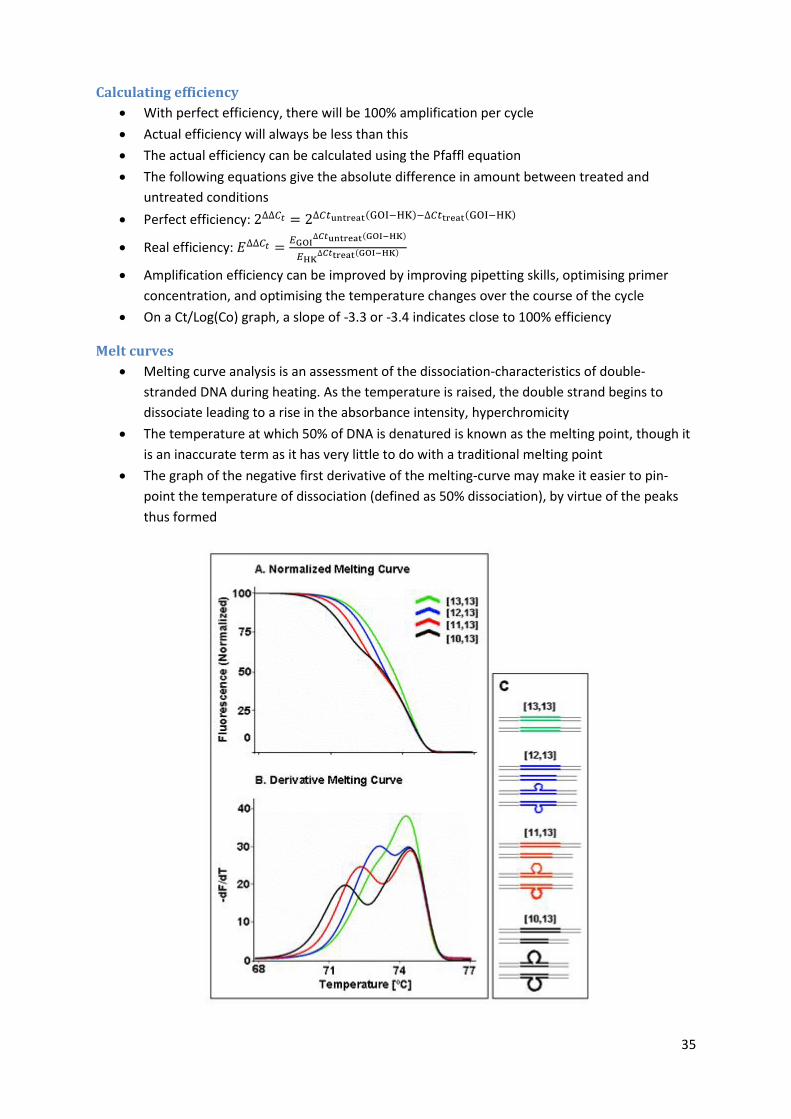
Melt curves
Melting curve analysis is an assessment of the dissociation-characteristics of double-
stranded DNA during heating. As the temperature is raised, the double strand begins to
dissociate leading to a rise in the absorbance intensity, hyperchromicity
The temperature at which 50% of DNA is denatured is known as the melting point, though it
is an inaccurate term as it has very little to do with a traditional melting point
The graph of the negative first derivative of the melting-curve may make it easier to pin-
point the temperature of dissociation (defined as 50% dissociation), by virtue of the peaks
thus formed

36
Transcriptomics
The transcriptome
The transcriptome is the set of all RNA molecules including mRNA, rRNA and tRNA, that are
transcribed in a cell or population of cells
It reflects the genes that are being actively expressed at any given time
Each gene may produce more than one variant of mRNA because of alternative splicing, RNA
editing, or alternative transcription initiation and termination sites
According to 2012 ENCODE, ~75% of noncoding DNA in the human genome did undergo
active transcription
DNA microarrays
A DNA microarray (chip or biochip) is a collection of microscopic DNA spots (probes)
attached to a solid surface
Probes can be a short section of a gene or other DNA element that are used to hybridize a
cDNA or cRNA sample (called a target)
RNA-seq
RNA-seq, or whole transcriptome shotgun sequencing, is a technique for using next-gen
sequencing to identify all RNA in a sample
It is a superior technique to microarrays because it does not require transcript-specific
probes or knowledge of the sequences
RNA-seq also is not limited by the fluorescence background and saturation low and high end
limits that plague microarrays, instead providing digital sequencing read counts across a
wider dynamic range of magnitudes. This also means it can detect very rare transcripts

37
All reads are assigned a quality Q score between 0 and 40, where for P the
probability of an incorrect base assignment
One useful technique is to plot the boxplot results for the quality scores across all reads by
the position in the read
This allows us to compare the quality of different sequencing methods, for instance 2009
Illumina (top) with 2013 Illumina HiSeq2000 (bottom)
A cutoff for Q=20 is typically used for discarding low quality data
After quality B-trimming any trimming artifacts need to be corrected, such as removing
uninformative sequences (N), polyA tails, and contaminants from primers or adapters

38
39
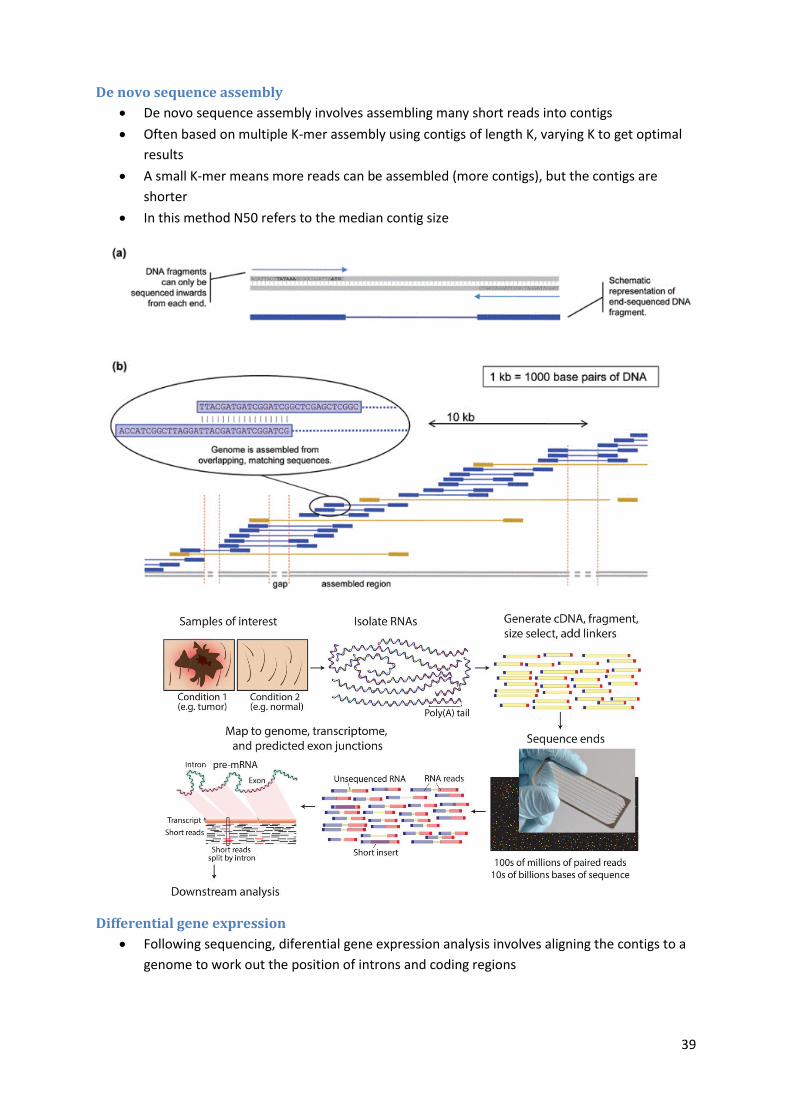
De novo sequence assembly
De novo sequence assembly involves assembling many short reads into contigs
Often based on multiple K-mer assembly using contigs of length K, varying K to get optimal
results
A small K-mer means more reads can be assembled (more contigs), but the contigs are
shorter
In this method N50 refers to the median contig size
Differential gene expression
Following sequencing, diferential gene expression analysis involves aligning the contigs to a
genome to work out the position of introns and coding regions
40
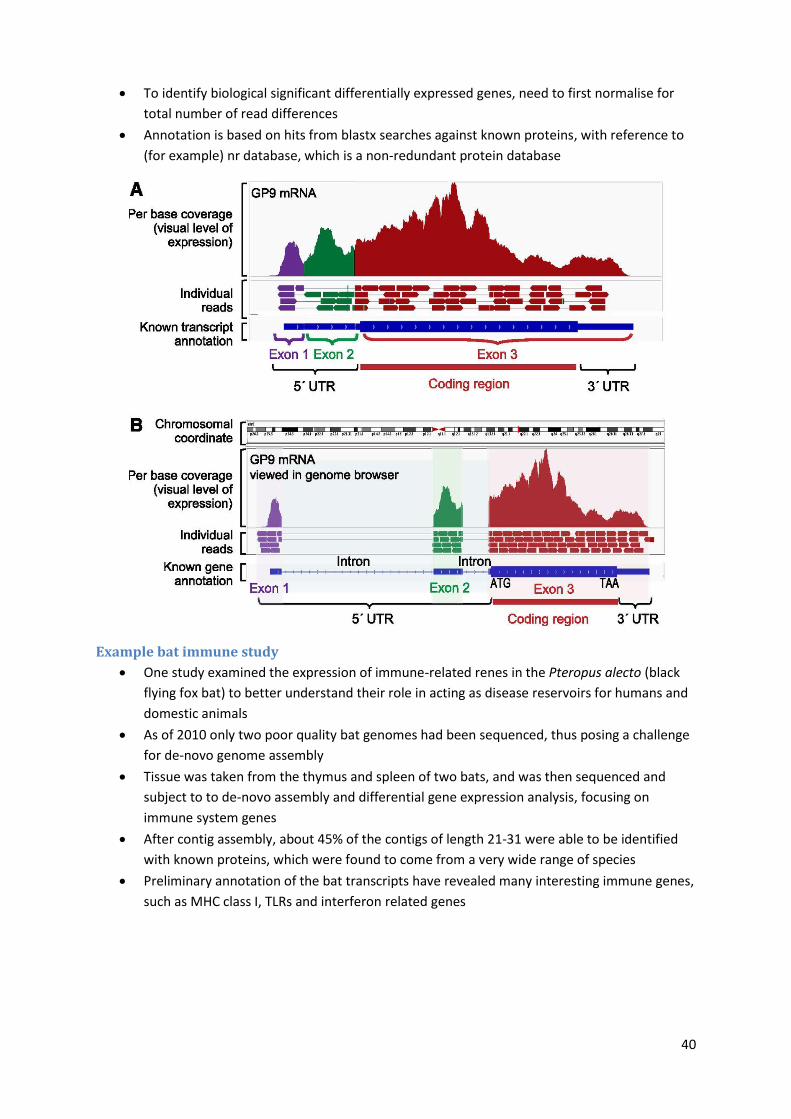
To identify biological significant differentially expressed genes, need to first normalise for
total number of read differences
Annotation is based on hits from blastx searches against known proteins, with reference to
(for example) nr database, which is a non-redundant protein database
Example bat immune study
One study examined the expression of immune-related renes in the Pteropus alecto (black
flying fox bat) to better understand their role in acting as disease reservoirs for humans and
domestic animals
As of 2010 only two poor quality bat genomes had been sequenced, thus posing a challenge
for de-novo genome assembly
Tissue was taken from the thymus and spleen of two bats, and was then sequenced and
subject to to de-novo assembly and differential gene expression analysis, focusing on
immune system genes
After contig assembly, about 45% of the contigs of length 21-31 were able to be identified
with known proteins, which were found to come from a very wide range of species
Preliminary annotation of the bat transcripts have revealed many interesting immune genes,
such as MHC class I, TLRs and interferon related genes
41
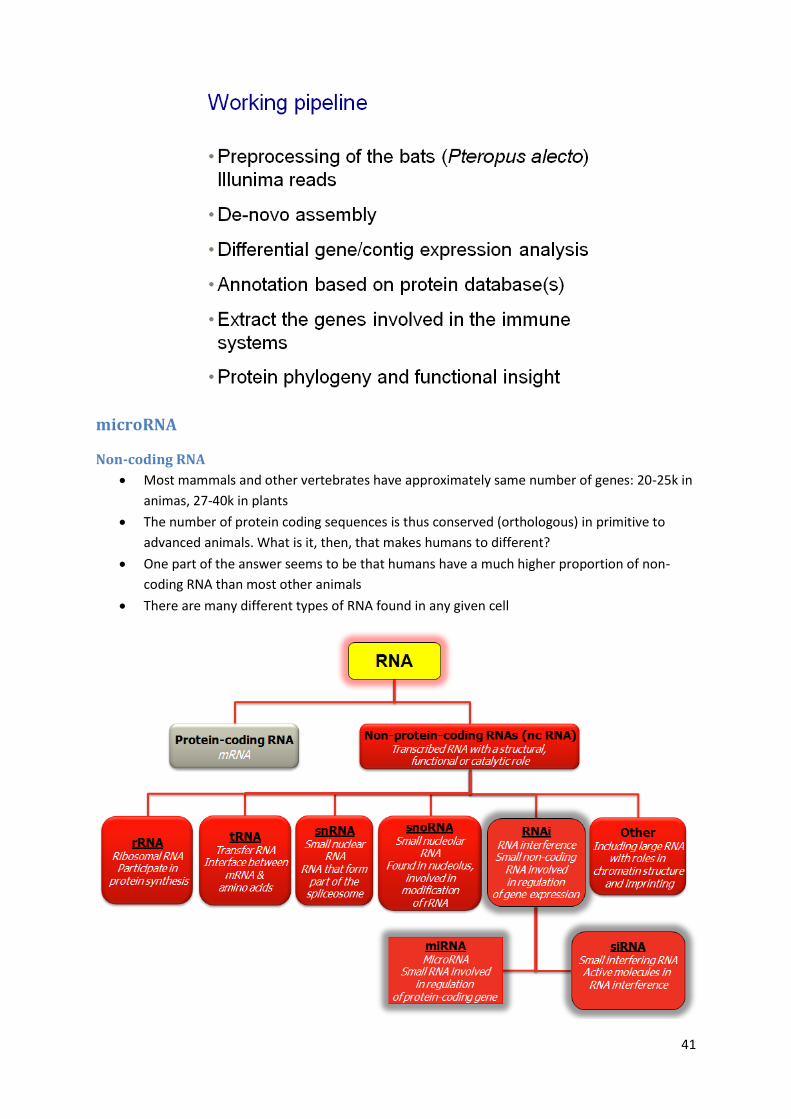
microRNA
Non-coding RNA
Most mammals and other vertebrates have approximately same number of genes: 20-25k in
animas, 27-40k in plants
The number of protein coding sequences is thus conserved (orthologous) in primitive to
advanced animals. What is it, then, that makes humans to different?
One part of the answer seems to be that humans have a much higher proportion of non-
coding RNA than most other animals
There are many different types of RNA found in any given cell
42
Discovery of miRNA
miRNA was discovered in 1993 when Victor Ambros and colleagues discovered that lin-4, a
gene known to control the timing of C. elegans larval development, does not code for a
protein but instead produces a pair of small RNAs ~22 nt, and ~61 nt in length
Seven years later, another non-coding gene let7 was found to regulate worm development,
and has since been found to be conserved in number of species including humans
Since 2000, thousands of miRNAs have been reported from a number of species including
humans
miRNA are now named sequentially with the prefix mir, so mir-125a. The same miRNA
generated from different loci are denoted with a final latter, so mir-125b-2
Transcriptional regulation of miRNAs
The majority of canonical miRNAs are encoded by introns of non-coding or coding
transcripts, but some miRNAs are encoded by exonic regions
miRNAs in the same cluster are generally co-transcribed, but the individual miRNAs can be
additionally regulated at the post-transcriptional level
Some miRNA genes reside in the introns of protein-coding genes and, thus, share the
promoter of the host gene
miRNA genes often have multiple transcription start sites
miRNA transcription is carried out by RNA Pol II
Transcription factors include p53, MYC, ZEB1 and ZEB2, and MYOD1
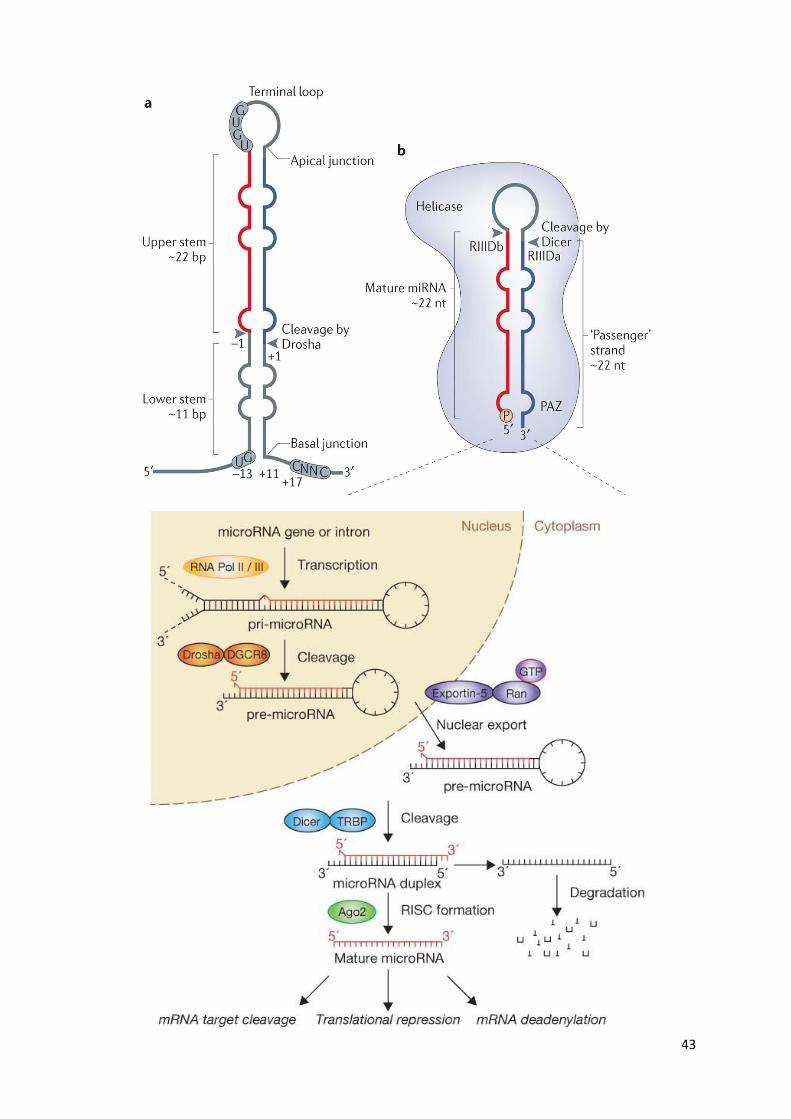
Nuclear processing of miRNAs
Following transcription, the primary miRNA (pri-miRNA) undergoes several steps of
maturation
pri-miRNA is long (typically over 1 kb) and contains a local stem–loop structure, in which
mature miRNA sequences are embedded
The nuclear RNase III Drosha initiates the maturation process by cropping the stem–loop to
release a small hairpin-shaped RNA of ~65 nucleotides in length (pre-miRNA).
Together with its essential cofactor DGCR8, Drosha forms a complex called Microprocessor
As Drosha cleavage defines the terminus of an miRNA and thereby determines its specificity,
it is important that Microprocessor precisely recognizes and cleaves a pri-miRNA
Drosha cleaves the hairpin at approximately 11 bp away from the 'basal' junction, which
thus functions as the major reference point in determining the cleavage site
43

44
Cytosolic processing of miRNAs
Dicer interacts with a double-stranded RNA-binding domain (dsRBD) protein-binding protein
(TRBP)
Following Dicer processing, the RNA duplex is released and subsequently loaded onto
human Argonaute (Ago)
A heat shock cognate 70 (HSC70)–heat shock protein 90 (HSP90) complex hydrolyses ATP to
load the RNA duplex
The 'passenger' strand is discarded and the mature microRNA (miRNA) remains in one of the
AGO proteins forming a RISC (RNA-induced silencing complex)
45
miRNA in inflammation
miRNAs have recently been implicated in the inflammatory response, their transcription
controlled by protein regulators
p53, KSRP, and Smad are proteins that interact with miRNA loops and are activated during
inflammatory responses
Inflammatory cytokines, such as interferons (IFNs), can repress expression of biogenesis
factors including Dicer
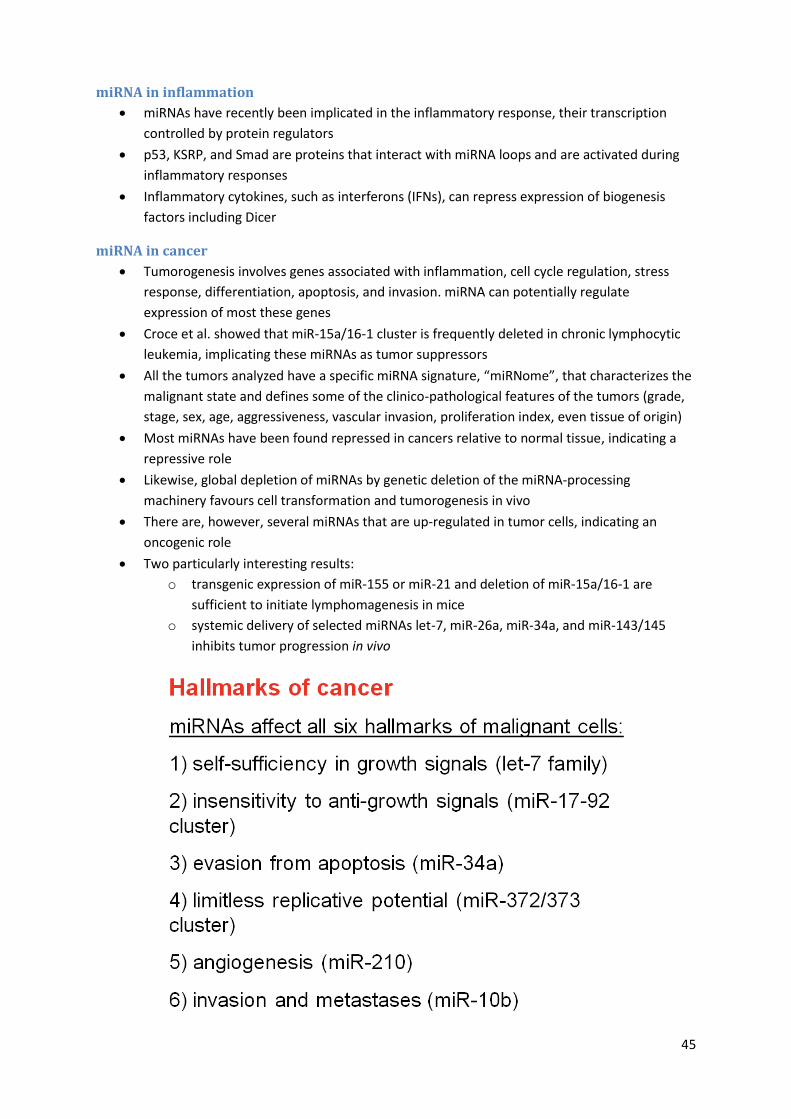
miRNA in cancer
Tumorogenesis involves genes associated with inflammation, cell cycle regulation, stress
response, differentiation, apoptosis, and invasion. miRNA can potentially regulate
expression of most these genes
Croce et al. showed that miR-15a/16-1 cluster is frequently deleted in chronic lymphocytic
leukemia, implicating these miRNAs as tumor suppressors
All the tumors analyzed have a specific miRNA signature, “miRNome”, that characterizes the
malignant state and defines some of the clinico-pathological features of the tumors (grade,
stage, sex, age, aggressiveness, vascular invasion, proliferation index, even tissue of origin)
Most miRNAs have been found repressed in cancers relative to normal tissue, indicating a
repressive role
Likewise, global depletion of miRNAs by genetic deletion of the miRNA-processing
machinery favours cell transformation and tumorogenesis in vivo
There are, however, several miRNAs that are up-regulated in tumor cells, indicating an
oncogenic role
Two particularly interesting results:
o transgenic expression of miR-155 or miR-21 and deletion of miR-15a/16-1 are
sufficient to initiate lymphomagenesis in mice
o systemic delivery of selected miRNAs let-7, miR-26a, miR-34a, and miR-143/145
inhibits tumor progression in vivo

46
TGA website submission
Primary orality lynne kelly


