
F I N A L R E P O R T
Evaluation Design Report for the
Liberia Energy Project
Activities 1 and 2
October 5, 2018
Candace Miller
Kristine Bos
Ali Protik
Randall Blair
Paolo Abarcar
Matthew Ribar
Submitted to:
Millennium Challenge Corporation
1099 14th Street, NW
Suite 700
Washington, DC 20005
Project Monitor: Algerlynn Gill
Contract Number: MCC-17-CON-0016
Submitted by:
Mathematica Policy Research
1100 1st Street, NE, 12th Floor
Washington, DC 20002-4221
Telephone: (202) 484-9220
Facsimile: (202) 863-1763
Project Director: Candace Miller
Reference Number: 50456.01.210.032.000

This page has been left blank for double-sided copying.
LIBERIA ENERGY EVALUABILITY ASSESSMENT FINAL REPORT MATHEMATICA POLICY RESEARCH
iii
CONTENTS
ACRONYMS ................................................................................................................................................. xi
I. INTRODUCTION AND BACKGROUND .......................................................................................... 1
II. OVERVIEW OF THE COMPACT AND THE INTERVENTIONS EVALUATED ............................... 3
A. Overview of the Liberia Energy Project ..................................................................................... 3
B. Overview of the theory of change .............................................................................................. 5
C. Literature Review ....................................................................................................................... 7
1. Liberia’s electricity network, grid infrastructure interventions, outcomes, and
literature gaps ..................................................................................................................... 8
2. Energy sector outcomes ................................................................................................... 10
3. End-user connections and impacts ................................................................................... 12
4. Utility–level outcomes ....................................................................................................... 17
5. Contribution of the proposed evaluations to the literature ................................................ 19
III. OVERVIEW OF EVALUATION DESIGN ....................................................................................... 21
A. Evaluation questions and designs ........................................................................................... 25
IV. IMPLEMENTATION ANALYSIS OF OUTCOMES ........................................................................ 27
A. Overview: Approach to assessing overarching outcomes ...................................................... 27
B. Methods, sample, and data sources ....................................................................................... 28
V. PERFORMANCE EVALUATION TO MEASURE GRID, ENERGY SECTOR, END-USER,
AND UTILITY-LEVEL OUTCOMES ............................................................................................... 31
A. Grid level outcomes ................................................................................................................. 31
1. Approach to measuring grid-level outcomes .................................................................... 31
2. Methods, sample, outcomes, and data sources ............................................................... 32
B. Energy sector outcomes .......................................................................................................... 38
1. Approach to measuring energy sector outcomes ............................................................. 38
2. Methods, sample, and data sources ................................................................................. 38
C. End-user outcomes ................................................................................................................. 40
1. Approach to measuring end-user outcomes for the performance evaluation ................... 40
2. Methods, sample, and data sources ................................................................................. 40
D. Utility-level outcomes ............................................................................................................... 41
1. Approach to measuring utility-level outcomes .................................................................. 41
2. Methods, sample, and data sources ................................................................................. 42
E. Analysis plan for the implementation and performance evaluations ....................................... 42

LIBERIA ENERGY EVALUABILITY ASSESSMENT FINAL REPORT MATHEMATICA POLICY RESEARCH
iv
VI. PERFORMANCE AND IMPACT EVALUATIONS TO MEASURE END USER
OUTCOMES .................................................................................................................................. 45
A. Overview .................................................................................................................................. 45
B. Performance evaluation for connected households and small enterprises ............................. 47
1. Approach to measuring outcomes among household and small businesses ................... 47
2. Sampling and analysis ...................................................................................................... 48
C. Performance evaluation of medium and large businesses and public institutions .................. 52
1. Approach to measuring outcomes among medium and large electricity customers ........ 52
2. Sampling and analysis ...................................................................................................... 53
D. Impact evaluation for unconnected end users ......................................................................... 54
1. Instrumental variables strategy using natural geography ................................................. 54
2. Difference-in-Differences (DID) with MCG Design ........................................................... 56
3. Sampling strategy ............................................................................................................. 58
4. Sample size requirement and statistical power ................................................................ 58
5. Key outcomes ................................................................................................................... 60
6. Data sources ..................................................................................................................... 61
VII. COST-BENEFIT ANALYSIS & BENEFICIARY ANALYSIS ................................................................. 65
A. Pre-intervention ERR model .................................................................................................... 65
1. Main components of the ERR model ................................................................................ 66
2. Critical assumptions of the ERR model ............................................................................ 67
B. Beneficiary analysis ................................................................................................................. 69
C. Plan for assessing the ERR assumptions and parameters and recalculating if
warranted ................................................................................................................................. 70
VIII. DATA COLLECTION ...................................................................................................................... 73
A. Local data collection partners .................................................................................................. 73
B. Approach to collecting high quality data .................................................................................. 73
C. Data collection training ............................................................................................................ 74
D. Timing of data collection activities ........................................................................................... 74

LIBERIA ENERGY EVALUABILITY ASSESSMENT FINAL REPORT MATHEMATICA POLICY RESEARCH
v
IX. ADMINISTRATIVE ISSUES ........................................................................................................... 83
A. Summary of IRB requirements and clearances....................................................................... 83
B. Data access, privacy, and file preparation .............................................................................. 83
C. Dissemination plan .................................................................................................................. 84
D. Evaluation team: Roles and responsibilities ............................................................................ 84
E. Evaluation timeline and reporting schedule ............................................................................. 84
F. Budget ..................................................................................................................................... 86
X. CHALLENGES TO EVALUATION STUDIES ................................................................................ 89
REFERENCES ............................................................................................................................................ 91

This page has been left blank for double-sided copying.
LIBERIA ENERGY EVALUABILITY ASSESSMENT FINAL REPORT MATHEMATICA POLICY RESEARCH
vii
TABLES
III.1 Summary of the types of proposed evaluation designs ................................................................. 22
IV.1 Research questions, evaluation designs and methods for implementation analysis .................... 27
IV.2 Data sources, indicators, and timeline for implementation evaluation of Activities 1 and 2 .......... 30
V.1 Research questions, evaluation designs, and methods for evaluation of grid-level
outcomes ........................................................................................................................................ 32
V.2 Performance evaluation data sources and outcomes .................................................................... 35
V.3 Research questions, evaluation designs, and methods for evaluation of energy-sector
outcomes ........................................................................................................................................ 38
V.4 Research questions, evaluation designs, and methods for evaluation of end-user
outcomes ........................................................................................................................................ 40
V.5 Research questions, evaluation designs, and methods for evaluation of utility-level
outcomes ........................................................................................................................................ 41
VI.1 List of T&D investment locations, expected number of connections, and implementation
status .............................................................................................................................................. 46
VI.2 Overview of evaluation methods to estimate end user impacts .................................................... 47
VI.3 Minimum detectable impacts for connected end users .................................................................. 51
VI.4 Proposed outcomes for medium and large businesses and public institutions ............................. 53
VI.5 Summary statistics of SRTM-based elevation and slope .............................................................. 56
VI.6 Outcomes, by domain, for unconnected end users ....................................................................... 61
VI.7 Quantitative sampling and data collection for end users’ outcomes (primary data sources) ........ 62
VII.1 ERR parameters and measurement .............................................................................................. 70
VIII.1 Qualitative data collection summary .............................................................................................. 75
VIII.2 Quantitative data collection summary ............................................................................................ 80
IX.1 Evaluation timeline and reporting schedule ................................................................................... 85
IX.2 Project costs by year and activity ................................................................................................... 86
IX.3 Proposed budget for the evaluation of Activities 1 and 2 ............................................................... 86

This page has been left blank for double-sided copying.
LIBERIA ENERGY EVALUABILITY ASSESSMENT FINAL REPORT MATHEMATICA POLICY RESEARCH
ix
FIGURES
II.1 Theory of change for Activities 1 and 2 (Mathematica’s version) .................................................... 6
III.1 Conceptual map ............................................................................................................................. 23
III.2 Indicator and outcome key to the conceptual map ........................................................................ 24
VI.1 Illustrative cluster sampling approach for small end users ............................................................ 50
IX.1 Project schedule for the evaluation ................................................................................................ 87

This page has been left blank for double-sided copying.

LIBERIA ENERGY EVALUABILITY ASSESSMENT FINAL REPORT MATHEMATICA POLICY RESEARCH
xi
ACRONYMS
AfDB African Development Bank
CBA cost-benefit analysis
CIE Compagnie Ivoirienne d'Electricité
CMC contract managing consultant
CSLG Cote d’Ivoire, Liberia, Sierra Leone, and Guinea
EIB European Investment Bank
EPA Environmental Protection Agency
ERR economic rate of return
EIB European Investment Bank
ESBI Electricity Supply Board International
GoL Government of Liberia
GoN Government of Norway
GSI Gender and Social Inclusion
HFO heavy fuel oil
HLSG High Level Stakeholder Group
IMS information management system
IMT Interim Management Team
IV instrumental variable
IPP independent power producer
KfW German Development Bank
kWh kilowatt hour
LEC Liberia Electricity Corporation
LERC Liberian Electricity Regulatory Commission
LISGIS Liberian Institute for Statistics and Geo-Information Systems
MCA-L Millennium Challenge Account Liberia
MCC Millennium Challenge Corporation
MCHPP Mt. Coffee Hydropower Plant
MHI Manitoba Hydro International (previous Management Services Contract)
M&E monitoring and evaluation
MME Ministry of Mines and Energy
MSC management services contract
MW megawatt
MWh megawatt hour
RCE rapid cycle evaluation
RCT randomized controlled trial
SCADA supervisory control and data acquisition
SME small and medium enterprises
T&D transmission and distribution
USAID United States Agency for International Development
WB World Bank
WTP willingness to pay

This page has been left blank for double-sided copying.

LIBERIA ENERGY EVALUABILITY ASSESSMENT FINAL REPORT MATHEMATICA POLICY RESEARCH
1
I. INTRODUCTION AND BACKGROUND
Insufficient access to reliable and affordable electricity severely constrains economic growth
in Liberia. Only 2 percent of the population of Liberia has electricity—one of the lowest
electrification rates in the world (USAID 2016). Moreover, access to on-grid electricity is very
costly. The electricity tariff, which once reached $0.52 per kilowatt hour (kWh) in 2012, has
since declined to $0.35 per kWh as of October 2017 (Liberia Executive Mansion 2017).
However, this tariff is still one of the highest in the world due to the utility company’s debts and
high operating costs relative to electricity consumption, the failure of many small and one of the
largest customers to pay electricity bills, exceedingly high commercial and technical loss rates,
and the cost of diesel fuel for the generators that power portions of Liberia’s electricity
infrastructure (African Development Bank Group [AfDB] 2013; Millennium Challenge
Corporation 2015a). The few households and firms that do have the means and the access to
connect to grid electricity experience frequent planned and unplanned outages (Cooper 2017).
Liberia’s 14-year civil war from 1989 to 2003, followed by widespread looting, resulted in
the destruction of the Mt. Coffee Hydropower Plant (MCHPP)—the country’s single largest
source of power before 1989—and the entire transmission and distribution (T&D) network. Even
by 2016, the total installed capacity was 23 megawatts (MW), a considerable reduction from a
peak of 191 MW in 1989 (USAID 2016; World Bank 2011). In addition, the Liberian Electricity
Corporation (LEC) lost significant technical and management capacity.
In 2015, the Millennium Challenge Corporation (MCC) partnered with the Government of
Liberia (GoL) to help address the country’s insufficient access to reliable and affordable
electricity. Under MCC’s compact with the GoL, and with The Millennium Challenge Account–
Liberia (MCA-L) as the implementing agency, the $202 million Energy Project aims to
modernize Liberia’s energy network, extend access to electricity, and improve the quality and
reliability of the country’s power system. The GoL aims to connect 70 percent of Monrovia—
both households and businesses—to the electricity grid by 2030.
MCC contracted with Mathematica Policy Research to conduct impact and performance
evaluations of the Energy Project, which include four separate activities and related investments
that address the challenges facing Liberia’s power sector:
Activity 1: The Mt. Coffee Rehabilitation Activity, which has repaired and expanded the
MCHPP, providing an installed generation capacity of 88 MW
Activity 2: The Capacity Building and Sector Reform Activity, which will support the
creation of an independent regulatory agency, provide management oversight to the Liberia
Electricity Corporation (LEC), and strengthen the capacity of LEC and, potentially,
Liberia’s Environmental Protection Agency (EPA)
Activity 3: The Mt. Coffee Support Activity, which addresses environmental and social
risks associated with the rehabilitation of MCHPP and aims to increase productive uses of
electricity
Activity 4: The LEC Training Center Activity, which aims to improve the capacity of the
energy sector

LIBERIA ENERGY EVALUABILITY ASSESSMENT FINAL REPORT MATHEMATICA POLICY RESEARCH
2
In addition, the Gender and Social Inclusion (GSI) investments aim to strengthen the other
activities by addressing issues related to poverty, social exclusion, ethnic tensions, and gender
inequality in Liberia.
This report describes Mathematica’s comprehensive mixed-methods approach to the
impact and performance evaluations of Activities 1 and 2. The proposed evaluation designs
described in this report aim to measure the impacts of and understand the changes related to the
Mt. Coffee Rehabilitation Activity and the Capacity Building and Sector Reform Activity. When
relevant, we will disaggregate the evaluation by key demographic dimensions to understand the
programs’ effects on gender and social inclusion. We plan to use a range of implementation,
performance, and impact evaluation methods to
answer research questions about the overarching,
grid, energy sector, end user- and utility-level
outcomes.
In the chapters that follow, we provide
context for the evaluation and describe its
planned design in further detail. In Chapter II, we
present the program logic and describe the
activities of the Mt. Coffee Rehabilitation
Activity and the Capacity Building and Sector
Reform Activity. We also review the existing
literature on the impacts of increased electricity
generation capacity, regulatory reform, and improved utility capacity. In Chapter III, we outline
the research questions that the evaluation seeks to answer and provide an overview of the
quantitative and qualitative evaluation designs and data sources that will enable us to answer
these questions. In Chapter IV, we describe our approach to assessing overarching outcomes
through an implementation analysis and in Chapter V, we describe the design and data sources
for the performance evaluation of grid, energy sector, end-user, and utility-level outcomes. Next,
in Chapter VI, we detail our design for the quantitative impact evaluations. In Chapter VII, we
describe the cost-benefit analysis and (CBA model) and outline plans for updating the
parameters. The final sections of the report discuss our data collection approach (Chapter VIII),
administrative issues (Chapter IX), and challenges to the evaluation studies (Chapter X).
In this report, we propose a comprehensive mixed-methods approach to measure implementation, performance, and impacts of Activities 1 and 2 in the Liberia Energy
Project. We propose evaluation methods to answer research questions about outcomes at different levels:
Overarching implementation outcomes
Grid level outcomes
Energy sector outcomes
End user outcomes
Utility-level outcomes

LIBERIA ENERGY EVALUABILITY ASSESSMENT FINAL REPORT MATHEMATICA POLICY RESEARCH
3
II. OVERVIEW OF THE COMPACT AND THE INTERVENTIONS EVALUATED
In this chapter, we provide context for the evaluation of Activities 1 and 2 by describing the
project activities and the mechanisms through which we expect them to affect outcomes, as set
out in the program logic. We also summarize and identify gaps in the existing literature on
electricity production, regulatory reform, and utility management; and explain the contributions
of this study to Liberia and the energy field.
A. Overview of the Liberia Energy Project
In 2015, MCC partnered with the GoL to stimulate economic growth and reduce poverty in
Liberia through investments in road and electricity infrastructure. Under the $257 million Liberia
Compact, which began in January 2016, the $202 million Energy Project aims to modernize
Liberia’s energy network, extend access to electricity, and improve the quality and reliability of
the country’s power system through four activities and cross-cutting GSI investments.
Mathematica will evaluate the four activities and the GSI investments separately. This report
describes our proposed evaluation designs for Activities 1 and 2.1
The Mt. Coffee Rehabilitation Activity is the largest component of the Energy Project,
accounting for nearly $147 million of MCC’s $202 million investment. The activity aims to
increase domestic electricity generation, reduce electricity costs, and improve electricity
reliability by reconstructing the MCHPP and contributing to the installation of 66 kilovolt (kv)
transmission lines from MCHPP to the Paynesville and Bushrod substations. MCC is one of
several donors funding the MCHPP rehabilitation, making this a unique investment for MCC
given that expected outcomes and impacts hinge upon the efforts of other donor investments.
Further, the Liberia Compact requires a high level of coordination with donor partners as well as
significant energy sector and regulatory reform.
The MCHPP is located on the St. Paul River, about 27 kilometers northeast of the capital
city, Monrovia. The plant was constructed in the 1960s and expanded in the 1970s to a capacity
of 64 MW (Norplan Fichtner 2013). Prior to the civil war, the dam was damaged from high
water flows and during Liberia’s civil wars, power generation halted and the dam breached in
1990 after the operators were required to vacate the facility preventing operation of the spillway
gates. In subsequent years, the plant’s mechanical and electrical equipment was almost entirely
destroyed or stolen. However, post war, in 2008, a feasibility study concluded that the plant
could be rehabilitated. In 2011, before MCC’s involvement, a group of donors including the
Government of Norway (GoN), the German Development Bank (KfW), and the European
Investment Bank (EIB), committed funding to a limited rehabilitation. Work on MCHPP began
in 2012, with completion scheduled for 2015. However, the project was suspended during the
Ebola virus outbreak. As a result, the dam reconstruction was delayed by a year. In addition, the
GoL was no longer able to honor its funding commitment. In 2015, GoN and KfW committed
additional funding to cover these cost overages. In addition, MCC began working with the active
donors and the project implementation unit (PIU), committing funds to support MCHPP and
1 The evaluation designs for Activities 3, 4 and GSI investments will be described in separate reports once these
Activities are fully designed.
LIBERIA ENERGY EVALUABILITY ASSESSMENT FINAL REPORT MATHEMATICA POLICY RESEARCH
4
implement additional activities. MCC’s funding began when the Liberia Compact entered into
force in January 2016.
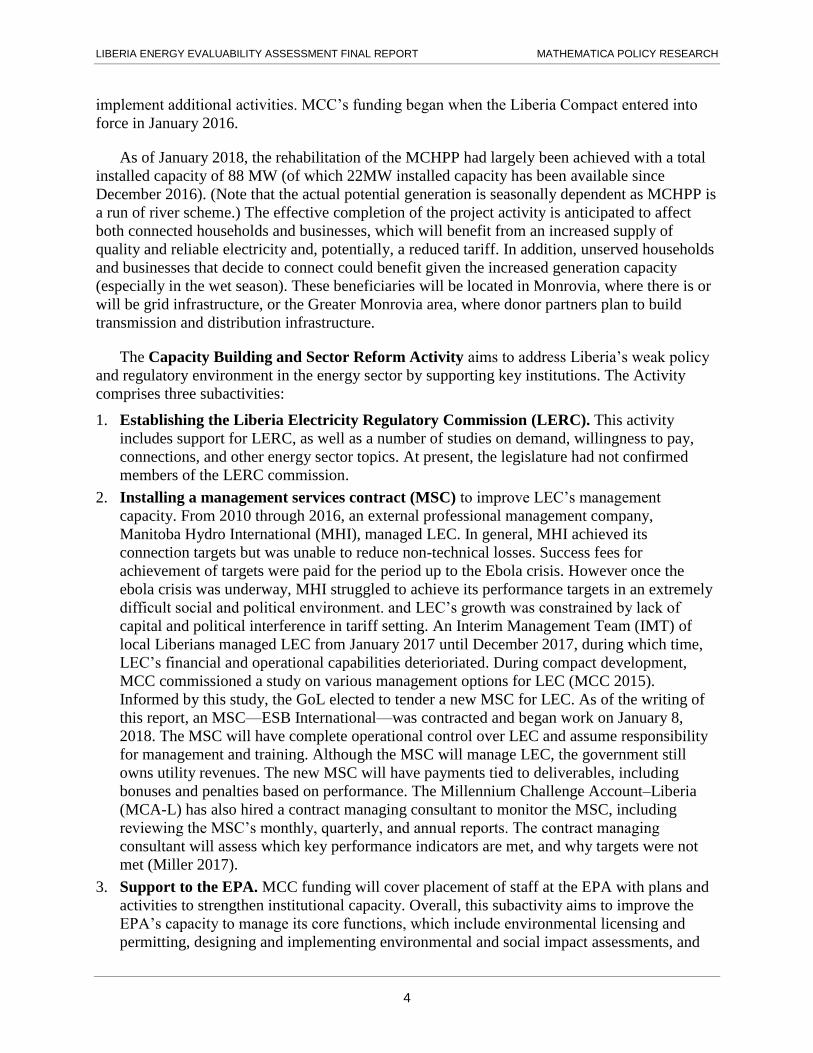
As of January 2018, the rehabilitation of the MCHPP had largely been achieved with a total
installed capacity of 88 MW (of which 22MW installed capacity has been available since
December 2016). (Note that the actual potential generation is seasonally dependent as MCHPP is
a run of river scheme.) The effective completion of the project activity is anticipated to affect
both connected households and businesses, which will benefit from an increased supply of
quality and reliable electricity and, potentially, a reduced tariff. In addition, unserved households
and businesses that decide to connect could benefit given the increased generation capacity
(especially in the wet season). These beneficiaries will be located in Monrovia, where there is or
will be grid infrastructure, or the Greater Monrovia area, where donor partners plan to build
transmission and distribution infrastructure.
The Capacity Building and Sector Reform Activity aims to address Liberia’s weak policy
and regulatory environment in the energy sector by supporting key institutions. The Activity
comprises three subactivities:
1. Establishing the Liberia Electricity Regulatory Commission (LERC). This activity
includes support for LERC, as well as a number of studies on demand, willingness to pay,
connections, and other energy sector topics. At present, the legislature had not confirmed
members of the LERC commission.
2. Installing a management services contract (MSC) to improve LEC’s management
capacity. From 2010 through 2016, an external professional management company,
Manitoba Hydro International (MHI), managed LEC. In general, MHI achieved its
connection targets but was unable to reduce non-technical losses. Success fees for
achievement of targets were paid for the period up to the Ebola crisis. However once the
ebola crisis was underway, MHI struggled to achieve its performance targets in an extremely
difficult social and political environment. and LEC’s growth was constrained by lack of
capital and political interference in tariff setting. An Interim Management Team (IMT) of
local Liberians managed LEC from January 2017 until December 2017, during which time,
LEC’s financial and operational capabilities deterioriated. During compact development,
MCC commissioned a study on various management options for LEC (MCC 2015).
Informed by this study, the GoL elected to tender a new MSC for LEC. As of the writing of
this report, an MSC—ESB International—was contracted and began work on January 8,
2018. The MSC will have complete operational control over LEC and assume responsibility
for management and training. Although the MSC will manage LEC, the government still
owns utility revenues. The new MSC will have payments tied to deliverables, including
bonuses and penalties based on performance. The Millennium Challenge Account–Liberia
(MCA-L) has also hired a contract managing consultant to monitor the MSC, including
reviewing the MSC’s monthly, quarterly, and annual reports. The contract managing
consultant will assess which key performance indicators are met, and why targets were not
met (Miller 2017).
3. Support to the EPA. MCC funding will cover placement of staff at the EPA with plans and
activities to strengthen institutional capacity. Overall, this subactivity aims to improve the
EPA’s capacity to manage its core functions, which include environmental licensing and
permitting, designing and implementing environmental and social impact assessments, and

LIBERIA ENERGY EVALUABILITY ASSESSMENT FINAL REPORT MATHEMATICA POLICY RESEARCH
5
creating resettlement action plans (MCC 2015). Note that MCC has not yet designed this
subactivity so we do not propose an evaluation in this report.
B. Overview of the theory of change
The Energy Project’s theory of change guides the evaluation of these activities. MCC first
developed a high-level program logic for the full Liberia Energy Project, and a more detailed
program logic for the Mt. Coffee Rehabilitation Activity. Mathematica subsequently developed
two separate models to include the full level of detail available to explain the four activities and
GSI investments. These models reflect the current understanding of project design. Figure II.1
illustrates the revised logic model for Activities 1 and 2.

LIBERIA ENERGY EVALUABILITY ASSESSMENT FINAL REPORT MATHEMATICA POLICY RESEARCH
6
Figure II.1. Theory of change for Activities 1 and 2 (Mathematica’s version)
Component is not a focus of the evaluation
Note: Dashed line indicates that component is not a focus of the evaluation.

LIBERIA ENERGY EVALUABILITY ASSESSMENT FINAL REPORT MATHEMATICA POLICY RESEARCH
7
This logic model demonstrates how Activities 1 and 2 separately, and in concert, will
theoretically lead to increased electricity generation and improved functionality of the energy
sector. The figure then shows how the activities’ short- and medium-term outcomes interact to
produce longer-term outcomes such as increased connections, increased consumption of quality
electricity, and reduced user costs. The logic model also shows how GSI plans are integrated into
the Capacity Building and Sector Reform Activity.
Several assumptions related to these linkages must hold true for the theory of change to be
realistic. The evaluability assessment discusses the legitimacy and relevancy of each assumption
(Miller et al. 2018). The evaluation design described in this report and the separate evaluation
design reports for Activities 3 and 4 will enable us to assess the accuracy of some of these
assumptions. For instance, the causal linkages in the logic model depend heavily on LEC having
sufficient staffing, skill, and administrative capacity to respond to users’ requests for
connections, and on customers trusting LEC. Mathematica’s evaluation will assess the extent to
which MCC’s investments in the MSC and LEC training activities result in improved
management and capacity at LEC.
C. Literature Review
Liberia lags behind many African countries in generating, transmitting, and distributing
electricity, ranking 176th of 186 countries on the World Bank’s Getting Electricity index, which
measures the ease and cost of connecting, reliability of supply, and transparency of the tariff
(World Bank 2017b). As a result, only 2 percent of Liberians has access to grid electricity
(U.S. Agency for International Development [USAID] 2016) and nearly 75 percent of firms
report owning or sharing a generator (World Bank 2017c). Public institutions also rely heavily
on alternative sources of power: a 2012 survey showed that the vast majority of public hospitals
and health centers relied on generators and/or solar off-grid systems for electricity, and another
40 percent lacked any form of electricity (Adair-Rohani et al. 2013). The per-kilowatt cost of
energy from generators is about 10 times higher than the tariff for grid electricity, at $3.96/kWh
(World Bank 2011).
We provide background on Liberia and reviewed evidence relevant to Compact activities
and anticipated outcomes to provide context for this evaluation. Following the overall structure
of the report, we discuss the literature related to
1. Liberia’s electricity grid;
2. Energy sector policy and regulatory reform;
3. End user grid connections, electricity consumption, and impacts for households, businesses,
and public institutions; and
4. Utility functioning.
We discuss gaps in the literature and how this evaluation will contribute rigorous evidence
to the evidence base on the implementation, performance and impacts of energy investments in
African countries.

LIBERIA ENERGY EVALUABILITY ASSESSMENT FINAL REPORT MATHEMATICA POLICY RESEARCH
8
1. Liberia’s electricity network, grid infrastructure interventions, outcomes,
and literature gaps
In this section, we describe the current situation of Liberia’s electricity network in order to
highlight the types of evidence that would inform implementation and set expectations for
outcomes. Next, we describe the collaborative nature of electricity investments in Liberia. We
describe the existing literature and highlight the evidence gaps.
First, Liberia’s electrical grid infrastructure is concentrated in the capital area and suffers
from frequent mechanical failures, having been built piecemeal through donor contributions
following the civil war. In the capital Monrovia, where only 7 percent of Liberians are connected
to grid electricity, the system is fragmented and fraught with mechanical and commercial
challenges. Consequently, the insufficient T&D infrastructure, as well as LEC’s low capacity to
connect customers, means that the majority of the 88 MW of electricity generated by MCHPP is
still not serving customers. The Liberia Energy Project aims to increase access to quality
electricity for households, firms, and the public sector, both improving the quality of electricity
for currently connected users and delivering quality electricity to an estimated 90,000 new
customers.
The Liberia project would benefit from an evidence base on how to efficiently build a
network in an urban setting in a post-conflict country with exceedingly low rates of connectivity.
We found evidence of successful power generation projects from Rwanda, Mali, Senegal,
Mauritania, and Uganda, however none of these countries began implementation with such low
levels of connectivity as in Liberia. Even in these more developed countries, a World Bank study
notes that many of these projects encountered implementation challenges including cost
overruns, project delays, and low human resource capacity to build and repair the infrastructure
(World Bank 2006; World Bank 2008).
Given the enormity of the task of electrifying Liberia, donor partners—in addition to
MCC—are each planning a range of T&D investments aimed at building and reconstructing
substations, installing transmission and distribution lines, feeders, and transformers (Norplan
Fichtner 2013; USAID 2016, WB 2018). New T&D grid infrastructure will be funded through
the African development Bank (AfDB), World Bank (WB), EIB, and KfW following a process
of legislative approval of financial agreements, tender design, contracts, procurement, and
implementation. These investments in Liberia’s grid infrastructure are necessary, but not
sufficient, to reach MCC’s short-, medium-, and long-term outcomes. We did not find
informative literature describing donor partners collaborating to implement electricity generation
and T&D projects in sub Saharan Africa, yet there is a need for evidence that guides
implementation and maximizes investment dollars and expected outcomes. Our proposed study
will help fill this evidence gap and build this literature to improve implementation in Liberia and
throughout developing countries where donor collaboration will be essential to meeting the goals
of electrifying Africa.
Reaching Compact goals also requires efforts to overcome the existing grid’s inferior
performance, which is characterized by frequent outages and unreliable electricity. The grid
requires better oversight, maintenance, and repair to improve its functionality. However, a major
challenge is that Monrovia’s limited grid network was not designed to support regular

LIBERIA ENERGY EVALUABILITY ASSESSMENT FINAL REPORT MATHEMATICA POLICY RESEARCH
9
maintenance and repairs. For example, the network does not allow ‘hot line’ maintenance or
repairs to be made without shutting down supply, because there is no network redundancy that
allows technicians to isolate and repair the fault area. Redundancy in electrical grids allows
power to be rerouted when outages occur so that repairs can be made without interrupting
service. The rehabilitation has always been in an emergency phase and lacked adequate planning
for redundancy. This limitation contributes to frequent and long outages, which is worsened by
several ongoing rehabilitation projects that require scheduled interruptions. We did not find
specific literature documenting lessons learned in building and repairing faulty T&D
infrastructure. While this knowledge likely exists in the engineering field, we did not find
information accessible to inform development partners so this is an important evidence gap. Our
proposed forthcoming evaluation will help fill this gap by documenting the successes,
challenges, and lessons learned in implementation as well as benchmarking periodic
improvements in grid functionality.
We did find studies providing evidence of projects that increased generation capacity and
reduced grid problems. For example, in Rwanda, a $44 million World Bank-funded increased
generation capacity from 41 MW to 75 MW in six years through construction of a new thermal
power plant (World Bank IEG 2012; World Bank 2010). The intervention successfully reduced
load shedding (planned outages) by 50 percent during peak hours at the start of the project to no
load shedding at all at its end. In Mali, the World Bank successfully installed additional power
generation capacity at the Manantali dam and reportedly eliminated all load shedding in the
affected region (World Bank 2006). However, in Uganda, the installation of additional
generation capacity at Lake Victoria was only partially completed due to low water levels, and
the installed capacity remained underutilized at the time of the evaluation (World Bank 2008).
LEC, Liberia’s government owned utility company is constrained in its ability to maintain
and repair existing infrastructure. Liberian stakeholders agree that LEC struggles to prevent and
respond to outages because of data limitations on the cause and location of the outages. These
frequent power outages present a serious challenge to electricity quality and reliability. Further,
LEC management explained that outages occur due to human errors and lack of personnel,
overloaded transformers, and infrastructure and network failures. As we will describe in the
utility section, human, financial, and mechanical resource shortages, and inadequate technical
capacity lead to longer outages and damaged infrastructure. Currently, LEC staff log generation
data hourly and send reports to management and other stakeholders on a monthly basis but this
data is not used to improve real-time operations. In addition, there is insufficient detail to inform
MCHPP of the problems that might causes mechanical failures and harm upstream hydropower
plant components or the downstream T&D network. At the level of transmission via substation,
T&D dispatcher data and substation data are collected on an hourly basis. Handwritten log books
are located in each of the four substations to produce reports but they do not provide sufficient
detail to locate problems or faults. Data has to be compared to historical information to
determine changes over time. We found limited documentation of lessons learned from utility
level interventions and rigorous evaluations of these investments. Again, our proposed
evaluation will help build this evidence base to guide Liberia and other countries as they work to
overcome the vast constraints to effective utility management and operations.
Another challenge to grid maintenance and improved electricity quality is the shortage of
T&D equipment, such as tools, vehicles, specialized trucks, and other equipment to maintain the

LIBERIA ENERGY EVALUABILITY ASSESSMENT FINAL REPORT MATHEMATICA POLICY RESEARCH
10
grid. With each donor funded energy project, Liberia inherits different types of equipment,
instruments, and even generators, but not the parts to maintain the systems. Currently, Liberia
has three different types of thermal power plants and equipment requiring different technical
knowledge to service and maintain. As an example, while some generators use steam for startup,
others use heating coils, each requiring different parts, tools, and training. Technicians must
determine the parts or repairs needed for the different stations. Liberia lacks spare parts for
maintenance for transformers and substation components so must rely on warranty or the defect
period for replacement parts. Frequently, LEC must wait four to six weeks to receive the parts
and fix system failures. During our kickoff trip discussions with LEC officials, managers
expressed an immediate need for mechanisms that would enable better grid maintenance. For
example, managers felt that a supervisory control and data acquisition system (SCADA), fault
finders, and data loggers would produce the information needed to improve grid operations. If
the utility had detailed information on the level of fault, whether it is an intermittent or
permanent problem, and location, they could quickly repair grid problems improving electricity
reliability and quality. LEC also reported requesting smart meters and a laboratory to repair
broken transformers. Overcoming these limitations and constraints will challenge implementers,
policymakers, and donors for years to come. Currently, decision makers are hampered by a lack
of evidence-based information documenting what works to overcome these problems so that the
utility company can effectively manage operations.
The proposed grid level study will contribute to building a foundation of learning on grid
level improvements and investments. Given the substantial contextual, environmental, and
technical challenges facing Liberia, high quality evidence on effective implementation and
outcomes and impacts will improve the likelihood that MCC’s and other donor partners’ and the
GoL’s investments will reach their goals.
2. Energy sector outcomes
a. Overview of Liberia’s energy sector
Liberia’s energy sector suffers from an ineffective and inadequate policy and regulatory
environment that lacks strategic and master planning, transparent regulations, and accountability.
Reforms have been slow to materialize due to the low institutional capacity and inadequate
investment in and management of existing infrastructure. Compounding these issues is the fact
that Liberia has one of highest tariffs in the world due to high operational costs, the high cost of
diesel fuel, low consumption of electricity, and excessive technical and non-technical losses.
b. Current policy reform activities
Liberia’s energy sector is comprised of the Ministry of Mines and Energy (MME) (formerly
the Ministry of Lands, Mines, and Energy), which is responsible for national energy policy and
master plans; LEC, which is responsible for generating, transmitting, and distributing electricity;
and the Rural and Renewable Energy Agency (RREA), which aims to provide electricity services
to rural areas, with an emphasis on using local renewable energy sources (Sandikie 2015).
Despite its policy oversight and fiscal responsibility, the MME has not yet played as significant a
role in the energy sector as expected, particularly given that key positions have not been filled
with experienced personnel over several years (Miller 2018). As a result, donors, rather than the
government (except in a few cases where an unrealistic plan has been proposed), have guided the
LIBERIA ENERGY EVALUABILITY ASSESSMENT FINAL REPORT MATHEMATICA POLICY RESEARCH
11
trajectory of the energy sector in recent years. Donor activities include installing generation
capacity, T&D investments, advocating for policy and legislation, developing trainings, and
commissioning sector studies.
Key developments in the energy sector in recent years include the establishment of a
National Energy Policy in May 2009 and the passage of the Electricity Law of Liberia in 2015.
The key features of the National Energy Policy are good governance and financial transparency;
private sector investment in energy supply; and development of an independent regulatory
commission, and an improved institutional and legal framework (Development & Training
Services, Inc. 2013). The key purpose of the Electricity Law was to create a legal and regulatory
framework for the sector. A major component was drafting the law to codify the LERC, which
was established in 2017 (Sandikie 2015). Unfortunately, we found little evidence describing how
energy laws lead to adequate implementation, financing, and improvements throughout the
energy sector in countries like Liberia.
Liberia’s 2015 National Energy Policy and the Rural Energy Strategy and Master Plan also
calls for facilitating private sector investment and enabling independent power producers (IPPs)
to generate electricity to meet consumer demand for power throughout Liberia (Sandikie 2015).
Liberia’s Electricity Law allows independent generation facilities to operate under the IPP model
with a Power Purchase Agreement and LERC approval (Liberia Ministry of Foreign Affairs
2015). In most countries, IPPs, in a transparent and competitive procurement process, sell power
to large industrial clients or a regional distribution company in charge of procurement outside the
national grid (RREA 2016). However, in Liberia, IPPs tend to be small-scale owners of
generators who sell power directly to customers. The persisting weaknesses across the sector,
including the lack of clarity regarding the roles of IPPs and other stakeholders—as well as
insufficient transparency, accountability, technical, performance, and security regulations and
standards—hampers the IPP model. Larger IPPs are not incentivized to join the energy market
and small scale IPPs are not regulated. An LERC review of this matter will start with the planned
Operator Census funded by MCC.
We found a thin literature on energy sector reform in African countries, particularly in the
case of a post-conflict country with such low capacity for policy making. The proposed
evaluations will begin to document implementation successes, challenges, and lessons learned as
well as measure performance and benchmark incremental changes over the course of the
evaluation project.
c. Literature on sector reform and independent regulation
The policy and sector reforms underway in Liberia are consistent with the prevailing
consensus in recent years that developing country governments should unbundle electricity
utilities, establish an independent regulator, and introduce competition and private sector
participation (Eberhard et al. 2016).
Liberia’s establishment of an independent regulator is consistent with a worldwide
movement in support of independent regulation. Since the 1990s, about 200 new infrastructure
regulators have been set up around the world (Eberhard et al. 2016). The key tenet of successful
regulation is independent decision making, with an emphasis on principles such as
accountability, transparency, public participation, and others (Brown et al. 2006).

LIBERIA ENERGY EVALUABILITY ASSESSMENT FINAL REPORT MATHEMATICA POLICY RESEARCH
12
The key tasks of the LERC include overseeing regulatory procedures; tariff regulation,
financial audits, budgets and funding; and oversight for technical regulations, quality of supply
and service standards, and technical audits. Note that as a fully independent regulatory agency,
the LERC has nominal oversight of the LEC. However, a key function of the LERC will be to set
tariffs with the goal of maintaining a financially viable utility company. This is challenging in
Liberia given ambitious goals to electrify the country, the current high and variable costs of
electricity, and LEC’s severe fiscal, materials, and human capacity limitations. Note that energy
costs vary by season. Staff from the MME estimated that the dry season generation with heavy
fuel (HFO) has a production cost of $0.49/kWh; while the wet/rainy season hydropower costs
$0.20/ kWh to produce. It is not clear how the LERC will balance the desire to keep tariffs low
with the financial demands of effectively operating the utility company across the seasons and
investing in grid expansion. LERC has encountered delays in its start-up process, which will also
delay its transition into a fully independent regulatory agency (Miller 2017).
Despite this important global shift in the structure of energy sectors, results have been mixed
(Gulen et al. nd; Stern and Cubbin 2005; Eberhard et al. 2016). In some cases, regulators have
lacked decision-making authority; in others, the regulators themselves have resisted further
change in the sector (Brown et al. 2006; Stern and Cubbin 2005). Given that the LERC has been
newly instated, with a new business plan, and newly appointed members, an independent and
publicly available evaluation should contribute to the Commission’s performance as an
accountable and transparent agency, and ultimately help Liberia achieve energy sector goals by
providing high quality data and information for decision making. As has been suggested in the
literature, we will assess regulator, and the combination of institutions, laws, and processes that
comprise the regulatory environment.
The proposed implementation and performance evaluations of LERC’s activities as an
independent regulator will provide key insights into each stage of development and
implementation of the Commission, as well as insights into the sustainability of LERC once
donor investments diminish.
3. End-user connections and impacts
This section reviews the literature on key end-user outcomes for this evaluation, including
connections, barriers to connecting, and impacts including time allocation, education, labor
market participation, and productivity. We consider impacts of new electricity connections and
improved quality of electricity for households, businesses, and public institutions, as well as the
potential for spillover effects.
a. End user connections
Barriers to connecting
As LEC and donors work to extend electricity lines throughout Greater Monrovia, demand
and electricity consumption are expected to increase. However, households, businesses, and
public institutions face a number of barriers to connecting to electricity, such as long wait times,
connection costs, limited capacity of the energy utility, and information shortages. We have also
heard serious concerns about mismanagement on the part of the interim management team (IMT)
as well as theft of materials which has exacerbated these problems.
LIBERIA ENERGY EVALUABILITY ASSESSMENT FINAL REPORT MATHEMATICA POLICY RESEARCH
13
Connection wait times and administrative processes
The World Bank (WB) estimates that it takes 482 days for a new business in Liberia to
obtain an electricity connection, about four times the regional average of 115 days (World Bank
2017b). This exceptionally long wait time is the result of LEC’s inability to process applications
quickly and connect new customers due to a lack of qualified personnel and a lack of equipment
(Miller et al. 2018). Currently, a backlog of approximately 5,000 applicants have paid the
connection fee, but are still waiting to be connected (Miller et al. 2018). These issues, as well as
poor quality electricity, have resulted in a low level of trust in the utility that dampens demand.
In fact, some large businesses have elected the high cost of generator use rather than connecting
to the grid, which they view as too unreliable (Ballah 2017).
Potential customers may also delay electrification because they do not understand billing or
administrative procedures. In Ethiopia, 41 percent of households cited administrative issues as
the primary reason for not connecting to the grid (Bernard and Torero 2009). In Tanzania, Miller
et al. (2015) found that households neither understood the connection process or timeline, nor
made financial plans to pay for household wiring or connection fees. At the same time,
respondents from health centers wanted grid connections, but reported that administrative
bureaucracy prevented connections (Miller et al. 2015).
High cost of connection fees
Connection fees can be prohibitively expensive for households even though the monthly
cost of grid electricity is actually lower than alternative fuel sources such as diesel-run generators
(World Bank 2011). Across Africa, households pay connection fees ranging from $30 (in Ghana)
to about $150 (in Benin, Cote d’Ivoire, and Uganda) to $300 or higher (in Kenya and Tanzania)
(Golumbeanu and Barnes 2013). In addition to this fee, households have significant up-front
payments related to the cost of wiring their dwellings (Chaplin et al. 2012; Miller et al. 2015). In
Liberia, LEC had changed its policy to spread the $55 connection fee over multiple months of
usage payments (Front Page Africa 2017) and then ultimately removed the connection fee
entirely. Even without the utility fee however, in a country where the median household income
is $781, the cost of wiring a home can impose a significant burden on poor households (Phelps
and Crabtree 2013). The upfront costs of connecting or wiring, even when spread out, can be
problematic compared with the low cost of batteries, candles, and kerosene, which can be
purchased on an as-needed basis. These challenges are not unique to households; small
businesses, health centers, and schools also report wiring and connection costs as a barrier to
connection (Sovacool 2014; Miller et al. 2015). Respondents from Tanzanian health centers
wanted grid connections, but reported that administrative bureaucracy and relying on the
government to allocate funds were a barrier to connecting. Further, headmasters at unconnected
schools explained that the costs of wiring, applying for electricity, and the monthly unit costs
were a barrier, particularly for schools that could not afford desks, books, and chalk. Several
unconnected schools were located too far from the new power lines to connect.
Rate of connections
The rate at which households, businesses, and public sector customers connect to electricity
has varied across African countries. Several studies find relatively rapid rates of connection in
LIBERIA ENERGY EVALUABILITY ASSESSMENT FINAL REPORT MATHEMATICA POLICY RESEARCH
14
the first few years after electrification, with a gradual slowing of new connections over time
(Barron and Torero 2016; World Bank 2008; Lenz et al. 2017). In two studies, the remaining
unconnected households could not afford the $100 connection fee (Lenz et al. 2017; World Bank
2008). There were slower connection rates in Kenya and Tanzania, where the connection fee was
$300 to $400 respectively. Similarly, in rural Kenya, only 10 percent of eligible households
connected five years after a community installed a transformer, a finding that the authors
attribute to a high connection fee that was unaffordable even for relatively well-off households
and businesses (Lee et al. 2016). Findings from Tanzania reveal similarly low rates of new
connections (Chaplin et al. 2017; Winther 2007). It is important to note that most of this
evidence focuses on rural areas, but urban households in the Liberian context could have
different barriers and facilitators to connecting. For example, in Liberia, the WB is facilitating
rapid connections with the use of ready boards, a single multi-socket outlet which is delivered to
an end user by the WB contractor, eliminating the need for building wiring or LEC
administrative processes. Ready boards are generally only used for residential customers given
the limited supply they provide.
There is little evidence on the time it takes businesses and public institutions to connect to
the grid. In rural villages in Ghana, Peters et al. (2011) found that only 34 percent of small scale
manufacturing businesses had connected to the grid three to seven years after village
electrification, whereas more than 80 percent of service sector businesses had connected.
Manufacturing firms included dressmakers, welders, and carpentry workshops while service
businesses included hairdressers, restaurants, and repair shops. The authors suggested that
service firms had more to gain from electricity (entertainment, refrigeration, and longer working
hours) than manufacturing firms, which used electricity primarily for lighting. In rural Kenya,
only about 10 percent of small businesses had connected to the grid five years after receiving
access (Lee et al. 2016). Although we were unable to find literature on the rate of new
connections among public institutions, it appears that they might not be able to connect quickly if
they are not located near transmission lines and if they rely on centralized government offices to
allocate funding for connections.
b. Electricity consumption
In low-income countries, average annual electricity consumption among electrified
households is 317 kWh per capita per year, indicating that electricity is used for limited
purposes. Many studies have documented that rural households use electricity primarily for
lighting (World Bank 2008; Energy Sector Management Assistance Program 2002; Bernard and
Torero 2009; Lenz et al. 2017). Households may also purchase televisions, but in the short-term,
they rarely rely on electricity for cooking or productive uses (Barron and Torero 2016; Bernard
2012; Bernard and Torero 2009; Lenz et al. 2017; Chaplin et al. 2017). Urban households are
more likely to own electric appliances than their rural counterparts, and they rely less heavily on
biofuels, but still have relatively low levels of electricity consumption (International Energy
Agency (IEA) 2014).
Household Impacts
Impacts on connected households. Households with existing connections can benefit from
improved electricity quality. One study in rural India found that households with improved

LIBERIA ENERGY EVALUABILITY ASSESSMENT FINAL REPORT MATHEMATICA POLICY RESEARCH
15
electricity reduced kerosene consumption and time spent collecting biomass fuel. However, these
households continued to rely on alternative energy sources given the imperfect electricity supply
(Samad and Zhang 2016). Another study in rural India found that better-quality electricity
(measured as fewer outages and more hours per day) led to an increase in households’
nonagricultural income over a 10-year period.
Impacts on newly connected households. Studies in Bangladesh, India, and Tanzania find
that boys and girls in electrified households studied one to two hours longer per week than
children in non-electrified households (Khandker et al. 2012a; Khandker et al. 2012b; Chaplin et
al. 2017), but in Tanzania, the increase in time spent watching television (about 73 minutes per
day) was much greater. Overall, the literature is mixed on whether electricity improved school
enrollment and completion (Khandker et al. 2012a; Khandker et al. 2013; Lenz et al. 2017). It is
not clear how electricity will impact education and television viewing in Liberian households
given the low levels of electrification and low rate of television ownership.
Adults in electrified households can benefit from spending less time collecting fuel (Grogran
and Sadanand 2013; Khandker et al. 2012b; Chaplin et al. 2017), but not all studies find impacts
on time allocation (Bernard and Torero 2015). Similarly, the literature does not provide a clear
consensus on productive electricity use. Several studies show that households with electricity
were no more likely to participate in an income-generating activity than unserved households
(Bernard and Torero 2009; Wamukonya and Davis 2001; Lenz et al. 2017). However, multiple
studies have indicated that electricity can lead to increased employment for women, but not for
men (Khandker et al. 2012b; Grogan and Sadanand 2013; Dinkelman 2011). A study in India
showed that electrification increased household per capita income and expenditures, but that the
impacts were greater for wealthier households than for low-income households. Other studies
have similarly found statistically significant impacts of grid electricity on income and
expenditures (Chakravorty et al. 2014; Khandker et al. 2012a; Khandker et al. 2013).
Impacts on businesses
Impacts on connected businesses. Overall, the evidence suggests that poor quality and
unreliable electricity hampers productivity, particularly for firms in electricity-intensive sectors,
such as large scale manufacturing (Adenikinju 2003; Arnold et al. 2008; Escribano et al. 2010).
Outages can negatively affect firms’ profits and expenditures (Hardy and McCasland 2017;
Adenikinju 2003) and small firms suffer the most from blackouts because they are less likely to
have a back-up generation source (Adenikinju 2003). Firms with generators face higher energy
costs because self-generation is considerably more expensive than grid electricity (Foster and
Steinbuks 2009; Akpan et al. 2013). Unstable electricity—characterized by overloads and
voltage drops—can damage electric machinery and equipment, imposing additional costs on
firms (Adenikinju 2003; Foster and Steinbuks 2009). In contrast, fewer power outages may
stimulate job creation, as documented in West Bengal (International Finance Corporation,
Development Impact Department 2012).
Impacts on newly connected businesses. A study conducted in Rwanda suggests that
businesses might benefit from access to electricity through (1) customer attraction from
increased entertainment options; (2) longer hours and improved safety from electric lighting;
(3) higher quality and new products and financial savings from electrical equipment; and (4) time
LIBERIA ENERGY EVALUABILITY ASSESSMENT FINAL REPORT MATHEMATICA POLICY RESEARCH
16
savings from improved lighting, equipment, and communication. Qualitative findings indicate
that electrification impacts were greater where there was a strong business environment and that
some sectors were more likely to connect and benefit than others (Lenz et al. 2017).
Despite the potential for cost savings and increased productivity, a few quantitative studies
have found no impact of a new electricity connection on firms’ profits. In a study of 274 micro-
manufacturers in Peters et al. (2011) found no evidence that electrification increased profits.
Similarly, a study of services and manufacturing microenterprises in peri-urban areas of Ghana
found no difference in working hours, labor inputs, or profits between connected and
unconnected firms (Peters et al. 2013). Although Grimm et al. (2013) found positive impacts of
electrification on the revenue of informal tailors in Burkina Faso’s capital city, they found no
positive impacts on businesses overall. It is possible that the marginal benefit of electricity over
generators or traditional fuel sources is too small to yield measurable impacts on profit. It is
possible that we find this scenario in Liberia as well given the frequent use of generators.
Impacts on public institutions
There is very little rigorous evidence regarding the impact of electrification on health centers
and schools, but some descriptive and qualitative studies provide valuable insights into how
public institutions can benefit from electrification. First, electricity might enable schools and
health centers to stay open longer, as documented at health centers in Kenya (World Bank 2008)
and Tanzania (Miller et al. 2015) and at schools in Rwanda (Lenz et al. 2017).
Electricity could also enable institutions to use new electrical equipment. In Rwanda, a
survey of rural health centers found that 100 percent of connected centers used electricity for
lighting, 79 percent used it for medical machinery, and 43 percent used it for administrative
purposes (Lenz et al. 2017). However, findings from a statistical analysis showed no differences
in appliance ownership based on health center connectivity, suggesting that unconnected centers
may operate equipment with alternative energy sources. Headmasters in Rwanda reported that
electricity improved the overall functioning of the school by facilitating computer usage, and
improved the quality of education by powering computer labs (Lenz et al. 2017). Other benefits
cited in these studies included improved ability to recruit skilled staff, reduced energy
expenditures, and improved safety and security (Miller 2015; Lenz et al. 2017).
In Liberia, we might see muted impacts among the public institutions that switch from
generator to grid electricity in Liberia unless the cost of operating a generator is significantly
more than grid costs. Anecdotally, Liberians report a wide range of generator costs. In some
cases, respondents may underestimate generator costs to bargain for a lower grid tariff. Further,
for unserved public institutions, we do not expect many health centers or schools to purchase
equipment in the short-term given the country’s financial situation, however they may benefit
from donor contributions or have equipment that could be used with a grid connection.
c. Spillover effects
Household electrification can have spillover effects in the surrounding community. Several
studies in Africa have shown that household electrification improved perceptions of safety
outside of the home (Chaplin et al. 2017; Bensch et al. 2013; Miller et al. 2015). In Rwanda,
Lenz et al. (2017) found that unconnected households in connected communities reduced their

LIBERIA ENERGY EVALUABILITY ASSESSMENT FINAL REPORT MATHEMATICA POLICY RESEARCH
17
use of traditional sources of lighting and their spending on batteries and kerosene, outcomes the
authors attributed to outdoor lighting installed by connected households in the same
neighborhood. In India, one study found economic spillovers from electrification: unconnected
households’ annual consumption growth rate increased by 0.8 percentage points due to residence
in an electrified village (Van de Walle et al. 2015). In Rwanda, unconnected households
benefitted from their neighbors’ electricity through reduced expenditures on mobile phone
charging (Lenz et al. 2017).
4. Utility–level outcomes
Countries throughout Sub-Saharan Africa have poor performing, state-owned utility
companies that are unable to provide access to affordable and reliable electricity to swaths of the
population (Eberhard et al. 2011). Further, utility companies often fail to adequately manage
operations and finances, maintain and invest in new infrastructure, limit technical losses, and
recover tariffs needed to cover operational costs (Kojima and Trimble 2016). In response,
African countries have implemented numerous reforms in order to strengthen the performance of
utility companies. For example, countries have enacted laws, encouraged private participation,
privatized utilities, and established regulatory bodies. West African countries such as Cameroon,
Gabon, Ghana, and Cote d’Ivoire are signing concession contracts with private firms, while the
Gambia, Guinea-Bissau, Togo have signed more limited management services contracts.
However a 2011 World Bank report notes that these contracts are not always successful and can
be “complex and contentious”. Although these contracts have some benefits, such as improving
revenue and reducing loss, the contracts are often unsustainable or had long-term effects on
policy and sector deficiencies (Eberhard et al. 2011). Critics of management contractors have
argued that MSCs have the freedom to make staffing and collection reforms that utility
companies could not make without facing a public backlash. Often governments have viewed
management contracts as undesirable obligations that are required to receive donor investments.
However, despite the criticisms, it is widely acknowledged that sustainable changes require
improved utility management as well as broader sector reforms.
Liberia has one of the weakest utility companies in the region and the Liberia Electricity
Corporation faces significant challenges in fulfilling its mission of improving access to reliable
and affordable electricity. As mentioned, LEC has inadequate resources, equipment, and tools to
maintain the country’s limited energy infrastructure, and is severely hampered by extremely high
non-technical losses (estimated at between 49 to 60 percent of losses) (ESBI, Management
Services Contract 2018, Bill Hakin, Manitoba Hydro Interational report comments). The deficits
are exacerbated by the complex nature of grid components. LEC is also hampered by limited
technical capacity, which is partly due to Liberia’s loss of professionals given the diaspora
caused by war and Ebola. Poor-quality education and training programs further limits the number
and capacity of new Liberian professionals entering the energy sector.
LEC’s persisting low capacity has undermined efforts to electrify Liberian households and
businesses. While customer demand for electricity is growing, LEC has been unable to reach
targets of electrifying 11,000 new connections per year. With the current customer backlog
(estimated at 5,000 applicants waiting for connections) peak load remains well below the
generation potential in the rainy season through the MCHPP rehabilitation. In addition, LEC is
unable to manage operations, including identifying and responding to outages. The utility lacks
LIBERIA ENERGY EVALUABILITY ASSESSMENT FINAL REPORT MATHEMATICA POLICY RESEARCH
18
real-time data needed to maintain and repair the network. Further, the LEC customer database is
plagued with problems and omissions including duplicate accounts and no customer
classification system. A third party vendor maintains the database of prepaid customers but the
data is fraught with inaccuracies. This combination of poor grid maintenance, inability to
connect new users and manage current users has resulted in very low customer satisfaction and
trust.
LEC was managed by Manitoba Hydro International (MHI) through a Management Services
Contract from 2010 to December 2016. However, MHI fell short of its performance and financial
targets and was hampered by competing donor priorities, donor and government delays, the
Ebola outbreak, and conflict with the GoL (MCC 2015). We found no adequate documentation
or literature describing the implementation and performance of MHI, which is unfortunate as it
would help energy sector stakeholders understand the strengths and weaknesses of the contract
and avoid mistakes in the new MSC. Nevertheless, we understand based on discussions that the
one year gap between when MHI’s MSC was completed (end December 2016) and the start of
the ESB MSC on 8 January saw a significant decline in LEC’s operational and financial
performance.
In 2017, MCC conducted a study to identify the best management option for LEC and
decided a second management services contractor was needed, with a concession being the long-
term goal of the government. Subsequently, with MCC funding, LEC contracted with ESB
International Engineering and Facility Management (ESBI) in January 2018 and ESBI assumed
all responsibility for LEC’s operations (GoL 2017). ESBI’s primary goals include:
1. Creating an operationally efficient and profitable utility that is financially viable.
2. Increasing capabilities of local staff.
3. Improving quality and reliability of electricity supply and customer service.
4. Increasing the customer base (GoL 2017).
The new MSC will have a three year contract with two optional years and payments tied to
deliverables, including bonuses and penalties based on performance. MCA-L has also hired a
contract managing consultant (CMC) to monitor the MSC, including reviewing the MSC’s
monthly, quarterly, and annual reports. The contract managing consultant will assess what key
performance indicators (KPIs) are met or not, and why targets were not met (Miller 2017). KPIs
will measure day-to-day technical, operational, and financial performance (Tallapragada et al.
2009) and include a range of indicators. Technical and operational capabilities are reflected in
compiled indicators scores of service restoration, customer service, informational technology
use, and others. These indicators will be central inputs when evaluating LEC’s functionality and
the MSC’s contribution to improving LEC’s operations.
It is important to note that there has been criticism of the MSC contract in the Liberian news
with the incoming administration questioning the previous administration’s contracts (Front Page
Africa 2018). MCA-Liberia has disputed the claims of a conflict of interest in the contract
negotiation (MCA-Liberia 2018). Stakeholders agree that the MSC must have government and
LEC support to carry out sustainable reforms and operational improvements. The proposed
implementation and performance evaluations will be able to track support, MSC operations, and

LIBERIA ENERGY EVALUABILITY ASSESSMENT FINAL REPORT MATHEMATICA POLICY RESEARCH
19
document the progress, strengths and weaknesses of the LEC with the management services
contract.
5. Contribution of the proposed evaluations to the literature
Overall, the forthcoming evaluations will help fill evidence gaps on energy investments and
interventions in countries that start with extremely limited infrastructure, intense energy poverty
and minimal connectivity, poor technical capacity, and a nascent regulatory framework. The
evaluations will answer priority implementation, performance and impact questions at the grid,
energy sector, end user, and utility level particularly in a poor, post-war urban and peri-urban
location. We will conduct complementary quantitative and qualitative analyses custom designed
to measure a range of outcomes over the course and post-Compact. The evaluations require new
data collection and sophisticated analyses of administrative data. Combined, the evaluations will
generate valuable evidence and information that is not available through any other source.

This page has been left blank for double-sided copying.
LIBERIA ENERGY EVALUABILITY ASSESSMENT FINAL REPORT MATHEMATICA POLICY RESEARCH
21
III. OVERVIEW OF EVALUATION DESIGN
In this chapter, we provide an overview of the evaluation design. We propose study designs
that enable us to answer questions about MCC’s energy sector investments across multiple
levels, based on interventions in Activities 1 and 2 of the Compact. We also describe MCC’s
cost-benefit analysis (CBA) model and beneficiary analysis and present our plans for updating
the CBA.
To guide our work, we will develop a conceptual map that structures and illustrates the
scope of the various Compact activities and the relationships between activities, as well as their
respective research questions, the evaluation studies, expected outcomes, data sources, and
analyses. The conceptual map will allow us to organize these components in a comprehensive
yet parsimonious approach so that we maximize the value of each data collection opportunity
without repeating efforts. This level of organization and coordination is important, given that the
Liberia Compact includes numerous activities and sub-activities with different implementation
timelines and expected results, as well as multiple levels of outcomes and types of evaluation
studies. Moreover, the Liberia Compact can only be fully achieved through donor partner
investments and implementation requiring consideration of those projects’ plans, progress, and
achievements. Our conceptual map will guide how we approach and implement each study,
including how we develop protocols for document reviews and qualitative interviews, who we
interview and with whom we coordinate, when we schedule activities, and how we organize data
and findings.
We present a high-level overview of the types of evaluations according to the activities and
levels of questions in Table III.1. To expand this table into a conceptual map, we will incorporate
the components of measureable outcomes and concepts, data sources, and project timing to
identify unique aspects of each study and areas of overlap. We present an exemplary conceptual
map and key in Figure III.1.
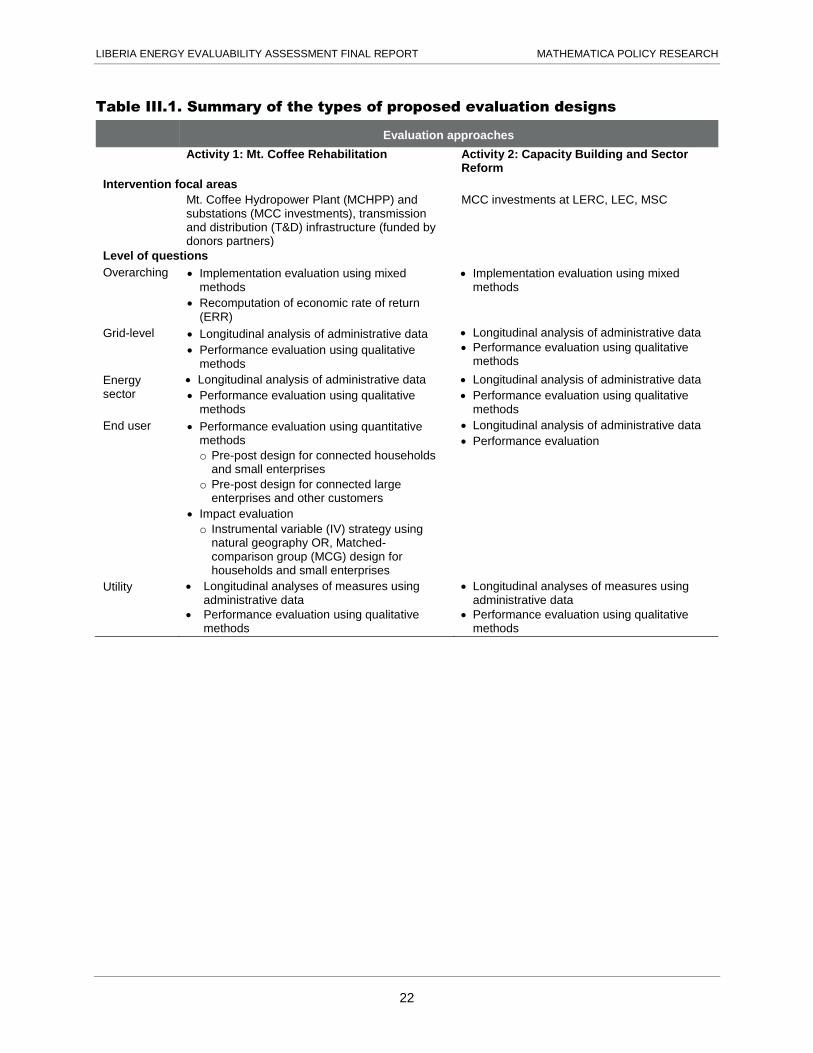
LIBERIA ENERGY EVALUABILITY ASSESSMENT FINAL REPORT MATHEMATICA POLICY RESEARCH
22
Table III.1. Summary of the types of proposed evaluation designs
Evaluation approaches
Activity 1: Mt. Coffee Rehabilitation Activity 2: Capacity Building and Sector Reform
Intervention focal areas
Mt. Coffee Hydropower Plant (MCHPP) and substations (MCC investments), transmission and distribution (T&D) infrastructure (funded by donors partners)
MCC investments at LERC, LEC, MSC
Level of questions
Overarching Implementation evaluation using mixed methods
Recomputation of economic rate of return (ERR)
Implementation evaluation using mixed methods
Grid-level Longitudinal analysis of administrative data
Performance evaluation using qualitative methods
Longitudinal analysis of administrative data
Performance evaluation using qualitative methods
Energy sector
Longitudinal analysis of administrative data
Performance evaluation using qualitative methods
Longitudinal analysis of administrative data
Performance evaluation using qualitative methods
End user Performance evaluation using quantitative methods
o Pre-post design for connected households and small enterprises
o Pre-post design for connected large enterprises and other customers
Impact evaluation
o Instrumental variable (IV) strategy using natural geography OR, Matched-comparison group (MCG) design for households and small enterprises
Longitudinal analysis of administrative data
Performance evaluation
Utility Longitudinal analyses of measures using administrative data
Performance evaluation using qualitative methods
Longitudinal analyses of measures using administrative data
Performance evaluation using qualitative methods
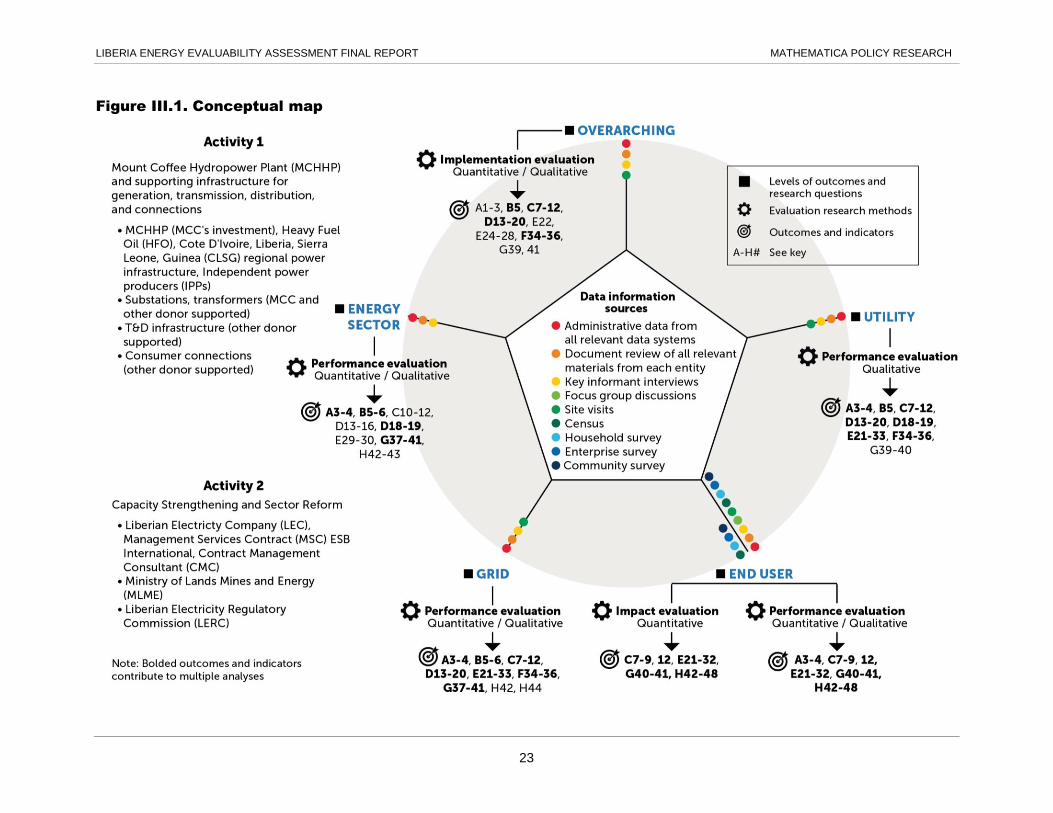
LIBERIA ENERGY EVALUABILITY ASSESSMENT FINAL REPORT MATHEMATICA POLICY RESEARCH
23
Figure III.1. Conceptual map

LIBERIA ENERGY EVALUABILITY ASSESSMENT FINAL REPORT MATHEMATICA POLICY RESEARCH
24
Figure III.2. Indicator and outcome key to the conceptual map

LIBERIA ENERGY EVALUABILITY ASSESSMENT FINAL REPORT MATHEMATICA POLICY RESEARCH
25
A. Evaluation questions and designs
To organize this report, we present research questions for Activities 1 and 2 using MCC’s
original vision of outcomes at the various levels of overarching, grid, end user, energy sector,
and utility. This vision frames the types of outcomes expected from MCC investments in both
infrastructure and capacity strengthening, as well as sector reform across different agencies. Note
that prior to writing this report, we reviewed the evaluation questions in the EA report and
prioritized questions that are directly linked to the program logic (Miller et al. 2018).
We propose a comprehensive mixed methods approach to meet MCC’s evaluation
objectives while balancing rigor with contextual realities and local stakeholders’ needs. First, we
describe the implementation analysis to answer overarching questions about the implementation
of Activities 1 and 2. Second, we describe the performance evaluation of Activities 1 and 2 to
answer research questions and assess outcomes at the level of the grid, energy sector, end user,
and utility using quantitative and qualitative data. Third, we describe the proposed impact and
quantitative evaluations to answer questions about end-user outcomes. Findings from these
various studies will be integrated and triangulated with data from other analyses to provide
robust evidence for each outcome.

This page has been left blank for double-sided copying.
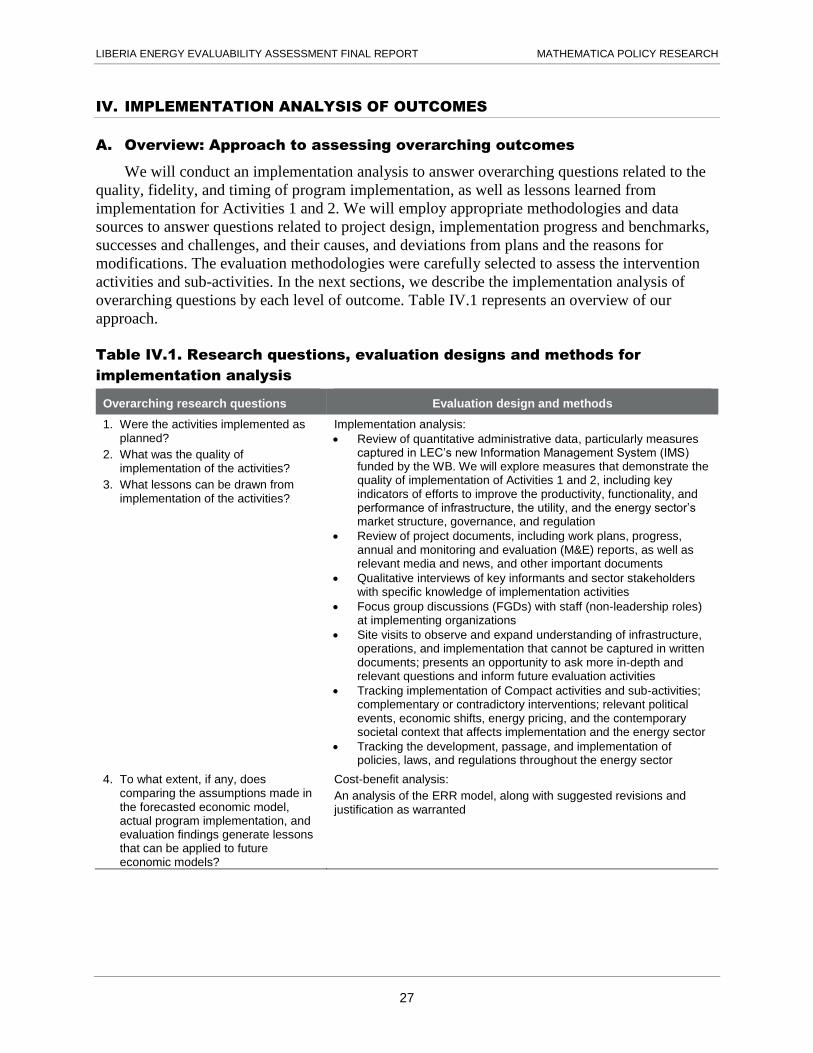
LIBERIA ENERGY EVALUABILITY ASSESSMENT FINAL REPORT MATHEMATICA POLICY RESEARCH
27
IV. IMPLEMENTATION ANALYSIS OF OUTCOMES
A. Overview: Approach to assessing overarching outcomes
We will conduct an implementation analysis to answer overarching questions related to the
quality, fidelity, and timing of program implementation, as well as lessons learned from
implementation for Activities 1 and 2. We will employ appropriate methodologies and data
sources to answer questions related to project design, implementation progress and benchmarks,
successes and challenges, and their causes, and deviations from plans and the reasons for
modifications. The evaluation methodologies were carefully selected to assess the intervention
activities and sub-activities. In the next sections, we describe the implementation analysis of
overarching questions by each level of outcome. Table IV.1 represents an overview of our
approach.
Table IV.1. Research questions, evaluation designs and methods for
implementation analysis
Overarching research questions Evaluation design and methods
1. Were the activities implemented as planned?
2. What was the quality of implementation of the activities?
3. What lessons can be drawn from implementation of the activities?
Implementation analysis:
Review of quantitative administrative data, particularly measures captured in LEC’s new Information Management System (IMS) funded by the WB. We will explore measures that demonstrate the quality of implementation of Activities 1 and 2, including key indicators of efforts to improve the productivity, functionality, and performance of infrastructure, the utility, and the energy sector’s market structure, governance, and regulation
Review of project documents, including work plans, progress, annual and monitoring and evaluation (M&E) reports, as well as relevant media and news, and other important documents
Qualitative interviews of key informants and sector stakeholders with specific knowledge of implementation activities
Focus group discussions (FGDs) with staff (non-leadership roles) at implementing organizations
Site visits to observe and expand understanding of infrastructure, operations, and implementation that cannot be captured in written documents; presents an opportunity to ask more in-depth and relevant questions and inform future evaluation activities
Tracking implementation of Compact activities and sub-activities; complementary or contradictory interventions; relevant political events, economic shifts, energy pricing, and the contemporary societal context that affects implementation and the energy sector
Tracking the development, passage, and implementation of policies, laws, and regulations throughout the energy sector
4. To what extent, if any, does comparing the assumptions made in the forecasted economic model, actual program implementation, and evaluation findings generate lessons that can be applied to future economic models?
Cost-benefit analysis:
An analysis of the ERR model, along with suggested revisions and justification as warranted
LIBERIA ENERGY EVALUABILITY ASSESSMENT FINAL REPORT MATHEMATICA POLICY RESEARCH
28
B. Methods, sample, and data sources
The implementation analysis will make use of multiple methods. We will select project
documentation, interview respondents, locations of site visits, and relevant policies, laws, and
regulations to ensure that we employ each methodology robustly, maximizing our ability to fully
answer the research questions. For all approaches, the methodology and data sources are
carefully selected to inform the evaluation and answer the research questions efficiently and
comprehensively. The approach is designed to yield an understanding of processes and
mechanisms in action, identify persisting questions or critical areas where further exploration is
warranted to capture implementation successes and failures, and provide timely
recommendations and insights. Next, we describe the methods, sample, and data sources in more
detail.
First, we will draw on LEC’s available administrative data for a longitudinal analysis of
repeated quantitative measures (see Section VI.B for a description of data collection and
analyses). The MSC maintains some administrative data but is working with a contractor to build
an information management system (IMS) funded by the WB. This database will contain
modules on accounting, incident and outage management, customer connections and staffing.
Data on power generation is available from the MCHPP SCADA system, while grid data, at least
at the level of substations, will come from the WB funded SCADA system. Tracking manually
collected existing data, progress on the development of digital data collection systems and the
digitized measures are critical to the implementation analysis because they reveal
implementation progress or delays, as well as the key outcomes of electricity generation,
transmission, demand and consumption, technical capacity and losses, time to repairs, the
duration and frequency of outages, and other measures. We acknowledge that data systems are
lacking and flawed, however, throughout the implementation and performance evaluations we
aim to identify gaps, use the data available, suggest how to fill gaps, and build on the data as
investments are made and new sources become available. We will highlight data weaknesses
given its importance to LEC's success as a utility. We will monitor this closely throughout the
evaluation.
The document review will entail assessing materials such as project work plans; progress,
annual, and M&E reports; timelines and schedules; and other relevant details to gain a full
understanding of the design, implementation, and progress of each Compact activity as it
evolves. First, we will collect documentation on the rehabilitation and construction of MCC
funded MCHPP and transmission infrastructure as well as the extended transmission and
distribution network funded by donor partners. This document review will allow us to assess
implementation progress and quality related to increasing generation and T&D capacity. We
recognize that MCC’s investments focus on generation; however, end-user outcomes are
contingent upon donor partners’ T&D efforts. Reductions, changes, or delays in donor partners’
T&D investments could undermine the Compact’s success. Next, we will collect documentation
of efforts by ESB International, the Management Services Contractor at LEC, to assess LEC’s
improved capacity for managing the utility. We will explore documentation and explanations of
the utility’s evolving capacity such as LEC’s technical and financial efficiency, customer
coverage and satisfaction, and indicators of staffing retention, technical capacity, and
productivity. Finally, we will collect documentation related to the establishment and activities of
LERC to assess progress within the energy sector’s legal, economic, and technical regulations.
LIBERIA ENERGY EVALUABILITY ASSESSMENT FINAL REPORT MATHEMATICA POLICY RESEARCH
29
We will review and analyze emerging and adopted regulations as well as energy sector policies
and laws. We will also trace the time and involvement of various actors along the route of
introducing, revising, adopting, and implementing policies, laws, and regulations. We will map
these elements to Compact activities and MCC and MCA’s energy sector engagement.
We will conduct interviews with key informants (experts with specific information and
knowledge of energy sector activities) and stakeholders who are in positions of interest, and
conduct focus groups to address research questions related to implementation fidelity, quality,
timing, and tasks, as well as lessons learned. We have already initiated interactions with key
stakeholders and maintain a list of organizations and actors relevant to the proposed evaluations.
We will continue to work with MCC, MCA-Liberia, LEC, and our local consultant to develop a
list of relevant staff, contractors, donors, experts, and partners to interview. We anticipate
interviewing representatives from MCHPP, MME, ESB International, the Contract Management
Consultant (CMC), LEC, LERC, the African Development Bank (AfDB), EIB, KfW, the
Norwegian Agency for Development Cooperation (NORAD), Power Africa, and the World
Bank. We will keep abreast of new entries and transitions to ensure that we have an up-to-date
understanding of the landscape and key stakeholders over the course of the project.
We will conduct site visits to observe MCC and donor partner investments in new and
rehabilitated infrastructure as well as LEC operations. Site visits will expand our understanding
of on-site operations that cannot be captured in written documentation and provide the
opportunity to ask more in-depth questions. Additionally, site visits will help us connect project
operations to outcomes, extend our understanding of the wider energy sector, and inform future
rounds of data collection. We envision observing operations at LEC, various substations and
MCHPP, and if possible, the LERC’s offices. During observations, we will ask the hosts of our
site visits to walk us through key processes that have been affected by the Compact investments
and gather evidence of procedural changes. We will schedule site visits to coincide with key
informant interviews.
Using all of the above inputs, we will conduct a timeline analysis to track the
implementation of Compact activities and sub-activities; the implementation of complementary
or contradictory interventions; and highly relevant political events, economic shifts, energy
pricing, and the contemporary societal context in Liberia and the broader region that affect the
energy sector and implementation of the Compact. We will inform the timeline analysis through
regular communication with key stakeholders, document sharing, news analysis, and qualitative
activities. These outcomes are expected to be achieved over the life of the Compact; therefore,
we expect to collect and review implementation plans, progress reports, and other documents on
a regular basis throughout the duration of the evaluation. Table IV.2 represents an overview of
our approach to this task.
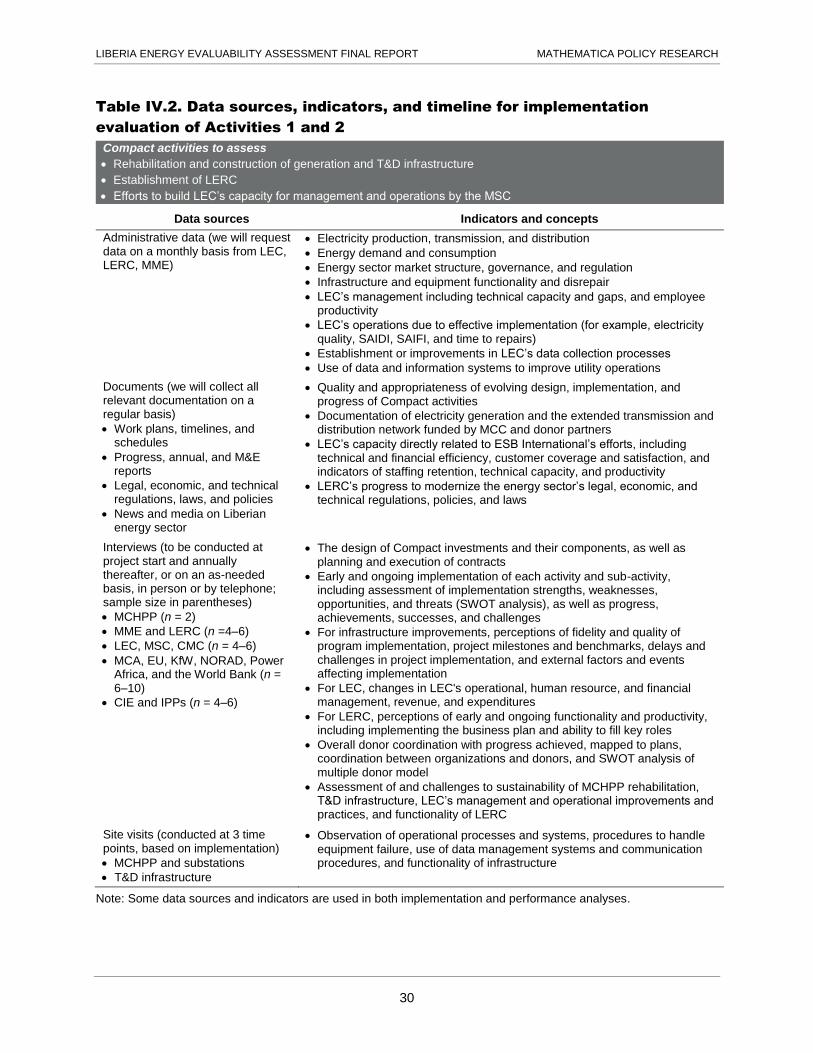
LIBERIA ENERGY EVALUABILITY ASSESSMENT FINAL REPORT MATHEMATICA POLICY RESEARCH
30
Table IV.2. Data sources, indicators, and timeline for implementation
evaluation of Activities 1 and 2
Compact activities to assess
Rehabilitation and construction of generation and T&D infrastructure
Establishment of LERC
Efforts to build LEC’s capacity for management and operations by the MSC
Data sources Indicators and concepts
Administrative data (we will request data on a monthly basis from LEC, LERC, MME)
Electricity production, transmission, and distribution
Energy demand and consumption
Energy sector market structure, governance, and regulation
Infrastructure and equipment functionality and disrepair
LEC’s management including technical capacity and gaps, and employee productivity
LEC’s operations due to effective implementation (for example, electricity quality, SAIDI, SAIFI, and time to repairs)
Establishment or improvements in LEC’s data collection processes
Use of data and information systems to improve utility operations
Documents (we will collect all relevant documentation on a regular basis)
Work plans, timelines, and schedules
Progress, annual, and M&E reports
Legal, economic, and technical regulations, laws, and policies
News and media on Liberian energy sector
Quality and appropriateness of evolving design, implementation, and progress of Compact activities
Documentation of electricity generation and the extended transmission and distribution network funded by MCC and donor partners
LEC’s capacity directly related to ESB International’s efforts, including technical and financial efficiency, customer coverage and satisfaction, and indicators of staffing retention, technical capacity, and productivity
LERC’s progress to modernize the energy sector’s legal, economic, and technical regulations, policies, and laws
Interviews (to be conducted at project start and annually thereafter, or on an as-needed basis, in person or by telephone; sample size in parentheses)
MCHPP (n = 2)
MME and LERC (n =4–6)
LEC, MSC, CMC (n = 4–6)
MCA, EU, KfW, NORAD, Power Africa, and the World Bank (n = 6–10)
CIE and IPPs (n = 4–6)
The design of Compact investments and their components, as well as planning and execution of contracts
Early and ongoing implementation of each activity and sub-activity, including assessment of implementation strengths, weaknesses, opportunities, and threats (SWOT analysis), as well as progress, achievements, successes, and challenges
For infrastructure improvements, perceptions of fidelity and quality of program implementation, project milestones and benchmarks, delays and challenges in project implementation, and external factors and events affecting implementation
For LEC, changes in LEC's operational, human resource, and financial management, revenue, and expenditures
For LERC, perceptions of early and ongoing functionality and productivity, including implementing the business plan and ability to fill key roles
Overall donor coordination with progress achieved, mapped to plans, coordination between organizations and donors, and SWOT analysis of multiple donor model
Assessment of and challenges to sustainability of MCHPP rehabilitation, T&D infrastructure, LEC’s management and operational improvements and practices, and functionality of LERC
Site visits (conducted at 3 time points, based on implementation)
MCHPP and substations
T&D infrastructure
Observation of operational processes and systems, procedures to handle equipment failure, use of data management systems and communication procedures, and functionality of infrastructure
Note: Some data sources and indicators are used in both implementation and performance analyses.
LIBERIA ENERGY EVALUABILITY ASSESSMENT FINAL REPORT MATHEMATICA POLICY RESEARCH
31
V. PERFORMANCE EVALUATION TO MEASURE GRID, ENERGY SECTOR,
END-USER, AND UTILITY-LEVEL OUTCOMES
We will use performance evaluation methods to answer prioritized research questions that
focus on understanding project achievements; estimating the contribution of Compact activities
to changes in grid, energy, end-user, and utility level outcomes; and providing critical insights
into the strengths and weaknesses of each component. We describe evaluation methods that will
allow us to document outcomes and answer MCC’s questions related to Activity 1, the
rehabilitation and construction of energy infrastructure; and Activity 2: (a) LERC’s efforts to
improve legal, economic, and technical regulations that govern the energy sector, and (b) the
MSC’s success in improving LEC’s management capacity. Note that we are not proposing to
evaluate capacity strengthening activities at EPA, given that this project is still in development.
The performance evaluation will follow three basic principles. All methods will be grounded
in the program logic and conceptual framework and feature ongoing, iterative data collection that
reflects program implementation, as opposed to a limited schedule of traditional data collection
cycles that can miss key events, processes, and milestones. The performance evaluation will
entail aggregating and synthesizing findings from qualitative and quantitative data, as well as key
findings from implementation and impact analyses of Activities 1 and 2 to understand program
outcomes. Performance evaluation approaches will include integrating data from a longitudinal
assessment of repeated measures, document review, qualitative interviews, focus group
discussions, and tracking of sector reform activities. We will interpret results from impact
evaluations and longitudinal studies alongside qualitative analyses to help contextualize and
explain the combined results in a manner that deepens insights into complex processes. This
approach expands learning from individual studies so their value is more than the sum of the
discrete parts because we explore the evolution of systems and activities, in which there are
many actors and processes interacting. We will identify trends and gaps across studies and
processes to pinpoint key learning.
Note that the timing of project outcomes are expected to be realized at various stages
throughout the life of the Compact and beyond; therefore, we expect to conduct activities on a
regular or as-needed basis throughout the evaluation’s duration. We explain this approach, which
closely aligns with project activities and the expected timing of outcomes, in further detail in
Section VI.B.
A. Grid level outcomes
1. Approach to measuring grid-level outcomes
At the grid level, we will assess the prioritized research questions using a mix of quantitative
and qualitative methods, as summarized in Table V.1. We will draw on a number of
methodologies and data sources to answer questions on the extent to which electricity generation,
has improved grid functionality and increased the reliability and voltage stability of the
electricity supply. We will also assess the extent to which energy sector reform activities have
improved LEC’s grid operations and maintenance directly related to electricity generation and
T&D. Further, we will investigate whether and how electricity regulation, policy formulation,
and monitoring activities have improved grid performance. In the next section, we describe the

LIBERIA ENERGY EVALUABILITY ASSESSMENT FINAL REPORT MATHEMATICA POLICY RESEARCH
32
performance analysis of grid-level outcomes that facilitate or undermine improved electricity
generation, transmission, and distribution.
Table V.1. Research questions, evaluation designs, and methods for
evaluation of grid-level outcomes
Grid-level research questions and
outcomes Evaluation design, methods, and key indicators
1. To what extent, if any, has increased electricity generation contributed to increased reliability of Liberia’s electricity supply, such as a reduction in planned and unplanned outages and improved voltage stability?
2. To what extent has capacity strengthening and sector reform improved LEC’s operations and maintenance of the grid, so that increased generation leads to reduced outages and voltage stability? (Revised by MPR.)
3. To what extent, if any, have energy sector reform activities contributed to improvements in electricity regulation, policy formulation, and monitoring? How sustainable are these improvements?
Performance evaluation in which we integrate and triangulate data from multiple sources: Note that analyses from the document and energy sector policy review, and qualitative interviews will be mapped to repeated measures of indicators of power production, T&D, and consumption to fully understand processes and mechanisms driving outcomes.
Longitudinal analyses of repeated quantitative measures to assess indicators such as electricity generation, transmission, distribution, load factor, power availability, voltage stability and outages, consumption, number of customers, un-served demand, peak demand shortage, and transformer and overhead line failure rates
Review of documents and reports, as well as relevant media and news, that provide insights into (1) grid-level changes and (2) LEC’s and the MSC’s operations related to grid operations and maintenance
Qualitative key informant and stakeholder interviews, during which we will pose questions focused on a SWOT analysis of capacity strengthening and sector reform activities that facilitate or inhibit grid improvements, operations, and maintenance
Review of energy sector policies, laws, and regulations, and other evidence of activities affecting grid improvements
2. Methods, sample, outcomes, and data sources
The grid-level analysis will utilize the methods described below. We will use the conceptual
mapping of studies and their components to ensure that we efficiently assess outcomes across
evaluation activities. Qualitative data collection and analyses will be informed by the
longitudinal analysis of quantitative measures of power production, T&D, and consumption.
Next, we describe the methods, sample, and data sources in more detail.
We plan to conduct a longitudinal analyses of repeated quantitative measures using
LEC’s administrative data to assess key indicators of electricity generation, transmission,
distribution, reliability, quality, consumption, and losses. A trend analysis, combined with
findings from stakeholder interviews and other qualitative sources, will allow us to better
understand the effect of the Compact activities, and other donors’ investments on these
outcomes. We will request data on a quarterly basis from LEC, MSC, and MCHPP. We will
specify all data and the level of data required (grid, substation, transformer, and so on) as well as
the appropriate unit of time (day, week, or month). As mentioned, we are cautious about the
current state of administrative data, which must serve as a baseline in the trend analysis.
However we will continue to assess the accuracy of the data, identify and highlight gaps, and
incorporate additional sources of information as available. Note that we aim to subcontract Tetra
Tech in order to help improve the quality and accessibility of administrative data. Next, we
describe the short-term outcomes of the MCC-funded activities, or changes that would be
expected to materialize within one to two years of the completion of infrastructure
improvements. Key outcomes are as follows:
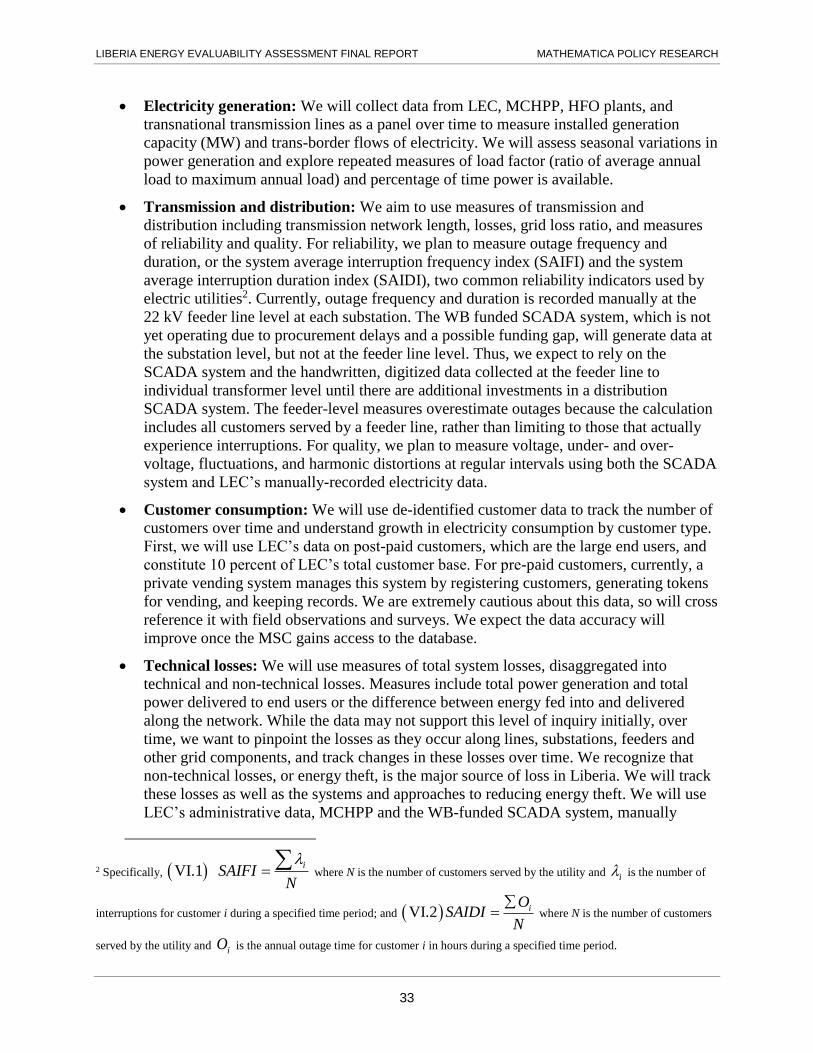
LIBERIA ENERGY EVALUABILITY ASSESSMENT FINAL REPORT MATHEMATICA POLICY RESEARCH
33
Electricity generation: We will collect data from LEC, MCHPP, HFO plants, and
transnational transmission lines as a panel over time to measure installed generation
capacity (MW) and trans-border flows of electricity. We will assess seasonal variations in
power generation and explore repeated measures of load factor (ratio of average annual
load to maximum annual load) and percentage of time power is available.
Transmission and distribution: We aim to use measures of transmission and
distribution including transmission network length, losses, grid loss ratio, and measures
of reliability and quality. For reliability, we plan to measure outage frequency and
duration, or the system average interruption frequency index (SAIFI) and the system
average interruption duration index (SAIDI), two common reliability indicators used by
electric utilities2. Currently, outage frequency and duration is recorded manually at the
22 kV feeder line level at each substation. The WB funded SCADA system, which is not
yet operating due to procurement delays and a possible funding gap, will generate data at
the substation level, but not at the feeder line level. Thus, we expect to rely on the
SCADA system and the handwritten, digitized data collected at the feeder line to
individual transformer level until there are additional investments in a distribution
SCADA system. The feeder-level measures overestimate outages because the calculation
includes all customers served by a feeder line, rather than limiting to those that actually
experience interruptions. For quality, we plan to measure voltage, under- and over-
voltage, fluctuations, and harmonic distortions at regular intervals using both the SCADA
system and LEC’s manually-recorded electricity data.
Customer consumption: We will use de-identified customer data to track the number of
customers over time and understand growth in electricity consumption by customer type.
First, we will use LEC’s data on post-paid customers, which are the large end users, and
constitute 10 percent of LEC’s total customer base. For pre-paid customers, currently, a
private vending system manages this system by registering customers, generating tokens
for vending, and keeping records. We are extremely cautious about this data, so will cross
reference it with field observations and surveys. We expect the data accuracy will
improve once the MSC gains access to the database.
Technical losses: We will use measures of total system losses, disaggregated into
technical and non-technical losses. Measures include total power generation and total
power delivered to end users or the difference between energy fed into and delivered
along the network. While the data may not support this level of inquiry initially, over
time, we want to pinpoint the losses as they occur along lines, substations, feeders and
other grid components, and track changes in these losses over time. We recognize that
non-technical losses, or energy theft, is the major source of loss in Liberia. We will track
these losses as well as the systems and approaches to reducing energy theft. We will use
LEC’s administrative data, MCHPP and the WB-funded SCADA system, manually
2 Specifically, VI.1 i
SAIFIN
where N is the number of customers served by the utility and i is the number of
interruptions for customer i during a specified time period; and VI.2 iOSAIDI
N
where N is the number of customers
served by the utility and iO is the annual outage time for customer i in hours during a specified time period.

LIBERIA ENERGY EVALUABILITY ASSESSMENT FINAL REPORT MATHEMATICA POLICY RESEARCH
34
entered data, and field observations to track each of these losses over time, and the
systems used to measure these losses.
Nighttime lights: We will assess the feasibility of using nighttime lights data to measure
electricity generation and reliability. It may be possible to compare baseline and follow
up data (prior to and after MCHPP rehabilitation and the use of each turbine) to estimate
the full impact of the MCHPP rehabilitation on the grid. By observing lit communities at
regular intervals and correlating this measure with the administrative network supply
data, we will have a composite longitudinal measure of the regular availability of power
end users over the project life. We may be able to create a longitudinal visual of how
Monrovia is “lighting up” over the course of the Compact and T&D investments. We will
collect this data from the National Oceanic and Atmospheric Administration’s Visible
Infrared Imaging Radiometer Suite sensor. The sensor provides daily luminosity data
(data on nighttime light use) at a resolution of 750 meters, typically on a one-month lag.
Building on our document review for the implementation analysis, we will review reports,
media, and other materials that provide insights into (1) grid-level changes and (2) LEC’s
operations and the MSC’s activities at LEC (which will be mapped to repeated measures of
voltage stability and outages). We will seek reports from LEC, the MSC, the MME, LERC,
MCHPP, and donor partners to extract relevant information. We will also seek reports to keep
abreast of energy sources needed to meet demand during Liberia’s dry season, including from
heavy fuel oil (HFO) plants and the Cote d’Ivoire, Liberia, Sierra Leone, and Guinea (CLSG)
transmission line, which is expected to help meet Liberia’s dry season energy demand. This
additional power source will be needed to meet the expected growth in demand once new
customers throughout Greater Monrovia are connected to the grid. We expect that with the MSC,
in place, LEC should generate data and reports that track key indicators. We will track the
development, passing, and implementation of policies, laws, and regulations throughout the
energy sector and map these changes to repeated measures of voltage stability and outages. We
will seek guidance from key informants and experts to properly assess the contribution of these
activities to grid-level changes.
We will conduct qualitative key informant and stakeholder interviews, posing questions
focused on understanding electricity production, T&D, and consumption. We will also conduct a
SWOT analysis of capacity strengthening and sector reform activities that facilitate or inhibit
grid improvements. We envision interviewing respondents from LEC, ESB International, and
MCA, and representatives from MCHPP, MME, LERC, the AfDB, the EU, KfW, NORAD,
Power Africa, and the World Bank. Again, we will ensure that we have an up-to-date
understanding of the landscape and key stakeholders over the course of the project. Table V.2
summarizes details related to this task.

LIBERIA ENERGY EVALUABILITY ASSESSMENT FINAL REPORT MATHEMATICA POLICY RESEARCH
35
Table V.2. Performance evaluation data sources and outcomes
Compact activities to assess
Rehabilitation and construction of generation and T&D infrastructure
Establishment of LERC
Efforts to build LEC’s capacity for management and operations by the MSC
Data source/
method of collection Grid outcomes Energy sector outcomes End-user outcomes Utility outcomes
Administrative data (we will request data on a monthly basis from LEC, LERC, MME, as described in Section VI.B
Specifically, we will draw on the MCHPP SCADA, the WB funded SCADA, the MSC’s IMS, donor-funded studies, and consultants’ reports
MCHPP o Electricity generation /
production o Load factor o Power availability
LEC/SCADA o Transmission including
substation capacity, length of transmission lines
o Grid loss ratio o Distribution functionality,
quality and reliability o Voltage stability o Outages using SAIDI and
SAIFI across the network o Peak demand shortage o Transformer and overhead,
underground line failure rates
LEC/MSC data system o Technical losses o Number of customers by
type o Consumption by customer
type o Annual per capita of total
consumption (kWh/person) o Collection efficiency o Maximum and un-served
demand
LEC/SCADA o Technical losses
LEC/MSC data system o Number of new customers
by type o Technical and nontechnical
losses o Cost recovery rates o Maintenance and
infrastructure investments
LEC/LERC o IPP-purchased electricity
customers by type o Number, type, and size of
IPPs o Tariffs across user types o Maximum and un-served
demand
LEC/MSC data system o Total energy sold by
customer type o Number of new customers
by type o Number of applications o Wait time between
application and connection o Wait time between
customer call for repair and repair
o Customer satisfaction with LEC (based on LEC customer service data)
MCHPP o Generation unit cost
LEC/SCADA o Transformer, overhead, and
underground line failure rates
LEC/MSC data o Technical and financial
efficiency o Staff productivity index o Staffing retention and
productivity o Customer coverage and
satisfaction o Customer pay rates and
collection rates by customer type
o Ability to manage customer database and accuracy of information
o Response to supply and meter complaints
o Debt payments
LEC/LERC o Energy forecasts and gap
between demand, load, and forecast, peak demand shortage
o Tariffs across user types
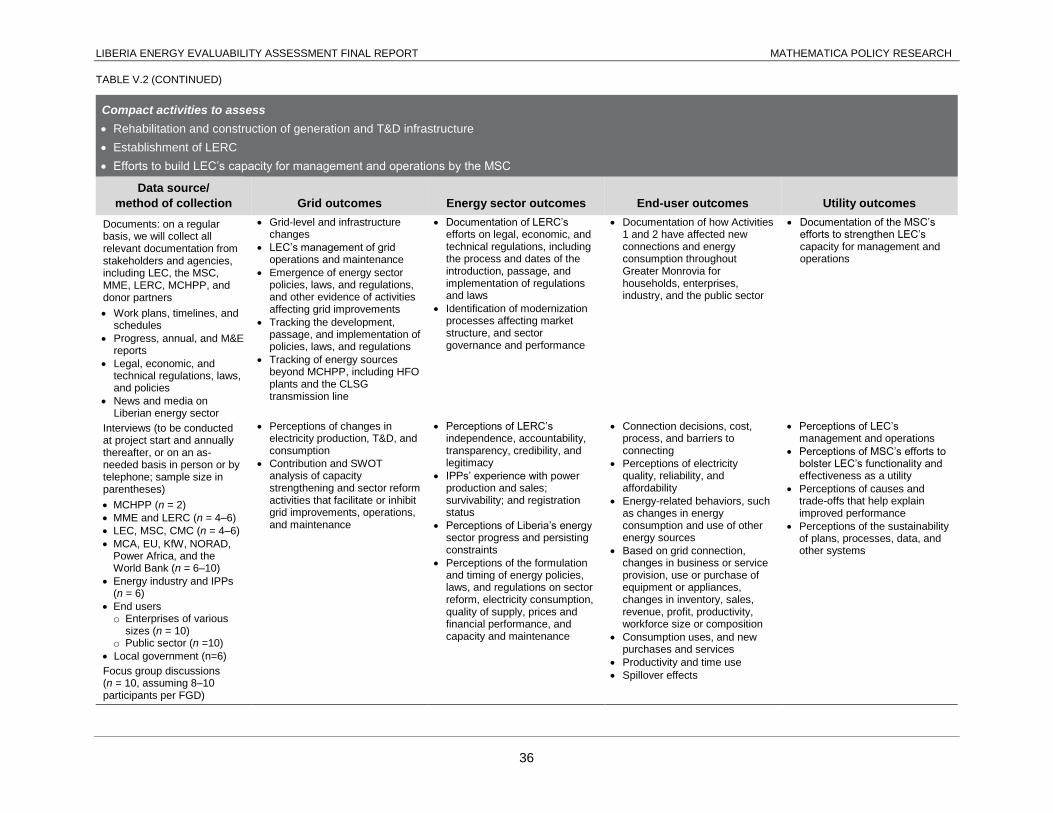
LIBERIA ENERGY EVALUABILITY ASSESSMENT FINAL REPORT MATHEMATICA POLICY RESEARCH
TABLE V.2 (CONTINUED)
36
Compact activities to assess
Rehabilitation and construction of generation and T&D infrastructure
Establishment of LERC
Efforts to build LEC’s capacity for management and operations by the MSC
Data source/
method of collection Grid outcomes Energy sector outcomes End-user outcomes Utility outcomes
Documents: on a regular basis, we will collect all relevant documentation from stakeholders and agencies, including LEC, the MSC, MME, LERC, MCHPP, and donor partners
Work plans, timelines, and schedules
Progress, annual, and M&E reports
Legal, economic, and technical regulations, laws, and policies
News and media on Liberian energy sector
Grid-level and infrastructure changes
LEC’s management of grid operations and maintenance
Emergence of energy sector policies, laws, and regulations, and other evidence of activities affecting grid improvements
Tracking the development, passage, and implementation of policies, laws, and regulations
Tracking of energy sources beyond MCHPP, including HFO plants and the CLSG transmission line
Documentation of LERC’s efforts on legal, economic, and technical regulations, including the process and dates of the introduction, passage, and implementation of regulations and laws
Identification of modernization processes affecting market structure, and sector governance and performance
Documentation of how Activities 1 and 2 have affected new connections and energy consumption throughout Greater Monrovia for households, enterprises, industry, and the public sector
Documentation of the MSC’s efforts to strengthen LEC’s capacity for management and operations
Interviews (to be conducted at project start and annually thereafter, or on an as-needed basis in person or by telephone; sample size in parentheses)
MCHPP (n = 2)
MME and LERC (n = 4–6)
LEC, MSC, CMC (n = 4–6)
MCA, EU, KfW, NORAD, Power Africa, and the World Bank (n = 6–10)
Energy industry and IPPs (n = 6)
End users o Enterprises of various
sizes (n = 10) o Public sector (n =10)
Local government (n=6)
Perceptions of changes in electricity production, T&D, and consumption
Contribution and SWOT analysis of capacity strengthening and sector reform activities that facilitate or inhibit grid improvements, operations, and maintenance
Perceptions of LERC’s independence, accountability, transparency, credibility, and legitimacy
IPPs’ experience with power production and sales; survivability; and registration status
Perceptions of Liberia’s energy sector progress and persisting constraints
Perceptions of the formulation and timing of energy policies, laws, and regulations on sector reform, electricity consumption, quality of supply, prices and financial performance, and capacity and maintenance
Connection decisions, cost, process, and barriers to connecting
Perceptions of electricity quality, reliability, and affordability
Energy-related behaviors, such as changes in energy consumption and use of other energy sources
Based on grid connection, changes in business or service provision, use or purchase of equipment or appliances, changes in inventory, sales, revenue, profit, productivity, workforce size or composition
Consumption uses, and new purchases and services
Productivity and time use
Spillover effects
Perceptions of LEC’s management and operations
Perceptions of MSC’s efforts to bolster LEC’s functionality and effectiveness as a utility
Perceptions of causes and trade-offs that help explain improved performance
Perceptions of the sustainability of plans, processes, data, and other systems
Focus group discussions (n = 10, assuming 8–10 participants per FGD)

LIBERIA ENERGY EVALUABILITY ASSESSMENT FINAL REPORT MATHEMATICA POLICY RESEARCH
TABLE V.2 (CONTINUED)
37
Compact activities to assess
Rehabilitation and construction of generation and T&D infrastructure
Establishment of LERC
Efforts to build LEC’s capacity for management and operations by the MSC
Data source/
method of collection Grid outcomes Energy sector outcomes End-user outcomes Utility outcomes
Site visits (conducted at 3 time points, based on stage of implementation)
MCHPP and substations
T&D infrastructure
LEC and LERC
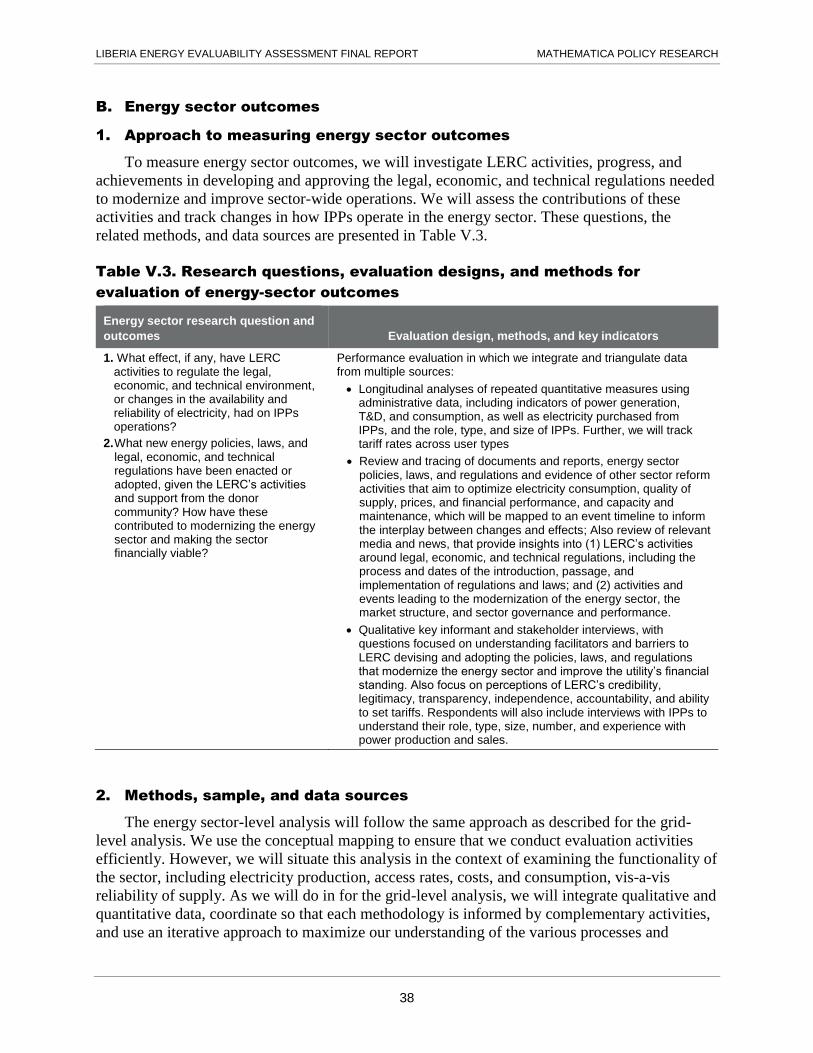
LIBERIA ENERGY EVALUABILITY ASSESSMENT FINAL REPORT MATHEMATICA POLICY RESEARCH
38
B. Energy sector outcomes
1. Approach to measuring energy sector outcomes
To measure energy sector outcomes, we will investigate LERC activities, progress, and
achievements in developing and approving the legal, economic, and technical regulations needed
to modernize and improve sector-wide operations. We will assess the contributions of these
activities and track changes in how IPPs operate in the energy sector. These questions, the
related methods, and data sources are presented in Table V.3.
Table V.3. Research questions, evaluation designs, and methods for
evaluation of energy-sector outcomes
Energy sector research question and
outcomes Evaluation design, methods, and key indicators
1. What effect, if any, have LERC activities to regulate the legal, economic, and technical environment, or changes in the availability and reliability of electricity, had on IPPs operations?
2. What new energy policies, laws, and legal, economic, and technical regulations have been enacted or adopted, given the LERC’s activities and support from the donor community? How have these contributed to modernizing the energy sector and making the sector financially viable?
Performance evaluation in which we integrate and triangulate data from multiple sources:
Longitudinal analyses of repeated quantitative measures using administrative data, including indicators of power generation, T&D, and consumption, as well as electricity purchased from IPPs, and the role, type, and size of IPPs. Further, we will track tariff rates across user types
Review and tracing of documents and reports, energy sector policies, laws, and regulations and evidence of other sector reform activities that aim to optimize electricity consumption, quality of supply, prices, and financial performance, and capacity and maintenance, which will be mapped to an event timeline to inform the interplay between changes and effects; Also review of relevant media and news, that provide insights into (1) LERC’s activities around legal, economic, and technical regulations, including the process and dates of the introduction, passage, and implementation of regulations and laws; and (2) activities and events leading to the modernization of the energy sector, the market structure, and sector governance and performance.
Qualitative key informant and stakeholder interviews, with questions focused on understanding facilitators and barriers to LERC devising and adopting the policies, laws, and regulations that modernize the energy sector and improve the utility’s financial standing. Also focus on perceptions of LERC’s credibility, legitimacy, transparency, independence, accountability, and ability to set tariffs. Respondents will also include interviews with IPPs to understand their role, type, size, number, and experience with power production and sales.
2. Methods, sample, and data sources
The energy sector-level analysis will follow the same approach as described for the grid-
level analysis. We use the conceptual mapping to ensure that we conduct evaluation activities
efficiently. However, we will situate this analysis in the context of examining the functionality of
the sector, including electricity production, access rates, costs, and consumption, vis-a-vis
reliability of supply. As we will do in for the grid-level analysis, we will integrate qualitative and
quantitative data, coordinate so that each methodology is informed by complementary activities,
and use an iterative approach to maximize our understanding of the various processes and

LIBERIA ENERGY EVALUABILITY ASSESSMENT FINAL REPORT MATHEMATICA POLICY RESEARCH
39
mechanisms driving outcomes. Next, we describe the methods, samples, and data sources for the
analysis in more detail.
The energy sector analysis will draw on relevant indicators from the longitudinal analyses of
repeated quantitative measures of administrative data, as previously described for overarching
and grid-level questions. We will use repeated measures of new customer connections, maximum
and un-served demand, technical and nontechnical losses, cost recovery rates, and maintenance
and infrastructure investments to understand the challenges to modernization and performance of
the energy sector. Further, we will use repeated measures of electricity purchased from IPPs, and
the role, type, and size of IPPs to understand how changes in the energy sector have influenced
participation from the private sector. Finally, we will track electricity tariffs across different
types of users. Once analyzed, these data will inform instrument development, interview
respondent selection, and other parts of this analysis.
As we review relevant documents, reports, and media for the energy sector assessment, we
will prioritize materials that provide insights into LERC’s activities focused on the legal,
economic, and technical regulations, including the process and dates of the introduction, passage,
and implementation of regulations and laws. We will also investigate activities and processes
designed to modernize Liberia’s energy sector, the market structure, and sector governance and
performance. Our team will maintain regular, non-burdensome communication with LERC and
other key stakeholders to ensure that we are updated on all processes and activities so that we
can assess the Commission’s ongoing activities. We will keep abreast of the electricity landscape
through regular communication with energy stakeholders in Liberia, the region, and the wider
field, and will explore the possibility of a semi-annual check-in with key energy sector actors,
facilitated by MCA-Liberia. Also, we will use Google alerts and other keyword searches to
monitor media outlets and maintain a library of sources that provide relevant updates and
insights. We will create tools and systems to ensure that we obtain the information necessary to
stay abreast of all activities.
The qualitative key informant and stakeholder interviews will focus on understanding efforts
and constraints to modernizing the energy sector and improving its financial standing. We will
investigate facilitators and barriers to LERC drafting and adopting the policies, laws, and
regulations that set tariffs. We will interview key informants from LERC, MME, MCA and other
agencies, representatives from the donor community, industry and the public sector, and IPPs.
We will assess respondents’ perceptions of LERC’s independence, accountability, transparency,
credibility, and legitimacy. We will focus questions on the then-current stage of regulatory
development, cognizant that it may take years for LERC to be a fully functional and autonomous
entity with complete tariff-setting authority. We will also interview representatives from IPPs to
investigate their role, type, size, number, and operations relative to power production and sales.
We may also seek experts outside of Liberia with specific regional knowledge of tariff-setting
standards and processes to comment on Liberia’s progress. We will trace the formulation and
timing of the actual energy policies, laws, and regulations and evidence of other sector reform
activities that aim to optimize electricity consumption, quality of supply, prices and financial
performance, and capacity and maintenance, which will be mapped to an event timeline to
inform the interplay between changes and effects.
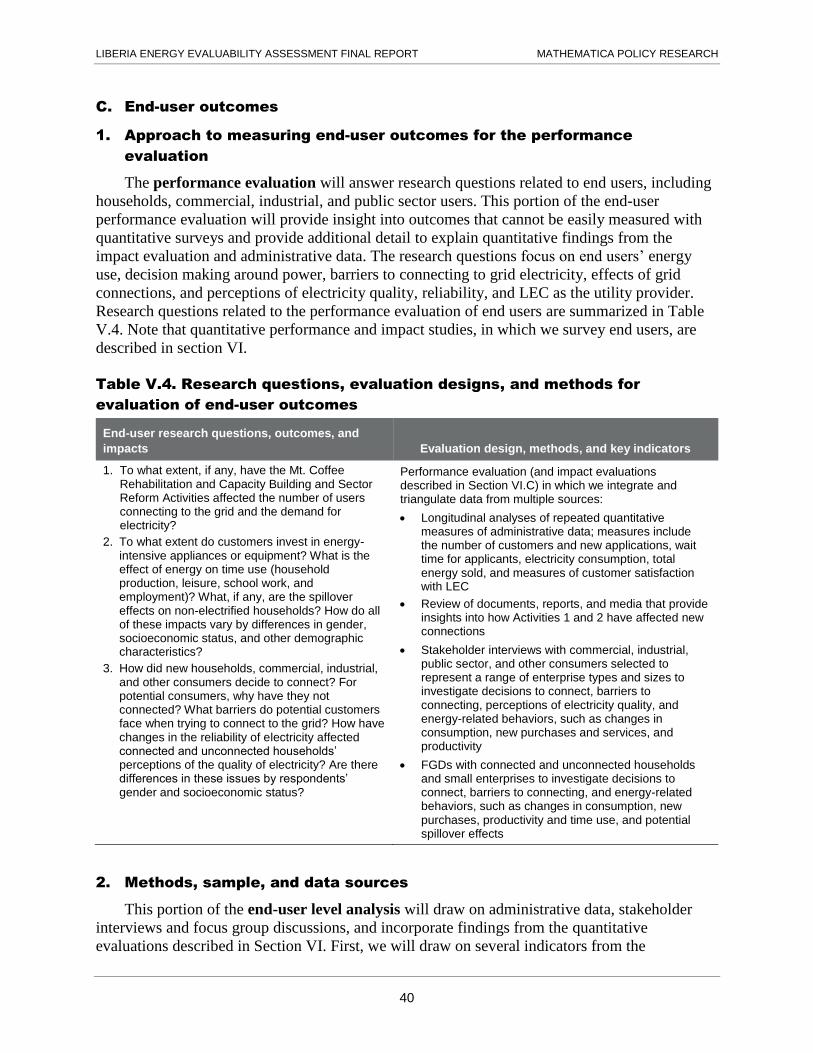
LIBERIA ENERGY EVALUABILITY ASSESSMENT FINAL REPORT MATHEMATICA POLICY RESEARCH
40
C. End-user outcomes
1. Approach to measuring end-user outcomes for the performance
evaluation
The performance evaluation will answer research questions related to end users, including
households, commercial, industrial, and public sector users. This portion of the end-user
performance evaluation will provide insight into outcomes that cannot be easily measured with
quantitative surveys and provide additional detail to explain quantitative findings from the
impact evaluation and administrative data. The research questions focus on end users’ energy
use, decision making around power, barriers to connecting to grid electricity, effects of grid
connections, and perceptions of electricity quality, reliability, and LEC as the utility provider.
Research questions related to the performance evaluation of end users are summarized in Table
V.4. Note that quantitative performance and impact studies, in which we survey end users, are
described in section VI.
Table V.4. Research questions, evaluation designs, and methods for
evaluation of end-user outcomes
End-user research questions, outcomes, and
impacts Evaluation design, methods, and key indicators
1. To what extent, if any, have the Mt. Coffee Rehabilitation and Capacity Building and Sector Reform Activities affected the number of users connecting to the grid and the demand for electricity?
2. To what extent do customers invest in energy-intensive appliances or equipment? What is the effect of energy on time use (household production, leisure, school work, and employment)? What, if any, are the spillover effects on non-electrified households? How do all of these impacts vary by differences in gender, socioeconomic status, and other demographic characteristics?
3. How did new households, commercial, industrial, and other consumers decide to connect? For potential consumers, why have they not connected? What barriers do potential customers face when trying to connect to the grid? How have changes in the reliability of electricity affected connected and unconnected households’ perceptions of the quality of electricity? Are there differences in these issues by respondents’ gender and socioeconomic status?
Performance evaluation (and impact evaluations described in Section VI.C) in which we integrate and triangulate data from multiple sources:
Longitudinal analyses of repeated quantitative measures of administrative data; measures include the number of customers and new applications, wait time for applicants, electricity consumption, total energy sold, and measures of customer satisfaction with LEC
Review of documents, reports, and media that provide insights into how Activities 1 and 2 have affected new connections
Stakeholder interviews with commercial, industrial, public sector, and other consumers selected to represent a range of enterprise types and sizes to investigate decisions to connect, barriers to connecting, perceptions of electricity quality, and energy-related behaviors, such as changes in consumption, new purchases and services, and productivity
FGDs with connected and unconnected households and small enterprises to investigate decisions to connect, barriers to connecting, and energy-related behaviors, such as changes in consumption, new purchases, productivity and time use, and potential spillover effects
2. Methods, sample, and data sources
This portion of the end-user level analysis will draw on administrative data, stakeholder
interviews and focus group discussions, and incorporate findings from the quantitative
evaluations described in Section VI. First, we will draw on several indicators from the

LIBERIA ENERGY EVALUABILITY ASSESSMENT FINAL REPORT MATHEMATICA POLICY RESEARCH
41
longitudinal analyses of LEC’s administrative data, such as the number of new customers and
applications, wait time between application and connections, electricity consumption, total
energy sold, and measures of customer satisfaction with LEC. The document review will focus
on material and evidence that provides insights into how Activities 1 and 2 have affected new
connections. Next, we will conduct stakeholder interviews with representatives from commerce,
industry, and the public sector. Respondents will be selected to represent a range of enterprises
and public sector departments of different types and sizes. We will ask questions designed to
investigate decisions to connect, the connection process, and the facilitators and barriers to
connecting. We will also explore perceptions of electricity quality, reliability, and costs. In
addition, we will ask questions related to the effects of grid electricity on operations and
services, equipment purchases and usage, inventory, employment, productivity, and sales,
revenue, and profits. Finally, we will conduct focus group discussions with a sample of
connected and unconnected households and small enterprises. We will develop FGD protocols
designed to investigate decisions by households and enterprises to connect, the connection
process, and facilitators and barriers to connecting. We will also explore the energy-related
behaviors of households and enterprises, such as changes in consumption, new purchases
resulting from the grid connection, changes in productivity and time use relative to energy use,
and potential spillover effects to other households or businesses.
D. Utility-level outcomes
1. Approach to measuring utility-level outcomes
The performance evaluation of utility-level outcomes will explore questions related to LEC
management and operations. Given that we will already be examining outcomes at the grid and
energy sector level for the implementation and performance evaluation, this portion of the study
will focus on LEC’s financial and technical operations, the electricity tariff, and changes to the
utility’s functionality under the MSC, and the sustainability of these changes. Table V.5
summarizes the utility-level research questions.
Table V.5. Research questions, evaluation designs, and methods for
evaluation of utility-level outcomes
Utility-level research questions and
outcomes Evaluation design and methods
1. How has the electricity tariff changed since MCHPP was rehabilitated? To what extent does it cover the costs of electricity generation and other operating costs?
2. To what extent, if any, has LEC’s management improved since the new management contract became effective? What progress has the GoL made toward establishing a longer-term management arrangement for LEC?
3. How sustainable is LEC as a utility? What are the biggest barriers to its sustainability?
Performance evaluation in which we integrate and triangulate data from multiple sources:
Longitudinal analyses of measures using administrative data on indicators such as tariff rates across user types, energy forecasts, and mismatch between demand, load, and forecast, peak demand shortage, transformer and overhead line failure rates, customer pay rates, collection rates, response to supply and meter complaints, generation unit cost, staff productivity index, energy lost, and other priority indicators. Data will be aligned with ESBI’s key performance indicators.
Analysis of LEC management using indicator tracking, analysis of work plans, comparing plans with actual activities, systems, and processes; review of M&E reports, annual reports
Qualitative key informant and stakeholder interviews, with questions focused on LEC’s management and operations, including the MSC’s efforts to bolster LEC’s functionality and effectiveness as a utility and the sustainability of plans, processes, data, and other systems

LIBERIA ENERGY EVALUABILITY ASSESSMENT FINAL REPORT MATHEMATICA POLICY RESEARCH
42
2. Methods, sample, and data sources
The utility-level analysis will build on the approaches and methods described in the
implementation and previous performance analyses while focusing on the indicators germane to
the utility-level research questions. First, we will identify relevant measures that we expect the
MSC or LEC plans to collect or to which the LERC has access for a longitudinal analyses of
administrative data. We will draw on measures such as generation unit costs, load, peak demand
and peak demand shortage, transformer and overhead line failure rates, customer pay rates,
collection rates, response to supply and meter complaints, and indicators of productivity, as well
as technical and non-technical loss. We will also use tariff rates across user types. If measures
are not available in the MSC’s IMS or a SCADA system, we will examine agency reports for
insights into these measures. Further, the document review will also focus on materials that
describe the MSC’s efforts to improve LEC’s capacity for managing the utility. We will assess
relevant work plans, systems, and processes, compare plans with actual activities, review M&E
reports, quarterly and annual reports, and track management indicators. We will explore
documentation and explanations of the utility’s evolving capacity, such as LEC’s technical and
financial efficiency, customer coverage and satisfaction, and indicators of staffing retention,
technical capacity, and productivity. Finally, we will conduct qualitative key informant and
stakeholder interviews, which will focus on exploring questions around LEC’s management and
operations. We will investigate perceptions of the MSC’s efforts to bolster LEC’s functionality
and effectiveness as a utility and the sustainability of plans, processes, data, and other systems.
We will also explore the causes and tradeoffs that help explain changes in performance. We plan
to interview representatives from the MSC, LEC, MME, LERC, MCA, donor partners, and
others stakeholders that interact with LEC.
E. Analysis plan for the implementation and performance evaluations
As we conduct the implementation and performance evaluations, we will use the conceptual
framework to guide the analysis of all data. The map will provide direction as we combine,
triangulate, and synthesize quantitative and qualitative data across all evaluations. We will
answer the evaluation questions by integrating data from each source. We will confirm
concordant data and reports, or as necessary, reconcile discrepancies or discordant findings. Our
analysis will be ongoing and iterative; information from some sources will feed into our
instrument design, sampling, and data collection plans.
First, in the longitudinal analysis of administrative data, once we obtain data for a three
month period, we will clean and organize them into panel data, and convert to monthly measures.
Next, we will graph key outcomes over time to understand basic trends, as well as potential
relationships between outcomes. For example, we plan to visualize electricity generation,
distribution, and transmission over time—either on a single or multiple graphs with identical
time frames—to better understand the relationships between outcomes over time. Once we have
preliminary results, we will ask key stakeholders for their interpretation of the findings,
including possible causes for detected trends and inflection points. We will investigate how
infrastructure improvements, capacity strengthening, and sector reforms may have influenced
generation, reliability, quality, and other outcomes. These analyses will inform the
implementation and performance evaluations. The longitudinal analysis of administrative data
will inform the implementation and performance studies. We will map these administrative data
against our findings from the document review, interviews, and FGDs to fully understand the

LIBERIA ENERGY EVALUABILITY ASSESSMENT FINAL REPORT MATHEMATICA POLICY RESEARCH
43
processes and mechanisms driving outcomes. For example, during qualitative interviews, we will
ask respondents to reflect on quantitative indicators of outages and load shedding. In turn, during
the analytic stage, we will map qualitative findings to results from the longitudinal analysis of
repeated measures. This iterative approach in which we reconcile findings across data sources
will facilitate our full understanding of the processes and mechanisms driving outcomes.
Second, for the document review, we will use tools such as protocols, checklists, and
trackers to systematically organize, screen, categorize, and tag materials by source and topic.
These procedures will help us quickly understand how documents relate to the activities and
research questions and enable us to identify relevant themes that emerge from the materials. We
will review new documents as they become available to track implementation and monitor sector
developments related to the project activities. We will synthesize information from single files
and across files, pulling critical information relevant to the each component of the energy sector
studies, to inform complementary analyses and answer priority questions. Findings from the
document review may reveal issues or ideas to be explored further in key informant interviews
and FGDs, guiding both the protocol development and the selection of respondents.
Third, we will analyze data from qualitative interviews and FGDs using a multistep
approach in which we begin by reading and rereading English transcripts to understand the
respondents’ experiences, identify new trends and relationships, confirm patterns or findings, and
detect discrepancies or disparate experiences. Informed by the transcripts, we will develop a
detailed coding strategy aligned with the research questions and logic model. This coding
hierarchy will enable us to conduct a thorough word-for-word content analysis of the transcripts.
The content analysis will allow us to identify the main themes that emerge across the transcripts
and data types. We will use NVivo or similar qualitative data analysis software to code the
transcripts, and then will review and organize resulting codes into themes that map to the logic
model and are present across multiple respondents. During this process, we will identify new
trends and relationships, confirm patterns or findings, and detect discrepancies or disparate
experiences. Then, we will compare themes and codes by respondent type and location to
identify consistent and differing themes across respondent groups.
Once we have analyzed each qualitative data source, we will triangulate findings from the
administrative data, document review, interviews, FGDs, and observations. This process will
facilitate identifying new trends and relationships, confirm patterns or findings, and detect
discrepancies or disparate experiences. As a final step, we will integrate findings across
evaluations. In particular, we will use the implementation analysis findings to contextualize
impact and performance evaluation findings. We will apply this general approach to the specific
types of questions and outcomes that we will examine, using each data source to a greater or
lesser extent, depending on the key dimensions of focus.

This page has been left blank for double-sided copying.

LIBERIA ENERGY EVALUABILITY ASSESSMENT FINAL REPORT MATHEMATICA POLICY RESEARCH
45
VI. PERFORMANCE AND IMPACT EVALUATIONS TO MEASURE END USER
OUTCOMES
A. Overview
In Chapter V we described the performance evaluation methods to assess outcomes among
end-users using administrative data and qualitative approaches. In this chapter we describe the
quantitative performance evaluation methods as well as our impact evaluation plans to assess end
user outcomes. The performance evaluations will provide suggestive information about potential
impacts on end-user outcomes, while the impact evaluations will use comparison groups to
quantify the extent to which end users (households, businesses, and public institutions) benefit
from increased electricity supply and reliability.
We designed our proposed quantitative evaluations following lengthy discussions with
stakeholders and consideration of the timing of MCC’s energy sector investments and donor
partners’ T&D investments. We know that within Monrovia, some end users were connected to
the grid prior to the MCHPP rehabilitation, while some end users have only been connected since
the rehabilitation. Further among connected households, some end users have benefited from
improved T&D infrastructure, while others are still reliant on older lines without improved
overhead and underground lines, grid feeders, and transformers. Given the implementation
timing, and the fact that investments were made to an existing electricity system with some
customer connections, we will not have pre-intervention, baseline data on these connected end
users. Still, we aim to capture impacts on different types of connected end users—including
households and small enterprises, businesses, and public institutions—and measure how they
benefit from the increased electricity supply and reliability. We propose quantitative research
designs for three groups of end users:
1. Households and small enterprises connected to the grid before the intervention,
including those using existing T&D lines and those benefiting from new infrastructure
2. Medium and large enterprises and public institutions
3. Households and small enterprises unconnected at the time of baseline survey
For the first two groups, we propose two separate pre-post designs. Without pre-intervention
data for these groups, we will collect retrospective data on pre-intervention measures. We
propose to conduct these studies in Monrovia where the end users are concentrated.
Next, we propose an impact evaluation of unconnected households and small enterprises
that will potentially benefit from grid electricity. We have explored each donor partners’ T&D
plans and timelines to determine the best fit for this study (see Table VI.1). For example,
unserved end users along the Bomi and Kakata corridors will gain access to grid electricity when
the transmission and distribution lines are built. This will enable us to assess the impacts of the
increased electricity generation through MCHPP on new connections and other end user-level
outcomes thereafter, noting the reduced production from MCHPP during the driest months
(January through March). We plan to conduct an impact evaluation for these users using a
carefully selected comparison group.

LIBERIA ENERGY EVALUABILITY ASSESSMENT FINAL REPORT MATHEMATICA POLICY RESEARCH
46
Table VI.1. List of T&D investment locations, expected number of connections, and implementation status
Location of
T&D
investment Components
Expected
number of
connections
Status of project
Current Status Date of tender
Construction begins
Expected completion
Notes
World Bank Paynesville-Kakata Corridor
Transmission lines
Paynesville and Kakata Substations
17,000 Implementing N/A July, 2017 November, 2018
Some distribution work is complete, 9 communities in Paynesville have been connected (about 17,000 customers) *Some connections through WB are only ready boards, rather than full wiring of the house or business
Distribution network
Partially completed
N/A
Bomi Corridor
Transmission lines
Stockton Creek, Kle, Virginia, and Gardnesville substations
20,000 to 30,000
Selecting contractor
June-July, 2018
(expected)
June-July, 2018
End of 2020 The project will be completed in phases:
Replace Stockton Creek substation first to connect cement factories
Rehabilitate old substations at Virginia and then at Kle
Monrovia Distribution network
N/A Completed N.A. N.A. Completed Construction of 22 kV network and LV connections in 18 communities
African Development Bank (AfDB)
Roberts International Airport (RIA) Corridor
Construction of two substations and T&D lines
25,000 to 40,000
Contract signing
The contractor was disqualified, but a new contractor will be identified.
CLSG Construction of feeder and distribution lines
150 communities along lines
Contract signing
Construct MV/LV distribution network using shield wire technology and conventional methods
German Development Bank (KfW)
Monrovia Construction of feeder and distribution lines
17,500 Contractor to be recruited
April, 2018 (delayed)
Construction delayed as of May 2018
TBD (previously Dec. 2018)
Construct MV/LV network in selected communities in and around Monrovia
European Union (EU)
Monrovia Construction of substations and T&D lines
38,000 Contractor to be recruited
Contingent on LEC’s changes on ToW
August / September, 2018
N/A Waterside to Motor Side to capital to Congo Town to Paynesville
LEC is proposing modifications in ToW.
N.A. = Not applicable, N/A = Not available

LIBERIA ENERGY EVALUABILITY ASSESSMENT FINAL REPORT MATHEMATICA POLICY RESEARCH
47
Table VI.2 summarizes our evaluation design approaches for each of the three groups
described earlier. In the sections that follow, we detail the evaluation methods, sampling
strategy, sample size requirements, and outcomes that each evaluation design will examine.
Table VI.2. Overview of evaluation methods to estimate end user impacts
Evaluation method Description
Connected households and small enterprises
Longitudinal analysis (performance evaluation)
We will select a sample of connected households and small enterprises across Monrovia and compare energy-related outcomes over time to measure changes. We will collect pre-intervention data retrospectively.
Medium and large enterprises and public institutions
Longitudinal analysis (performance evaluation)
We will follow a sample of medium and large enterprises and public institutions from Greater Monrovia and compare their energy-related outcomes over time to measure changes. We will collect pre-intervention data retrospectively. Because of the small number of large end users, we may survey the entire population.
Unconnected households and small enterprises
Impact evaluation using natural geography to select a comparison group
In this design, we will construct a comparison group to identify the causal impacts of Activity 1 and 2 on end users by exploiting exogenous variations in their access to the electricity grid. The intervention group will be end users in communities without current access to the grid but that are part of the grid expansion plans. The comparison group will be end users in similar communities that are not part of the grid expansion plans because of natural geographic regions unrelated to their outcomes.
Matched comparison group (impact evaluation)
In this design, we will also construct a comparison group to identify causal impacts of Activity 1 and 2 on end users using a multi-stage matching process. The intervention group will be the end users in communities without current grid access, but that are part of the grid expansion plans. The comparison group will be neighborhoods without grid access (currently or planned) matched to the intervention group on community and household characteristics. We will implement this approach if the natural experiment is not feasible because of limited geographical variations across communities along the planned grid expansions.
B. Performance evaluation for connected households and small enterprises
1. Approach to measuring outcomes among household and small businesses
We will conduct a longitudinal analysis to examine the changes in outcomes connected end
users. We will not be able to conduct a pre-intervention baseline survey for end users that are
already connected, so we will have to rely on retrospective reports from survey respondents. We
will focus on key outcomes of interest for which recall is likely to be accurate. To increase the
accuracy, we will anchor the survey questions to specific events, such as the 2017 election
season.3
We will assess changes in key outcomes that are likely to be affected by improvements in the
availability and reliability of grid electricity in several domains: energy use, education and child
time use, perceptions of safety, and economic well-being, and business activities for small
3 We originally proposed a matched comparison group design based on time-invariant household characteristics and recall information in
addition to the pre-post analysis with pre-period data collected retrospectively. The matched comparison group design involves significant
uncertainties in terms of identifying a reliable comparison group based on the limited set of time-invariant observable end user
characteristics or because of the unreliability of the recall information. In addition, a matched comparison group design requires
significantly more effort to match a sample of connected end users to a group of comparison end users. We consulted with MCC about
these issues and decided that investing evaluation resources to carry out a matched comparison group design would not be cost effective.
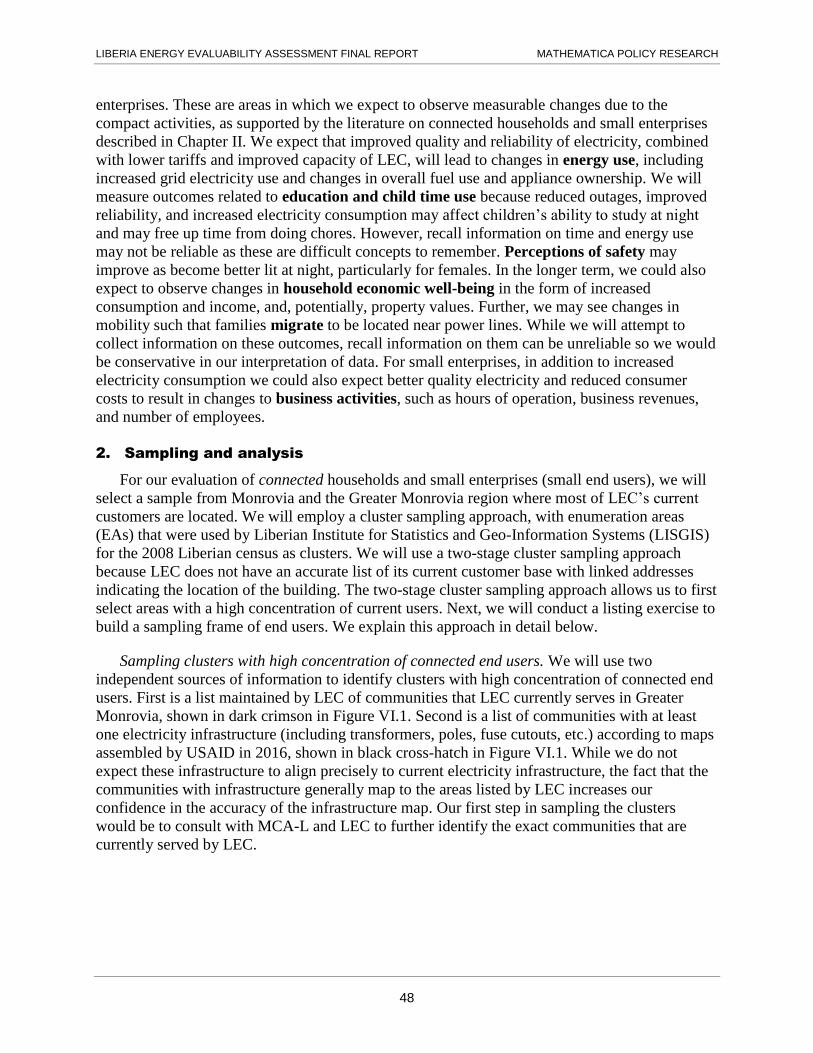
LIBERIA ENERGY EVALUABILITY ASSESSMENT FINAL REPORT MATHEMATICA POLICY RESEARCH
48
enterprises. These are areas in which we expect to observe measurable changes due to the
compact activities, as supported by the literature on connected households and small enterprises
described in Chapter II. We expect that improved quality and reliability of electricity, combined
with lower tariffs and improved capacity of LEC, will lead to changes in energy use, including
increased grid electricity use and changes in overall fuel use and appliance ownership. We will
measure outcomes related to education and child time use because reduced outages, improved
reliability, and increased electricity consumption may affect children’s ability to study at night
and may free up time from doing chores. However, recall information on time and energy use
may not be reliable as these are difficult concepts to remember. Perceptions of safety may
improve as become better lit at night, particularly for females. In the longer term, we could also
expect to observe changes in household economic well-being in the form of increased
consumption and income, and, potentially, property values. Further, we may see changes in
mobility such that families migrate to be located near power lines. While we will attempt to
collect information on these outcomes, recall information on them can be unreliable so we would
be conservative in our interpretation of data. For small enterprises, in addition to increased
electricity consumption we could also expect better quality electricity and reduced consumer
costs to result in changes to business activities, such as hours of operation, business revenues,
and number of employees.
2. Sampling and analysis
For our evaluation of connected households and small enterprises (small end users), we will
select a sample from Monrovia and the Greater Monrovia region where most of LEC’s current
customers are located. We will employ a cluster sampling approach, with enumeration areas
(EAs) that were used by Liberian Institute for Statistics and Geo-Information Systems (LISGIS)
for the 2008 Liberian census as clusters. We will use a two-stage cluster sampling approach
because LEC does not have an accurate list of its current customer base with linked addresses
indicating the location of the building. The two-stage cluster sampling approach allows us to first
select areas with a high concentration of current users. Next, we will conduct a listing exercise to
build a sampling frame of end users. We explain this approach in detail below.
Sampling clusters with high concentration of connected end users. We will use two
independent sources of information to identify clusters with high concentration of connected end
users. First is a list maintained by LEC of communities that LEC currently serves in Greater
Monrovia, shown in dark crimson in Figure VI.1. Second is a list of communities with at least
one electricity infrastructure (including transformers, poles, fuse cutouts, etc.) according to maps
assembled by USAID in 2016, shown in black cross-hatch in Figure VI.1. While we do not
expect these infrastructure to align precisely to current electricity infrastructure, the fact that the
communities with infrastructure generally map to the areas listed by LEC increases our
confidence in the accuracy of the infrastructure map. Our first step in sampling the clusters
would be to consult with MCA-L and LEC to further identify the exact communities that are
currently served by LEC.
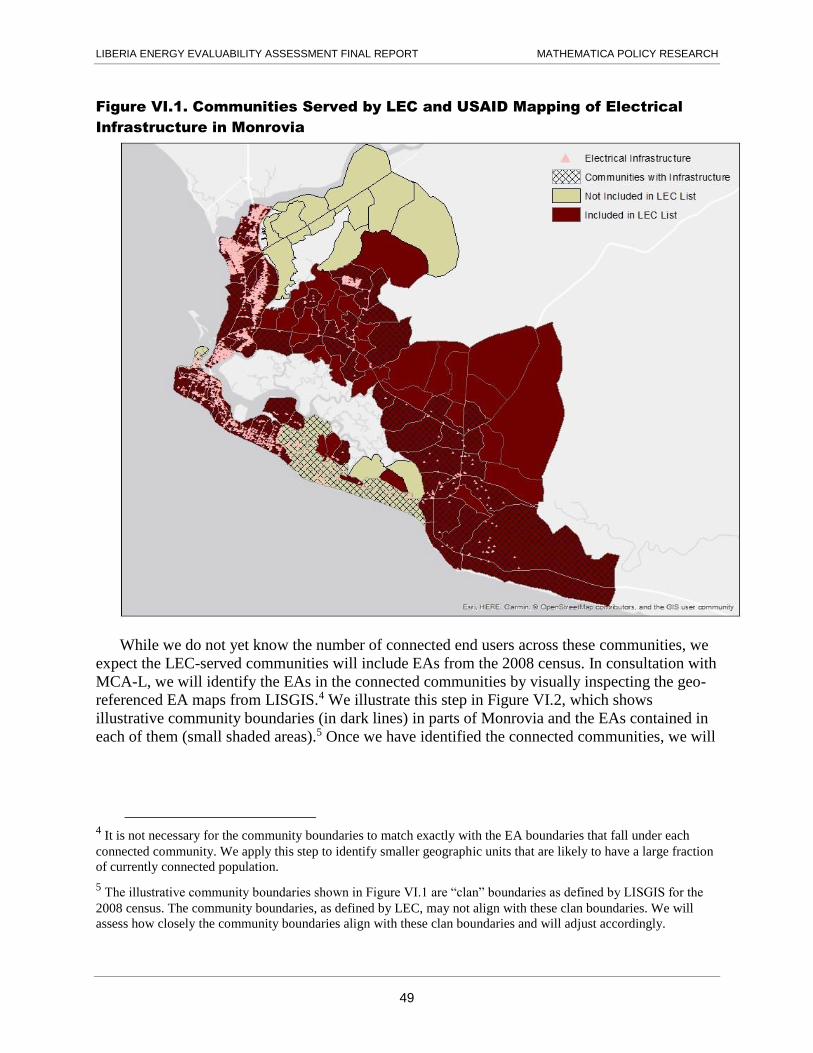
LIBERIA ENERGY EVALUABILITY ASSESSMENT FINAL REPORT MATHEMATICA POLICY RESEARCH
49
Figure VI.1. Communities Served by LEC and USAID Mapping of Electrical
Infrastructure in Monrovia
While we do not yet know the number of connected end users across these communities, we
expect the LEC-served communities will include EAs from the 2008 census. In consultation with
MCA-L, we will identify the EAs in the connected communities by visually inspecting the geo-
referenced EA maps from LISGIS.4 We illustrate this step in Figure VI.2, which shows
illustrative community boundaries (in dark lines) in parts of Monrovia and the EAs contained in
each of them (small shaded areas).5 Once we have identified the connected communities, we will
4 It is not necessary for the community boundaries to match exactly with the EA boundaries that fall under each
connected community. We apply this step to identify smaller geographic units that are likely to have a large fraction
of currently connected population.
5 The illustrative community boundaries shown in Figure VI.1 are “clan” boundaries as defined by LISGIS for the
2008 census. The community boundaries, as defined by LEC, may not align with these clan boundaries. We will
assess how closely the community boundaries align with these clan boundaries and will adjust accordingly.
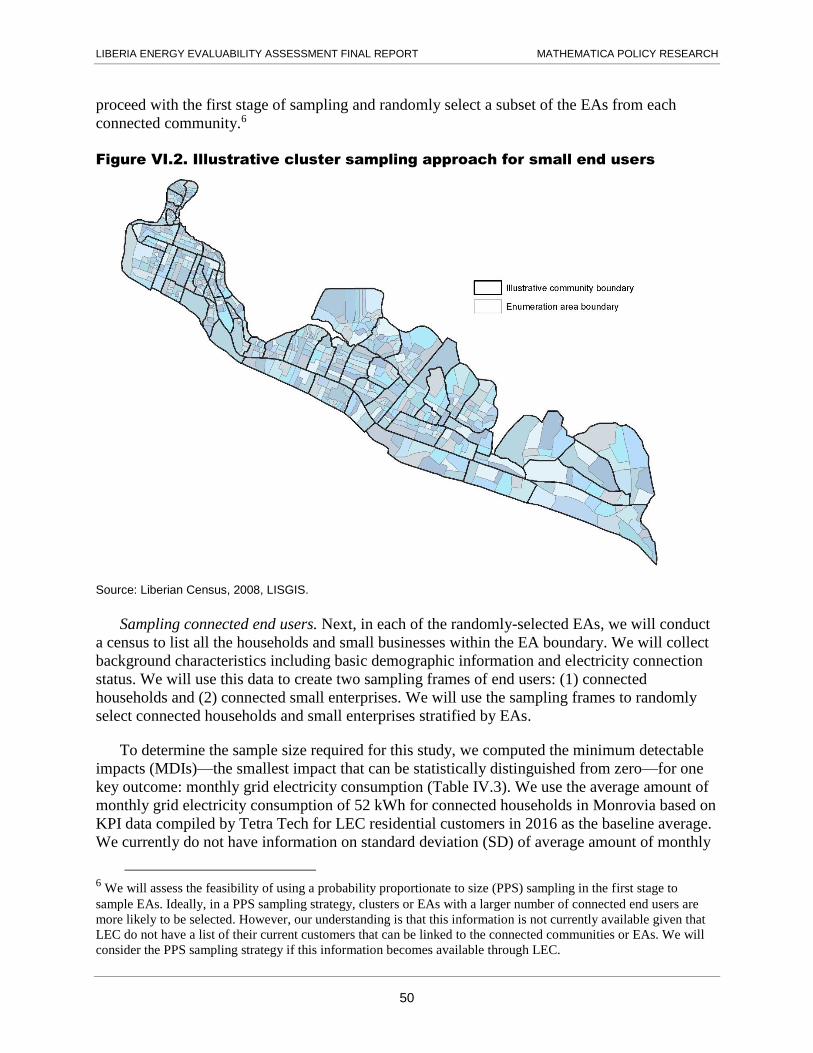
LIBERIA ENERGY EVALUABILITY ASSESSMENT FINAL REPORT MATHEMATICA POLICY RESEARCH
50
proceed with the first stage of sampling and randomly select a subset of the EAs from each
connected community.6
Figure VI.2. Illustrative cluster sampling approach for small end users
Source: Liberian Census, 2008, LISGIS.
Sampling connected end users. Next, in each of the randomly-selected EAs, we will conduct
a census to list all the households and small businesses within the EA boundary. We will collect
background characteristics including basic demographic information and electricity connection
status. We will use this data to create two sampling frames of end users: (1) connected
households and (2) connected small enterprises. We will use the sampling frames to randomly
select connected households and small enterprises stratified by EAs.
To determine the sample size required for this study, we computed the minimum detectable
impacts (MDIs)—the smallest impact that can be statistically distinguished from zero—for one
key outcome: monthly grid electricity consumption (Table IV.3). We use the average amount of
monthly grid electricity consumption of 52 kWh for connected households in Monrovia based on
KPI data compiled by Tetra Tech for LEC residential customers in 2016 as the baseline average.
We currently do not have information on standard deviation (SD) of average amount of monthly
6 We will assess the feasibility of using a probability proportionate to size (PPS) sampling in the first stage to
sample EAs. Ideally, in a PPS sampling strategy, clusters or EAs with a larger number of connected end users are
more likely to be selected. However, our understanding is that this information is not currently available given that
LEC do not have a list of their current customers that can be linked to the connected communities or EAs. We will
consider the PPS sampling strategy if this information becomes available through LEC.

LIBERIA ENERGY EVALUABILITY ASSESSMENT FINAL REPORT MATHEMATICA POLICY RESEARCH
51
grid electricity consumption in Liberia. In the absence of this information, we use SD
information for connected households from the MCC Tanzania Energy Project evaluation
(Chaplin et al. 2017). We also present MDIs for three different sample sizes to demonstrate the
size of impacts that we will be able to detect with different samples. Note that for cluster-level
sampling, a higher proportion of statistical power is derived from the total number of clusters as
opposed to the total number of end users. We assume an average of 50 end users for each cluster
in our sample, and of these, approximately 25 will be households and 25 will be small
enterprises.
We would be able to detect an increase of 9.4 kWh in grid electricity consumption, an
increase of 18.1 percent from the baseline mean, for the full sample of 20 clusters and 1,000 end
users. With sample size increased to 25 clusters (1,250 end users) or 30 clusters (1,500 end
users), we will be able to detect smaller impacts, 8.4 kWh (16.2 percent of baseline mean) and
7.7 kWh (14.8 percent of baseline mean), respectively. These are small increases and the actual
increase in electricity consumption is likely to be higher. For reference, to consume an additional
9.4 kWh of electricity per month, a household must use one additional 60W incandescent electric
bulbs for about 5.5 hours each night. Also, these estimates are lower than the projected monthly
increases in grid electricity consumption of around 18.82 kWh for residential T1 and D1
customers in the ERR calculations.
It is critical that we also examine detectable MDIs with a smaller subsample given that we
will have both households and small enterprises in our sample. In Table VI.3, we also present
MDIs for a 50 percent subsample that could represent either the household or the small
enterprise sample. For the 50 percent subsample, we will be able to detect impacts of 10.0 kWh,
9.0 kWh, and 8.2 kWh with sample sizes of 500, 625, and 750 end users, respectively. The
number of clusters will remain the same because we will have different types of end users, on
average, in each of the clusters. These impacts are also small and are likely to be realized as
connected end users will be the first to take advantage of the increased generation of grid
electricity. Note that we present several scenarios for MCC to consider but we recommend the
scenario to include 1,500 end users given the expectation that consumption may change only
slightly, particularly among users that receive ready board connections, rather than direct
connections to lines.
Table VI.3. Minimum detectable impacts for connected end users
Outcome
Sample size Baseline
mean MDI
MDI (% change from mean) Clusters End users
Full sample
Monthly grid electricity consumption (kWh)
30 1,500 52 7.7 14.8 25 1,250 52 8.4 16.2 20 1,000 52 9.4 18.1
50% sample
Monthly grid electricity consumption (kWh)
30 750 52 8.2 15.7 25 625 52 9.0 17.2 20 500 52 10.0 19.2
Notes: Calculations are based on a confidence level of 95 percent, two-tailed tests, 80 percent power, 10 percent non-response rate for surveys, a pre-post correlation of 10 percent and an R-squared of 0.1. Information on baseline mean is from KPI data compiled by TetraTech for LEC residential customers in 2016. Information on baseline standard deviation are from the MCC Tanzania evaluation (Chaplin et al. 2017). kWh= Kilowatt-hour.

LIBERIA ENERGY EVALUABILITY ASSESSMENT FINAL REPORT MATHEMATICA POLICY RESEARCH
52
We will use the following linear ordinary least squares model to estimate impacts in the
proposed pre-post study of connected users:
(VI.3) ' '
1 1ec ec e ecY Post X
where eY is the outcome of interest of end user e (pre or post)in community c; post is an
indicator variable that is one if the outcome is from the post-implementation period and zero
otherwise; ecX is a vector of the time-variant background characteristics of end user e and
community c; e represent end user-level fixed effects; and e is an error term. The coefficient
1 represents the adjusted change over time in the end-user outcome.
C. Performance evaluation of medium and large businesses and public
institutions
1. Approach to measuring outcomes among medium and large electricity
customers
Across Greater Monrovia, medium and large end users include a mix of private enterprises
and public institutions. We are aware of about 300-500 private enterprises, such as Lonestar Cell,
Premier Milling, and Metalum Liberia. Public institutions include schools, hospitals, government
agencies, and international organizations.7 The economic rate of return calculations assume that
an additional 1,450 enterprises will receive industrial connections. Because the improvements to
electricity generation are likely to benefit most of the large electricity users and because those
users are likely to be clustered in certain areas, this would lead to low power to detect impacts
for any matched comparison group design. Therefore, we propose to conduct longitudinal
analyses of electricity-related outcomes for consumers that use significantly larger amounts of
electricity.
We will conduct three rounds of data collection—at baseline, interim, and final surveys—to
form a panel with a broad range of outcomes. The surveys will collect information on the basic
characteristics of each institution, including type; sector; year established; type of customers
served; year connected to the grid; and reach (local, regional, or national). The sector will be
particularly important to understand whether the business or public institution is considered
energy intensive.
Table VI.4 summarizes the key outcome domains and a sample of outcomes. The domains
reflect business outcomes that the literature suggests may be affected by improved electricity
quality and reliability, service provision, sector functionality, and reduced tariffs. For example,
we expect energy use and expenditures to change as a result of improved electricity quality and
reduced outages, as well as a lower tariff. Fewer voltage fluctuations and outages may reduce
7 The international organizations include the World Health Organization, UNICEF, and the World Bank. We do not plan to
investigate consequences of grid electricity on these types of institutions as they are less likely to be representative of
medium and large businesses and public institutions in Liberia. However, we will consult with MCC if including them in
our evaluation will be meaningful.

LIBERIA ENERGY EVALUABILITY ASSESSMENT FINAL REPORT MATHEMATICA POLICY RESEARCH
53
equipment damage, while all aspects of a better-functioning energy sector may affect business
productivity.
Table VI.4. Proposed outcomes for medium and large businesses and public
institutions
Outcome domain
Sample of outcome measures
Medium and large businesses Public institutions
Productivity Business revenue
Number of employees
Hours of operation
Capital investments (equipment and so on)
Generator ownership
Number of employees
Hours of operation
Generator ownership
Energy use and expenditures
Grid and nongrid electricity use
Monthly expenditures on grid electricity
Monthly expenditures on nongrid electricity (such as generators and liquid fuels)
Ratio of electricity costs to revenues
Grid and nongrid electricity use
Monthly expenditures on grid electricity
Monthly expenditures on nongrid electricity (such as generators and liquid fuels)
Equipment Occurrence of equipment or appliance failure
Cost of replacing or repairing defective equipment or appliances
Occurrence of equipment or appliance failure
Cost of replacing or repairing defective equipment or appliances
We will ask survey respondents for retrospective information on all outcomes during the first
round of data collection given that we are unable to conduct a pre-intervention baseline survey.
We expect that the majority of medium and large businesses and public institutions will have
reasonable administrative records for many outcomes, which will enable us to establish realistic
baseline measures. Over the course of the study we will compare the baseline measures to
interim and end-line data. We will complement these surveys with qualitative data captured
through in-depth interviews with business owners and leaders in public institutions described in
Section V. We will also triangulate the survey information with LEC billing data to understand
the pattern of grid electricity use among the medium and large enterprises and the public
institutions using grid electricity.
2. Sampling and analysis
The MCC ERR calculations and preliminary LEC administrative data suggests that there are
300-500 users in the current commercial customer base of medium and large businesses and
public institutions. MCC’s ERR projections suggest that this count could reach 1,400 customers.
If the numbers of large end users exceed considerably by the time we conduct the baseline
survey, our strategy would be to randomly sample 400-500 large end users. If we sample large
end users, we will first list these customers located in Monrovia to create our sampling frame.8
Next, we will randomly select businesses and public institutions, stratified by size, and over-
sample the larger businesses and institutions. We will determine whether stratification by
business or institution type will improve our ability to construct a representative sample.
However, as of March 2018, the total number of commercial customers has not increased based
8 We will explore whether this list is available from administrative sources such as the electric utility.
LIBERIA ENERGY EVALUABILITY ASSESSMENT FINAL REPORT MATHEMATICA POLICY RESEARCH
54
on our conversations with LEC officials. Thus, our primary strategy for analyzing outcomes for
large end users would be to survey the entire population of end users.
We do not present MDI calculations for the evaluation of large end users for two reasons.
First, because we will either survey the entire population or a very large fraction of large end
users, our sample will be representative of the large end users. Second, we do not have reliable
baseline information on connected large end users from a comparable context for the MDI
calculations. We will estimate the impact on large end users for the pre-post analysis using a
similar OLS model (3) described for connected households and small enterprises.
D. Impact evaluation for unconnected end users
We have developed two potential approaches to the evaluation designed to estimate impacts
on unconnected households and small enterprises. Each design requires constructing a
comparison group in which we contrast an intervention group of end users with grid access to a
similar, but unserved comparison group without grid access. Our first approach exploits variation
in natural geography to identify the impact of electrification using an instrumental variables (IV)
strategy. The basic intuition is that geographical features such as land gradient may affect the
placement of new grid lines, but do not necessarily affect household outcomes after accounting
for baseline variables. This creates plausibly random variation in the distribution of grid lines
that can be used to estimate the causal effect of electrification. Our second approach uses a
matched comparison group (MCG) design, where we will create a comparison group by
matching end users without grid access to an intervention group with grid access and compare
outcomes between the two. We will conduct matching on a rich set of community and household
characteristics that we will collect from survey data.
For both designs, we will rely on donor partners’ planned grid expansion plans to measure
impacts because the donor-funded T&D infrastructure is necessary for end users to legally access
the grid. We recognize that donors have faced delays in implementing their T&D plans, some of
which are still in development. Subsequently, the exact location of the study will be determined
based on the timing of construction of new distribution infrastructure. As we design the study,
we must also take into consideration that LEC may be able to respond to the backlog of customer
applications using existing infrastructure, removing some households and businesses from the
pool of unconnected end users. We are actively communicating with donor partners to develop
plans that leverage the opportunity of new T&D infrastructure and connections while limiting
risks to the evaluation design. Although sample selection is challenging given that we must rely
on others donors’ efforts, this rigorous evaluation will allow us to estimate impacts and then
generalize findings to similar populations throughout Liberia.
1. Instrumental variables strategy using natural geography
Our first approach will use natural geography as a plausibly random variable in identifying
the effect of grid access. We will leverage how variation in natural geography determines new
T&D infrastructure installation and access to grid electricity among unserved end users. Ideally,
geographical variation will allow us to identify both an intervention and comparison group of
end users. The underlying assumption is that the cost and feasibility of electricity expansion
varies because of natural geography and thus creates an exogenous variation in end users’ access
to electricity lines. That is, as engineers determine line placement, decisions are made based on

LIBERIA ENERGY EVALUABILITY ASSESSMENT FINAL REPORT MATHEMATICA POLICY RESEARCH
55
the elevation and slope of the land, rivers, soil type, and land cover and not based on economic
or other differences in households or businesses. Thus geography creates similar groups that can
be compared because the only differences are caused by nature. Several prior studies show that
the costs of new connections and of regular access vary with the topology of each community
(Lipscomb et al. 2013, Dinkelman 2011). Using this exogenous variation to explain access to
grid electricity, we can estimate causal impacts by comparing end users in communities with
access to grid electricity to those in otherwise similar communities without grid access due to the
natural geography.
Depending on distribution line extension plans, we will implement the IV strategy in several
steps, following Lipscomb et al. (2013) and Dinkelman (2011):
1. First, we will assess the feasibility of this approach by examining donor partners’ T&D
plans. If the distribution lines are only built along the corridors (such as within 2000 feet
of the corridor), rather than constructed to extend into communities (such as more than
2000 feet), we may determine that there will not be adequate variation to use this
approach.
2. Next, if we determine this approach may be feasible, we will use measures of elevation
and slope from NASA’s Shuttle Radar Topology Mission (SRTM), now available at 30m
resolution, to estimate the probability that the electricity grid is extended to each cluster
(village or community) based on these features. Other spatial data on geographic
constraints like rivers, soil type, and land cover will also inform this effort. We will test
the predictive power of these additional variables to determine whether they should also
be included in estimating the probability that the electricity grid is extended. To estimate
the probabilities, we will use the following empirical model:
(VI.4) First stage: 0 c c c c cElectrification Geophysical y X
where cElectrification is the binary variable denoting whether cluster c is newly
electrified through the grid expansion project, cGeophysical is a vector of geophysical
predictors of grid expansion for the cluster, 0 cy is the cluster-level baseline outcome
value and cX is a vector of control variables, including distance to the nearest roads,
population density, and other features of the local economy of cluster c. The predicted
electrical grid expansion from the empirical model of VI.4 will serve as the first stage in
our analysis, where the geophysical variable are used as instrumental variables.
3. In the next stage, we will estimate the causal impacts of electrification on the changes in
end-user outcomes using the following empirical specification:
(VI.5) Second stage: 0 ic c ic ic icy Electrification y X ò
where iy is the change in outcomes between baseline and follow-up for household i in
cluster c, cElectrification is the predicted electric grid expansion for the cluster c, 0 icy is
the baseline outcome for the household, and icX is a same set of control variables
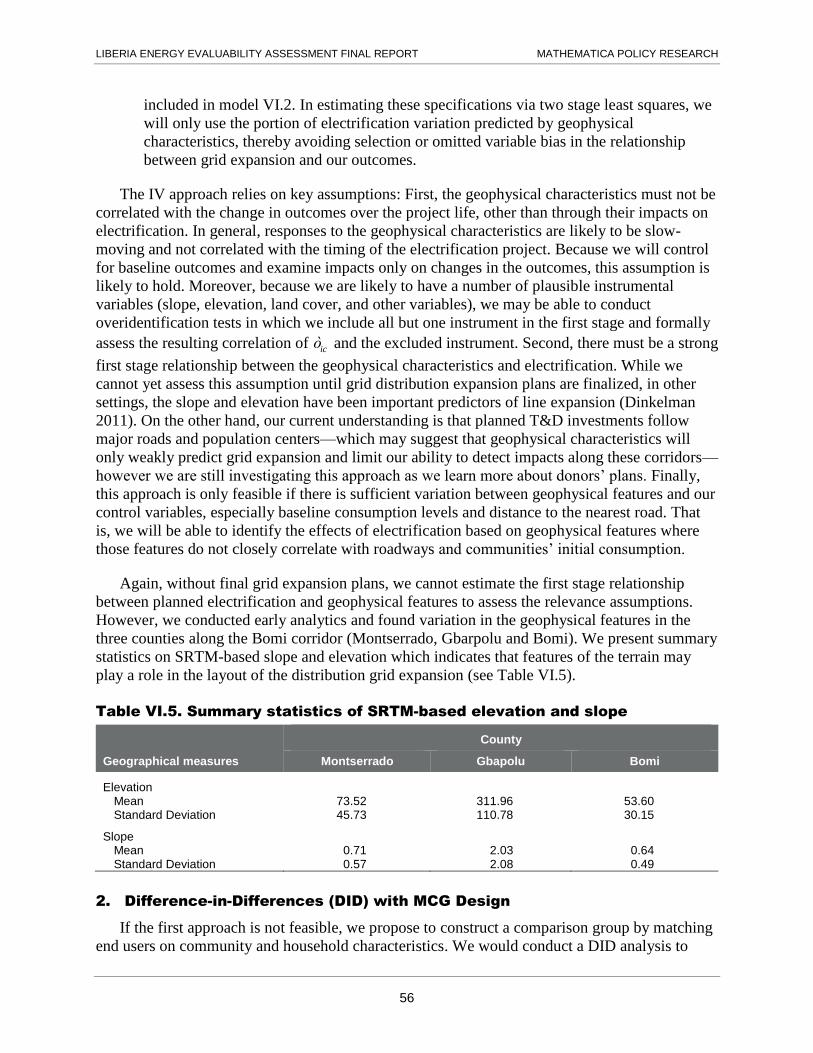
LIBERIA ENERGY EVALUABILITY ASSESSMENT FINAL REPORT MATHEMATICA POLICY RESEARCH
56
included in model VI.2. In estimating these specifications via two stage least squares, we
will only use the portion of electrification variation predicted by geophysical
characteristics, thereby avoiding selection or omitted variable bias in the relationship
between grid expansion and our outcomes.
The IV approach relies on key assumptions: First, the geophysical characteristics must not be
correlated with the change in outcomes over the project life, other than through their impacts on
electrification. In general, responses to the geophysical characteristics are likely to be slow-
moving and not correlated with the timing of the electrification project. Because we will control
for baseline outcomes and examine impacts only on changes in the outcomes, this assumption is
likely to hold. Moreover, because we are likely to have a number of plausible instrumental
variables (slope, elevation, land cover, and other variables), we may be able to conduct
overidentification tests in which we include all but one instrument in the first stage and formally
assess the resulting correlation of icò and the excluded instrument. Second, there must be a strong
first stage relationship between the geophysical characteristics and electrification. While we
cannot yet assess this assumption until grid distribution expansion plans are finalized, in other
settings, the slope and elevation have been important predictors of line expansion (Dinkelman
2011). On the other hand, our current understanding is that planned T&D investments follow
major roads and population centers—which may suggest that geophysical characteristics will
only weakly predict grid expansion and limit our ability to detect impacts along these corridors—
however we are still investigating this approach as we learn more about donors’ plans. Finally,
this approach is only feasible if there is sufficient variation between geophysical features and our
control variables, especially baseline consumption levels and distance to the nearest road. That
is, we will be able to identify the effects of electrification based on geophysical features where
those features do not closely correlate with roadways and communities’ initial consumption.
Again, without final grid expansion plans, we cannot estimate the first stage relationship
between planned electrification and geophysical features to assess the relevance assumptions.
However, we conducted early analytics and found variation in the geophysical features in the
three counties along the Bomi corridor (Montserrado, Gbarpolu and Bomi). We present summary
statistics on SRTM-based slope and elevation which indicates that features of the terrain may
play a role in the layout of the distribution grid expansion (see Table VI.5).
Table VI.5. Summary statistics of SRTM-based elevation and slope
Geographical measures
County
Montserrado Gbapolu Bomi
Elevation Mean 73.52 311.96 53.60 Standard Deviation 45.73 110.78 30.15
Slope Mean 0.71 2.03 0.64 Standard Deviation 0.57 2.08 0.49
2. Difference-in-Differences (DID) with MCG Design
If the first approach is not feasible, we propose to construct a comparison group by matching
end users on community and household characteristics. We would conduct a DID analysis to

LIBERIA ENERGY EVALUABILITY ASSESSMENT FINAL REPORT MATHEMATICA POLICY RESEARCH
57
estimate differences between the study groups. In a DID with a MCG design, the intervention
group will be the households and small enterprises in communities with new grid access. The
comparison group will be the households and small enterprises in communities without grid
access, matched to the intervention communities on a host of observable community
characteristics.
If we use this approach, we will implement the matching exercise in a step by step process:
1. First, using donor partner T&D maps of new distribution infrastructure, we will identify
communities where lines will be placed. We will randomly select a group of these
communities to include in our study sample if the number of intervention communities
gaining access to the T&D network is large. Otherwise, we will include all communities
gaining access. We discuss the sample size requirements in Section 4.
2. Next, we will select neighboring communities without access to the T&D network that
may serve as the comparison group. We will attempt to select three comparison
communities for each intervention community. The selection will be based on readily
available variables such as proximity to the intervention group and population size and
density.
3. Next, we will conduct a community survey in both the intervention and comparison
communities selected in the previous two steps. The community survey will yield
information on community characteristics such as population size, distance to nearest
road, distance to nearest town, and types and materials of typical homes to assess
socioeconomic status.
4. From this sampling frame, we will further match each intervention community to one
comparison community on the basis of their probability of being in an area with planned
grid expansion as predicted by community characteristics. This would yield a final study
sample of intervention and comparison group communities. We would use a probit model
to estimate the probability of being in an area with planned grid expansion based on
variables collected from the community survey:
(VI.6) c e cProb Electrification Community
where is the standard N(0,1) function. Under this method, we will choose
communities with similar predicted probabilities.
5. Next we will conduct a small end user listing activity to gather basic demographic or
business and electricity data from each potential end user in selected communities from
the previous step. We will use this to select our sample of end users for survey data
collection. We will then conduct a detailed household and small enterprise survey on
these subset of users based on sample size requirements discussed on Section 4.
Finally, in the analysis stage, we will conduct propensity score matching—this time at the
end user level— to ensure balance between the selected intervention and comparison
group end users. We expect this will be done separately for households and small
businesses but will make this determination during the matching stage.

LIBERIA ENERGY EVALUABILITY ASSESSMENT FINAL REPORT MATHEMATICA POLICY RESEARCH
58
3. Sampling strategy
The sampling strategy for both the IV strategy and MCG design are the same. As explained
in section VI.D.1, the prediction of the probability of electrification on the basis of community
characteristics will serve as an important facet of the sampling strategy for communities. We will
conduct a community survey that enables us to match comparison communities to intervention
communities on a range of measures. We will use model VI.6 to predict the probability of a
community gaining access to grid electricity and to identify intervention and comparison
community pairs. This effectively trims the sample to include only the set of intervention and
comparison communities whose predicted probabilities overlap. Once the study sample of
communities are selected, we will conduct a listing survey or census for all households and small
enterprises in each community. We will then randomly select the same fraction of end users,
stratified by households and small enterprises, in each community. This will ensure our sample
has an adequate representation of end users from larger communities.
4. Sample size requirement and statistical power
To determine the sample size required for this study, we computed the MDIs for one key
outcome: monthly energy consumption from any source. We use this outcome as unconnected
households do not consume grid electricity at baseline. As the baseline value of this outcome, we
use estimates of energy consumption from any source from the 2010 World Bank willingness to
pay (WTP) study that surveyed a random sample of 479 households in Monrovia without access
to grid electricity. Based on this study, unconnected households consumed an average of 6.92
kWh of energy from kerosene, candles, flashlights, lamps, batteries, and other sources. This
estimate is also used as the baseline amount of electricity consumption for unconnected D1
residential customers for the ERR calculations. However, we do not have SD estimates for
unconnected households in Liberia. We considered using SD estimates from the MCC Tanzania
Energy Project evaluation for the same outcome, which were extremely high with a coefficient
of variation (SD divided by mean) of 27.5. We believe that in Liberia, where households are
mostly poorer than in Tanzania, the variation in energy consumption from any sources would be
much lower. Nonetheless, we present our MDI calculations for a range of COV from 2 to 15 to
demonstrate how our ability to detect impacts would vary with different SD estimates.
Also, in the absence of T&D maps from the donors, we have limited ability to determine the
number of communities that would gain access to grid electricity. However, we used census
maps from LISGIS to estimate the number of communities that could potentially gain access to
the grid along the Kakata corridor. We assumed—although can only confirm once T&D plans
are finalized—that communities within an approximate 200-meter band along the Kakata
corridor and within a 5-kilometer radius around Kakata city would potentially benefit from the
T&D network expansion (Figure VI.3). This resulted in a total number of 125 intervention
communities with grid access. Assuming equal number of 125 comparison communities, we then
anticipate sampling a total of 250 communities or clusters. We also estimate MDIs for a higher
alternative total sample size of 400 communities or clusters to demonstrate the sensitivity of the
MDI estimates to varying cluster sample size. Finally, we also present MDIs for three different
assumptions of number of households per cluster—8, 10, and 12.
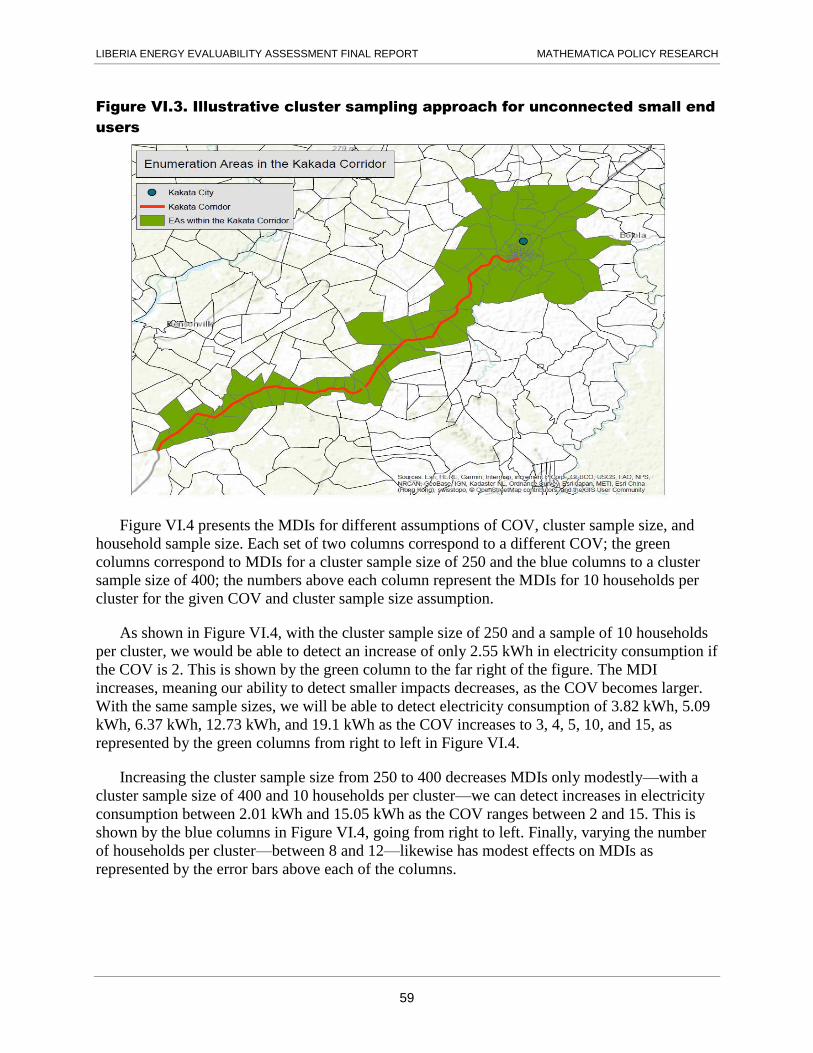
LIBERIA ENERGY EVALUABILITY ASSESSMENT FINAL REPORT MATHEMATICA POLICY RESEARCH
59
Figure VI.3. Illustrative cluster sampling approach for unconnected small end
users
Figure VI.4 presents the MDIs for different assumptions of COV, cluster sample size, and
household sample size. Each set of two columns correspond to a different COV; the green
columns correspond to MDIs for a cluster sample size of 250 and the blue columns to a cluster
sample size of 400; the numbers above each column represent the MDIs for 10 households per
cluster for the given COV and cluster sample size assumption.
As shown in Figure VI.4, with the cluster sample size of 250 and a sample of 10 households
per cluster, we would be able to detect an increase of only 2.55 kWh in electricity consumption if
the COV is 2. This is shown by the green column to the far right of the figure. The MDI
increases, meaning our ability to detect smaller impacts decreases, as the COV becomes larger.
With the same sample sizes, we will be able to detect electricity consumption of 3.82 kWh, 5.09
kWh, 6.37 kWh, 12.73 kWh, and 19.1 kWh as the COV increases to 3, 4, 5, 10, and 15, as
represented by the green columns from right to left in Figure VI.4.
Increasing the cluster sample size from 250 to 400 decreases MDIs only modestly—with a
cluster sample size of 400 and 10 households per cluster—we can detect increases in electricity
consumption between 2.01 kWh and 15.05 kWh as the COV ranges between 2 and 15. This is
shown by the blue columns in Figure VI.4, going from right to left. Finally, varying the number
of households per cluster—between 8 and 12—likewise has modest effects on MDIs as
represented by the error bars above each of the columns.

LIBERIA ENERGY EVALUABILITY ASSESSMENT FINAL REPORT MATHEMATICA POLICY RESEARCH
60
Figure VI.4. Minimum detectable impacts for unconnected end users
Notes: MDI calculation is based on a confidence interval of 95 percent, two-tailed tests, 80 percent power, 10 percent non-response rate for surveys, a pre-post correlation of 10 percent and an R-squared of 0.1. Information on baseline mean is from the World Bank WTP survey of unconnected households in Monrovia.
kWh= Kilowatt-hour.
While MDIs vary widely depending on the COV, the impacts presented in Figure VI.4 are
lower than the electricity consumption estimates for newly connected households assumed in the
ERR calculation, suggesting that we would capture even smaller changes in consumption. In
fact, average monthly electricity consumption per connection for newly connected D1 residential
customers is assumed to be 24.1 kWh. However, actual increases in electricity consumption for
households along the Kakata Corridor might be lower than 24.1 kWh as the ERR calculations are
based on KPI data from LEC. This data is likely for Monrovia customers who may have higher
rates of consumption but we will not be able to understand consumption habits until customers
are connected.
We recommend a sample size of 250 clusters with 10 households per cluster, which will
result in a total household sample size of 2,500. With this sample size, we will be able to detect
modest changes in average monthly electricity consumption as long as the COV is within the
range assumed for the calculations presented above (2-15). However, our ability to detect smaller
impacts will be significantly impaired if the actual COV in Liberia is as high as the one observed
in Tanzania. We will reassess sample size estimates if we obtain actual SD estimates and
examine data from the first small end user study to calculate estimates among our sample.
5. Key outcomes
We will measure end user impacts across the same domains as those described for connected
households and small businesses. However, we will benefit from the ability to conduct a true
baseline survey and can therefore collect information on a wider range of outcomes. We will also

LIBERIA ENERGY EVALUABILITY ASSESSMENT FINAL REPORT MATHEMATICA POLICY RESEARCH
61
collect information on one additional domain, connection rates, which we expect to increase due
to increased availability of electricity, improved T&D infrastructure, lower tariffs, and improved
ability of LEC to make connections. A sample of the outcomes we plan to collect for
unconnected households and small businesses are shown in Table VI.6.
Table VI.6. Outcomes, by domain, for unconnected end users
Domain
(disaggregated by gender of
household head or enterprise owner) Outcomes
Connection rates Overall connection rate to grid electricity
Energy use Grid electricity use
Liquid fuel use
Generator ownership
Energy-intensive appliance ownership and use
Consumption of amount of light (in lumen-hours)
Cost savings
Education and child time use Hours children study at night
Enrollment in school
Hours doing chores
Health and safety Child sick in past 7 days
Adult sick in past 7 days
Perceived safety at night
Business and adult time use Number of income-generating activities (IGAs)
Types of IGAs
Hours of IGA operations
Paid employment
Hours worked
Hours of household chores
Economic well-being Household consumption
Household income and expenditures
Household assets
Property values
Poverty measures
6. Data sources
We will use a variety of administrative and primary survey data for the evaluations of end
users’ outcomes. The administrative data are critical to the evaluation design and sampling,
whereas the primary survey data will provide information on end users’ background
characteristics and study outcomes. In this section, we describe the administrative data sources
and the proposed primary surveys.
a. Administrative data from LEC and LISGIS
We will use information, data, and maps from LEC and LISGIS in the first stages of
sampling. First, for the study of connected end users in Monrovia, we will identify areas with a
high concentration of connected small end users using LEC’s list of communities with a
functional distribution network. Second, we will use geo-referenced maps of EAs that LISGIS
used for the 2008 Liberian census to identify enumeration areas that fall under the currently
connected communities. The geo-referenced EA maps will also inform the analysis of
unconnected end users. Finally, for the study of medium and large businesses and public

LIBERIA ENERGY EVALUABILITY ASSESSMENT FINAL REPORT MATHEMATICA POLICY RESEARCH
62
institutions, we will use a business listing from LISGIS, LEC, or the Chamber of Commerce to
generate the sampling frame for the evaluation of large end users.
b. Grid expansion maps
We will use geo-referenced grid expansion maps for the corridors where T&D infrastructure
will be constructed to understand the location of substations, transmission lines, transformers,
and distribution lines vis-à-vis communities and potential end users. These maps will enable us
to identify the intervention and comparison groups based on the catchment areas of the planned
grid expansions.
c. Satellite imagery data
We will use high-resolution satellite imagery data to assess the variations in natural
geography, such as topographical features. We will derive slope and elevation data from the
NASA Shuttle Radar Topography Mission (SRTM), publicly available from the NASA Jet
Propulsion Laboratory (http://www2.jpl.nasa.gov/srtm/). This data is retrieved from a sensor on
the space shuttle Endeavor, recorded during a 11-day February 2000 mission; multiple orbits
provided the ability to use radar to map the surface of the earth from multiple angles, providing
enough information to calculate both elevation and derivative slope estimates. In 2015, NASA
released an updated version of this data for all of Africa providing 30 meter resolution
information on both slope and elevation. Accuracy for this product is variable globally, but
vertical height estimates are known to be accurate within 20 meters.
We will use a number of primary data sources for the end user evaluations, including a
community or neighborhood survey; a household and small enterprise listing; and in-person
household and small business, enterprise, and public institution surveys. Table IV.7 provides a
summary of these primary surveys, the sample sizes involved, the timing, and the types of
information they will be designed to collect.
Table VI.7. Quantitative sampling and data collection for end users’
outcomes (primary data sources)
Data sources Sample size Timing
Relevant instruments or
modules
Community survey 30 communities in Monrovia
500 communities total: 125 intervention and 375 comparison communities for a 1:3 ratio to improve matching in Greater Monrovia (if feasible, note until we cannot assess feasibility until we receive distribution maps)
Baseline
Interim
Follow-up
Community composition
Electricity access
Household and small business listing
Households and businesses in ~30 communities in Monrovia
Households and businesses in ~500- communities in Greater Monrovia
Baseline only Background characteristics
Electricity access

LIBERIA ENERGY EVALUABILITY ASSESSMENT FINAL REPORT MATHEMATICA POLICY RESEARCH
63
Data sources Sample size Timing
Relevant instruments or
modules
Household and small enterprise survey
1,500 connected end users in Monrovia
2,500 unconnected small end users in Greater Monrovia
Baseline
Interim
Follow-up
Electricity access
Sources and amount of energy used
Energy expenditures
Adult and child time use
Education
Health and safety
Employment
Income
Background characteristics
Enterprise survey* Public institution survey~
400-500 medium and large businesses and public institutions
Baseline
Interim
Follow-up
Number of employees
Electricity and other energy costs
Expenditures on generators and surge protectors
Revenue*
Service provision~
d. Community survey
We will administer a community survey at baseline, interim, and follow-up in each of the
communities or neighborhoods selected for the evaluation of unserved end users. The survey
obtain information on community characteristics and the potential for electricity use and enable
us to improve the match of the intervention and comparison areas for the evaluation of
unconnected end users. We will use the follow-up survey to estimate possible impacts on
community-level outcomes such as operations of local schools and hospitals, prices of energy-
related commodities such as liquid fuel, and in-migration. We will also assess non-technical
losses, or energy theft, in communities to assess changes over time.
e. Household and small business listing
We will conduct a census to create a listing of all households and small businesses in each
selected EA for the connected and unconnected end-user evaluations. These listings will yield
data on background characteristics of end users, including their basic demographic information
and electricity access or connection status. These listings will also serve as our sampling frame
and will be conducted only at baseline.
f. Household and small business survey
We will collect household and small business survey data during three rounds of in-person
interviews, at baseline, interim, and at follow-up to estimate the impacts of Activities 1 and 2 on
end users. The surveys will collect information on electricity access, sources and amounts of
energy used from different sources, and energy expenditures, including data on electricity,
generators, and other electricity-intensive appliances. The surveys will include questions related
to children’s time spent studying at night, enrollment in school, and perceptions of safety. To
investigate the impact on the intra-household allocation of resources and gender disaggregated
impacts, the surveys will ask about the amount of time adult household members use electricity,
specifically, how much time women and men spend cooking and doing other household chores

LIBERIA ENERGY EVALUABILITY ASSESSMENT FINAL REPORT MATHEMATICA POLICY RESEARCH
64
that require electricity within the household. We will also inquire about working for income
outside of the household in positions that rely on electricity. In addition, the survey will include
standard batteries of income, expenditure, and consumption questions, such as those used by the
Living Standard Measurement Study to measure households’ standard of living. Finally, to
assess impacts on small business activities, the survey will include questions related to any
income-generating activities (IGAs) households operate, including the type of the IGAs, whether
owned by females, number of employees, whether the IGAs use electricity, and their revenues.
The baseline survey will yield information on key background characteristics, including the
household’s socioeconomic status and the gender and age of each of its members. We will use
these background characteristics to create subgroups for the impact analysis and as control
variables in regression models to improve the precision of the impact estimates. During the
baseline survey, we will also collect geographic positioning system coordinates of the
households and small businesses and contact information so we can easily find the households
again at follow-up; information might include family and business contacts, current places of
employment or school, and cell phone numbers.
We will survey the same set of households and small businesses at baseline, interim, and
follow-up, recognizing that there will be attrition from the sample as some households will have
moved out of the community. We will implement methods to reduce attrition, such as obtaining
comprehensive contact information from respondents. If attrition from the sample is high, we
will discuss with MCC the option of sampling a few of these mobile households for follow-up at
their new locations. We may also want to consider surveying new households that moved into
these communities.
g. Enterprise and public institution survey
We will administer in-person surveys for the evaluation of medium and large businesses and
large public institutions. As in the household survey, the enterprise and public institution survey
will measure use of grid electricity, reliability, and quality of access. The survey will gather
information on the hours that a business operates and its use of electric lighting and other
electrical equipment. The survey will ask about recent expenditures on capital, including
electrical equipment, other equipment or machines, and repairs. To estimate workers’
productivity, the survey will ask about business revenue, the number of employees, and their
hours of work. Finally, the enterprise survey will collect data on the characteristics and locations
of the businesses to help us to estimate impacts for different types of businesses and by
community characteristics.

LIBERIA ENERGY EVALUABILITY ASSESSMENT FINAL REPORT MATHEMATICA POLICY RESEARCH
65
VII. COST-BENEFIT ANALYSIS & BENEFICIARY ANALYSIS
The economic and beneficiary analysis of the Liberia Energy Project estimates the pre-
program ERRs based on the best available parameter values related to the benefits and costs of
the project. In this section, we describe MCC’s pre-program ERR model, including the ERR
model components and critical assumptions, and the beneficiary analysis. We then include a
short discussion of our proposed approach in updating the ERRs upon the completion of the
impact and performance evaluations of Activities 1 and 2. Our assessment of the ERR model and
beneficiary analysis is based on the descriptions in the investment memo and the MCC ERR
calculation spreadsheet.
A. Pre-intervention ERR model
The ERR is computed using the estimated economic value of total costs and the benefits of
the Liberia Energy Project activities. The ERR model assumes that benefits in the form of
increased electricity consumption are aggregated across all beneficiaries. These benefits will
accrue to two groups to whom increased and improved-quality electricity will be made available:
(1) existing customers already connected to the grid, and (2) new customers who will connect to
the grid as a result of the project activities. The beneficiaries in each group include:
D1: low-income single-phase residential customers;
T1: medium- and high-income single-phase residential, small commercial, GoL, and
nongovernmental organization (NGO) customers; Also may include three-phase
residential and business customers;
T2: three-phase commercial, GOL, and NGO customers; and
T3: customer transformer (CT)-metered commercial and GOL customers.
For all of the beneficiaries mentioned above, the ERR model calculates the benefit over the
life of the project. The benefits for all consumers and all costs are then discounted to the present.
The ERR is the social discount rate ( ) at which the discounted net benefits are equal to zero.
Specifically:
(VII.1) 1
1 0
1tt
t
ERR at which NB
,
where tNB reflects the net benefits in year t, with t ranging from 1 to , the time horizon. In the
MCC model, the time horizon is 20 years.
For the Liberia Energy Project, MCC calculated two versions of the ERR. Both versions have
the same total estimated benefits resulting from increased consumption of electricity. However,
one version includes only the costs of the Mt. Coffee Rehabilitation Activity, and the second
includes this activity and the costs of the Capacity Building and Sector Reform, Mt. Coffee
Support, and the LEC Training Center activities. The ERR calculations do not include the costs
or benefits of the GSI investments, which are relatively small in comparison to other activities.
Both versions of the ERR are estimated for five demand scenarios, depending on LEC’s capacity
LIBERIA ENERGY EVALUABILITY ASSESSMENT FINAL REPORT MATHEMATICA POLICY RESEARCH
66
and speed to connect customers and customer demand for connections. The estimated ERRs
range between 5 and 13 percent, under different demand scenarios, when only the costs of
investments in the Mt. Coffee Rehabilitation Activity are counted, and between 3 and 11 percent
when costs of investments in all activities are counted. Beyond the demand scenarios, the
investment memo does not provide details of a sensitivity analysis to estimate the robustness of
the model. To fill this gap, MCC’s ERR calculation spreadsheet includes a sensitivity analysis
where the ERRs were estimated for a range of plausible values for three other parameters,
including the actual MCC costs as a percentage of expected costs, the actual benefits as a
percentage of actual benefits, and baseline capacity factor for unconnected large users.
1. Main components of the ERR model
The ERR model includes several benefit and cost components directly linked to the Energy
Project activities, but the benefits in the ERR model are described as benefits of the Mt. Coffee
Rehabilitation Activity. These benefits include two major streams directly related to the
increased supply and reliability of electricity. The first is the benefit accruing to newly connected
households and firms from increased electricity consumption. The second is the benefit accruing
to already connected households and firms from lower expenditures on their current electricity
consumption and increased consumption, both resulting from tariff reduction. Both benefit
streams are calculated using a consumer surplus model, where the surplus for each consumer is
based on the difference between consumers’ willingness to pay (WTP) for electricity
consumption and the actual price paid or the tariff rate. The overall benefit is the grand total or
consumer surpluses across all existing and new consumers. The assumption is that the WTP
measures how a consumer internalizes all the benefits attached to increased electricity
consumption. These measures were derived from a WTP study conducted by the World Bank in
2010 that surveyed a random sample of 479 households without access to grid electricity and
another 479 households connected to the electric grid in Monrovia. We discuss the reliability of
this assumption in the next section.
Beyond the activity to rehabilitate Mt. Coffee, the ERR model does not include any direct
benefits for the complementary investments under the Capacity Building and Sector Reform, Mt.
Coffee Support, and LEC Training Center activities. The investment memo clearly discusses this
omission and correctly states that the potential benefits of these complementary activities are not
yet quantifiable because the activities are not all fully designed. Furthermore, we believe that
many of the potential benefits of these activities will already be captured in increased consumer
demand for electricity, as described in the revised program logic. For example, the Capacity
Building and Sector Reform Activity will improve the overall functionality of the energy sector,
including improving operations, reducing outages, and improving customer services, which will
in turn lead to increased electricity consumption. Investing in strengthening LEC’s capacity is
necessary to increase demand for grid electricity in Liberia as current capacity is extremely low.
The program logic also shows the interlinkages between the complementary activities and the
Mt. Coffee Rehabilitation Activity in realizing the long-term outcomes of greater economic
opportunities for households, increased business productivity, and improved capacity for public
service provision. Furthermore, the LEC Training Center activity is needed to increase the
number of skilled staff and improve the capacity of LEC to manage all aspects of the grid, which
may lead to connecting additional customers. In contrast, the Mt. Coffee Support Activity is not
necessary to realize the increased demand for electricity. However, as described in the
LIBERIA ENERGY EVALUABILITY ASSESSMENT FINAL REPORT MATHEMATICA POLICY RESEARCH
67
investment memo, some of these investments are needed to mitigate adverse environmental and
social effects associated with the rehabilitation of the MCHPP or to provide additional benefits to
the communities surrounding the MCHPP. However, as described in the investment memo, the
net benefits of this activity is unclear and thus it is reasonable to include the cost of the Mt.
Coffee Support Activity with the assumption that its net benefits are negligible.
On the cost side, the two major components are MCC’s and other donors’ investments in the
rehabilitation of MCHPP and end users’ connection costs. As mentioned earlier, there are two
sets of ERR calculations: one accounts for the Mt. Coffee Rehabilitation Activity costs only, and
the other accounts for the costs of the Compact’s four activities. However, given that all
activities are necessary to achieve program goals, the version of the ERR calculation that
accounts for the costs of all activities is most appropriate. While both versions also include the
end users connection costs, we note that customers in Liberia currently do not pay the out-of-
pocket connection fees. However, because these costs are paid indirectly by either the donor or
LEC (as forgone income), they should be included in in the ERR calculation and MCC does
include them.
Similarly, the pre-program ERRs depend on assumptions about demand for new connections.
Specifically, the ERR calculations assume approximately 90,000 new household and commercial
customer connections in the first five years of the project. Investments in the T&D system by
other donors are critical to achieving this target. The costs of expansion and maintenance of the
T&D network, should be reflected in the tariff rate used to calculate net benefits for the
consumers. However, it is not clear whether MCC’s ERR estimates reflect the costs of
investments made by other donors to expand the T&D network. Specifically, the current
assumptions of tariff rates between $0.26 and $0.29 seems low given the large amount of T&D
investments required to connect the number of new customers forecasted in the ERR model.
MCC could choose to focus on ERRs from its own perspective, including only the costs of its
investments. However, if the tariff rate should reflect the full costs of T&D network expansion
and maintenance, then the current estimates appear to understate the true cost of achieving a
large share of the benefits incorporated in the ERR calculations.
2. Critical assumptions of the ERR model
The estimated ERRs for the Energy Project depend on the assumptions related to the benefit
and cost components in the model. The investment memo describes the major assumptions of the
ERR model related to the consumers’ valuation of electricity consumption, price elasticity of
demand, and household connection costs, such as home wiring. Assumptions are also made on
the price of oil, average tariff rates, the estimated number of new grid customers, capacity factor,
and generation costs. Many of these assumptions are based on Fichtner’s comprehensive
assessment of Liberia’s energy sector (Fichtner 2014). Based on our review of the ERR
assumptions, the Fichtner study, and the World Bank demand assessment study, we found the
assumptions reasonable. Next, we discuss the first three critical assumptions.
Consumer WTP captures their true valuation for electricity consumption. The ERR’s
benefits calculations rely entirely on the willingness to pay figures derived from the World Bank
survey conducted in Monrovia in 2010. Overall, MCC’s calculation of increased consumption as
the primary benefit of the Compact is in line with the program logic. In addition, this

LIBERIA ENERGY EVALUABILITY ASSESSMENT FINAL REPORT MATHEMATICA POLICY RESEARCH
68
methodology, although data-intensive, is straightforward, and several World Bank energy
projects have used WTP to calculate benefits of electrification in recent years (World Bank
2008). In these surveys, however, consumers could overstate their willingness to pay. A study in
Kenya found that consumers’ actual WTP for an electricity connection was far lower than their
initial estimate when faced with a realistic time limit for payment (Lee et al. 2016). However,
when a realistic time limit for payment was used to frame the question, the reported WTP was
consistent with findings derived from varying the price experimentally. Therefore, it is important
to word survey questions appropriately. Furthermore, we expect that existing customers with grid
access will value more reliable electricity; however, it is not clear from the survey description if
the WTP currently measures these customers’ willingness to pay for higher-quality electricity. If
not, future surveys should try to capture this information.
The WTP measures also do not include benefits from externalities. Consumer WTP is likely
to capture their private valuation of increased electricity consumption, but it does not capture any
public benefits. For example, if electricity reduces the use of traditional fuel for cooking, there
might be environmental benefits (reduced external pollution). Similarly, street lighting may
provide a sense of safety and security to Liberians. In addition, consumers’ self-reported WTP
measures are not likely to capture improved public service benefits in health and education. We
recognize that the extent of these benefits is not clear and that they are difficult to measure in the
short term. To the extent these benefits are realized, however, the ERRs for the Liberia Energy
Project will be underestimated.
Price elasticity of demand for already connected consumers is -0.2. The ERR model
assumes a low constant price elasticity of demand for existing grid customers. Therefore, it is
assumed that existing customers will have a small increase in electricity consumption. This
assumption is based on the literature (Bernstein and Griffin 2005; Khanna and Rao 2009).
However, as the supply and reliability of electricity increases with improved customer service,
the price elasticity of demand may shift upward. It is not clear how long that shift might take or
whether the changes will be significant; therefore, the effects of this demand elasticity change in
the future, after discounting, may not have a large effect on the benefits.
Cost of household connection is estimated at $1000 for T1 customers and $500 for D1
customers. The cost of a household connection is likely to vary by the type of household
structure. For example, wiring costs can be very different for household structures made out of
brick as opposed to thatch, as was found in the MCC Tanzania study (Chaplin et al. 2017). In
addition, households beyond a certain distance from an electric line must pay a significantly
higher cost for a connection. It is difficult to estimate connection costs for these different
household structures, but a more accurate average estimate might have a large impact on the
connection cost component of the ERR. For some new connections, the donor may pay
connection costs, rather than the consumer, thus reducing household costs for grid connections.
For example, WB contractors are installing ready boards in end users homes so that LEC is not
needed to connect these households. These connection costs maybe lower if donors secure a bulk
rate for connecting these end users with contractors.

LIBERIA ENERGY EVALUABILITY ASSESSMENT FINAL REPORT MATHEMATICA POLICY RESEARCH
69
B. Beneficiary analysis
The beneficiary analysis of the Energy Project links directly to the ERR model, which
includes calculations of benefit streams for potential beneficiaries. The beneficiary analysis
identifies who would benefit from the Energy Project, defining beneficiaries as individuals that
benefit from the increased availability of electricity through the Compact activities. There are
four groups of potential beneficiaries: (1) connected small end users, (2) unserved end users that
may connect to the grid over the project’s lifetime, (3) connected medium and large enterprises,
and (4) new large customers that may connect to the grid over the project’s lifetime.
In households, both connected and potential new customers, all members of the household
are counted as beneficiaries. MCC expects that 90,000 new residential connections (D1 and T1)
will be made in addition to 12,900 existing connections, for a total number of 102,900 connected
households in the first five years of the project.9 MCC also expects that 15 percent of the 162
large user connections will be residential. Assuming an average household size of 5.1, this will
result in a total of 524,914 beneficiaries.10
MCC also expects a total of 1,450 commercial (T2) connections and 162 industrial (T3)
connections over the first three years of the project. We understand that, for already connected
firms, only the owner was counted as the beneficiary but then was removed because it was
assumed that the owner was already counted as a residential beneficiary. Although these firms
are projected to benefit from the increased consumption of electricity, MCC correctly points out
that it is not clear whether that benefit would result in increases in employee wages or additional
employment because of Liberia’s high unemployment rate. For new commercial and industrial
connections, the investment memo indicates that all expected employees of these firms, based on
expected firm size, and all household members of these expected employees, based on average
household size of 5.1, are counted as beneficiaries. However, many of these potential employees
will likely already belong to a connected household. Most of the new commercial and industrial
connections are expected in Greater Monrovia, and most of the potential employees are also
likely to reside in Greater Monrovia. Therefore, there is a high likelihood of double counting
these beneficiaries.
The beneficiary analysis in the investment memo does not discuss the expected distribution
of impacts by household characteristics or the household head’s age, gender, and socioeconomic
status. Furthermore, impacts will likely vary by localities. Those living near an existing or newly
built electric grid line are expected to experience the greatest improvement in service because of
increased generation and a new or improved distribution system. The beneficiary analysis also
does not examine how benefits to firms would be spread across informal and formal businesses
and small, medium, and large businesses.
9 These estimates are from the ERR calculation spreadsheet.
10 The numbers of beneficiaries reported in the investment memo and in the ERR calculation spreadsheet are
inconsistent. The investment memo reports a beneficiary count of 460,534, which seems to be based on the number
of new connections. We apply the beneficiary count in the ERR calculation spreadsheet as the correct one because it
is in line with the descriptions in the investment memo and the supporting notes in the ERR calculation spreadsheet.
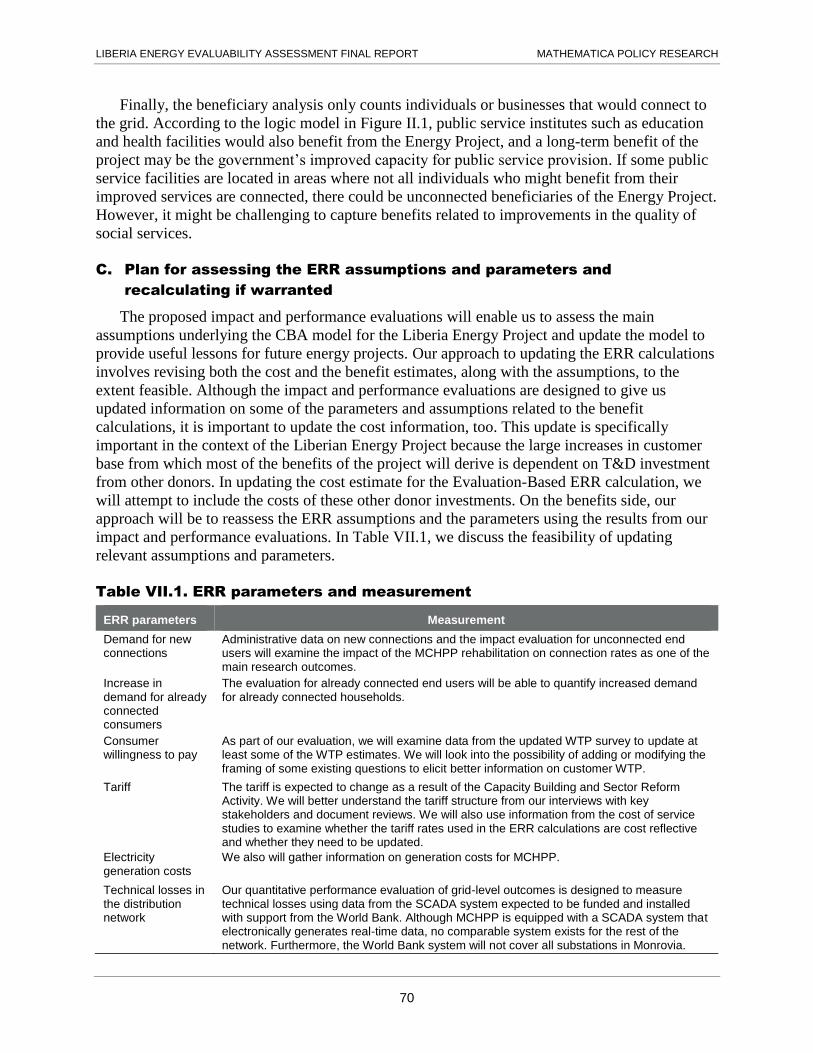
LIBERIA ENERGY EVALUABILITY ASSESSMENT FINAL REPORT MATHEMATICA POLICY RESEARCH
70
Finally, the beneficiary analysis only counts individuals or businesses that would connect to
the grid. According to the logic model in Figure II.1, public service institutes such as education
and health facilities would also benefit from the Energy Project, and a long-term benefit of the
project may be the government’s improved capacity for public service provision. If some public
service facilities are located in areas where not all individuals who might benefit from their
improved services are connected, there could be unconnected beneficiaries of the Energy Project.
However, it might be challenging to capture benefits related to improvements in the quality of
social services.
C. Plan for assessing the ERR assumptions and parameters and
recalculating if warranted
The proposed impact and performance evaluations will enable us to assess the main
assumptions underlying the CBA model for the Liberia Energy Project and update the model to
provide useful lessons for future energy projects. Our approach to updating the ERR calculations
involves revising both the cost and the benefit estimates, along with the assumptions, to the
extent feasible. Although the impact and performance evaluations are designed to give us
updated information on some of the parameters and assumptions related to the benefit
calculations, it is important to update the cost information, too. This update is specifically
important in the context of the Liberian Energy Project because the large increases in customer
base from which most of the benefits of the project will derive is dependent on T&D investment
from other donors. In updating the cost estimate for the Evaluation-Based ERR calculation, we
will attempt to include the costs of these other donor investments. On the benefits side, our
approach will be to reassess the ERR assumptions and the parameters using the results from our
impact and performance evaluations. In Table VII.1, we discuss the feasibility of updating
relevant assumptions and parameters.
Table VII.1. ERR parameters and measurement
ERR parameters Measurement
Demand for new connections
Administrative data on new connections and the impact evaluation for unconnected end users will examine the impact of the MCHPP rehabilitation on connection rates as one of the main research outcomes.
Increase in demand for already connected consumers
The evaluation for already connected end users will be able to quantify increased demand for already connected households.
Consumer willingness to pay
As part of our evaluation, we will examine data from the updated WTP survey to update at least some of the WTP estimates. We will look into the possibility of adding or modifying the framing of some existing questions to elicit better information on customer WTP.
Tariff The tariff is expected to change as a result of the Capacity Building and Sector Reform Activity. We will better understand the tariff structure from our interviews with key stakeholders and document reviews. We will also use information from the cost of service studies to examine whether the tariff rates used in the ERR calculations are cost reflective and whether they need to be updated.
Electricity generation costs
We also will gather information on generation costs for MCHPP.
Technical losses in the distribution network
Our quantitative performance evaluation of grid-level outcomes is designed to measure technical losses using data from the SCADA system expected to be funded and installed with support from the World Bank. Although MCHPP is equipped with a SCADA system that electronically generates real-time data, no comparable system exists for the rest of the network. Furthermore, the World Bank system will not cover all substations in Monrovia.

LIBERIA ENERGY EVALUABILITY ASSESSMENT FINAL REPORT MATHEMATICA POLICY RESEARCH
71
ERR parameters Measurement
Cost of household connection
We will gather information on connection costs for each type of connection from our survey of different types of end users to assess whether the assumptions made in the ERR model need to be updated. The household and small-enterprise surveys will provide information on residential T1 and D1 customers. The large-enterprise survey will provide information on commercial (T2) and industrial (T3) customers. We will also try to assess whether and to what extent true cost of connecting (wiring plus connection fee) varies by different types of households and businesses.
Beneficiary population
The impact evaluation will provide data on the distribution of benefits of increased electricity supply and reliability across the population and for different subgroups.

This page has been left blank for double-sided copying.

LIBERIA ENERGY EVALUABILITY ASSESSMENT FINAL REPORT MATHEMATICA POLICY RESEARCH
73
VIII. DATA COLLECTION
As described, we will collect existing administrative and primary data, as well as
documentation, from numerous sources to answer the research questions throughout the course
of the evaluation. In the next section, we describe our instrument development and data
collection approach, as well as how we ensure high quality data collection. We also present an
overview of data collection training and data processing practices.
A. Local data collection partners
We will initiate a competitive process to identify a local data collection partner for the
quantitative and qualitative data collection activities. The competitive procurement will help
identify high-quality data collection firms while ensuring competitive costs. The selection of the
firms will depend on the capabilities and cost of the firms that respond to the call for proposals,
including their experience, expertise, and capacity to meet the needs of our data collection effort.
We expect the same firm conducting the quantitative data collection will also conduct the
qualitative data collection.
B. Approach to collecting high quality data
The evaluation’s success depends on the collection of high quality data, particularly the
accuracy, reliability, and timeliness of the data. We will actively anticipate risks and minimize
threats to quality that are inherent in the data collection process. Prior to undertaking any data
collection efforts, we will provide detailed data collection plans, safety measures, and procedures
for obtaining all necessary permissions from local authorities. We will submit these to MCC and
MCA-Liberia for approval prior to any fieldwork. Survey instruments and protocols will also be
submitted for review and input from MCC, MCA-L, and possible additional stakeholders.
We will ensure high quality data by providing thorough and consistent oversight on all
aspects of the data collection process. Due to the limited technical capacity available in Liberia,
Mathematica anticipates a greater-than-normal level of involvement in the training and oversight
of the data collection efforts. We will work closely with the local data collection firm and
oversee all their efforts, from identifying and training enumerators to developing teams,
conducting interviews, transcribing and translating, preliminary coding, and submitting data for
analysis. Mathematica and the local data collector may conduct some of the high-level interviews
jointly. To ensure that protocols are properly followed, Mathematica will conduct interviewer
observations and attend interviewer debriefings.
In addition to overseeing data collection, we will develop and test all qualitative and
quantitative instruments. For qualitative approaches, we will develop tailored protocols for each
round of data collection. The protocols will cover similar themes across respondents to facilitate
triangulation of responses. For the quantitative data, we propose using a computer-assisted
personal interviewing (CAPI) system on tablets, such as the Survey Solutions platform
developed by the World Bank, which would enable us to review the data and conduct
consistency checks on an ongoing basis. The system is designed to work in low-resource
countries by operating with a user-friendly format on a variety of tablets. A CAPI system greatly
increases data quality by controlling the skip pattern, removing the need for data entry, and
reducing survey administration time. The program is also password-protected, and once
LIBERIA ENERGY EVALUABILITY ASSESSMENT FINAL REPORT MATHEMATICA POLICY RESEARCH
74
synchronized, the data are uploaded to a cloud server and not stored on the tablet, increasing data
security and protection of PIIs in case of loss or theft of the tablet.
C. Data collection training
Mathematica evaluation team members will travel to Liberia for training, pre-testing of
survey instruments and protocols, and field observations for each data collection round. For
qualitative interviews, Mathematica may conduct some interviews jointly with the local firm for
interviews with high-level stakeholders. The local data collection firm will transcribe the
interviews and provide verbatim translations when necessary. The firm will also clean the data,
which will include reviewing transcripts for fidelity to the recordings, adding definitions of
acronyms and jargon, and adding notes for context.
Prior to the fieldwork, we will conduct pre-tests to assess whether respondents can interpret
the items as intended, whether the answer options are appropriate, and whether there is variation
in responses. Mathematica will participate jointly with our local partners to train interviewers
and monitor the data collection effort. We will put in place data collection and data entry
procedures to minimize risks to data quality. For qualitative data, we will follow best practices to
minimize any risk, including recording, transcribing, and translating (verbatim) all interviews so
the analysis can be done using the raw data rather than notes taken during the session. We will
also adapt the survey instruments and protocols based on what is being learned in the field, when
appropriate, and regularly review data to ensure that they are internally consistent and that they
meet our rigorous quality standards.
D. Timing of data collection activities
We will collect qualitative and quantitative data in a manner that maximizes efficiency and
minimizes costs. First, as stated, the implementation and performance analyses will be conducted
in an ongoing, iterative process that reflects program implementation, as opposed to a limited
schedule of traditional data collection cycles that can miss key events, processes, and milestones.
We anticipate collecting data on the following schedule:
Administrative data (when they become available) on a quarterly basis
Documentation on an ongoing, rolling basis as key materials become available
Key informant interviews at project initiation and annually thereafter, or on an as-needed
basis, either in person or by telephone
Stakeholder interviews with businesses and focus group discussions with household
members at three time points, aligned with quantitative data collection
Site visits at three time points, aligned with quantitative data collection
The timing, along with the sample sizes and key instruments/modules for qualitative and
quantitative data collection activities are summarized in Table VIII.1 and Table VIII.2,
respectively. We also indicate the exposure periods, which we define as the estimated number of
months required for the intervention to produce the expected improvements on listed outcomes.

LIBERIA ENERGY EVALUABILITY ASSESSMENT FINAL REPORT MATHEMATICA POLICY RESEARCH
75
Table VIII.1. Qualitative data collection summary
Data
collection
Timing
(include
multiple
rounds)
Sample Unit
/
Respondent
Sample
Size
Relevant instruments/
modules (Abbreviated from
Tables IV.2 and V.2 ) Exposure Period (Identified in months as feasible)
Document
review
Regularly
throughout
evaluation
N/A N/A Grid-level and infrastructure changes
Tracking of laws, policies, regulations
Tracking of energy production
LERC documentation
Identification of modernization processes affecting market structure, and sector governance and performance
Documentation of how Activities 1 and 2 have affected new connections and energy consumption in Greater Monrovia
Documentation of the MSC’s efforts to strengthen LEC’s capacity
The exposure period between intervention and
observable outcomes will vary based on the activity and
outcomes of interest. For example, we estimate an
exposure period of:
12 months to 3 years for infrastructure changes to be
operational and observable
24 months for the LERC to become operational and
influence laws, policies, and regulations
36 months for the LERC and greater energy
production to influence measurable changes in the
market structure
12-36 months from when MCHHP produced high
quality electricity for end user consumption to
measureably change
6-12 months from when the MSC is operational for
changes in LEC’s capacity to be measureable
Note that we began reviewing documents for the EA
report in 2017 and will continue to review documentation
throughout the evaluation and post Compact so that we
can assess changes in outcomes over time and based
on implementation. We expect to formalize the document
review process in September 2018 as we develop the full
conceptual map and refine tools that guide the document
review process.

LIBERIA ENERGY EVALUABILITY ASSESSMENT FINAL REPORT MATHEMATICA POLICY RESEARCH
76
Data
collection
Timing
(include
multiple
rounds)
Sample Unit
/
Respondent
Sample
Size
Relevant instruments/
modules (Abbreviated from
Tables IV.2 and V.2 ) Exposure Period (Identified in months as feasible)
Interviews
with key
informants
and
stakeholders
*Conducted
by
Mathematica
10/2018 and
annually
thereafter, or
more often if
needed based
on key
milestones and
events
MCHPP 2 Implementation:
Compact design, planning, execution, and sustainability
Implementation of each activity and sub-activity, including SWOT analysis
Perceptions of LEC and LERC functioning
Overall donor coordination and SWOT analysis of multiple donor model
Assessment of and challenges to sustainability of Compact investments
Grid outcomes:
Perceptions of changes in electricity production, T&D, and consumption
We expect implementation outcomes to begin
materializing in 2018 with the month varying depending
on activity. For example, we estimate an exposure period
of:
6-12 months from when the MSC is operational for
changes in LEC’s capacity to be measureable. Note
that the MSC became operational in January 2018.
36 months for the LERC and greater energy
production to influence measurable changes in the
market structure. We note that the exposure time
between MME and LERC activities and outcomes
depends upon government appointments and staffing
but we expect a longer interval given the nature of their
activities.
We will keep abreast of activities to determine the most
appropriate time to conduct interviews. We aim to follow
progress regularly throughout the evaluation.
MME and LERC
4-6
LEC, MSC, CMC
4-6
MCA, EU, KfW, NORAD, Power Africa, and the World Bank
6-10
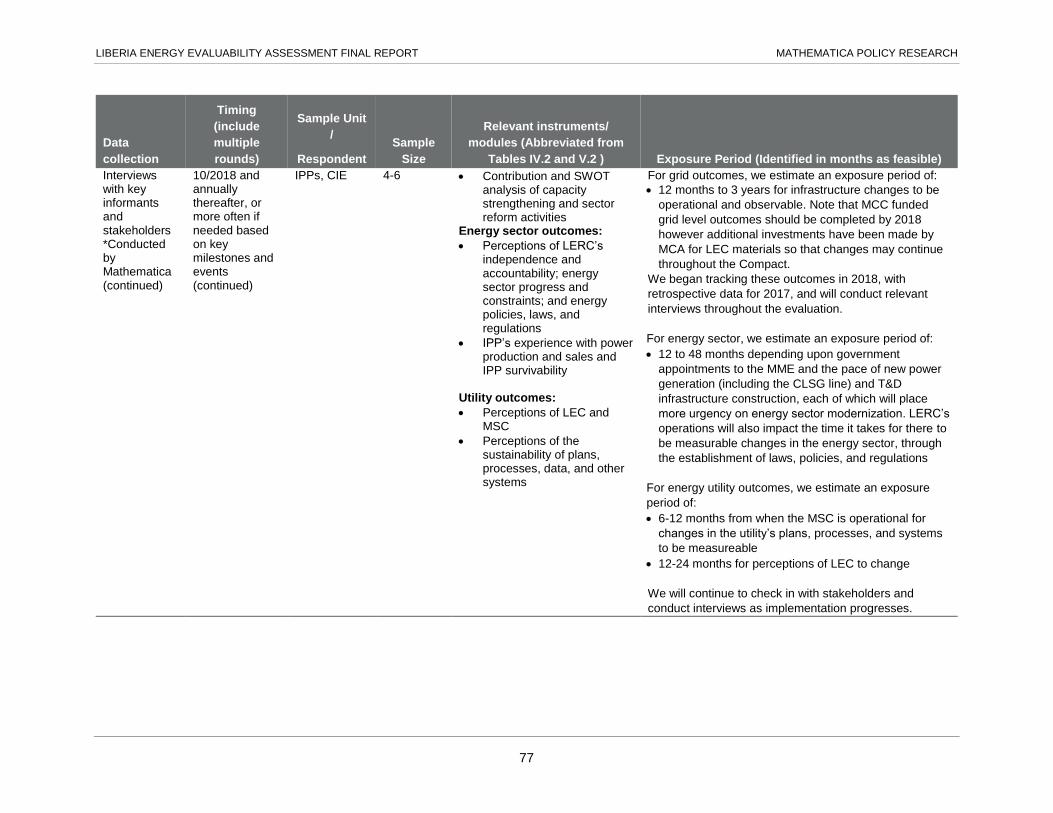
LIBERIA ENERGY EVALUABILITY ASSESSMENT FINAL REPORT MATHEMATICA POLICY RESEARCH
77
Data
collection
Timing
(include
multiple
rounds)
Sample Unit
/
Respondent
Sample
Size
Relevant instruments/
modules (Abbreviated from
Tables IV.2 and V.2 ) Exposure Period (Identified in months as feasible)
Interviews with key informants and stakeholders *Conducted by Mathematica (continued)
10/2018 and annually thereafter, or more often if needed based on key milestones and events (continued)
IPPs, CIE 4-6 Contribution and SWOT analysis of capacity strengthening and sector reform activities
Energy sector outcomes:
Perceptions of LERC’s independence and accountability; energy sector progress and constraints; and energy policies, laws, and regulations
IPP’s experience with power production and sales and IPP survivability
Utility outcomes:
Perceptions of LEC and MSC
Perceptions of the sustainability of plans, processes, data, and other systems
For grid outcomes, we estimate an exposure period of:
12 months to 3 years for infrastructure changes to be
operational and observable. Note that MCC funded
grid level outcomes should be completed by 2018
however additional investments have been made by
MCA for LEC materials so that changes may continue
throughout the Compact.
We began tracking these outcomes in 2018, with
retrospective data for 2017, and will conduct relevant
interviews throughout the evaluation.
For energy sector, we estimate an exposure period of:
12 to 48 months depending upon government
appointments to the MME and the pace of new power
generation (including the CLSG line) and T&D
infrastructure construction, each of which will place
more urgency on energy sector modernization. LERC’s
operations will also impact the time it takes for there to
be measurable changes in the energy sector, through
the establishment of laws, policies, and regulations
For energy utility outcomes, we estimate an exposure
period of:
6-12 months from when the MSC is operational for
changes in the utility’s plans, processes, and systems
to be measureable
12-24 months for perceptions of LEC to change
We will continue to check in with stakeholders and
conduct interviews as implementation progresses.
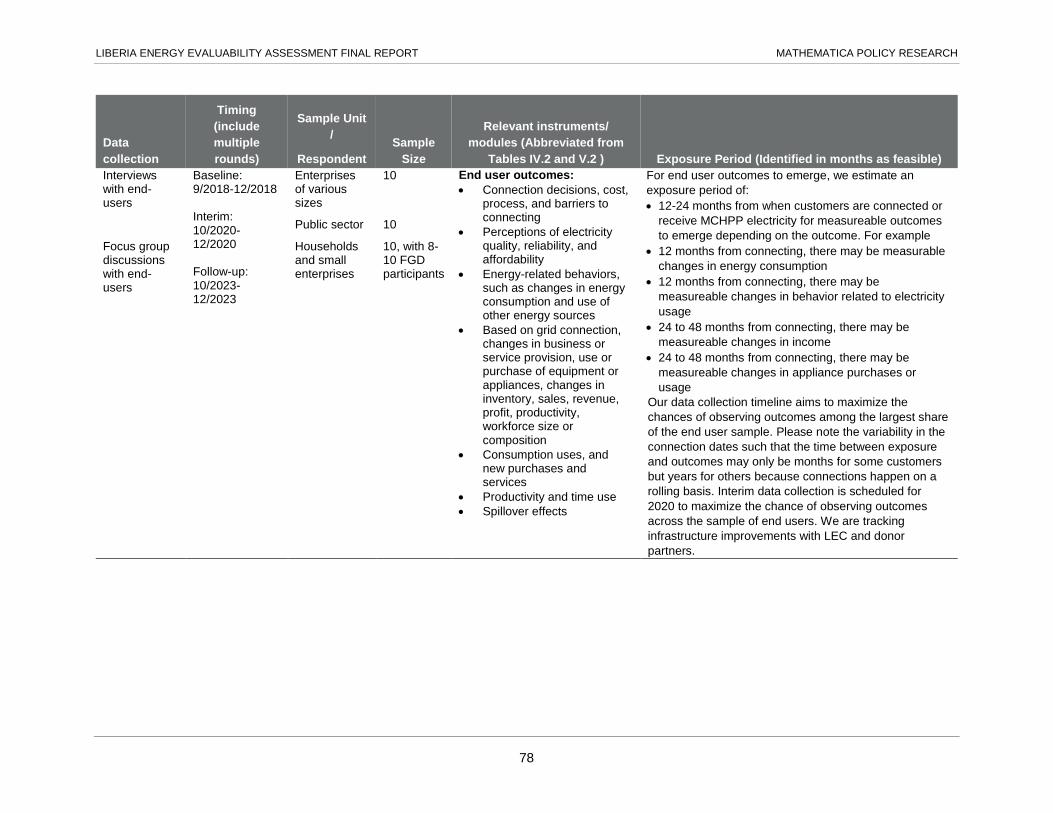
LIBERIA ENERGY EVALUABILITY ASSESSMENT FINAL REPORT MATHEMATICA POLICY RESEARCH
78
Data
collection
Timing
(include
multiple
rounds)
Sample Unit
/
Respondent
Sample
Size
Relevant instruments/
modules (Abbreviated from
Tables IV.2 and V.2 ) Exposure Period (Identified in months as feasible)
Interviews with end-users
Baseline: 9/2018-12/2018 Interim: 10/2020-12/2020 Follow-up: 10/2023-12/2023
Enterprises of various sizes
10 End user outcomes:
Connection decisions, cost, process, and barriers to connecting
Perceptions of electricity quality, reliability, and affordability
Energy-related behaviors, such as changes in energy consumption and use of other energy sources
Based on grid connection, changes in business or service provision, use or purchase of equipment or appliances, changes in inventory, sales, revenue, profit, productivity, workforce size or composition
Consumption uses, and new purchases and services
Productivity and time use
Spillover effects
For end user outcomes to emerge, we estimate an
exposure period of:
12-24 months from when customers are connected or
receive MCHPP electricity for measureable outcomes
to emerge depending on the outcome. For example
12 months from connecting, there may be measurable
changes in energy consumption
12 months from connecting, there may be
measureable changes in behavior related to electricity
usage
24 to 48 months from connecting, there may be
measureable changes in income
24 to 48 months from connecting, there may be
measureable changes in appliance purchases or
usage
Our data collection timeline aims to maximize the
chances of observing outcomes among the largest share
of the end user sample. Please note the variability in the
connection dates such that the time between exposure
and outcomes may only be months for some customers
but years for others because connections happen on a
rolling basis. Interim data collection is scheduled for
2020 to maximize the chance of observing outcomes
across the sample of end users. We are tracking
infrastructure improvements with LEC and donor
partners.
Public sector 10
Focus group discussions with end-users
Households and small enterprises
10, with 8-10 FGD participants

LIBERIA ENERGY EVALUABILITY ASSESSMENT FINAL REPORT MATHEMATICA POLICY RESEARCH
79
Data
collection
Timing
(include
multiple
rounds)
Sample Unit
/
Respondent
Sample
Size
Relevant instruments/
modules (Abbreviated from
Tables IV.2 and V.2 ) Exposure Period (Identified in months as feasible)
Site visits Baseline: 9/2018-12/2018 Interim: 10/2020-12/2020 Follow-up: 10/2023-12/2023
MCHPP and substations T&D infrastructure
TBD Operational processes and systems
Procedures to handle equipment failure,
Use of data management systems and communication procedures
Functionality of infrastructure
Again, for infrastructure related outcomes, we estimate
an exposure period of:
12 months to 3 years for infrastructure changes to be
operational and observable. Note that MCC funded
grid level outcomes should be completed by 2018
however additional investments have been made by
MCA for LEC materials so that changes may continue
throughout the Compact. We have conducted several
site visits during the project launch and in September
2018.
Also, for utility related outcomes, we estimate an
exposure period of:
6-12 months from when the MSC is operational for
changes in the utility’s plans, processes, and systems
to be measureable

LIBERIA ENERGY EVALUABILITY ASSESSMENT FINAL REPORT MATHEMATICA POLICY RESEARCH
80
Table VIII.2. Quantitative data collection summary
Data collection
Timing
MM/YYYY
Sample Unit/
Respondent
Sample
Size
Relevant instruments/
modules
Exposure Period (months) (Identified in months as
feasible)
Administrative data from LEC, LERC, MME
Monthly N/A N/A Grid outcomes such as electricity production, voltage stability, peak demand shortage, technical losses, and number of customers
Energy sector outcomes such as cost recovery rates; number, size, and type of IPPs, and tariffs across user types
End-user outcomes such as number of applications, wait time for connection, and customer satisfaction with LEC
Utility outcomes such as technical and financial efficiency, staff productivity and retention, collection rates, and energy forecasts
The quantitative data collection will focus on both administrative date that measures changes at the level of the utility and energy sector, as well as field data collection that focuses on measuring outcomes among end users
Again, for utility related outcomes, we estimate an
exposure period of:
6-12 months from when the MSC is operational for changes in the utility’s plans, processes, and systems to be measureable and for changes in generation, transmission, the number of customers and customer consumption, and electricity reliability and quality.
Small end user listing (households and small businesses)
Baseline: 9/2018
Connected EAs (communities) in Monrovia Unconnected communities in Greater Monrovia
All households / businesses in 30 EAs All households / businesses in ~500 communities (if it is feasible to select 1:3 ratio of comparison communities
Background characteristics
Electricity access
For end user outcomes to emerge, we estimate the
exposure period will vary by outcome (as describe
above) an may vary from:
12 to 24 months from when customers are
connected or receive MCHPP electricity for
measureable outcomes to emerge such as in
consumption, energy related rebahviors, time use,
appliance ownership and usage.
12 to 24 months from when customers are
connected or receive MCHPP electricity for
measureable outcomes to emerge at the community
level such as changes in markets, safety, the
number of households or households moving into a
connected area.
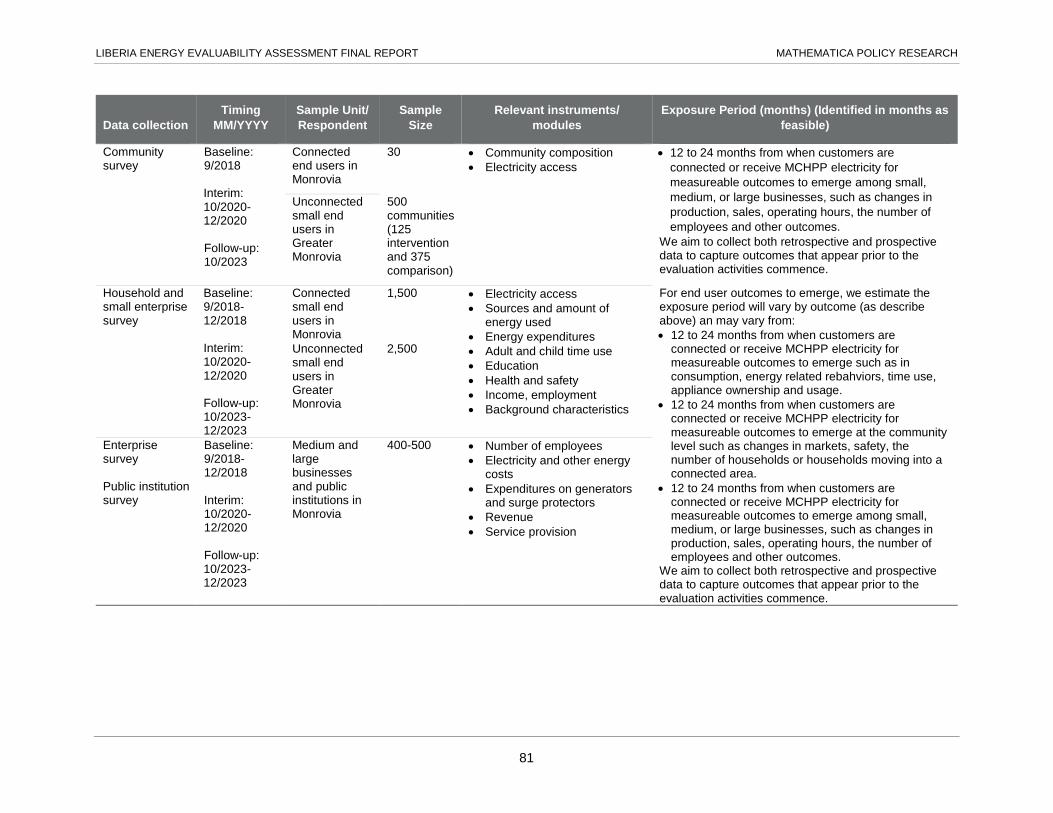
LIBERIA ENERGY EVALUABILITY ASSESSMENT FINAL REPORT MATHEMATICA POLICY RESEARCH
81
Data collection
Timing
MM/YYYY
Sample Unit/
Respondent
Sample
Size
Relevant instruments/
modules
Exposure Period (months) (Identified in months as
feasible)
Community survey
Baseline: 9/2018 Interim: 10/2020-12/2020 Follow-up: 10/2023
Connected end users in Monrovia
30 Community composition
Electricity access
12 to 24 months from when customers are
connected or receive MCHPP electricity for
measureable outcomes to emerge among small,
medium, or large businesses, such as changes in
production, sales, operating hours, the number of
employees and other outcomes.
We aim to collect both retrospective and prospective data to capture outcomes that appear prior to the evaluation activities commence.
Unconnected small end users in Greater Monrovia
500 communities (125 intervention and 375 comparison)
Household and small enterprise survey
Baseline: 9/2018-12/2018 Interim: 10/2020-12/2020 Follow-up: 10/2023-12/2023
Connected small end users in Monrovia
1,500 Electricity access
Sources and amount of energy used
Energy expenditures
Adult and child time use
Education
Health and safety
Income, employment
Background characteristics
For end user outcomes to emerge, we estimate the exposure period will vary by outcome (as describe above) an may vary from:
12 to 24 months from when customers are connected or receive MCHPP electricity for measureable outcomes to emerge such as in consumption, energy related rebahviors, time use, appliance ownership and usage.
12 to 24 months from when customers are connected or receive MCHPP electricity for measureable outcomes to emerge at the community level such as changes in markets, safety, the number of households or households moving into a connected area.
12 to 24 months from when customers are connected or receive MCHPP electricity for measureable outcomes to emerge among small, medium, or large businesses, such as changes in production, sales, operating hours, the number of employees and other outcomes.
We aim to collect both retrospective and prospective data to capture outcomes that appear prior to the evaluation activities commence.
Unconnected small end users in Greater Monrovia
2,500
Enterprise survey Public institution survey
Baseline: 9/2018-12/2018 Interim: 10/2020-12/2020 Follow-up: 10/2023-12/2023
Medium and large businesses and public institutions in Monrovia
400-500 Number of employees
Electricity and other energy costs
Expenditures on generators and surge protectors
Revenue
Service provision

LIBERIA ENERGY EVALUABILITY ASSESSMENT FINAL REPORT MATHEMATICA POLICY RESEARCH
82
For the impact evaluation, we plan to conduct baseline data collection in autumn 2018 for
connected households in Monrovia and hopefully among unconnected households in Greater
Monrovia, prior to the grid expansion. This schedule of sequential data collection will allow us
to first launch the study of connected households in Monrovia as soon as possible and also
collect measures among unconnected households in Greater Monrovia before users are able to
take advantage of new connections. We will conduct an interim data collection after the grid
expansion has taken place and households and businesses have the ability to establish new
connections, before the Compact ends. The interim round of data collection will allow us to
collect information on short- to medium-term outcomes. Data from multiple rounds is critical to
validating and improving confidence in findings across the collection activities, identifying
important areas of inquiry that may not be evident from the outset, an, and assessing the
likelihood of observing longer-term impacts. Further, collecting data collection prior to the
Compact end will also allow us to interview key actors involved in the implementation of the
Compact activities. End line data collection will take place a few years later, prior to the end of
the contract, to assess long-term impacts. The end line data will also allow us to calculate the rate
of connectivity for households and businesses once the availability of electricity has been
established, as well as finalize the ERR. We anticipate the end line to take place in the last
quarter of 2023.

LIBERIA ENERGY EVALUABILITY ASSESSMENT FINAL REPORT MATHEMATICA POLICY RESEARCH
83
IX. ADMINISTRATIVE ISSUES
We will carefully manage this complex and multicomponent evaluation. Next, we describe
administrative issues relevant to conducting the evaluation and present a timeline for evaluation
activities.
A. Summary of IRB requirements and clearances
Mathematica is committed to protecting the rights and welfare of human subjects by
obtaining approval from an IRB for relevant research and data collection activities. IRB approval
requires three sets of documents: (1) a research protocol, in which we describe the purpose and
design of the research, and provide information about our plans for protecting study participants,
their confidentiality and human rights, including how we will acquire consent for their
participation; (2) copies of all data collection instruments and consent forms that we plan to use
for the evaluation; and (3) a completed IRB questionnaire that provides information about the
research protocol, how we will securely collect and store our data, our plans for protecting
participants’ rights, and any possible threats to participants resulting from any compromise of
data confidentiality. We anticipate the IRB review of this study to qualify for expedited review
because it presents minimal risk to participants. IRB approval is valid for one year; we will
submit annual renewals for approvals for subsequent years as needed.
We will also ensure that the study meets all U.S. and local research standards for ethical
clearance, including submitting our study for approval by Liberia’s ethical review committee.
We will coordinate with our consultant and data collection partner to submit the full list of
required materials, including a description of the methodology, the instruments and enumerator
manuals, a community awareness plan, the timeline, budget, and a dissemination plan, to the
required local agency. Mathematica may request support from MCA-Liberia to facilitate the
process. If either the U.S. IRB or local authorities recommends changes to protocols or
instruments, the survey firm, MCC, and Mathematica will work together to accommodate the
changes, and all parties will agree on the final protocol before data collection begins.
B. Data access, privacy, and file preparation
All data collected for this evaluation will be securely transferred from the data collection firm
to Mathematica, will be stored on Mathematica’s secure server and will be accessible only to
project team members who use the data. After producing and finalizing each of the final
evaluation reports, we will prepare corresponding de-identified data files, user manuals, and
codebooks based on the quantitative survey data. We understand that these files could be made
available to the public; therefore, the data files, user manuals, and codebooks will be de-
identified according to MCC’s most recent guidelines. Public use data files will be free of
personal or geographic identifiers that would permit unassisted identification of individual
respondents or their households, and we will remove or adjust variables that introduce reasonable
risks of deductive disclosure of the identity of individual participants. We will also recode
unique and rare data by using top and bottom coding or replacing these observations with
missing values. If necessary, we will also collapse any variables that make an individual highly
visible because of geographic or other factors into less easily identifiable categories.
LIBERIA ENERGY EVALUABILITY ASSESSMENT FINAL REPORT MATHEMATICA POLICY RESEARCH
84
C. Dissemination plan
To ensure that the results and lessons from the evaluation reach a wide audience, we will
work with MCC to increase the visibility of the evaluation and findings targeted to the energy
sector, particularly for policymakers and practitioners. We will present findings from each round
of data collection in baseline, interim, and final evaluation reports. We will distribute draft
reports to stakeholders for feedback before finalization and will present findings at MCC
headquarters in Washington, DC and MCA-Liberia headquarters.
We expect the broader research community to have a strong interest in the findings from the
evaluation. To facilitate wider dissemination of findings and lessons learned, we will collaborate
with MCC and other stakeholders to identify additional forums—conferences, workshops, and
publications—for disseminating the results and encourage other donors and implementers to
integrate the findings into their programming.
D. Evaluation team: Roles and responsibilities
Our team will contribute our extensive experience and expertise to meet MCC’s evaluation
needs. Program manager Dr. Candace Miller will be responsible for managing the team of
experts and delivering high quality products to MCC. Dr. Ali Protik and Mr. Randall Blair will
serve as co-evaluation experts, leading the design and implementation of the quantitative and
qualitative evaluations, respectively. Mr. Denzel Hankinson and Mr. Gerald Coleman will
serve as co-energy experts for the evaluation. Mr. Hankinson will provide energy data modeling
expertise while Mr. Coleman, a Liberian energy expert, will provide contextual information,
expertise in using utility data, including SAIDI/SAIFI, voltage quality, and blackouts to inform
the evaluation design. Ms. Kristine Bos will support the collection of high quality data and
analysis. Dr. Arif Mamun will provide quality assurance on all deliverables.
E. Evaluation timeline and reporting schedule
The evaluation activities will be ongoing over the course of the evaluation, as described in
Chapter VIII. Administrative data and documentation will be collected on a regular basis, while
key informant interviews will be conducted annually or on an as-needed basis. Interviews with
businesses, focus group discussions with households, and site visits will be concentrated around
the baseline, interim, and endline quantitative data collection efforts (Table IX.1, Figure IX.1).
We expect that baseline data collection will occur in autumn 2018; interim data collection in late
2020, prior to Compact close; and endline data collection at the end of 2023. We note that the
timeline could change as compact implementation evolves and is based on several research-
based principles: First, we aim to collect pre-intervention data to understand outcomes prior to
implementation. When baseline data is not feasible because activities were underway prior to
EDR approval, we aim to collect retrospective data. The baseline information will enable us to
measure change over time which can be attributed or linked to MCC’s investments. Next, we
aim to collect interim data to understand implementation and performance as the project evolves
and the Liberian context changes and impact data to understand end user impacts. We will
collect administrative data, documentation, and other qualitative data on a rolling basis
throughout the energy evaluation to keep abreast of changes as they occur. We will conduct
quantitative and qualitative end user interim data collection in 2020 because experience and
similar energy studies confirm that outcomes—such as changes in end users’ economic situation

LIBERIA ENERGY EVALUABILITY ASSESSMENT FINAL REPORT MATHEMATICA POLICY RESEARCH
85
and behaviors—emerge after users are actually connected and have at least a couple years of
connectivity. Finally, we propose endline data collection for end users in 2023 to maximize the
chances that we will capture the longer term outcomes that take years of connectivity to emerge,
such as acquiring time saving appliances, increased employment, and other business expansion.
Table IX.1. Evaluation timeline and reporting schedule
Name of Round Data Collection
Data Cleaning &
Analysis
First Draft Report
Expected
Final Draft Report
Expected
Baseline September -December 2018
January-March 2019 April 2019 July 2019
Interim October-December 2020
January-March 2021 April 2021 July 2021
Endline October-December 2023
January-April 2024 June 2024 January 2025
Mathematica will produce written reports following each round of quantitative data
collection. Contingent upon the schedule of compact implementation, the baseline report is
expected in the second quarter of 2019, the interim report in the first quarter of 2021, and the
final evaluation report in late 2024. Mathematica expects to complete all scheduled tasks within
the eight-year period.

LIBERIA ENERGY EVALUABILITY ASSESSMENT FINAL REPORT MATHEMATICA POLICY RESEARCH
86
F. Budget
Next we present an estimate of the resources necessary to complete the evaluation of activities 1
and 2 as proposed and a comparison of our proposed budget across the full project, including
activities 3, 4 and the GSI investments. Based on our current estimates at the time of submission of
this design report, we do not anticipate requiring additional labor or other direct costs (ODCs) to
complete the evaluation. Note that the Table IX.3 includes three separate plugs for data collection,
resources for TetraTech, and AidData.
Table IX.2. Project costs by year and activity
Activity 1+ 2 Activity 3 Activity 4 GSI Activity
Cross-
Activity Total
Base Year $ 293,416 $ 38,461 $ 70,413 $ 86,136 $ 64,342 $ 552,771
Option Year 1 $1,141,013 $ 99,073 $ 116,339 $ 169,197 $ 316,045 $ 1,841,668
Option Year 2 $1,083,368 $ 108,334 $ 187,887 $ 224,651 $ 106,004 $ 1,710,246
Option Year 3 $1,030,682 $ 174,992 $ 193,975 $ 231,258 $ 110,684 $ 1,741,593
Total $3,548,481 $420,860 $568,616 $ 711,243 $ 597,077 $ 5,846,279
Table IX.3. Proposed budget for the evaluation of Activities 1 and 2
Mathematica
Costs
Data
Collection
Plug Total Costs
1 Assess Evaluation Plan $ 78,746 - $ 78,746
2 Develop Evaluation Design Report $214,671 - $214,671
3 Develop Baseline Evaluation Materials $ 55,315 - $ 55,315
4 Supervise Baseline data collection $ 53,141 $600,000 $653,141
5 Develop Baseline Report $ 90,371 - $ 90,371
6 Disseminate Baseline Results $ 13,365 - $ 13,365
7 Monitor program implementation $ 28,822 - $ 28,822
8 Revise Interim/Final Evaluation Materials $ 42,846 - $ 42,846
9 Supervise Interim/Final Data collection $ 74,370 $600,000 $674,370
10 Develop Interim/Final Report $212,317 - $212,317
11 Disseminate Final Results $ 53,835 - $ 53,835
12 Revise Final Evaluation Materials $ 14,938 - $ 14,938
13 Supervise Final Data Collection $ 51,134 $600,000 $651,134
14 Develop Final Report $121,263 - $121,263
15 Review and Update Economic Analysis $ 15,306 - $ 15,306
16 Disseminate Final Results $ 33,942 - $ 33,942
17 Project Management $ 94,099 - $ 94,099
Total 1,248,482 1,800,000 3,048,482
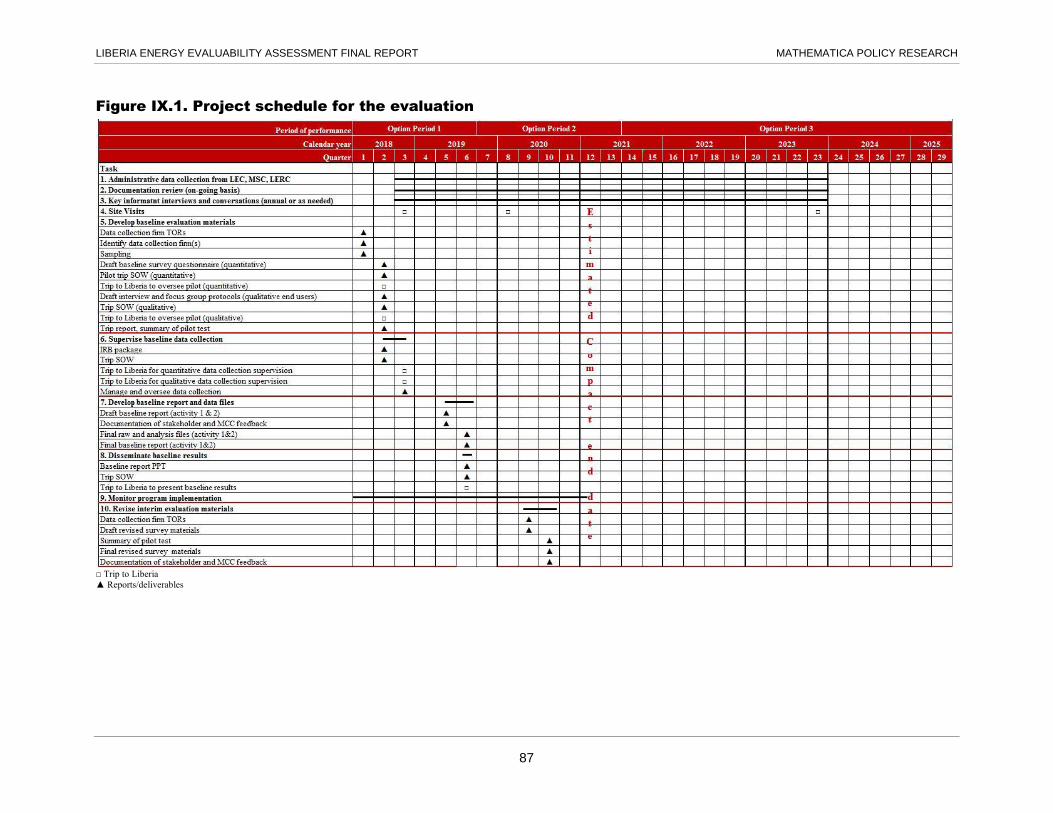
LIBERIA ENERGY EVALUABILITY ASSESSMENT FINAL REPORT MATHEMATICA POLICY RESEARCH
87
Figure IX.1. Project schedule for the evaluation
□ Trip to Liberia
▲ Reports/deliverables

LIBERIA ENERGY EVALUABILITY ASSESSMENT FINAL REPORT MATHEMATICA POLICY RESEARCH
FIGURE IX.1. (CONTINUED)
88
□ Trip to Liberia
▲ Reports/deliverables

LIBERIA ENERGY EVALUABILITY ASSESSMENT FINAL REPORT MATHEMATICA POLICY RESEARCH
89
X. CHALLENGES TO EVALUATION STUDIES
We recognize and MCC acknowledges the critical risks to the Liberia Energy Project, and in
turn to the evaluation components, given that Liberia likely presents higher risks than other
countries with Compacts. Liberia is a post-conflict country with political instability, a fragile
economic and social environment, fragile institutions and limited technical capacity, and a heavy
reliance on donor partners. Liberia lacks a track record of operating and sustaining infrastructure
and assets, making the sustainability of Compact outcomes and benefits uncertain. Together,
these critical risks present unique and serious challenges to project designs, quality,
implementation, and results. These combined risks present evaluation challenges that we address
below.
First, we plan to use qualitative performance methods to answer research questions for each
level of outcomes. Although do not anticipate serious challenges implementing the qualitative
methods, we recognize that we are reliant on Liberian agencies, donor partners, and other
stakeholders to supply documentation, maps, and administrative data, participate in interviews,
and allow site visits. We are actively establishing relationships with donors and other
stakeholders to increase the likelihood that we can consistently obtain the necessary materials
and participation throughout the course of the evaluation. Given the long time frame for this
evaluation, some implementers, public authorities, and LEC staff may change during the
Compact period, complicating our ability to document and assess implementation and results. To
mitigate this challenge, we will monitor staff turnover through our contacts at MCA-Liberia,
LEC, and other agencies. If feasible, our in-country coordinator will be available on short notice
to perform interviews on a rolling basis with exiting staff. Open and regular communication
between the evaluation team and in-country stakeholders will be essential to ensuring we reach
key informants before their exit.
We also recognize that implementation and coordination constraints may arise if large
project components are delayed or canceled or if planned technical aspects do not occur in
parallel with capacity building investments and regulatory reforms. These constraints may hinder
our ability to assess some of the key evaluation questions. To mitigate the effect of these
potential constraints on the evaluation, we will document any substantive modifications to
implementation plans and incorporate those findings into our analysis. We will also reframe
evaluation questions, as necessary, in the case of large-scale modifications or cancellations.
Further, the longitudinal analysis of administrative data is dependent upon the availability
of adequate data. In meetings with stakeholders during the September 2017 scoping trip and in
subsequent conversations, we have discussed the lack of availability and poor quality of
administrative data for measuring many key outcomes. LEC currently has no standard system or
process to oversee the full system, locate faults, create reports, or monitor its customer base.
However, once the MSC has a functional IMS system, more of this administrative data should be
available. In addition, system-level SCADA data will help fill the data gap. We would advocate
for fast-tracking the substation level SCADA system and investing in data loggers so that high-
quality data can be used for monitoring and evaluation. In the absence of a distribution level
SCADA system our contingency plan is to use manually captured historical handwritten data.
However, data must be assessed to determine whether they are of sufficient quality to use for

LIBERIA ENERGY EVALUABILITY ASSESSMENT FINAL REPORT MATHEMATICA POLICY RESEARCH
90
longitudinal analysis. We recommend pursuing enhanced data collection systems for future
efforts.
The stability of the grid expansion plans is critical for our proposed MCG design for
unconnected end users because we will identify the intervention and comparison groups based on
the planned expansion maps and collect baseline data in these areas. If part of the planned
expansions is not realized because of changes in the original plans after our design and baseline
data collection, we will not have a full sample for the analysis. We will assess the possibility of
this situation happening for the expansion plans underlying our design and will use only mostly
finalized and stable catchment areas of expansion segments for the impact study.
The timing of baseline data collection has implications for the MCG design for
unconnected end users. Based on the most recent available information, LEC’s customer base
consisted of 49,000 households as of mid-February 2017 and was scheduled to grow at a rate of
3,900 customers per month.11 We understand that this growth rate has not been realized and in
fact more than half of current customers may not be regularly purchasing electricity. However, as
new T&D lines become operational and LEC gains capacity, more customers will be connected
in the catchment areas of new T&D lines. This rapid growth may make it more difficult for us to
find a reasonably sized sample in the intervention areas to match with households in the
comparison areas. It is theoretically possible to include recently connected households in the
intervention areas as unconnected (at baseline) end users and match them with unconnected end
users in the comparison areas so we will explore this possibility as we gain access to distribution
maps. The assumption is that end-user-level outcomes would change very little for recently
connected households by the time we would collect baseline information from them.
The sample size for large commercial customers could be an issue for a meaningful
longitudinal analysis. According to MCC’s economic analysis, there are currently approximately
120 T3 customers and 546 T2 customers; these numbers are expected to rise to 162 and 1,450
customers, respectively, in three years. Currently, LEC is trying to connect large customers.
However, as documented in MCC’s investment memo, large businesses have minimal trust in the
utility company, and they demand reliable electricity with a low tariff. In addition, LEC has very
limited capacity to connect new customers. Again, we are exploring the feasibility of including
the entire population of large industrial and commercial customers for the longitudinal analysis if
the number of these large customers does not increase as expected.
11 The number of connected users is based on a statement by the LEC managing director, published on LEC’s website
(http://lecliberia.com/?p=2005). The press release is dated both February 17, 2017, and February 16, 2016. The date of
February 2017 is more plausible and is consistent with information on LEC’s Facebook page.

LIBERIA ENERGY EVALUABILITY ASSESSMENT FINAL REPORT MATHEMATICA POLICY RESEARCH
91
REFERENCES
Adair-Rohani, Heather, Karen Zukor, Sophie Bonjour, Susan Wilburn, Annette C Kuesel, Ryan
Hebert, and Elaine R Fletcher. “Limited Electricity Access in Health Facilities of Sub-
Saharan Africa: A Systematic Review of Data on Electricity Access, Sources, and
Reliability.” Global Health: Science and Practice, vol. 1, no. 2, 2013, pp. 249–261.
Adenikinju, Adeola F. “Electric Infrastructure Failures in Nigeria: A Survey-Based Analysis of
the Costs and Adjustment Responses.” Energy Policy, vol. 31, 2003, pp. 1519–1530.
African Development Bank Group. “The High Cost of Electricity Generation in Africa.”
February 18, 2013. Available at https://www.afdb.org/en/blogs/afdb-championing-inclusive-
growth-across-africa/post/the-high-cost-of-electricity-generation-in-africa-11496/. Accessed
December 12, 2017.
Akpan, Uduak S., Maurice A. Essien, and Salisu R. Isihak. “Impact of Rural Electrification on
Rural Micro-Enterprises in Niger Delta, Nigeria.” Energy for Sustainable Development,
vol. 17, 2013, pp. 504–509.
Arnold, Jens Matthias, Aaditya Matoo, and Gaia Narciso. “Services Inputs and Firm Productivity
in Sub-Saharan Africa: Evidence from Firm-Level Data.” Journal of African Economies,
vol. 17, no. 4, February 2, 2008, pp. 578–599.
Ballah, Zeze. “Businesses Still Spending Big on Fuel; Want to Benefit from Mt. Coffee.”
Monrovia, Liberia: The Bush Chicken, July 10, 2017. Available at
http://www.bushchicken.com/businesses-still-spending-big-on-fuel-want-to-benefit-from-
mt-coffee/.
Barron, Manuel, and Maximo Torero. “Household Electrification and Indoor Air Pollution.”
Working Paper, January 2016. Available at https://www.ocf.berkeley.edu/~manuelb/
research.html. Accessed May 12, 2016.
Bensch, Gunther, Jorg Peters, and Maximiliane Sievert. “Fear of the Dark? How Access to
Electric Lighting Affects Security Attitudes and Nighttime Activities in Rural Senegal.”
Journal of Rural and Community Development, vol. 8, no. 1, 2013, pp. 1–19.
Bernard, Tanguy. “Impact Analysis of Rural Electrification Projects in Sub-Saharan Africa.” The
World Bank Research Observer, vol. 27, no. 1, February 2012, pp. 33–51.
Bernard, Tanguy, and Maximo Torero. “Welfare Impact of Rural Electrification: ‘Short-Term’
Evidence from Ethiopia: A Report for the Ethiopian Electric Power Corporation and the
World Bank.” Washington, DC: International Food Policy Research Institute, December
2009.
Bernard, Tanguy, and Maximo Torero. “Social Interaction Effects and Connection to Electricity:
Experimental Evidence from Rural Ethiopia.” Economic Development and Cultural Change,
vol. 63, no. 3, 2015, pp. 459–484.

LIBERIA ENERGY EVALUABILITY ASSESSMENT FINAL REPORT MATHEMATICA POLICY RESEARCH
92
Bernstein, Mark A., and James Griffin. “Regional Differences in the Price-Elasticity of Demand
for Energy.” Report prepared for the National Renewable Energy Laboratory. Santa Monica,
CA: RAND Corporation, 2005.
Brown, Ashley C., Jon Stern, Bernard Tenenbaum, and Defne Gencer. “Handbook for
Evaluating Infrastructure Regulatory Systems.” Washington, DC: The World Bank, 2006.
Centre for the Study of African Economies at the University of Oxford. “Regional Project on
Enterprise Development & Ghana Manufacturing Enterprise Survey, Rounds I-VII (12
years: 1992-2003).” Oxford, United Kingdom: University of Oxford, funded by the
Overseas Development Administration. Available at:
https://www.csae.ox.ac.uk/manufacturing-enterprise-surveys/regional-project-on-enterprise-
development-ghana-manufacturing-enterprise-survey-rounds-i-vii-12-years-1992-2003.
Accessed February 25, 2018.
Chakravorty, Ujjayant, Martino Pelli, and Beyza Ural Marchand. “Does the Quality of Electricity
Matter? Evidence from Rural India.” Journal of Economic Behavior and Organization,
vol. 107, part A, November 2014, pp. 228–247.
Chaplin, Duncan, Arif Mamun, and John Schurrer. “Evaluation of the Millennium Challenge
Corporation’s Electricity-Transmission and Distribution Line-Extension Activity in
Tanzania: Baseline Report.” Submitted to the Millennium Challenge Corporation.
Washington, DC: Mathematica Policy Research, November 2012.
Chaplin, Duncan, Arif Mamun, Ali Protik, John Schurrer, Divya Vohra, Kristine Bos, Hannah
Burak, Laura Meyer, Anca Dumitrescu, Christopher Ksoll, and Thomas Cook. “Grid
Electricity Expansion in Tanzania by MCC: Findings from a Rigorous Impact Evaluation.”
Report submitted to the Millennium Challenge Corporation. Washington, DC: Mathematica
Policy Research, February 24, 2017.
Cooper, Helene. “Living in Darkness, but Holding onto Hope in Liberia.” New York Times,
Tuesday, February 14, 2017.
Development & Training Services, Inc. (DTS). “Mid-Term Evaluation of the Liberian Energy
Sector Support Program.” Report submitted to USAID. Washington, DC: DTS, January 15,
2013.
Dinkelman, Taryn. “The Effects of Rural Electrification on Employment: New Evidence from
South Africa.” American Economic Review, vol. 101, no. 7, December 2011, pp. 3078-3108.
Eberhard, Anton, Katharine Gratwick, Elvira Morella, and Pedro Antmann. Independent Power
Projects in Sub-Saharan Africa: Lessons from Five Key Countries. Washington, DC: World
Bank Group, 2016.
Eberhard, Anton, Orvirka Rosnes, Maria Shkaratan, and Haakon Vennemo. Africa’s Power
Infrastructure: Investment, Integration, Efficiency. Washington, DC: World Bank Group,
2011.

LIBERIA ENERGY EVALUABILITY ASSESSMENT FINAL REPORT MATHEMATICA POLICY RESEARCH
93
Electricity Supply Board International (Management Services Contract) Liberia Electricity
Corporation Review of First Quarter, April 11, 2018.
Energy Sector Management Assistance Program (ESMAP). “Rural Electrification and
Development in the Philippines: Measuring the Social and Economic Benefits.”
Washington, DC: World Bank Group, May 2002.
Escribano, Alvaro, J. Luis Guasch, and Jorge Pena. “Assessing the Impact of Infrastructure
Quality on Firm Productivity in Africa.” World Bank Policy Research Working Paper
No. 5191. Washington, DC: The World Bank, January 2010.
Fichtner. “Preparation of a Government of Liberia Least Cost Power Development Plan
(LCPDP): Draft Report Addendum.” Stuttgart, Germany: Fichtner, April 2014.
Foster, Vivien, and Jevgenijs Steinbuks. “Paying the Price for Unreliable Power Supplies: In-
House Generation of Electricity by Firms in Africa.” World Bank Policy Research Working
Paper No. 4913. Washington, DC: The World Bank, April 2009.
Front Page Africa. “Liberia Electricity Corporation Cancels US $55 Prerequisite Connection
Fee.” 2017. Available online at https://frontpageafricaonline.com/news/2016news/liberia-
electricity-corporation-cancels-us-55-prerequisite-connection-fee/. Accessed February 28,
2018.
Front Page Africa. “Liberia Electricity Corporation Turns Over Management to Foreign
Company.” 2018. Available online at
https://frontpageafricaonline.com/news/2016news/liberia-electricity-corporation-turns-over-
management-to-foreign-company/. Accessed February 28, 2018.
Golumbeanu, R., and D. Barnes. “Connection Charges and Electricity Access in Sub-Saharan
Africa.” Policy Research Working Paper 6511. Washington, DC: World Bank, June 2013.
Government of Liberia. “Request for Bids (RFB). Management Services for an Operator for
Liberia Electricity Corporation (LEC).” Monrovia, Liberia: Government of Liberia.
February 10, 2017.
Grimm, Michael, Renate Hartwig, and Jann Lay. “Electricity Access and the Performance of
Micro and Small Enterprises: Evidence from West Africa.” The European Journal of
Development Research, vol. 25, no. 5, December 2013, pp. 815–829.
Grogan, Louise, and Asha Sadanand. “Rural Electrification and Employment in Poor Countries:
Evidence from Nicaragua.” World Development, vol. 43, 2013, pp. 252–265.
Gulen, Gurcan, Ruzanna Makaryan, Dmitry Volkov, and Michelle Foss. “Improving Regulatory
Agency Efficiency and Effectiveness: Best Practices, Processes and Organizational
Structures.” Working Paper. Austin, Texas: University of Texas at Austin, Center for
Energy Economics, n.d.

LIBERIA ENERGY EVALUABILITY ASSESSMENT FINAL REPORT MATHEMATICA POLICY RESEARCH
94
Hardy, Morgan, and Jamie McCasland. “Lights Off, Lights On: The Effects of Electricity
Shortages on Small Firms.” Working Paper, January 10, 2017. Available at
https://sites.google.com/a/nyu.edu/morganhardy/research. Accessed April 10, 2017.
International Energy Agency (IEA). “Africa Energy Outlook: A Focus on Energy Prospects in
Sub-Saharan Africa.” Paris, France: IEA, 2014.
International Finance Corporation (IFC) Development Impact Department. “Estimating
Employment Effects of Powerlinks Transmission Limited Project in India & Bhutan.”
Washington, DC: International Finance Corporation, September 2012.
Khandker, Shahidur R., Douglas F. Barnes, and Hussain A. Samad. “The Welfare Impacts of
Rural Electrification in Bangladesh.” The Energy Journal, vol. 33, no. 1, 2012a,
pp. 187-206.
Khandker, Shahidur R., Douglas F. Barnes, and Hussain Samad. “Welfare Impacts of Rural
Electrification: A Panel Data Analysis from Vietnam.” Economic Development and Cultural
Change, vol. 61, no. 3, April 2013, pp. 659–692.
Khandker, Shahidur R., Hussain A. Samad, Rubaba Ali, and Douglas F. Barnes. “Who Benefits
Most from Rural Electrification? Evidence in India.” World Bank Policy Research Working
Paper 6095. Washington, DC: The World Bank, 2012b.
Khanna, Madhu, and Narasimha D. Rao. “Supply and Demand of Electricity in the Developing
World.” Annual Review of Resource Economics, vol. 1, 2009, pp. 567–596.
Kojima, Msami and Chris Trimble. “Making Power Affordable for Africa and Viable for its
Utilities.” Washington, DC: World Bank Group, 2016.
Lee, Kenneth, Eric Brewer, Carson Christiano, Francis Meyo, Edward Miguel, Matthew
Podolsky, Javier Rosa, and Catherine Wolfram. “Electrification for ‘Under Grid’
Households in Rural Kenya.” Development Engineering, vol. 1, 2016, pp. 26–35.
Lenz, Luciane, Anicet Munyehirwe, Jorg Peters, and Maximiliane Sievert. “Does Large-Scale
Infrastructure Investment Alleviate Poverty? Impacts of Rwanda’s Electricity Access Roll-
Out Program.” World Development, vol. 89, 2017, pp. 88-110.
Liberia Executive Mansion. “President Sirleaf Announces Ten Percent (10%) Reduction in
Electricity Tariff; Liberia, Germany Sign KfW €15m Grant For 15,000 Connections in
Power Supply.” Monrovia, Liberia: Executive Mansion, September 5, 2017. Available at
http://www.emansion.gov.lr/2press.php?news_id=4160&related=7&pg=sp. Accessed
December 1, 2017.
Liberia Ministry of Foreign Affairs. “An Act to Amend Chapters 85 of the 1973 Public Authority
Law Creating the Liberia Electricity Corporation and Amendment Thereto, to Establish the
2015 Electricity Law of Liberia.” Monrovia, Liberia: Ministry of Foreign Affairs,
October 23, 2015.

LIBERIA ENERGY EVALUABILITY ASSESSMENT FINAL REPORT MATHEMATICA POLICY RESEARCH
95
Lipscomb, Molly, A. Mushfiq Mobarak, and Tania Barham. “Development Effects of
Electrification: Evidence from the Topographic Placement of Hydropower Plants in Brazil.”
American Economic Journal: Applied Economics, vol. 5, no. 2, 2013, pp. 200–231.
Millennium Challenge Corporation. “Investment Memorandum on Liberia’s Proposed Compact
for the Investment Management Committee of the Millennium Challenge Corporation.”
Washington, DC: MCC, June 29, 2015.
Millennium Challenge Account – Liberia (MCA-L). “Press Release.” Monrovia, Liberia:
January 18, 2018. Available at
http://www.mca.gov.lr/images/News%20and%20Publications/MCAL%20Press%20Release.
pdf. Accessed May 11, 2018.
Miller, Candace. “MCC Liberia Energy Project Evaluation: Draft Trip Report.” Draft memo
submitted to the Millennium Challenge Corporation. Washington, DC: Mathematica Policy
Research, October 2017.
Miller, Candace, Kristine Bos, and Ali Protik. “Evaluability Assessment for the Liberia Energy
Project.” Report submitted to the Millennium Challenge Corporation. Washington, DC:
Mathematica Policy Research, December 2018.
Miller, Candace, John Schurrer, Nicholas Redel, Arif Mamun, and Duncan Chaplin.
“Millennium Challenge Corporation’s Electricity Transmission and Distribution Line-
Extension Activity in Tanzania: Qualitative Evaluation.” Report submitted to the
Millennium Challenge Corporation. Washington, DC: Mathematica Policy Research,
July 22, 2015.
Norplan Fichtner. “Mount Coffee Inception Report.” September 2013.s
Peters, J., M. Sievert, and C. Vance. “Firm Performance and Electricity Usage in Small
Manufacturing and Service Firms in Ghana.” In Productive Use of Energy (PRODUSE):
Measuring Impacts of Electrification on Micro-Enterprises in Sub-Saharan Africa, edited by
L. Mayer-Tasch, M. Mukherjee, and K. Reiche. Eschborn. Germany: Deutsche Gesellschaft
für Internationale Zusammenarbeit, 2013.
Peters, J., C. Vance, and M. Harsdorff. “Grid Extension in Rural Benin: Micro-Manufacturers
and the Electrification Trap.” World Development, vol. 39, no. 5, pp. 773–783, 2011.
Phelps, Glenn, and Steve Crabtree. “Worldwide, Median Household Income About $10,000.”
Gallup. December 16, 2013. Available at http://news.gallup.com/poll/166211/worldwide-
median-household-income-000.aspx. Accessed February 14, 2018.
Rural and Renewable Energy Agency (RREA). “Alternative Models and Proposed Power Sector
Organization.” 2016. Available at: http://www.liberiaruralenergy.org/?q=content/alternative-
model-and-proposed-power-sector-organization.

LIBERIA ENERGY EVALUABILITY ASSESSMENT FINAL REPORT MATHEMATICA POLICY RESEARCH
96
Samad, Hussain, and Fan Zhang. “Benefits of Electrification and the Role of Reliability.” World
Bank Policy Research Working Paper 7889. Washington, DC: World Bank, November
2016.
Sandikie, Jacob S. “Liberia Sustainable Energy for All (Se4all) Action Agenda Report 2015.”
Vienna, Austria and Washington, DC: SEforALL, August 10, 2015. Available at:
http://www.se4all.org/sites/default/files/LIBERIA_AA_EN_Released_0.pdf. Accessed
February 23, 2018.
Stern, Jon, and John Cubbin. “Regulatory Effectiveness: The Impact of Regulation and
Regulatory Governance Arrangements on Electricity Industry Outcomes.” World Bank
Policy Research Working Paper 3536. Washington, DC: World Bank, March 2005.
Sovacool, Benjamin. “Electricity and Education: The Benefits, Barriers, and Recommendations
for Achieving the Electrification of Primary and Secondary Schools.” Report submitted to
the United Nations Department of Economic and Social Affairs (UNDESA), 2014.
Available at
https://sustainabledevelopment.un.org/content/documents/1608Electricity%20and%20Educa
tion.pdf. Accessed February 12, 2018.
Tallapragada V.S.N., Prasad, Maria Shkaratan, Ada Karina Izaguirre, Jaakko Helleranta, Saifur
Rahman, Sten Bergman. “Monitoring Performance of Electric Utilities: Indicators and
Benchmarking in Sub-Saharan Africa.” Washington, DC: World Bank, 2009. Available at:
https://openknowledge.worldbank.org/handle/10986/13030. Accessed February 23, 2018.
USAID. “Power Africa in Liberia.” Washington, DC: USAID, May 2016. Available at
https://www.usaid.gov/powerafrica/liberia. Accessed February 15, 2018.
Van de Walle, Dominique, Martin Ravallion, Vibhuti Mendiratta, and Gayatri Koolwal. “Long-
Term Impacts of Household Electrification in Rural India.” World Bank Economic Review.
Advance online publication. doi:10.1093/wber/lhv057. Washington, DC: The World Bank,
2015.
Wamukonya, Njeri, and Mark Davis. “Socio-Economic Impacts of Rural Electrification in
Namibia: Comparisons Between Grid, Solar, and Unelectrified Households.” Energy for
Sustainable Development, vol. 5, no. 3, September 2001, pp. 5–13.
Winther, Tanja. “Rising Electricity Consumption: Driving Forces and Consequences. The Case
of Rural Zanzibar.” Oslo: ECEEE Summer Study 2007, pp. 1835–1845.
The World Bank. “Overview of Regional Energy Projects and Project Performance Assessment
Report for the Mali, Mauritania, and Senegal Regional Hydropower Development Project.”
Washington, DC: The World Bank, December 17, 2006. Available at
http://documents.worldbank.org/curated/en/942181468051004677/Mali-Mauritania-
Senegal-Regional-Hydropower-Development-Project. Accessed April 12, 2017.

LIBERIA ENERGY EVALUABILITY ASSESSMENT FINAL REPORT MATHEMATICA POLICY RESEARCH
97
The World Bank. “Project Performance Assessment Report: Uganda Third Power Project and
Supplemental to Third Power Project Credit.” Washington, DC: The World Bank, June 26,
2008. Available at
http://documents.worldbank.org/curated/en/500171468318019768/Uganda-Third-Power-
Project-and-Supplemental-Credit. Accessed April 12, 2017.
World Bank. “Project Performance Assessment Report: Lao People’s Democratic Republic
Southern Provinces Rural Electrification Project.” Report No. 42413. Washington, DC:
World Bank, February 4, 2008.
The World Bank. “Rwanda: Projet de réhabilitation d’urgence du réseau électrique.”
Washington, DC: The World Bank, September 20, 2010. Available at
http://documents.worldbank.org/curated/en/298211467998788713/Rwanda-Projet-de-
r%C3%A9habilitation-d-urgence-du-r%C3%A9seau-%C3%A9lectrique. Accessed April 12,
2017.
World Bank. “Options for the Development of Liberia’s Energy Sector.” Energy Sector Policy
Note Series. Washington, DC: World Bank, Africa Energy Unit, 2011. Available at:
http://siteresources.worldbank.org/EXTAFRREGTOPENERGY/Resources/717305-
1266613906108/Liberia_Energy_ESW_11-4-11web.pdf. Accessed February 14, 2018.
The World Bank Independent Evaluation Group (IEG). “ICR Review. Rwanda – Urgent
Electricity Rehabilitation.” Washington, DC: The World Bank, March 22, 2012. Available
at: http://ieg.worldbankgroup.org/ieg-search-
icrr?search_api_fulltext=&field_country%5B0%5D=214&sort_by=field_official_date&sort
_order=DESC&0=214&page=1#. Accessed April 12, 2017.
World Bank. “DataBank: World Development Indicators.” Washington, DC: World Bank,
2017a. Available at http://databank.worldbank.org/data/reports.aspx?source=world-
development-indicators. Accessed February 14, 2018.
World Bank. “Doing Business: Getting Electricity.” Washington, DC: World Bank, 2017b.
Available at http://www.doingbusiness.org/data/exploretopics/getting-electricity. Accessed
February 14, 2018.
World Bank. “Enterprise Surveys: Liberia (2017). Washington, DC: World Bank, 2017c.
Available at http://www.enterprisesurveys.org/data/exploreeconomies/2017/Liberia.
Accessed February 14, 2018.

This page has been left blank for double-sided copying.

www.mathematica-mpr.com
Improving public well-being by conducting high quality,
objective research and data collection
PRINCETON, NJ ■ ANN ARBOR, MI ■ CAMBRIDGE, MA ■ CHICAGO, IL ■ OAKLAND, CA ■ SEATTLE, WA ■ TUCSON, AZ ■ WASHINGTON, DC ■ WOODLAWN, MD
Mathematica® is a registered trademark
of Mathematica Policy Research, Inc.


