
EASTWATER’S OPERATION AND FINANCIAL PERFORMANCE 1H’2013
0

EASTWATER’S OPERATION AND FINANCIAL PERFORMANCE 1H’2013
1
DISCLAIMER
2
The information contained in this presentation is for information purposes only and does not constitute an offer or invitation to sell
or the solicitation of an offer or invitation to purchase or subscribe for share in Eastern Water Resources Development and
Management Public Company Limited (“EASTW” and shares in EASTW, “shares”) in any jurisdiction nor should it or any part of it
form the basis of, or be relied upon in any connection with, any contract or commitment whatsoever.
This presentation has been prepared by the EASTW. The information in this presentation has not been independently verified. No
representation, warranty, express or implied, is made as to, and no reliance should be placed on, the fairness, accuracy,
completeness or correctness of the information and opinions in this presentation. None of the EASTW or any of its agents or
advisors, or any of their respective affiliates, advisors representatives, shall have any liability (in negligence or otherwise) for any
loss howsoever arising from any use of this presentation or its contents or otherwise arising in connection with this presentation.
This presentation is made, furnished and distributed for information purposes only. No part of this presentation shall be relied
upon directly or indirectly for any investment decision-making or for any other purposes.
This presentation and all other information, materials or documents provided in connection therewith, shall not, either in whole or
in part, be reproduced, redistributed or made available to any other person, save in strict compliance with all applicable laws.
Note: All currency figures within this presentation are presented in Thai Baht (“Bt.”) unless otherwise stated.
AGENDA
3
• BUSINESS OVERVIEW
• Q2’13 PERFORMANCE
• WATER SITUATION
• GROWTH DIRECTION

OUR BUSINESSES
4
Water Management Businesses Office Space Rental
Raw water 70%
Tap water 23%
Office rental
6% Others
1%
2012 Revenues Breakdown .
Raw Water Tap Water Office Rental
As the core business of EASTW, raw water distribution is the main source of revenues while tap water and waterworks management – operated under Universal Utilities Co., Ltd. (100% subsidiary) – are compelling supportive businesses.

RAW WATER VALUE CHAIN
5
Raw Water Production Process
Head Tank
Air Compressors
Pump Station
Consumption
Industrial Estate
Factory
Raw Water – External Sources
Sea Water
Raw Water – Internal Sources
Tap Water Production
Process
TAP WATER VALUE CHAIN
6
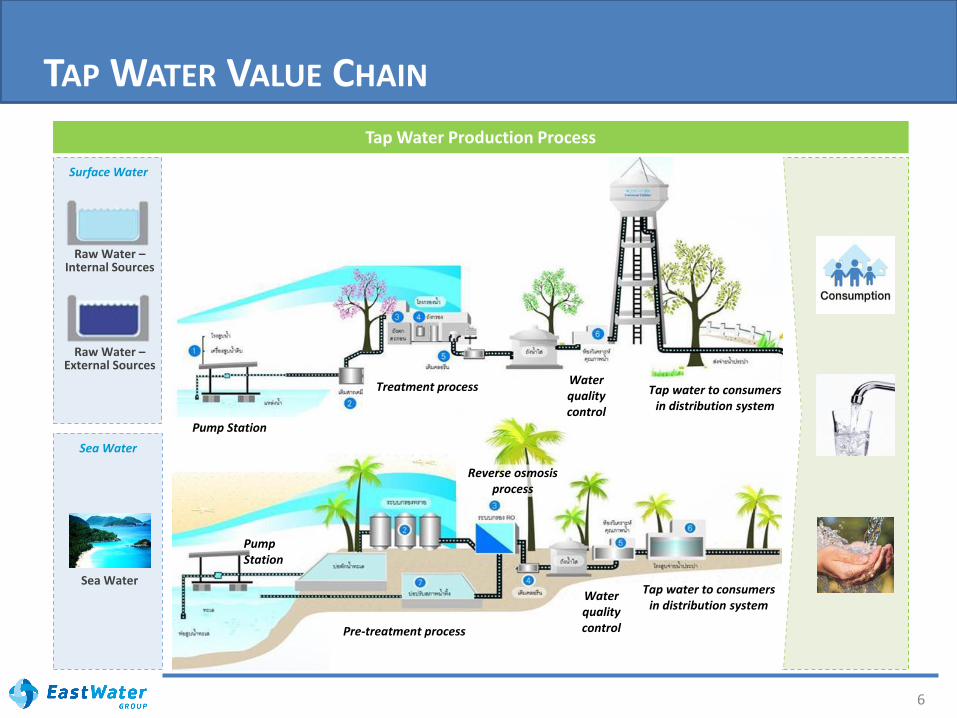
Tap Water Production Process
Sea Water
Pump Station
Tap water to consumers in distribution system
Treatment process
Pump Station
Pre-treatment process
Reverse osmosis process
Water quality control
Water quality control
Raw Water – External Sources
Raw Water – Internal Sources
Pump Station
Tap water to consumers in distribution system
Treatment process
Pump Station
Pre-treatment process
Reverse osmosis process
Tap water to consumers in distribution system
Water quality control
Water quality control
Surface Water
Sea Water
MARKET-BASED OPERATIONS AND KEY CUSTOMERS
7
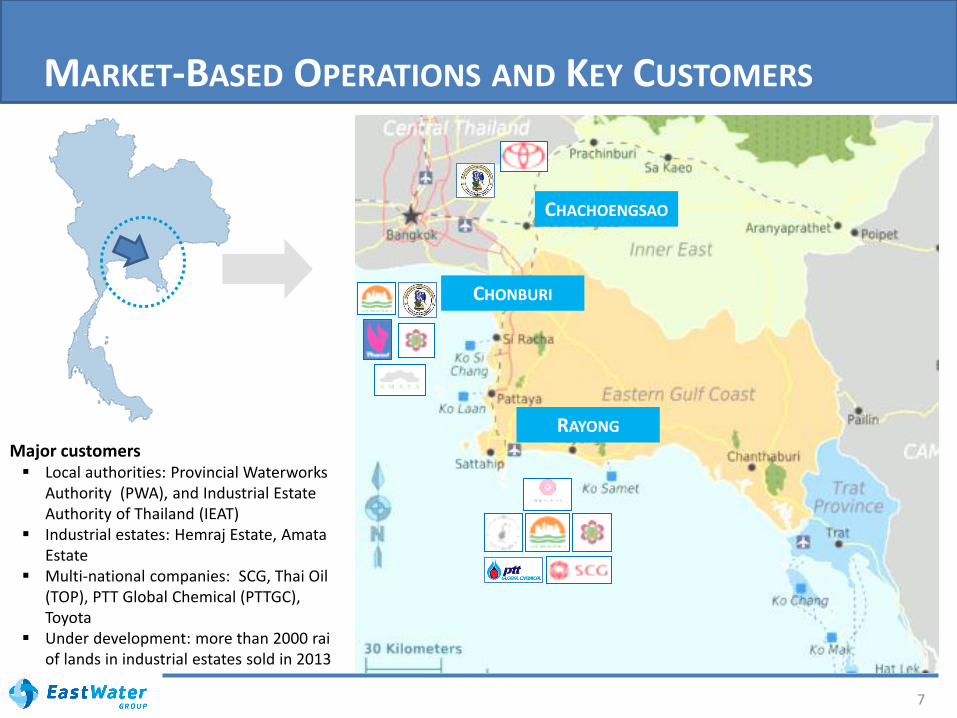
CHACHOENGSAO
CHONBURI
RAYONG Major customers Local authorities: Provincial Waterworks
Authority (PWA), and Industrial Estate Authority of Thailand (IEAT)
Industrial estates: Hemraj Estate, Amata Estate
Multi-national companies: SCG, Thai Oil (TOP), PTT Global Chemical (PTTGC), Toyota
Under development: more than 2000 rai of lands in industrial estates sold in 2013
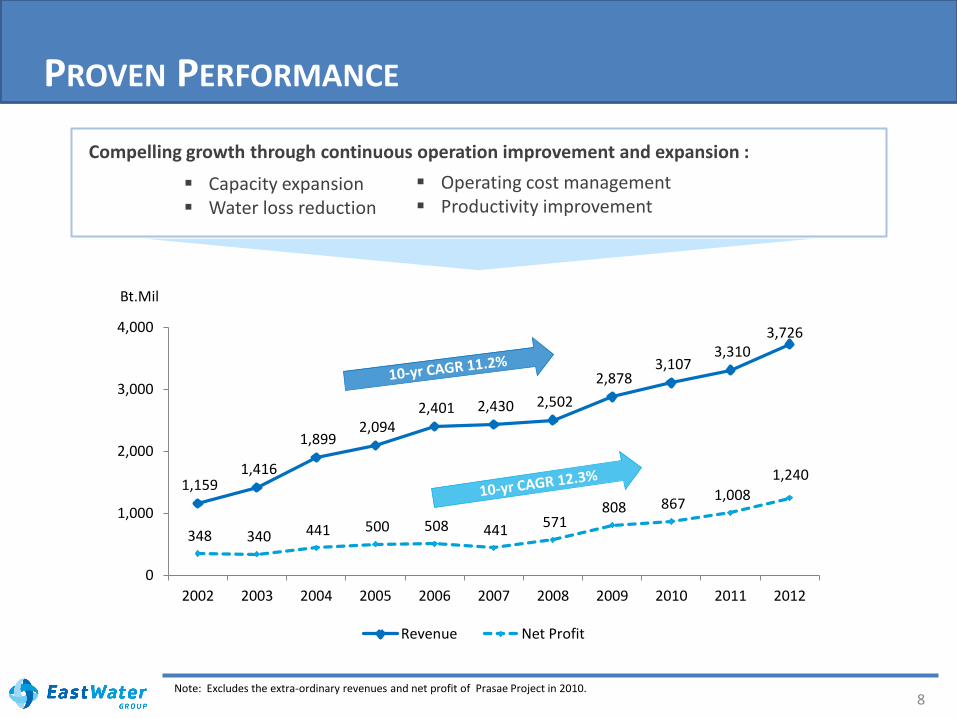
PROVEN PERFORMANCE
8
Compelling growth through continuous operation improvement and expansion :
Capacity expansion Water loss reduction
Note: Excludes the extra-ordinary revenues and net profit of Prasae Project in 2010.
1,159 1,416
1,899 2,094
2,401 2,430 2,502
2,878 3,107
3,310 3,726
348 340 441 500 508 441 571
808 867 1,008
1,240
0
1,000
2,000
3,000
4,000
2002 2003 2004 2005 2006 2007 2008 2009 2010 2011 2012
Bt.Mil
Revenue Net Profit
Operating cost management Productivity improvement

AGENDA
9
• BUSINESS OVERVIEW
• Q2’13 PERFORMANCE
• WATER SITUATION
• GROWTH DIRECTION

SUMMARY OF PROFIT & LOSS
10
1,856
2,006
1,152 1,243
704 763
0
500
1,000
1,500
2,000
2,500
H1/2012 H1/2013
Total revenue
Total Expenses
Net Profit
Million Baht

REVENUE
11
1,296 70%
1,433 71%
417 22%
442 22%
142, 8%
131 7%
0
500
1,000
1,500
2,000
2,500
1H/2012 1H/2013
Raw Water Sales Tap Water Sales Others
1,856 2,006
Million Baht
RAW WATER
65.8 66.3
67.6 68.4
9.81
10.53
9.40
9.60
9.80
10.00
10.20
10.40
10.60
0.0
50.0
100.0
150.0
Q1 Q2
2012 2013 Tariff
132 136
16.5 17.1
17.2 17.6
12.45
12.72
12.30
12.40
12.50
12.60
12.70
12.80
0.0
10.0
20.0
30.0
40.0
Q1 Q2
2012 2013 Tariff
TAP WATER
33.5 34.8

EXPENSES
12
200 202
37 56
205 180
710 805
0
200
400
600
800
1000
1200
1400
1H/2012 1H/2013
COGS
SG&A
INT
CIT
1,152 1,243
PROS/CONS
+13%
-12%
+51%
+1%

COST BREAKDOWN
13
Raw Water 19%
Electricity 36%
Depreciation
26%
Maintainanc
e 4%
Other 15%
Raw Water 19%
Electricity
38%
Depreciation 25%
Maintainance
5% Other 13%
Raw Water Tap Water
1H/12 1H/13 1H/12 1H/13
221
264
190
200
210
220
230
240
250
260
270
1H/12 1H/13
Raw Water 12%
Electricity 6%
Chemical
1%
Wages & Outs.
54%
Depreciations
17%
O&M 7%
Other 3%
Raw Water 19%
Electricity 25%
Chemical 4%
Wages &
Outs. 24%
Depreciations
15%
O&M 10%
Other 3%
340
360
380
400
420
440
460
1H/12 1H/13

PROFITABILITY ANALYSIS
14
17.75% 17.51% 17.39%
0%
5%
10%
15%
20%
25%
1H'12 2H'12 1H'13
% Margin ROE
11.16% 10.50% 10.29%
0%
5%
10%
15%
20%
1H'12 2H'12 1H'13
% Margin ROA

0.34 0.48 0.52
0.61 0.75
0.25 0.35 0.38 0.42 0.44
73% 72% 73%
69%
60%
0%
10%
20%
30%
40%
50%
60%
70%
80%
0.00
0.20
0.40
0.60
0.80
1.00
2008 2009 2010 2011 2012
Bt. per share
EPS DPS % Dividend payout ratio
Dividend policy is not less than 30% of normal net profit
SHARE INFORMATION AND DIVIDEND PAYMENT
15
REMARK: Half year dividend payout (January to June 2013) at 0.20 Baht per share • XO on September 16th 2013 • XD on September 27th 2013
AGENDA
16
• BUSINESS OVERVIEW
• Q2’13 PERFORMANCE
• WATER SITUATION
• GROWTH DIRECTION

17 Existing Pipe Network
Leased Pipe Network
EASTW - Raw Water Pipe Line RID - Raw Water Pipe Line Main Water Resource
Reserve Water Resource
Regulating Well / Receiving Well
Pump Station
Head Tank
Emergency Pond
P
Existing Pipe Network
Constructing Pipe Network
RAW WATER PIPELINE AND RESERVIOR
Reservoir: • Six major reservoirs (Total capacity
504 MCM/ Allocated 281.5 MCM) • Two reserve reservoirs (9.4 MCM)
Water pipeline: • Owned: 242 km.
(value Bt.11,200 mil) • Leased: 136 km. • Under management (total): 378 km.
Chacheongsao Reserve Pond
P4
P6
P5
P12
P15
Private Pond Samnakbok Reserve Pond
P13
P11
P14
P
P16
P10
P8 P9
P7
P3
P2
P1
5 10 km.
PRASAE Res. KHLONG YAI Res.
NONG PLA LAI Res. DOK KRAI Res.
NONG KHO Res. BANG PHRA Res.
RAYONG 202 MCM/year
PLUAK DAENG 36 MCM/year
CHONBURI 88 MCM/year
CHACHOENGSAO 2 MCM/year
Raw water demand in 2016

WATER SITUATION: DOK KRAI, NONG PLA LAI, KLONG YAI
18 Source: The Royal Irrigation Department (RID).
Jan Feb Mar Apr May Jun Jul Aug Sep Oct Nov Dec
Tota
l Wat
er S
tora
ge (
MC
M)
Dok Krai, Nong Pla Lai & KlongYai Reservoir
Lowest level: 20 MCM Dead storage: 10 MCM
Average 2006 - 2012
30 Aug 2013 175 MCM or 64%
Total capacity of 3 reservoirs = 272 MCM
Highest 2006 - 2012
2005
2004 50%
25%
75%
100%

WATER SITUATION: BANG PRA & NONG KHO
19 Source: The Royal Irrigation Department (RID).
Jan Feb Mar Apr May Jun Jul Aug Sep Oct Nov Dec
Tota
l Wat
er S
tora
ge (
MC
M)
Bang Pra and Nong Kho Reservoir
Lowest level: 13 MCM
Total capacity of 2 reservoirs = 138 MCM
Average 2004 - 2011
30 Aug 2013 175 MCM or 64%
Highest 2004 - 2012
2005
2004
50%
25%
75%
100%

WATER SITUATION: PRASAE
20 Source: The Royal Irrigation Department (RID).
Jan Feb Mar Apr May Jun Jul Aug Sep Oct Nov Dec
Tota
l Wat
er S
tora
ge (
MC
M)
Prasae Reservoir, Rayong
Lowest level: 20 MCM
Total capacity = 248 MCM
30 Aug 2013 133 MCM or 54 %
Average 2006 - 2012
Highest 2006 - 2012
2012 (Record low) 50%
25%
75%
100%
AGENDA
21
• BUSINESS OVERVIEW
• Q2’13 PERFORMANCE
• WATER SITUATION
• GROWTH DIRECTION

278 296 304 307 328
9.91 10.53
11.03 11.03 11.03
0.0
2.0
4.0
6.0
8.0
10.0
12.0
0
100
200
300
400
500
2012 2013F 2014F 2015F 2016F
Tariff (Bt./CUM) MCM
Raw water demand Price tariff
Raw Water
WATER DEMAND FORECAST
22
67 72 75 78 82
12.88 13.69 14.34 14.77 15.21
0.0
4.0
8.0
12.0
16.0
0
20
40
60
80
100
120
2012 2013F 2014F 2015F 2016F
Tariff (Bt./CUM) MCM
Tap water demand Price tariff
Tap Water
Source: Company estimates.

0
50
100
150
200
250
300
350
400
450
500
550
600
650
2536
2537
2538
2539
2540
2541
2542
2543
2544
2545
2546
2547
2548
2549
2550
2551
2552
2553
2554
2555
2556
2557
2558
2559
2560
2561
2562
2563
2564
2565
2566
Water level (MCM)
1993 2005 2013 2018 2023
Prasae Reservoir Project (40 MCM) - Completed
Bangpra System Project (18 MCM)
Other water sources e.g. Pond in Chonburi, New reservoir at Klang province
Phase 1 - Tabma Reservoir Project (32 MCM)
Prasae Reservoir Project– new system (70 MCM)
Phase 2 - Tabma Reservoir Project- extended (23 MCM)
Current capacity = 282 MCM /1
WATER DEMAND FORECAST
23 Source: Company estimates as of August 2013. Note: 1. Capiacity of Dok Krai, Nong Pla Lai, Nong Kho, private reserviors, and Bangpakong River.
Apply for additional water resources allocation – Klong Phra Ong (30 MCM)
Apply for additional water resources allocation – Nong Kho reservoir (7.2 MCM)
1
2
3
2
Water capacity /1
Water demand = Volume sold + Loss 3%
Water demand plus (reserve included)
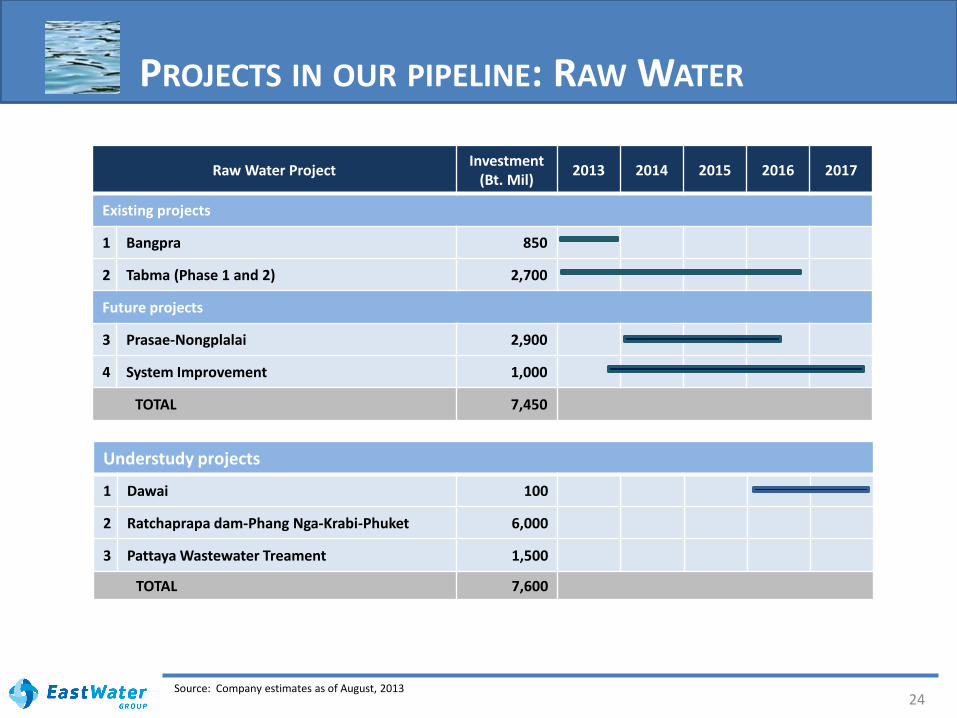
Raw Water Project Investment
(Bt. Mil) 2013 2014 2015 2016 2017
Existing projects
1 Bangpra 850
2 Tabma (Phase 1 and 2) 2,700
Future projects
3 Prasae-Nongplalai 2,900
4 System Improvement 1,000
TOTAL 7,450
PROJECTS IN OUR PIPELINE: RAW WATER
24 Source: Company estimates as of August, 2013
Understudy projects
1 Dawai 100
2 Ratchaprapa dam-Phang Nga-Krabi-Phuket 6,000
3 Pattaya Wastewater Treament 1,500
TOTAL 7,600

October 2013
2014
PROJECTS IN OUR PIPELINE: TAP WATER
25 Source: Company estimates as of August, 2013
Tap Water Project Investment
(Bt. Mil) 2013 2014 2015 2016 2017
Existing projects
1 System improvement 240
Future Project
Community/Local Consumption
2 Samed Tap RO water 150
3 Phuket tap water 210
Industrial
4 Phuket Airport 50
5 Suvarnabhumi Airport 300
6 Pinthong Industrial Estate (1-5 projects) 220
7 C.P. Industrial Estate 340
TOTAL 1,510
Under studied
1 Municipal Water (Huahin, Korat, Ratchaburi, Nakornsawan, Nakorn prathom)
1,000
TOTAL 1,000

OBJECTIVE
• To reduce water transmission from Rayong to Chonburi by building a new pumping station at Bangpra reservoir
Investment: Bt.850 mil
Incremental capacity: 18 MCM per year
Project duration: 24 months
Progress update: 77% (as of Aug, 2013)
Operating date: Q4’13
WATER PROJECT: BANGPRA PROJECT
26 Source: Company estimates as of August, 2013
1

WATER PROJECT: TABMA PROJECT
27
OBJECTIVE
To develop raw water reservoir to increase water supply by 55 MCM per year by pumping water from Rayong River and Tamba canal to be stored at the Tabma reservior
Investment: Bt.2,700 mil
Incremental capacity: Phase 1: 33 MCM per year
Phase 2: 22 MCM per year
Project duration: 60 months
Progress update: 40.3% (as of Aug, 2013)
Operating date: Phase 1: Q4’13
Phase 2: Q4’16
2
Tabma pond pumping station
Tabma Canal pumping station P
P
P
Source: Company estimates as of August, 2013

OBJECTIVE
• Additional 70 MCM/year water transmission from the current Prasae-Nongplalai
• Build a new pumping station at the Prasae reservoir and lay a 50 km pipeline to increase water supply and to handle the water shortage situation
Investment: Bt.2,900 mil
Incremental capacity: 70 MCM per year
Project duration: 24 months
Progress update: 0% (as of Aug, 2013)
Operating date: 2016
WATER PROJECT: PRASAE-NONGPLALAI PIPELINE
28
Nongplalai Reservoir
Klongyai Reservoir
Prasae Reservoir
P
3
Pump Station Head Tank
P
Existing Pipe Network of RID (31.45km)
Constructing Pipe Network (50 km)
Source: Company estimates as of August, 2013

UNDERSTUDY PROJECT: RATCHAPRAPA PROJECT
29
OBJECTIVE
To develop a new water pipeline network from the Ratchaprapa dam to supply water to Phang Nga, Krabi and Phuket in order to meet the higher water demand from increasingly high number of tourists.
Investment: Bt.12,100 mil
Incremental capacity: 115 MCM per year
Progress update: Under study
Surat Thani
Ratchaprapa Dam
Phang Nga
Krabi Phuket
Thap Put District
Takua Thung District
Thaland District
Ao Luek District
Source: Company estimates as of August, 2013
P
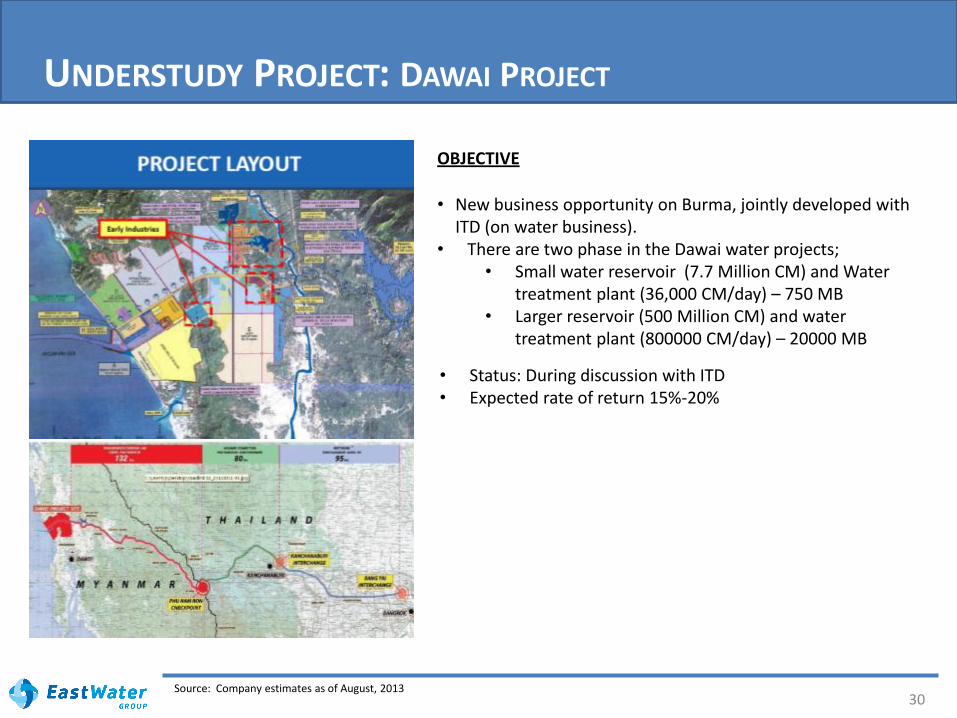
OBJECTIVE
• New business opportunity on Burma, jointly developed with
ITD (on water business). • There are two phase in the Dawai water projects;
• Small water reservoir (7.7 Million CM) and Water treatment plant (36,000 CM/day) – 750 MB
• Larger reservoir (500 Million CM) and water treatment plant (800000 CM/day) – 20000 MB
UNDERSTUDY PROJECT: DAWAI PROJECT
30 Source: Company estimates as of August, 2013
• Status: During discussion with ITD • Expected rate of return 15%-20%

UNDERSTUDY PROJECT: PATTAYA WASTEWATER
OBJECTIVE
To utilize wastewater of Pattaya Wastewater Treatment Plant
Investment: Bt.1,500 mil
Incremental capacity: 20 MCM per year
Progress update: Under study
Pipe Network
Source: Company estimates as of August, 2013
Power Plant
Power Plant

UNDERSTUDY PROJECT: SUVARNABHUMI TAP WATER
32
P
Pipe Network (700mm; 8 km)
Tap water production facilities (capacity: 20,000 MCM/day)
P Pumping station
Source: Company estimates as of August, 2013
Suvarnabhumi Airport
CWT 40,000 cu.m.
OBJECTIVE
To lay down a 8 km water pipeline network and develop a tap water production facility at the Suvarnabhumi Airport
Investment: Bt.300 mil
Incremental capacity: 7.30 MCM per year
Progress update: Under study

33
THANK YOU Eastern Water Resources Development and Management Public Company Limited
Floor 23-26, East Water Building, 1 Vibhavadi Rangsit Road, Jomphol, Chatuchak, Bangkok 10900
Tel: 02-272-1600 Fax: 02-272-1601
Website: www.eastwater.com
For further information & enquiries, please contact our investor relations at: Tel: 02-272-1600 Ext. 2587 Email: [email protected]
APPENDIX
34
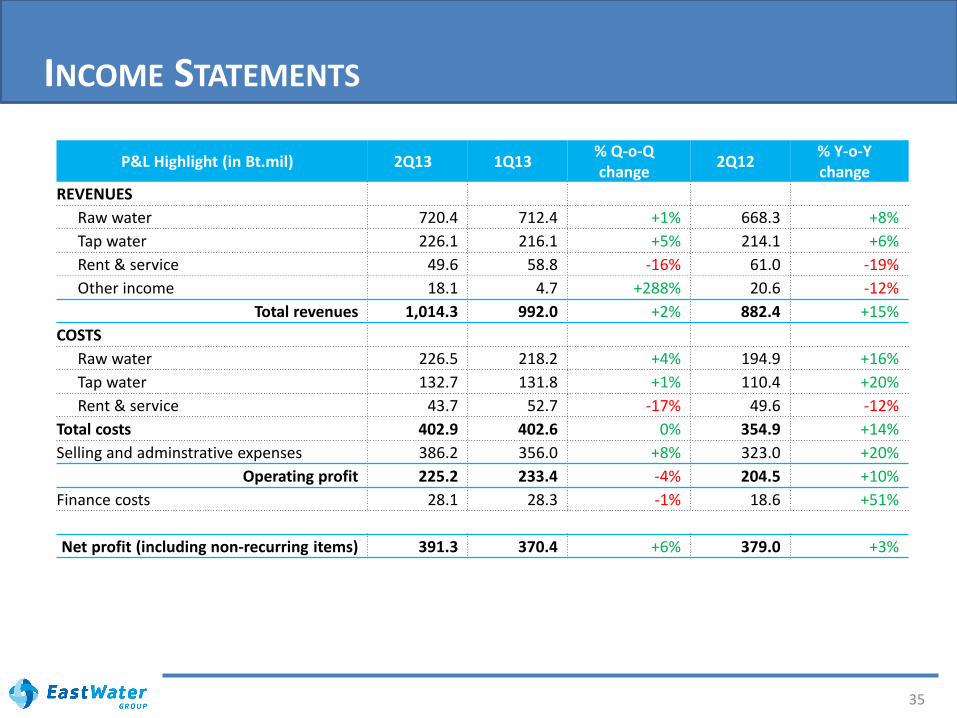
INCOME STATEMENTS
35
P&L Highlight (in Bt.mil) 2Q13 1Q13 % Q-o-Q change
2Q12 % Y-o-Y change
REVENUES
Raw water 720.4 712.4 +1% 668.3 +8%
Tap water 226.1 216.1 +5% 214.1 +6%
Rent & service 49.6 58.8 -16% 61.0 -19%
Other income 18.1 4.7 +288% 20.6 -12%
Total revenues 1,014.3 992.0 +2% 882.4 +15%
COSTS
Raw water 226.5 218.2 +4% 194.9 +16%
Tap water 132.7 131.8 +1% 110.4 +20%
Rent & service 43.7 52.7 -17% 49.6 -12%
Total costs 402.9 402.6 0% 354.9 +14%
Selling and adminstrative expenses 386.2 356.0 +8% 323.0 +20%
Operating profit 225.2 233.4 -4% 204.5 +10%
Finance costs 28.1 28.3 -1% 18.6 +51%
Net profit (including non-recurring items) 391.3 370.4 +6% 379.0 +3%
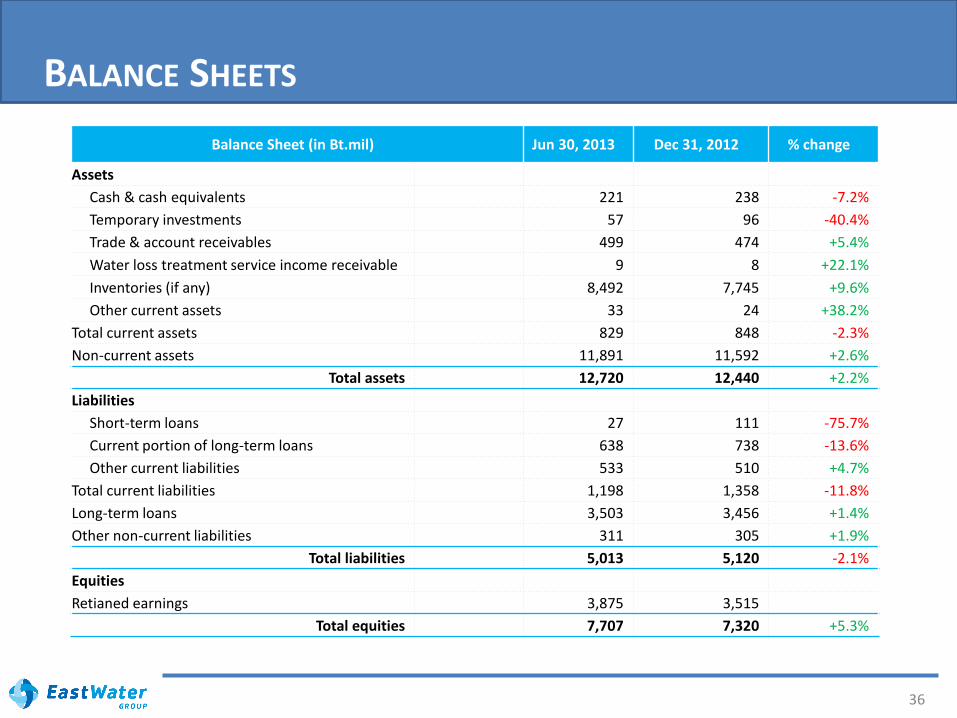
BALANCE SHEETS
36
Balance Sheet (in Bt.mil) Jun 30, 2013 Dec 31, 2012 % change
Assets
Cash & cash equivalents 221 238 -7.2%
Temporary investments 57 96 -40.4%
Trade & account receivables 499 474 +5.4%
Water loss treatment service income receivable 9 8 +22.1%
Inventories (if any) 8,492 7,745 +9.6%
Other current assets 33 24 +38.2%
Total current assets 829 848 -2.3%
Non-current assets 11,891 11,592 +2.6%
Total assets 12,720 12,440 +2.2%
Liabilities
Short-term loans 27 111 -75.7%
Current portion of long-term loans 638 738 -13.6%
Other current liabilities 533 510 +4.7%
Total current liabilities 1,198 1,358 -11.8%
Long-term loans 3,503 3,456 +1.4%
Other non-current liabilities 311 305 +1.9%
Total liabilities 5,013 5,120 -2.1%
Equities
Retianed earnings 3,875 3,515
Total equities 7,707 7,320 +5.3%
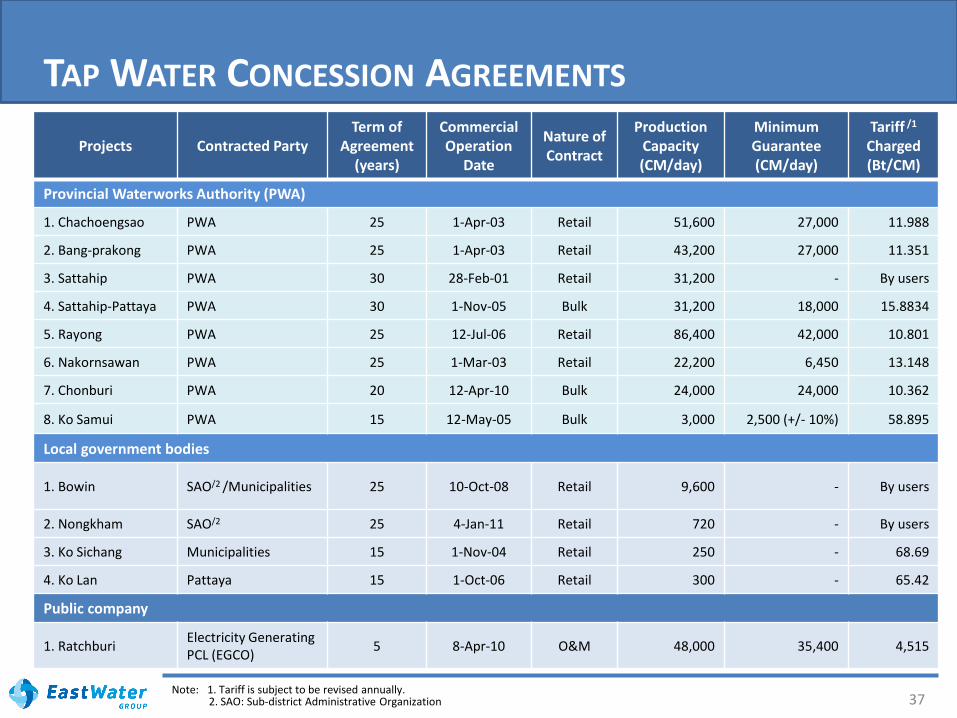
TAP WATER CONCESSION AGREEMENTS
37
Projects Contracted Party Term of
Agreement (years)
Commercial Operation
Date
Nature of Contract
Production Capacity (CM/day)
Minimum Guarantee (CM/day)
Tariff /1 Charged (Bt/CM)
Provincial Waterworks Authority (PWA)
1. Chachoengsao PWA 25 1-Apr-03 Retail 51,600 27,000 11.988
2. Bang-prakong PWA 25 1-Apr-03 Retail 43,200 27,000 11.351
3. Sattahip PWA 30 28-Feb-01 Retail 31,200 - By users
4. Sattahip-Pattaya PWA 30 1-Nov-05 Bulk 31,200 18,000 15.8834
5. Rayong PWA 25 12-Jul-06 Retail 86,400 42,000 10.801
6. Nakornsawan PWA 25 1-Mar-03 Retail 22,200 6,450 13.148
7. Chonburi PWA 20 12-Apr-10 Bulk 24,000 24,000 10.362
8. Ko Samui PWA 15 12-May-05 Bulk 3,000 2,500 (+/- 10%) 58.895
Local government bodies
1. Bowin SAO/2 /Municipalities 25 10-Oct-08 Retail 9,600 - By users
2. Nongkham SAO/2 25 4-Jan-11 Retail 720 - By users
3. Ko Sichang Municipalities 15 1-Nov-04 Retail 250 - 68.69
4. Ko Lan Pattaya 15 1-Oct-06 Retail 300 - 65.42
Public company
1. Ratchburi Electricity Generating PCL (EGCO)
5 8-Apr-10 O&M 48,000 35,400 4,515
Note: 1. Tariff is subject to be revised annually. 2. SAO: Sub-district Administrative Organization


