
2 2017-18 Capital Program overview
Features Non-financial Public Sector capital expenditure totals $10.171 billion for 2017-18, which
comprises $8.608 billion of purchases of non-financial assets (PNFA) and acquisitions of non-financial assets under finance leases, and $1.563 billion of capital grants expenses. This capital program supports around 29,000 jobs in 2017-18.
The level of capital expenditure over the forward estimates is forecast to total $42.750 billion including capital purchases and capital grants. With the government engaging in a range of Public Private Partnerships to deliver infrastructure, the value of acquisitions under finance leases is larger across the forward estimates than it has been historically.
The Cross River Rail Delivery Authority has been allocated $129 million in capital funding in 2017-18 as part of the Queensland Government’s $5.409 billion commitment to deliver Cross River Rail.
There will be capital expenditure of $3.885 billion for transport and roads in 2017-18, including $252.5 million to construct the Toowoomba Second Range Crossing, providing a bypass route to the north of Toowoomba at a total cost of $1.606 billion, in partnership with the Australian Government. $236.3 million will also be spent on widening the Gateway Motorway North to six lanes, south of Nudgee, at a total cost of $1.143 billion, in partnership with the Australian Government.
Capital purchases for the health portfolio are $916.1 million in 2017-18, including capital purchases of $47.6 million for essential upgrades to health facilities and supporting infrastructure in rural and regional areas across the state, $24 million as an initial investment to enhance public hospital capacity and services in south-east Queensland, and $8.7 million for adolescent mental health facilities.
The Queensland Government will make capital purchases of $536.6 million to construct and refurbish school educational facilities, early childhood education and care services, and training assets, including $28 million as part of the $500 million in total capital funding over five years to address enrolment growth pressures in state schools.
The energy and water sector will make capital purchases of $2.063 billion to deliver cost effective, safe, secure and reliable energy and water supply.
Capital purchases in the Public Non-financial Corporations sector, predominantly government-owned corporations, constitute 35.9 per cent of the total capital program.
The 2017-18 capital program is focused on ensuring a consistent flow of works to support jobs and the economy and reduce the risk of backlogs emerging. To ensure government assets continue to efficiently deliver key social services and support the development of the state, capital expenditure will focus on the needs of local communities and support local employment opportunities.
Capital Statement 2017-18 ____________________________________________________________________________________
____________________________________________________________________________________ 19

2.1 Capital purchases
The Queensland Government invests in capital assets to support the services it provides to the community and to improve the productivity of the Queensland economy.
Capital purchases by purpose in 2017-18 are shown in Chart 1 below. Transport continues to account for the largest share of purchases, followed by energy, health and community services, and education and training. Table 2 identifies the level of capital purchases by entity for the 2016-17 year (estimated actual) and the budget for 2017-18.
Non-financial Public Sector capital expenditure totals $10.171 billion for 2017-18, which comprises $8.608 billion of purchases of non-financial assets (PNFA) and acquisitions of non-financial assets under finance leases, and $1.563 billion of capital grants expenses. The capital program will support around 29,000 jobs in 2017-18.
Chart 1 Capital Purchases by Purpose 2017-18
Table 2 shows capital purchases in 2017-18 by State Government entity. Transport and Main Roads has the largest proportion of the total purchases.
Education and Training
7%
Energy Infrastructure
22%
Health, Housing and Community
Services16%
Law, Order and Public Safety
6%
Other Infrastructure
8%
Transport Infrastructure
41%
Capital Statement 2017-18 ____________________________________________________________________________________
____________________________________________________________________________________ 20

Table 2 Capital Purchases for 2017-18 by State Government Entity 1,2
Entity 2016-17
Est. Actual $'000
2017-18 Budget $'000
Aboriginal and Torres Strait Islander Partnerships 731 6,509
Agriculture and Fisheries 18,791 21,127
Communities, Child Safety and Disability Services 14,747 25,093
Education and Training 617,883 604,605
Electoral Commission of Queensland 2,779 6,385
Energy and Water Supply Energy Generation Sector 256,633 242,716
Energy Transmission and Distribution 1,326,653 1,608,747
Water Distribution and Supply 219,883 211,529
Environment and Heritage Protection 5,128 8,332
Fire and Emergency Services 5,042 6,200
Housing and Public Works 489,692 446,382
Infrastructure, Local Government and Planning Infrastructure, Local Government and Planning 102,759 118,964
Cross River Rail Delivery Authority .. 129,000
Justice and Attorney-General 85,696 227,206
Legislative Assembly of Queensland 6,538 7,664
National Parks, Sport and Racing 58,339 91,733
Natural Resources and Mines 12,453 17,685
Premier and Cabinet 26,189 31,148
Public Safety Business Agency3 173,678 244,027
Queensland Health 1,217,385 916,125
Queensland Police Service 18,411 23,705
Queensland Treasury 7,856 16,038
Science, Information Technology and Innovation 18,713 22,337
State Development 4,751 47,610
Tourism, Major Events, Small Business and the Commonwealth Games 11,567 935
Transport and Main Roads Transport and Main Roads 2,711,622 2,822,485
Queensland Rail 596,590 671,645
Port Authorities 123,645 153,508
State Infrastructure Fund4 .. 184,000
Other Agencies5 11,395 5,648
Other Adjustments6 (280,854) 38,522
Anticipated Capital Contingency Reserve7 (250,000) (350,000)
Total Capital Purchases 7,614,695 8,607,610
Capital Statement 2017-18 ____________________________________________________________________________________
____________________________________________________________________________________ 21

Total Capital Purchases Breakdown 2016-17
Est. Actual $'000
2017-18 Budget $'000
Consisting of: Purchases of non-financial assets per Non-financial Public Sector Cash Flow Statement (BP2 Table 9.9) 6,899,423 7,989,304
New finance leases 715,272 618,306
Total Capital Purchases 7,614,695 8,607,610
Notes 1. Includes all associated statutory bodies. 2. Numbers may not add due to rounding. 3.
The Public Safety Business Agency is a capital purchaser for Queensland Fire and Emergency Services, Queensland Police Service and the Office of the Inspector-General Emergency Management.
4. Represents funding for projects yet to be incorporated into individual departments’ forwards estimates. 5. Includes other Government entities with non-material capital programs. 6.
Representing Inter-agency eliminations, movements in capital payable and receivable and other accounting adjustments to align with Uniform Presentation Framework Statements.
7.
Contingency recognises that on a whole-of-Government basis, there is likely to be under spending, resulting in a carryover of capital allocations.
Capital Statement 2017-18 ____________________________________________________________________________________
____________________________________________________________________________________ 22

Table 3 shows capital purchases by statistical area and region. Around 63 per cent of total capital purchases will be spent outside of Greater Brisbane (Brisbane, Logan and Ipswich) in 2017-18.
Table 3 Capital Purchases by Statistical Area for 2017-18 1,2
Regional Action Plan Region Capital
Purchases$'000
Statistical Area Capital
Purchases $'000
Brisbane 2,145,713 301 Brisbane East 152,827
302 Brisbane North 513,092
303 Brisbane South 447,607
304 Brisbane West 159,387
305 Inner Brisbane 872,800
Ipswich 800,296 310 Ipswich 800,296
Wide Bay 536,944 319 Wide Bay 536,944
Darling Downs 841,721 307 Darling Downs Maranoa 601,116
317 Toowoomba 240,605
Gold Coast 773,079 309 Gold Coast 773,079
Logan 229,235 311 Logan Beaudesert 229,235
Mackay 387,561 312 Mackay 387,561
Outback Qld3 232,888 315 Outback 332,313
Far North Qld3 550,831 306 Cairns 451,406
Central Qld 623,913 308 Fitzroy 623,913
Sunshine Coast and Moreton Bay 899,213 316 Sunshine Coast 561,299
313 Moreton Bay North 185,776
314 Moreton Bay South 152,138
Townsville 586,216 318 Townsville 586,216
Total Capital Purchases 8,607,610
Notes
1. Numbers may not add due to rounding. 2. The anticipated Capital Contingency Reserve and other adjustments have been spread across statistical areas proportionate to capital spends. 3 $ 99,425,000 capital purchase in Outback statistical area belongs to the Far North Qld region.
Capital Statement 2017-18 ____________________________________________________________________________________
____________________________________________________________________________________ 23
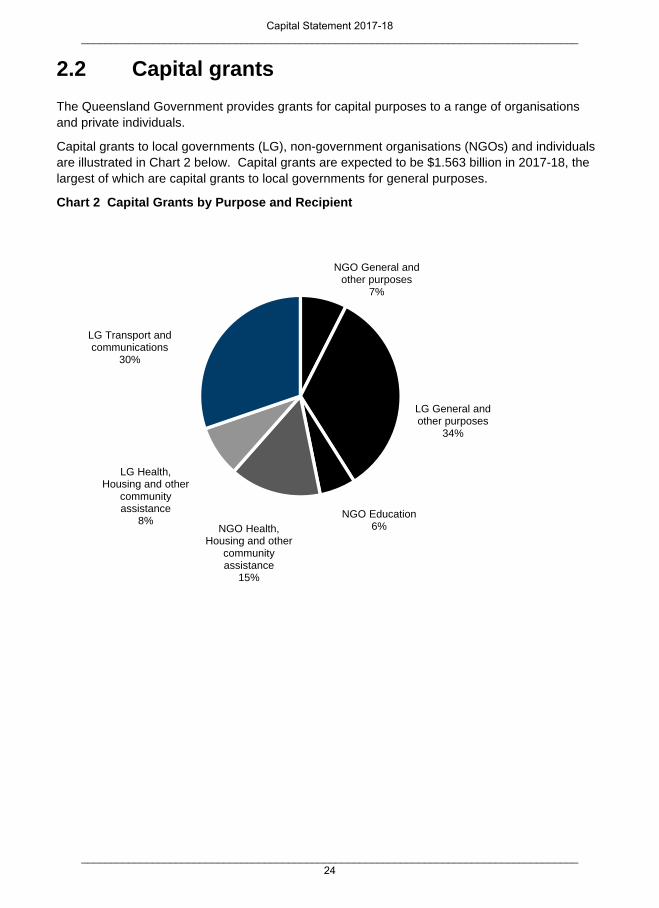
2.2 Capital grants
The Queensland Government provides grants for capital purposes to a range of organisations and private individuals.
Capital grants to local governments (LG), non-government organisations (NGOs) and individuals are illustrated in Chart 2 below. Capital grants are expected to be $1.563 billion in 2017-18, the largest of which are capital grants to local governments for general purposes.
Chart 2 Capital Grants by Purpose and Recipient
NGO General and other purposes
7%
LG General and other purposes
34%
NGO Education6%NGO Health,
Housing and other community assistance
15%
LG Health, Housing and other
community assistance
8%
LG Transport and communications
30%
Capital Statement 2017-18 ____________________________________________________________________________________
____________________________________________________________________________________ 24

Table 4 shows the planned expenditure on capital grants by State Government entity for 2017-18. The Queensland Reconstruction Authority has the highest level of capital grants.
Table 4 Expenditure on Capital Grants by State Government Entity for 2017-18 1,2
Entity 2016-17
Est. Actual $'000
2017-18 Budget $'000
Aboriginal and Torres Strait Islander Partnerships 16,304 9,317
Agriculture and Fisheries 244 1,342
Communities, Child Safety and Disability Services 7,604 4,183
Education and Training 92,675 92,675
Environment and Heritage Protection 400 ..
Fire and Emergency Services 897 897
Housing and Public Works 57,228 109,075
Infrastructure, Local Government and Planning Infrastructure, Local Government and Planning 267,946 296,560
Queensland Reconstruction Authority 247,460 317,933
National Parks, Sport and Racing 27,860 68,093
Premier and Cabinet 1,829 26,560
Queensland Treasury 150,952 147,601
Science, Information Technology and Innovation 4,260 2,451
State Development 59,559 139,851
Tourism, Major Events, Small Business and the Commonwealth Games 5,500 18,779
Transport and Main Roads Transport and Main Roads 237,427 237,427
Other Adjustments3 56,520 50,732
Anticipated Capital Contingency Reserve .. 40,000
Total Capital Grants 1,312,180 1,563,476
Notes 1. Includes associated statutory bodies. 2. Numbers may not add due to rounding. 3. Includes assets transferred and other technical accounting adjustments.
Capital Statement 2017-18 ____________________________________________________________________________________
____________________________________________________________________________________ 25

Table 5 shows expenditure on capital grants by statistical area. Far North Queensland has the highest level of capital grants.
Table 5 Capital Grants by Statistical Area for 2017-18 1,2
Regional Action Plan Region Grants$'000
Statistical Area Grants
$'000
Brisbane 183,542 301 Brisbane East 37,346
302 Brisbane North 29,852
303 Brisbane South 45,430
304 Brisbane West 24,782
305 Inner Brisbane 46,132
Ipswich 68,139 310 Ipswich 68,139
Wide Bay 112,029 319 Wide Bay 112,029
Darling Downs 76,164 307 Darling Downs Maranoa 45,751
317 Toowoomba 30,413
Gold Coast 101,788 309 Gold Coast 101,788
Logan 55,970 311 Logan Beaudesert 55,970
Mackay 131,846 312 Mackay 131,846
Outback Qld3 195,284 315 Outback 290,766
Far North Qld3 268,393 306 Cairns 172,911
Central Qld 164,189 308 Fitzroy 164,189
Sunshine Coast and Moreton Bay 103,188 316 Sunshine Coast 46,001
313 Moreton Bay North 31,154
314 Moreton Bay South 26,033
Townsville 102,944 318 Townsville 102,944
Total Capital Grants 1,563,476
Notes
1. Numbers may not add due to rounding. 2. The adjustments referred to in Table 4 have been spread across statistical areas proportionate to allocation of Grants. 3. $ 95,482,000 capital grants in Outback statistical area belongs to the Far North Qld region.
Chart 3 shows the distribution of the total 2017-18 capital program (capital purchases and capital grants) across the geographical regions of Queensland, as classified for Budget Paper 3 purposes.
Capital Statement 2017-18 ____________________________________________________________________________________
____________________________________________________________________________________ 26

Chart 3 Map of Queensland Regions
$649.0 million
capital program
$917.9 million capital program
$519.4 million capital
program
$689.2 million capital
program
$788.1 million
capital program
$819.2 million
capital program
Brisbane: $2.329 billion capital program
Ipswich: $868.4 million capital program
Logan: $285.2 million capital program
Gold Coast: $874.9 million capital program
Sunshine Coast and Moreton Bay: $1.002 billion capital program
Queensland$428.2 million capital program
$10.171 Billion Capital Program
Queensland
Central Queensland
and Moreton Bay
Capital Statement 2017-18 ____________________________________________________________________________________
____________________________________________________________________________________ 27

2.3 Changes to forecast delivery of 2016-17 Capital Program
The 2016-17 Budget capital program was $10.666 billion, made up of capital purchases of $8.264 billion, capital grants of $1.370 billion and finance leases of $1.032 billion. Following a number of revisions to the timing and form of capital spending, the estimated actual for the 2016-17 capital program is $8.927 billion, made up of capital purchases of $6.899 billion, capital grants of $1.312 billion and finance leases of $715 million.
Approximately $150 million of the 2016-17 Budget capital program was accounted for in the 2016-17 year as operating expenditure rather than capital expenditure. There was also lower than expected capital expenditure in Public Non-financial Corporations, leading to a lower level of capital purchases reported in this sector for 2016-17. Other capital expenditure has been re-profiled to future years, predominately driven by changes to project delivery in transport and health.
Capital Statement 2017-18 ____________________________________________________________________________________
____________________________________________________________________________________ 28


