
1
March 2018
Demerger of Hospitals Business of Fortis into Manipal
Significant Complementarity and Growth Benefits To All Stakeholders

2
Disclaimer
This presentation may not be copied, published, distributed or transmitted. The presentation has been prepared solely by the company.
Any reference in this presentation to “Fortis Healthcare Limited” shall mean, collectively, the Company and its subsidiaries. This presentation has been prepared for informational purposes only. This presentation does not constitute a prospectus, offering circular or offering memorandum and is not an offer or invitation to buy or sell any securities, nor shall part, or all, of this presentation form the basis of, or be relied on in connection with, any contract or investment decision in relation to any securities. Furthermore, this presentation is not and should not be construed as an offer or a solicitation of an offer to buy securities of the company for sale in the United States, India or any other jurisdiction.
Securities may not be offered or sold in the United States absent registration or an exemption from registration. Any public offering in the United States may be made only by means of an offering document that may be obtained from the Company and that will contain detailed information about the Company and its management, as well as financial statements. Any offer or sale of securities in a given jurisdiction is subject to the applicable laws of that jurisdiction.
This presentation contains forward-looking statements based on the currently held beliefs and assumptions of the management of the Company, which are expressed in good faith and, in their opinion, reasonable. Forward-looking statements involve known and unknown risks, uncertainties and other factors, which may cause the actual results, financial condition, performance, or achievements of the Company or industry results, to differ materially from the results, financial condition, performance or achievements expressed or implied by such forward-looking statements. Given these risks, uncertainties and other factors, recipients of this presentation are cautioned not to place undue reliance on these forward-looking statements.
The Company assumes no responsibility to publicly amend, modify or revise any forward-looking statements, on the basis of any subsequent development, information or events, or otherwise. Unless otherwise stated in this presentation, the information contained herein is based on management information and estimates. The information contained herein is subject to change without notice and past performance is not indicative of future results. The Company may alter, modify or otherwise change in any manner the content of this presentation, without obligation to notify any person of such revision or changes.
By attending this presentation you acknowledge that you will be solely responsible for your own assessment of the market and the market position of the Company and that you will conduct your own analysis and be solely responsible for forming your own view of the potential future performance of the business of the Company.
Neither the delivery of this presentation nor any further discussions of the Company with any of the recipients shall, under any circumstances, create any implication that there has been no change in the affairs of the Company since that date.

Transaction Overview and Structure

4
Fortis Healthcare – Hospitals Manipal Hospitals Combined Entity
Overview Leading Indian integrated healthcare
delivery service provider with 34 hospitals across India
South India’s foremost multi-specialty healthcare provider with 11 hospitals spread across India and Malaysia
Leading integrated healthcare delivery service provider with Pan India presence
Geographic Presence
India Presence: 31 hospitals in 15 cities across 10 states
International Presence: Mauritius, Uganda and Sri Lanka
India Presence: 10 hospitals in 7 cities across 6 states
International Presence: Malaysia (hospital) and Nigeria (clinic)
India Presence : 41 hospitals in 19 cities across 12 states
International Presence : 5 countries
Specialities(1)
Key Financials (TTM Dec’17)
Revenue: INR 3,727 cr
EBITDAC Margin: 13.5%
EBITDA Margin: 6.4%
Revenue: INR 1,503 cr
EBITDA Margin: 16.0%(2)
Revenue: INR 5,230 cr
EBITDA Margin(3): 14.2%
KPIs
Hospitals: 34(4)
Bed capacity: 4,685(4)
Doctors: 2,650+
Nurses: 6,500+
Total Employees: 15,850+
Hospitals: 11
Bed capacity: 2,973(5) (additional 3,400+ beds in teaching hospitals)
Doctors: 1,600+ (additional 1,300+ doctors in teaching hospitals)
Nurses: 2,800+
Total Employees: 8,850+
Hospitals: 45
Bed capacity: 7,658
Doctors: 4,200+
Nurses: 9,300+
Total Employees: 24,700+
14% 7%
4%
11%
14%
50%
Cardio Neuro Renal Ortho Onco Others
FHL Hospitals Business and Manipal – A Snapshot
Notes: (1) Revenue breakup for the nine month period ending 31st December 2017 excluding OPD; (2) Excludes one-off expense of INR 15 cr and loss from a operations of INR 27 cr from a newly commissioned hospital; (3) Includes c. INR 266 cr of BT costs eliminated on acquisition of RHT assets; (4) Includes 883 O&M beds across 8 hospitals (5 in India and 3 overseas); (5) Includes 850 installed capacity beds across 7 existing hospitals; (6) All financials throughout the presentation for Manipal Hospitals are unaudited management estimates
24%
8% 7%
11% 9%
42%
Cardio
Neuro
Renal
Ortho
Onco
Others
27%
8% 8%
11% 8%
39%
Cardio Neuro Renal Ortho Onco Others

5
Why Manipal Hospitals?
Manipal Hospitals is one of India’s foremost multi-specialty healthcare providers
Notes: (1) Historical revenue normalized for business reorganization and discontinued operations
Manipal Hospitals is one of India’s foremost multi-specialty healthcare providers
Witnessed Revenue CAGR of 20.5%(1) during FY12-FY17
Recently invested significantly in greenfield and brownfield bed capacity to support future growth
Pan India hospital service provider with strong presence in South India
Present across clinical specialties
Over 1,600+ doctors (and additional 1,300+ doctors in teaching hospitals)
Captive medical college with over 400 doctors graduating each year and a strong alumni base
Strong brand with 65+ years legacy
Backed by reputed promoter and global PE investors
Well-recognised for safe and ethical medical practices
Strong historical financial
performance with significant
headroom for growth
Well-recognised brand supported
by marquee shareholders
4th largest hospital chain
Strong doctor
connect

6
Transaction Overview
The Board of Directors of Fortis Healthcare Limited (“FHL”) at their meeting today:
Approved the demerger of hospitals business of FHL (“F-HBU”) into Manipal Hospitals
Approved the sale of 20.0% stake in SRL to Manipal Hospitals for INR 720 Crs
As part of the transaction, Dr. Ranjan Pai, promoter of Manipal Hospitals and TPG to invest c. INR 3,900 Crs into Manipal Hospitals to fund:
Acquisition of 50.9% stake in SRL (20.0% from FHL and 30.9% from other investors for which discussions are ongoing)
Acquisition of RHT assets
Key shareholders of the resultant entity will be Dr. Ranjan Pai and TPG Capital
The ongoing demerger scheme for SRL will be withdrawn in due course
Overview
Swap Ratio
Approvals
10.83 shares of Manipal Hospitals for every 100 shares of FHL; Manipal Hospitals shares to be listed
The key approvals required for the proposed transaction are:
Shareholder approval(1) of FHL and Manipal Hospitals
Securities and Exchange Board of India (SEBI); Stock Exchanges
Competition Commission of India (CCI)
National Company Law Tribunal (NCLT)
Target Completion Date
The process is expected to be completed in approximately twelve months (Q4FY19)
Note: (1) Company is voluntarily planning to obtain an upfront shareholder’s approval in addition to the approval at the NCLT convened shareholder’s meeting
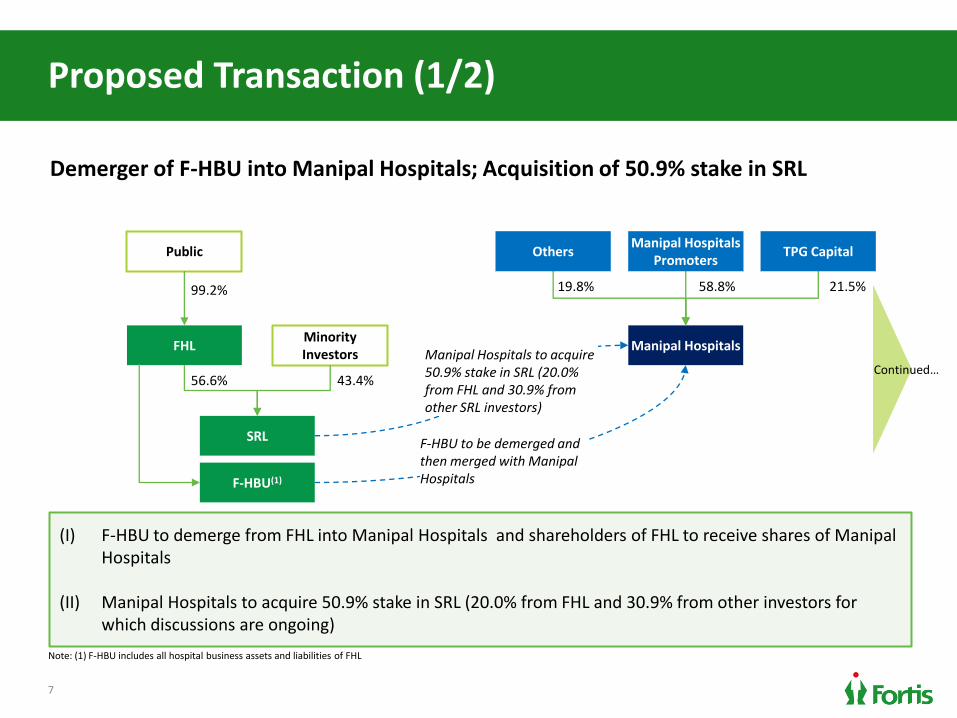
7
Proposed Transaction (1/2)
Demerger of F-HBU into Manipal Hospitals; Acquisition of 50.9% stake in SRL
(I) F-HBU to demerge from FHL into Manipal Hospitals and shareholders of FHL to receive shares of Manipal Hospitals
(II) Manipal Hospitals to acquire 50.9% stake in SRL (20.0% from FHL and 30.9% from other investors for which discussions are ongoing)
Note: (1) F-HBU includes all hospital business assets and liabilities of FHL
FHL Manipal Hospitals
56.6%
19.8% 21.5% 58.8%
Public Others Manipal Hospitals
Promoters TPG Capital
SRL
Minority Investors
43.4%
99.2%
Continued…
F-HBU(1)
F-HBU to be demerged and then merged with Manipal Hospitals
Manipal Hospitals to acquire 50.9% stake in SRL (20.0% from FHL and 30.9% from other SRL investors)

8
Proposed Transaction (2/2)
Resultant Structure:
FHL Manipal Hospitals
+ F-HBU
Resultant FHL Resultant Manipal Hospitals(1)
36.6%
41.4% 20.7% 37.9%
(I) Post the transaction, the shareholders of FHL will continue to hold shares in the resultant FHL (comprising
36.6% stake in SRL)
(II) Additionally, for every 100 share held in FHL, 10.83 shares of Resultant Manipal Hospitals (comprising the
entire hospitals business of FHL and Manipal Hospitals) will be issued
Public Public / Other
Investors Manipal Hospitals
Promoters TPG Capital
SRL
Minority Investors
50.9% RHT Assets
Listed Entity
Listed Entity
12.5%
99.2%
Note: (1) Adjusted for primary infusion of INR 3,900 cr in Manipal Hospitals by its Promoters and TPG Capital
100.0%

9
Key Transaction Rationale
Offers significant synergy potential 5
Promotes excellence in healthcare practices 4
Strengthens presence in core markets 3
Benefits from complementary geographic footprint 2
1 Creates the leading healthcare company in the country
Accelerates growth potential 6
Combination likely to create significant value for all stakeholders and will provide a strong promoter and shareholder base to FHL’s hospitals business and SRL

10
10.7%
3,978 3,655
2,815
1,998 1,634
1,163
Leading healthcare company in the country (1/3) Largest hospitals provider by Revenue and EBITDA
Hospital Business Revenue (9MFY18, INR Cr)
Hospital Business EBITDA (9MFY18, INR Cr)
1
Creation of a leading healthcare
platform with significant future growth potential
Best-in-class profitability
(1)
Source: Reported financials as per Company filings Note: (1) Apollo hospital business revenue and EBITDA calculated as (consolidated EBITDA – standalone pharmacy business EBITDA); (2) Fortis EBITDAC before business trust costs; (3) Excludes one-off expense of INR 15 cr and loss from a operations of INR 22 cr from a newly commissioned hospital
579 499
395
189 183 175
(1)
13.7% 14.0% 15.8% 9.5% 14.5%
(2)
(3)

11
49
45
34
24
14
11
3
3
48
14
Leading healthcare company in the country (2/3) 2nd largest by number of hospitals and operating beds
1
No. of Hospitals
No. of Installed Capacity Beds
Pan Indian presence with
meaningful scale in core markets
(1)
Source: Reported as per Company filings Note: (1) Excludes 11 day care centers and 11 Cradles; (2) Includes 883 O&M beds across 8 hospitals (5 in India and 3 overseas); (3) 20 owned / operated hospitals (with P&L responsibility) in India, 3 managed hospitals and 1 hospital in Cayman Islands; (4) Includes 850 capacity beds across 7 existing hospitals
9,417
7,658
6,527 4,685
2,973
2,413
3,413
3,413
11,071
6,386 (3)
(3)
(2)
(2)
(1) Complementary operational fit with enhanced
service offerings
Teaching hospitals
Teaching hospital beds
(4)

12
Leading healthcare company in the country (3/3) Best in class operating metrics
1
Note: (1) Combined entity operating metrics calculated as weighted average operating metrics of individual companies (weighted by no of operating beds); (2) 9M FY18 numbers calculated as average of Q1, Q2 and Q3 of FY18
ARPOB per year (INR Crs, 9MFY18) ALOS (# of days, 9MFY18)
Occupancy (%, 9MFY18)
3.1 3.3 3.4 3.5
4.0 4.2 1.6 1.5
1.4 1.2 1.2
0.8
73.5% 72.0% 69.1%
65.0% 62.9%
61.3%
(1) (1)
(1)
(2)
(2)
(2)
(2)
(2)
(2)

13
Benefits from complementary geographic footprint (1/2)
Pan India presence with strong hold in North India
Stronghold around Chennai and Hyderabad cluster
Stronghold around Karnataka and Eastern region
North India presence Stronghold in South India
Pan India presence with 41 hospitals and c.7,000(2) beds
2
Strong presence(1)
Moderate presence
Notes: (1) Estimate based on number of operating beds in respective regions as disclosed in in company filings; (2) Includes c. 1,600 installed capacity beds completed or nearing completion

14
Benefits from complementary geographic footprint (2/2)
Well diversified pan-India presence with leading position in most markets
Jaipur (202, 271)
Delhi (380, 804)
Vijaywada (300, 0)
KMC Mangalore (410, 0)
Goa (230, 0)
Bangalore (1092, 543) Salem (139, 0)
Faridabad (0, 210)
Amritsar (0, 166)
Mohali (0, 349)
Mumbai (0, 640)
Kolkata (0, 260)
Noida (0, 191)
Gurgaon (0, 290)
Ludhiana (0, 215)
Chennai (0, 151)
Manipal Fortis Manipal & Fortis
Mauritius(1) (0, 314)
Malaysia (220, 0)
Legend: City (# Capacity beds of Manipal, # Capacity beds of Fortis)
2
NCR
Dehradun (0,50)
Raigarh (0, 70)
Notes: (1) O&M beds
Uganda(1) (0,100)
Udaipur (0, 62)

15
Strengthens presence in core markets - Bangalore 3
Notes: (1) Numbers in brackets represent number of capacity beds
Manipal Fortis
BG Road (255)
Richmond Road (67)
Nagarbhavi (45)
Rajajinagar (52)
Cunningham Road (124)
Northside Hospital (79)
Malathi Hospital (79)
Whitefield(284)
Old Airport Road (650)
Post the combination,
combined entity will have 9
hospitals with 1,600+ beds
Strategically located facilities
with best-in-class complementary service offerings

16
Strengthens presence in core markets - NCR
Fortis Vasant Kunj (160) Fortis Escorts Heart Institute (294)
FMRI (290)
Shalimar Bagh (261)
Noida (191) C-DOC (23)
La Femme, GK II (38)
Ashlok Hospital (28)
Faridabad(210)
Dwarka (380)
3
Manipal Fortis
The combined entity will have 10
hospitals with c.1,900 beds in
National Capital Region (“NCR”)
Committed to treat patients with
best-in-class service offerings
Notes: (1) Numbers in brackets represent number of capacity beds

17
Promotes excellence in healthcare practices (1/3) Combined entity to have stronger presence across clinical specializations
4
Speciality Fortis Manipal Merge Co
Cardiac
Orthopaedics
Nephrology / Urology
Oncology
Transplants
Strong Moderate Weak
Women & Child
Critical Care

18
Promotes excellence in healthcare practices (2/3) Cutting edge medical technology and practices
4
4 Da Vinci Robot
8 LINAC
32 Cath Labs
17 MRI
21 CT Scanners
6 PET CTs
Brain Lab and Elekta
CT-based Brain Suite
Digital MRI
Bi-plane Cardiac Cath Lab
3 Da Vinci Robot
6 LINAC
11 Cath Labs
16 MRI
25 CT Scanners
2 PET CTs
Cath Lab
Da vinci X Surgical Robotic Arm Philip FD 20 Cath Lab + 3D EP
EPIQ 7 C ECHO Cardiogrpahhy
Manipal Fortis

19
Promotes excellence in healthcare practices (3/3) Awards and Accreditations
4
Manipal Fortis Hospital Business
19 NABH accredited Hospitals
4 JCI hospitals
10 NABH accredited Blood Bank
22 NABH Nursing Excellence
9 hospitals
8 hospitals
2 NABH Nursing Excellence
2 NABH accredited Blood Bank
5 Labs
2 AAHRPP(1)
Note: (1) Association for the Accreditation of Human Research Protection Program

20
Offers significant synergy potential Areas of synergies
Pan India presence
Stronger brand equity
Scale benefits
Revenue Synergies
Reduction in pharma, consumables and other expenses
Scale to drive cost efficiency in capex related purchases
Sharing of high end medical infrastructure in core markets
Capex Synergies
5
Doctor retention
Patient flow
Leverage with credit customers
200-300bps higher revenue growth
potential
Opportunity for 150-250bps EBITDA margin
expansion Potential rationalization of general and administrative
expenses
Shared services and infrastructure
Supply Chain Synergies
SG&A / Shared Services
Synergies

21
Significant capex incurred to build a strong pipeline of 1,500+ bed capacity
Accelerates growth potential Significant recent investment to fuel near term growth
6
Greenfield Hospitals Brownfield Hospitals
Fortis Manipal
Ludhiana – 2 64
Dwarka 380
White field 284
BG Road 214
Noida 30
Malaysia 150
KMC, Mangalore 160
# No. of beds
Fortis Manipal
Arcot Road 195

22
Integration plan to enable smooth transition
Companies to put together an ‘empowered’ integration team (after receiving requisite approvals) to preempt potential integration challenges
Patients Processes
People and Culture
A
B C
Aligning company leadership
Engage employees through regular internal communication on demerger progress
Objective / transparent assessment processes for role fitment
Adapt both cultures and adopt best practices
Standardize and optimize processes and procedures across functions (legal, tax, IT, patient care, medical excellence etc.)
Share and implement best operational expertise
Integration of supply chain (sourcing vendors, service providers etc.)
Effective communication with patients on demerger to ensure appropriate positioning of the combined entity
23
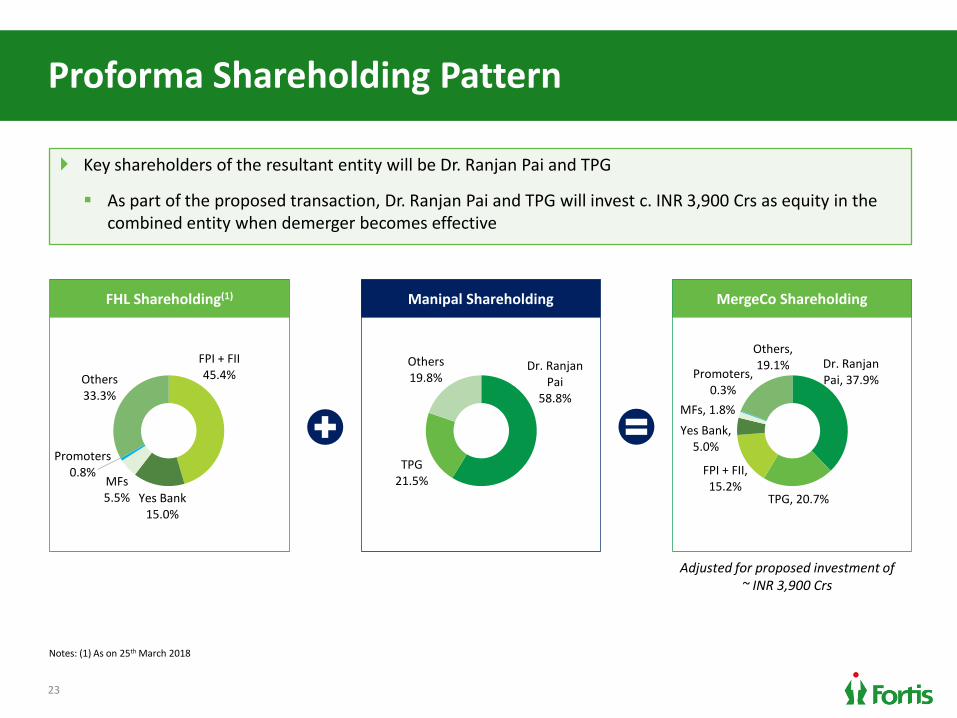
Proforma Shareholding Pattern
Key shareholders of the resultant entity will be Dr. Ranjan Pai and TPG
As part of the proposed transaction, Dr. Ranjan Pai and TPG will invest c. INR 3,900 Crs as equity in the combined entity when demerger becomes effective
FHL Shareholding(1) MergeCo Shareholding Manipal Shareholding
FPI + FII 45.4%
Yes Bank 15.0%
MFs 5.5%
Promoters 0.8%
Others 33.3%
Adjusted for proposed investment of ~ INR 3,900 Crs
Dr. Ranjan Pai
58.8%
TPG 21.5%
Others 19.8%
Dr. Ranjan Pai, 37.9%
TPG, 20.7%
FPI + FII, 15.2%
Yes Bank, 5.0%
MFs, 1.8%
Promoters, 0.3%
Others, 19.1%
Notes: (1) As on 25th March 2018
24
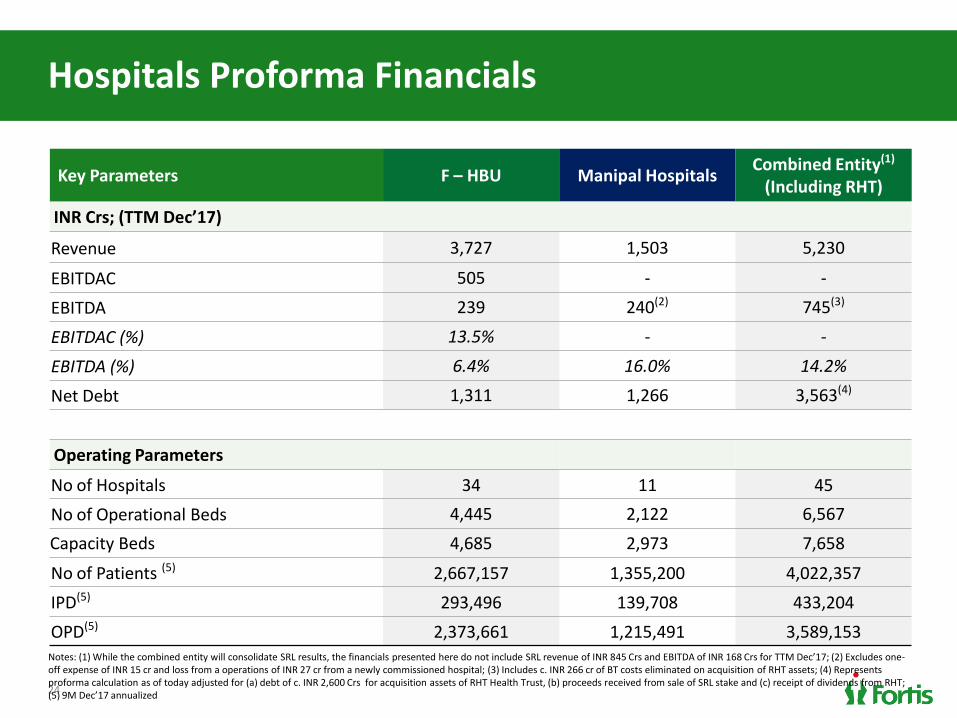
Hospitals Proforma Financials
Key Parameters F – HBU Manipal Hospitals Combined Entity(1)
(Including RHT)
INR Crs; (TTM Dec’17)
Revenue 3,727 1,503 5,230
EBITDAC 505 - -
EBITDA 239 240(2) 745(3)
EBITDAC (%) 13.5% - -
EBITDA (%) 6.4% 16.0% 14.2%
Net Debt 1,311 1,266 3,563(4)
Operating Parameters
No of Hospitals 34 11 45
No of Operational Beds 4,445 2,122 6,567
Capacity Beds 4,685 2,973 7,658
No of Patients (5) 2,667,157 1,355,200 4,022,357
IPD(5) 293,496 139,708 433,204
OPD(5) 2,373,661 1,215,491 3,589,153 Notes: (1) While the combined entity will consolidate SRL results, the financials presented here do not include SRL revenue of INR 845 Crs and EBITDA of INR 168 Crs for TTM Dec’17; (2) Excludes one-off expense of INR 15 cr and loss from a operations of INR 27 cr from a newly commissioned hospital; (3) Includes c. INR 266 cr of BT costs eliminated on acquisition of RHT assets; (4) Represents proforma calculation as of today adjusted for (a) debt of c. INR 2,600 Crs for acquisition assets of RHT Health Trust, (b) proceeds received from sale of SRL stake and (c) receipt of dividends from RHT; (5) 9M Dec’17 annualized

Transaction Process

26
Transaction Process
Estimated Completion ~ Q4 FY19
Obtaining in-principle approval for the proposed scheme from shareholders (*)
CCI Filing and filing for approval from Stock Exchanges and SEBI
Receipt of CCI and SEBI and stock exchanges approval
Filing of Scheme with NCLT
NCLT convened shareholder and creditor meet
Receipt of scheme approval by NCLT
Listing approval from Stock Exchanges
De
me
rge
r P
roce
ss
RH
T P
roce
ss
Estimated Completion ~ Q2 FY19
Receipt of Unitholders Approval
Completion of RHT acquisition
Receipt of SGX Approval
* Upfront shareholder approval being taken voluntarily and is not required by law

27
Advisors to the Transaction
Fortis Healthcare Manipal – TPG
Fairness Opinion Karvy Investor Services Limited NA
Valuation Expert Walker Chandiok & Co LLP Walker Chandiok & Co LLP
Financial Advisors Standard Chartered Bank Allegro Capital, Goldman Sachs, Kotak Investment Banking
Legal Advisor Cyril Amarchand Mangaldas AZB Partners

28
Summary Takeaways
Creates the leading healthcare company in
the country
Offers significant complementarity and
growth potential
Cements leadership position in core
markets
Brings together two strong cultures and
employee best practices
Marquee shareholders for hospitals and
diagnostics businesses
Provides capital for funding RHT acquisition
Appendix

30
Fortis Hospitals – Key hospitals 9MFY18
No of Operational Beds 294
Revenue (INR Cr) 289
ARPOB (INR Cr) 1.62
Occupancy 83%
Fortis Escorts Heart Institute, Delhi Fortis Hospital, BG Road, Bengaluru
No of Operational Beds 255
Revenue (INR Cr) 222
ARPOB (INR Cr) 1.56
Occupancy 75%
Fortis Mulund, Mumbai FMRI, Gurugram
Fortis Noida Fortis Mohali
No of Operational Beds 292
Revenue (INR Cr) 230
ARPOB (INR Cr) 1.57
Occupancy 68%
No of Operational Beds 290
Revenue (INR Cr) 392
ARPOB (INR Cr) 2.81
Occupancy 66%
No of Operational Beds 191
Revenue (INR Cr) 207
ARPOB (INR Cr) 1.84
Occupancy 82%
No of Operational Beds 349
Revenue (INR Cr) 319
ARPOB (INR Cr) 1.65
Occupancy 75%

31
Manipal Hospitals - Key hospitals 9M FY18
No of Capacity Beds 650
No of Operational Beds 614
Revenue (INR Cr) 547
ARPOB (INR Cr) 1.6
Occupancy 73%
Old Airport Rd, BLR Vijaywada
No of Capacity Beds 300
No of Operational Beds 241
Revenue (INR Cr) 74
ARPOB (INR Cr) 0.6
Occupancy 69%
KMC, Mangalore Jaipur
Klang, Malaysia Goa
No of Capacity Beds 410
No of Operational Beds 324
Revenue (INR Cr) 139
ARPOB (INR Cr) 0.8
Occupancy 68%
No of Capacity Beds 202
No of Operational Beds 202
Revenue (INR Cr) 59
ARPOB (INR Cr) 0.8
Occupancy 46%
No of Capacity Beds 220
No of Operational Beds 127
Revenue (INR Cr) 98
ARPOB (INR Cr) 1.8
Occupancy 55%
No of Capacity Beds 230
No of Operational Beds 121
Revenue (INR Cr) 51
ARPOB (INR Cr) 1.0
Occupancy 56%
32
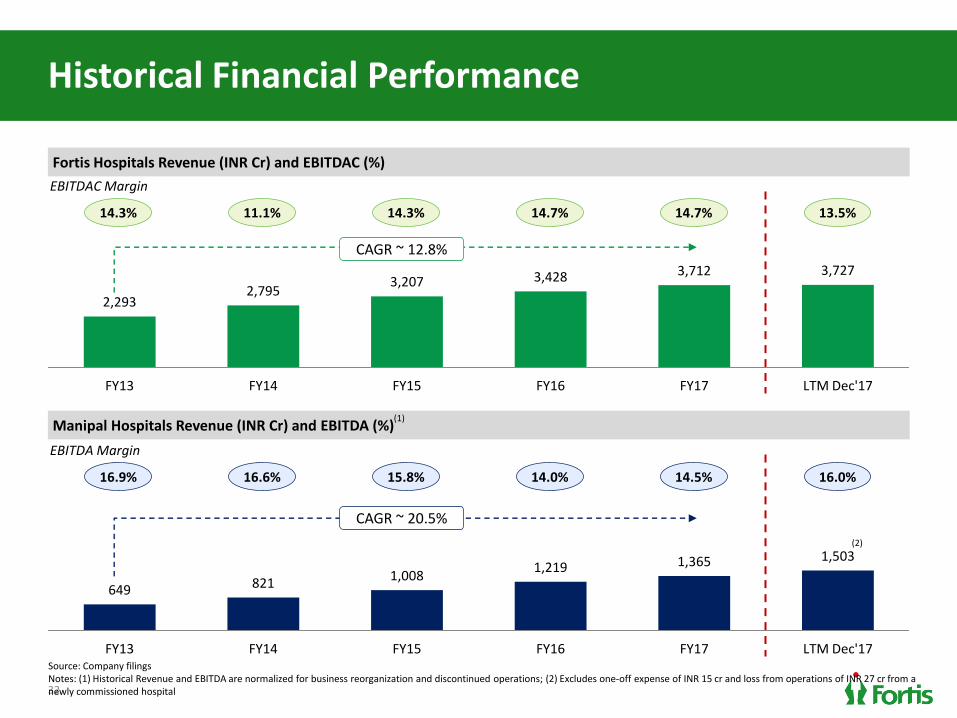
Historical Financial Performance
Manipal Hospitals Revenue (INR Cr) and EBITDA (%)
2,293 2,795
3,207 3,428 3,712 3,727
FY13 FY14 FY15 FY16 FY17 LTM Dec'17
Fortis Hospitals Revenue (INR Cr) and EBITDAC (%)
14.3% 11.1% 14.3% 14.7% 14.7% 13.5%
EBITDAC Margin
649 821 1,008
1,219 1,365 1,503
FY13 FY14 FY15 FY16 FY17 LTM Dec'17
16.9% 16.6% 15.8% 14.0% 14.5% 16.0%
EBITDA Margin
CAGR ~ 20.5%
CAGR ~ 12.8%
Source: Company filings Notes: (1) Historical Revenue and EBITDA are normalized for business reorganization and discontinued operations; (2) Excludes one-off expense of INR 15 cr and loss from operations of INR 27 cr from a newly commissioned hospital
(2)
(1)
Thank You
March 2018
Fortis Healthcare Limited


